
Abstract
In 2002/2003, the Queensland Government released a decision that Alcohol Management Plans (AMPs) were to be introduced to most Indigenous communities in Cape York, Australia, in an effort to address violence generally and specifically violence against women and children. By 2008, increased restrictions brought total prohibition in some communities and tightened restrictions in others. This project provides a pre-/postprohibition comparison and analysis of injuries, injuries that involved alcohol and verified police reported assaults. Supporting this are rich community survey data which together aim to elicit the effect restricting alcohol had on violent activity in the communities, particularly for women.
Introduction
Interpersonal violence has reached epidemic proportions in Australia with recent data indicating that one in three Australian women have experienced physical violence since the age of 15 years (Australian Bureau of Statistics, 2013). Considered the leading preventable cause of injury and death in women below 45 years, more than one woman a week is murdered in Australia by her current or former partner (Australian Bureau of Statistics, 2013; Australian Institute of Criminology, 2015; Chan & Payne, 2013; Devries et al., 2011). Women aged 18-24 years are twice as likely to experience physical or sexual assault when compared with all Australian women (Australian Bureau of Statistics, 2013; Chan & Payne, 2013). Although reporting of violent assault activities appears to have increased (Australian Bureau of Statistics, 1996, 2006), more than half of the women (58%) who experience an assault do not report it to the police and nearly a quarter (24%) had never sought advice or help postassault (Australian Bureau of Statistics, 2013).
For Australian Aboriginal and Torres Strait Islander (Indigenous) peoples, Australia’s National Research Organization for Women’s Safety (ANROWS) highlights the statistical overrepresentation of Indigenous people who experience interpersonal violence, particularly women (Day, Francisco, & Jones, 2013). Australian Indigenous women are 2-5 times more likely to experience domestic violence when compared with non-Indigenous women (NSW Government, 2011; Willis, 2011), are 35 times more likely to be hospitalized due to family-related assaults (Australian Government, 2014; Steering Committee for the Review of Government Service Provision, 2011), and are 5 times more likely to be victims of domestic homicide due to intimate partner violence (Chan & Payne, 2013).
For women living in rural and remote communities in Australia, a growing body of evidence suggests they are more likely to experience interpersonal violence than women in urban areas (Campo & Tayton, 2015). For Indigenous women living in these regions, the risk of experiencing family violence is even greater when compared with their non-Indigenous counterparts (Campo & Tayton, 2015; Owen & Carrington, 2014). Credible evidence of current domestic violence levels experienced by Indigenous women living in these communities is, therefore, of great importance for informing domestic violence–oriented policies and practice.
Unfortunately, high rates of injury and domestic violence experienced by remote Indigenous women is not a new issue. Alcohol-related violence, injury, and death were documented concerns in the 1990s, particularly in the Cape York region within far north Queensland (Fitzgerald, 2001; Gladman, Hunter, McDermott, Merritt, & Tulip, 1997). As a means of reducing the violence, Alcohol Management Plans (AMPs) were introduced to most Indigenous communities in Cape York in 2002/2003. An explicit objective was to address violence against women and children (Queensland & Government, 2002b, 2005). The initial focus of the AMPs was supply reduction, achieved by limiting the quantity and strength of alcoholic beverages through “carriage limits” (Clough & Bird, 2015). By 2008, a second round of restrictions was implemented which brought total prohibition in some communities and tightened restrictions—but with some alcohol remaining available—in others (Queensland Government, 2009). To the authors’ knowledge, no systematic studies of interpersonal violence against Indigenous women living in these circumstances in remote Cape York communities have been conducted.
The limited available evidence regarding the success of AMPs in Cape York points to favorable outcomes achieved with alcohol restrictions, as indicated by a reduction in aeromedical retrievals for serious injury from some communities (Margolis, Ypinazar, & Muller, 2008; Margolis, Ypinazar, Muller, & Clough, 2011). What is not known is whether assaults against women were also reduced and whether there was a corresponding reduction in other types of injuries where an emergency evacuation to a tertiary hospital was not required. This article compares rates of injury and violence experienced by women before and after the 2008 round of increased restrictions. The study compares data collected in one community where all alcohol is prohibited with data from a second community where, although more tightly restricted, some access to alcohol was permitted after 2008. The article specifically examines the numbers and types of assault injuries suffered by women during the period January 2006 to December 2011 and the role of alcohol in these injuries. This period was chosen as it encompasses the point where alcohol became tightly restricted, that is, during the latter parts of 2008. We hypothesize the following:
Compared with the period before 2008, a reduction in violence against women occurred during the period after 2008 as a result of an increase in restrictions to the AMPs and specifically that there was a greater reduction in violence against women in the community that entered prohibition compared with the community that did not, a decrease in assault injury presentations especially those linked with alcohol, a decrease in female victims of a police charge of “violence against the person,” and a perceived reduction in violence against women reported by community members.
Method
Background
This study forms part of two large ongoing evaluation studies of the impacts and effectiveness of AMPs in Queensland. Full study protocols for both projects are available (Clough et al., 2014; West, Usher, & Clough, 2014). The complex history and the policy and regulatory infrastructure surrounding AMPs have also been described in detail elsewhere (Clough & Bird, 2015). The two communities chosen for this study are typical of those in Cape York where in some communities all alcohol is prohibited whereas in others there is limited access to alcohol (Clough & Bird, 2015).
Both communities are officially classified as “very remote” according to Australia’s remoteness indicators (Australian Bureau of Statistics, 2011a) and experience similarly low sociodemographic ranking on the Socio-Economic Indexes for Areas (SEIFA; Community A: 618.9, Community B: 658.4), which reflects disadvantages such as low income, low educational attainment, high unemployment, and jobs in relatively unskilled occupations (Australian Bureau of Statistics, 2016).
Indigenous Australians comprise the majority (93%) of the communities’ populations (Australian Bureau of Statistics, 2011b). Both communities have similar access to Government and non-Government services and enterprises: a primary health care center, police, justice and welfare services, school (up to junior high school), community store, arts and craft centers, church, and missionary groups. Periods of isolation are common due to monsoonal activity, with roads often closed during the tropical wet season from December to April each year. The nearest significant population centers to these communities are approximately 650 km (404 miles) away and access is mainly on unsealed roads.
The study communities presented a “natural experiment” to test the impacts of levels of alcohol restrictions. The communities are isolated from each other on either side of Cape York and are among the most isolated communities in the region. Meaningful comparisons, therefore, may be drawn as the effects of the AMPs in each community should theoretically be uncontaminated.
Setting
The timing and nature of alcohol restrictions in each community are summarized in Table 1.
Timeline of Implementation of Alcohol Restrictions in Two Cape York Indigenous Communities.
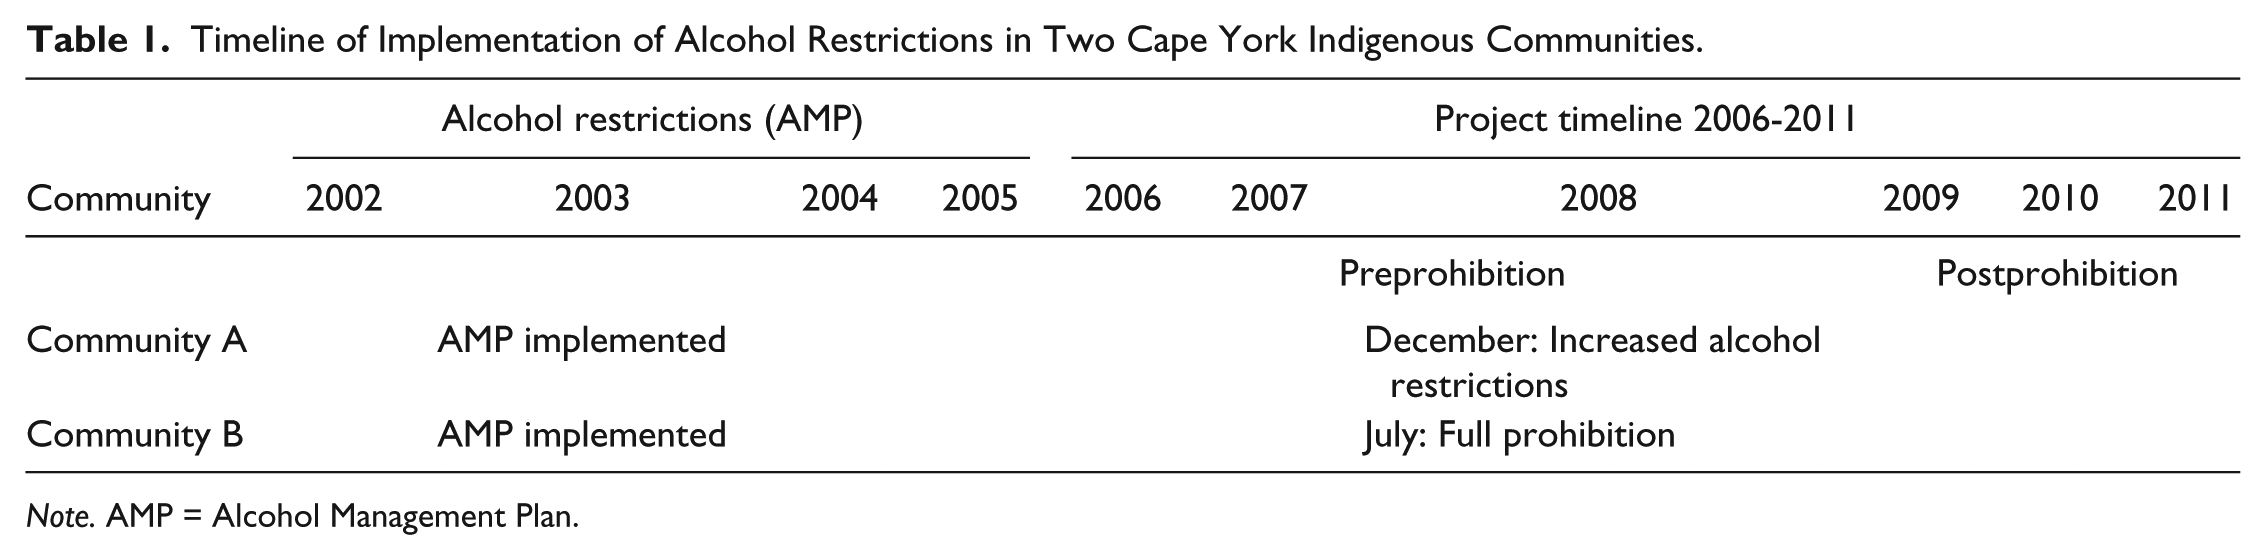
Note. AMP = Alcohol Management Plan.
Community A has a population of approximately 700, of which 66% are aged 18 years and over (Australian Bureau of Statistics, 2011b). This community’s current alcohol restrictions were implemented in December 2008. There is one licensed premises which has been operating (from 2008) under a restricted liquor permit allowing alcohol to be purchased and consumed on the premises. Current licensing conditions permit a maximum of six Australian standard drinks in the form of midstrength beer or premixed drinks/person/day with no takeaway alcohol available. The possession and consumption of all alcohol (including homebrew and homebrew equipment) is otherwise prohibited in Community A, including in all public and private places and all foreshores to the low water mark (Queensland Government, 2008a). The closest liquor outlet outside this community is approximately 320 km (198 miles) on unsealed and unguttered road. Prior to 2008, the community area was declared a restricted area in 2003, with the prescribed quantity of alcohol permitted to be possessed within the restricted area limited to 9.0 liters of beer under or equal to 4% concentration and 4.5 liters for all other beer. Quantities of spirits, wine and fortified wines permitted were zero, with the exception of wine used for sacramental purposes by religious entities with a prescribed quantity of 4.0 liters (Queensland Government, 2002a). The purchase of alcohol was only permitted from the “canteen” which operated 5 days a week, Monday-Friday, from 5:00 p.m. to 9:00 p.m. with beer in any quantity permitted but with all spirits and wine prohibited (Queensland Government, 2003). Prior to 2003, there were few effective restrictions.
Of the people in Community A, 49.8% are women, the median age is 32 years, and 16.8% of the community are married. The average people per household is 3.9, and the median weekly household income is approximately AUD$968. Just under half (43.3%) of the community are employed full-time. The majority are laborers (23.5%) or community and personal service workers (17.2%). More than half (54.6%) the homes do not have a registered motor vehicle.
Community B entered total prohibition in July 2008. For the purpose of reporting here, the year 2008 for this community was considered to be a transition year (half with/half without complete prohibition). Community B has a population of approximately 600 people, of which 56% are aged 18 years and over (Australian Bureau of Statistics, 2011b). The possession and consumption of all alcohol or home-brewed products remain prohibited; alcohol is not to be sold, brought into the community, or consumed within the community or surrounding areas (Queensland Government, 2008b). The closest liquor outlet to this community is approximately 200 km (124 miles) by road. Previously, from 2003 to July 2008, restrictions included zero possession and consumption of all alcohol (including homebrew and homebrew equipment) in all public and private places with the exception of the community “canteen.” Within the “canteen,” beer was unlimited, but no wine or spirits were permitted (Queensland Government, 2003). In Community B, prior to 2003 there were few effective restrictions on alcohol.
Of the people in Community B, 13.7% are married, 50.7% are women, and the median age is 25 years. The average people per household is 4.5, and the median weekly household income is approximately AUD$1,133. The majority of people in the community work full-time (71%), with a quarter of the workforce employed as community and personal service workers. Almost half (46.4%) the homes do not have a registered motor vehicle.
Data Collection
The article draws on three sources of data collected for two evaluation projects (Clough et al., 2014; West et al., 2014):
West et al. (2014) are focusing on alcohol-related injuries in four discrete Indigenous communities and the long-term impact of these injuries (West et al., 2014). A full clinical file audit was performed in both communities.
The Clough et al. (2014) evaluation study uses de-identified epidemiological data on a range of health and social indicators including records of victims of person–person violence dealt with by Queensland Police. For the purpose of this article, assault and grievous bodily harm data from the Queensland Police Service (QPS) were used, namely, victim-specific information linked with criminal offenses against the person.
The Clough et al. (2014) evaluation includes data from surveys conducted with Indigenous community residents designed to explore the perceived impacts on alcohol supply and consumption, injury, violence, and community health (Clough et al., 2014).
Clinical file audit
Following the recommendations of an earlier injury study by Gladman et al. (1997), a clinical file audit was performed in each community. All available medical files (N = 6,076; Community A: n = 3,048; Community B: n = 3,028) were searched for the following: any injury to a person seeking treatment at the primary health center, age, sex, date of injury, type of injury, alcohol involvement, and outcome of any injury presenting to the clinic in the time period January 1, 2006 to December 31, 2011. The methods used for extracting these data from clinic files have been described in detail elsewhere (West et al., 2014).
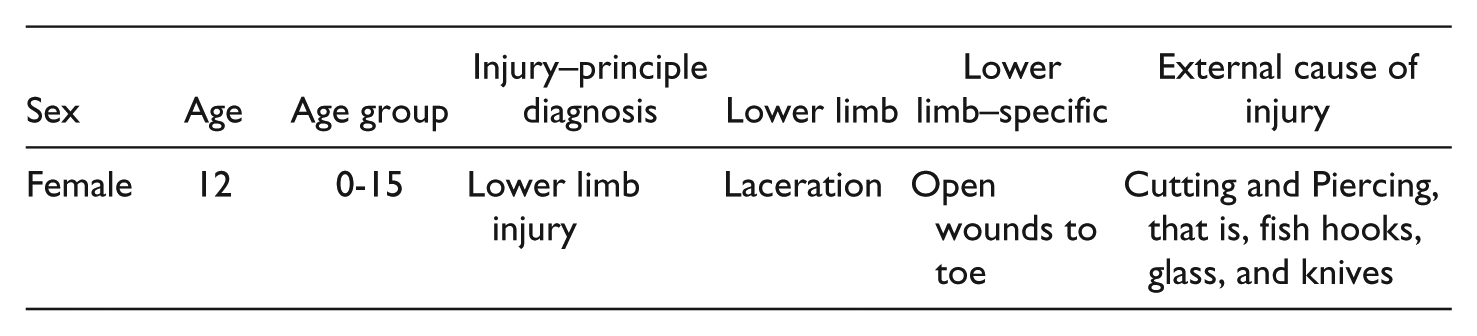
To maintain confidentiality, each patient file was allocated a unique number entered into the database. Injury classification used the International Classification of Diseases and Related Health Problems 10th Revision (ICD-10-CM), regarded as the international “standard diagnostic tool for epidemiology, health management and clinical purposes” (World Health Organization, 1992). Utilizing a systematic and hierarchical approach to injury classification, the ICD-10 allows for consistency of coding; data comparisons between hospitals, regions, settings, and countries; and comparisons across different time periods. Coding consists of a principle diagnosis, secondary diagnosis, injury-specific data, and an external cause of injury (World Health Organization, 1992). As data is collected information cascades to create a logical sequence of injury events, for example,
Police data
For the period from January 1, 2006 to December 31, 2011, offenses against persons for victims were grouped into common assault and serious and grievous assault. The term any assault (see Table 3) encompasses other types of assault including sexual assault. De-identified data accessed included details of a victim’s gender, age and date of birth; details of the offense; date of offense; offense description; community name; location of offense; involvement of a substance (alcohol and/or drugs); and action taken.
Surveys
Surveys were conducted during 2014 and 2015 with adult residents of each community, that is, among those aged 18 years and over. The survey asked participants to consider a number of propositions, including “The AMP has reduced violence against women in this community.”
Survey participants rated their level of agreement as strongly agree, agree, don’t know/not sure, disagree, or strongly disagree, presented to participants on a 5-point Likert-type scale. Qualitative comments were captured verbatim where participants took up the invitation to elaborate on their reasons for their ratings. Opportunistic sampling was used with recruitment mainly occurring in public spaces as well as workplaces and local industries. Full details of how the survey was developed and administered in AMP communities have been published elsewhere (Clough et al., 2016; Clough et al., 2017; Fitts et al., 2015).
Ethics
Ethical approval was granted by the Human Research Ethics Committee James Cook University (H5618, H5241, and H4967), Cairns and Hinterland Health Services District Human Research Ethics Committee (HREC/14/QCH/3–883), and Townsville and District Human Research Ethics Committee (HREC/13/QTHS/187). Approval was granted by the QPS Research Ethics Committee to access offense data on September 11, 2014.
All parts of the studies were considered and supported by the Indigenous Leaders Forum of the Local Government Association of Queensland which included the duly elected Mayors and CEOs from all affected Queensland communities. Support for both studies was provided by Apunipima Cape York Health Council.
Data Analysis
Clinical File Audit and Police Data
Rates (per 1,000 inhabitants) were calculated based on yearly population estimates retrieved from the Australian Bureau of Statistics (Australian Bureau of Statistics, 2011b). As each community’s entire population was assessed for the time period January 1, 2006 to December 31, 2011, the use of statistical uncertainty measures (statistical tests or confidence intervals) would be misplaced as these imply the use of sampling strategies. Average changes pre- or post-AMPs were calculated to compare the base periods of 2006-2008 for Community A (restrictions tightened at the end of 2008) with 2006-2007 for Community B (prohibition introduced in mid-2008, that is, the “transition year”). The postperiods assessed were both of 3-year duration (2009-2011).
Surveys
Survey data were analyzed using SPSS (version 23.0). Opinions were polarized along the original 5-point Likert-type scale, so binary variables (agree/disagree) were created by combining the agree and strongly agree responses and the disagree and strongly disagree responses, respectively, and by discarding any don’t know/unsure responses. Qualitative comments accompanying many survey responses were analyzed for emergent subthemes, using an inductive technique for thematic analysis (Braun & Clarke, 2006). Key comments by participants are presented in italics in the Results section.
Consent
Waiver of individual consent for the clinical file audit was granted by the Health Services District Human Research Ethics Committees. De-identified epidemiological QPS data were accessed, and as such, individual consent was not required.
Potential survey participants were provided written information about the study as well as feedback flyers from other communities to demonstrate how survey information collected would be disseminated. Local community members were employed to assist the research team with data collection and to act as interpreters when needed. Individuals who wished to participate completed and signed a consent form. The consent process adhered to the National Health and Medical Research Council (NHMRC) Guidelines for Ethical Conduct in Aboriginal and Torres Strait Islander Health Research (National Health and Medical Research Council, 2003). All participants were informed that participation was voluntary and that they could refuse or withdraw without reason or justification for their decision.
Results
Quantitative
A total of N = 6,076 clinical files were audited (Community A: n = 3,048; Community B: n = 3,028) identifying 4,031 injury presentations in the two communities between the January 1, 2006 and December 31, 2011 (Community A: n = 1,953; Community B: n = 2,077). Assault-specific injuries accounted for n = 1,199 (Community A: = 662; Community B: n = 537), of which 66.0% were experienced by women (Community A: 62.8%; Community B: 69.8%).
Police dealt with n = 837 assault episodes (Community A: n = 386; Community B: n = 451). Among these, victims of assault and grievous bodily harm offenses were linked with n = 466 episodes (Community A: n = 236; Community B: n = 230) of which 67.4% were experienced by women (Community A: 64.8%; Community B: 70.0%).
Table 2 describes injury and assault presentation numbers and rates (per 1,000 population) to health centers for each year in the study period for each community overall, and for males and females. Table 3 similarly summarizes numbers and rates (per 1,000 population) of police reports for victims of all assault types and for victims of serious or grievous assault. For all rates and for all subgroups, a decreasing trend over the study period is observed. If prealcohol and postalcohol control periods are considered, the observed reductions range between 2.5% (all injury presentations in Community A) and 71.9% (serious assaults with males as victims in Community B).
Injury and Assault Presentations (Event Numbers and Rates) by Year, Community, Gender, and Selected Subgroups.

Note. Red = reduction.
Police data: All Assaults and Serious/Grievous Assaults (Event Numbers and Rates) By Year, Community, and Gender.
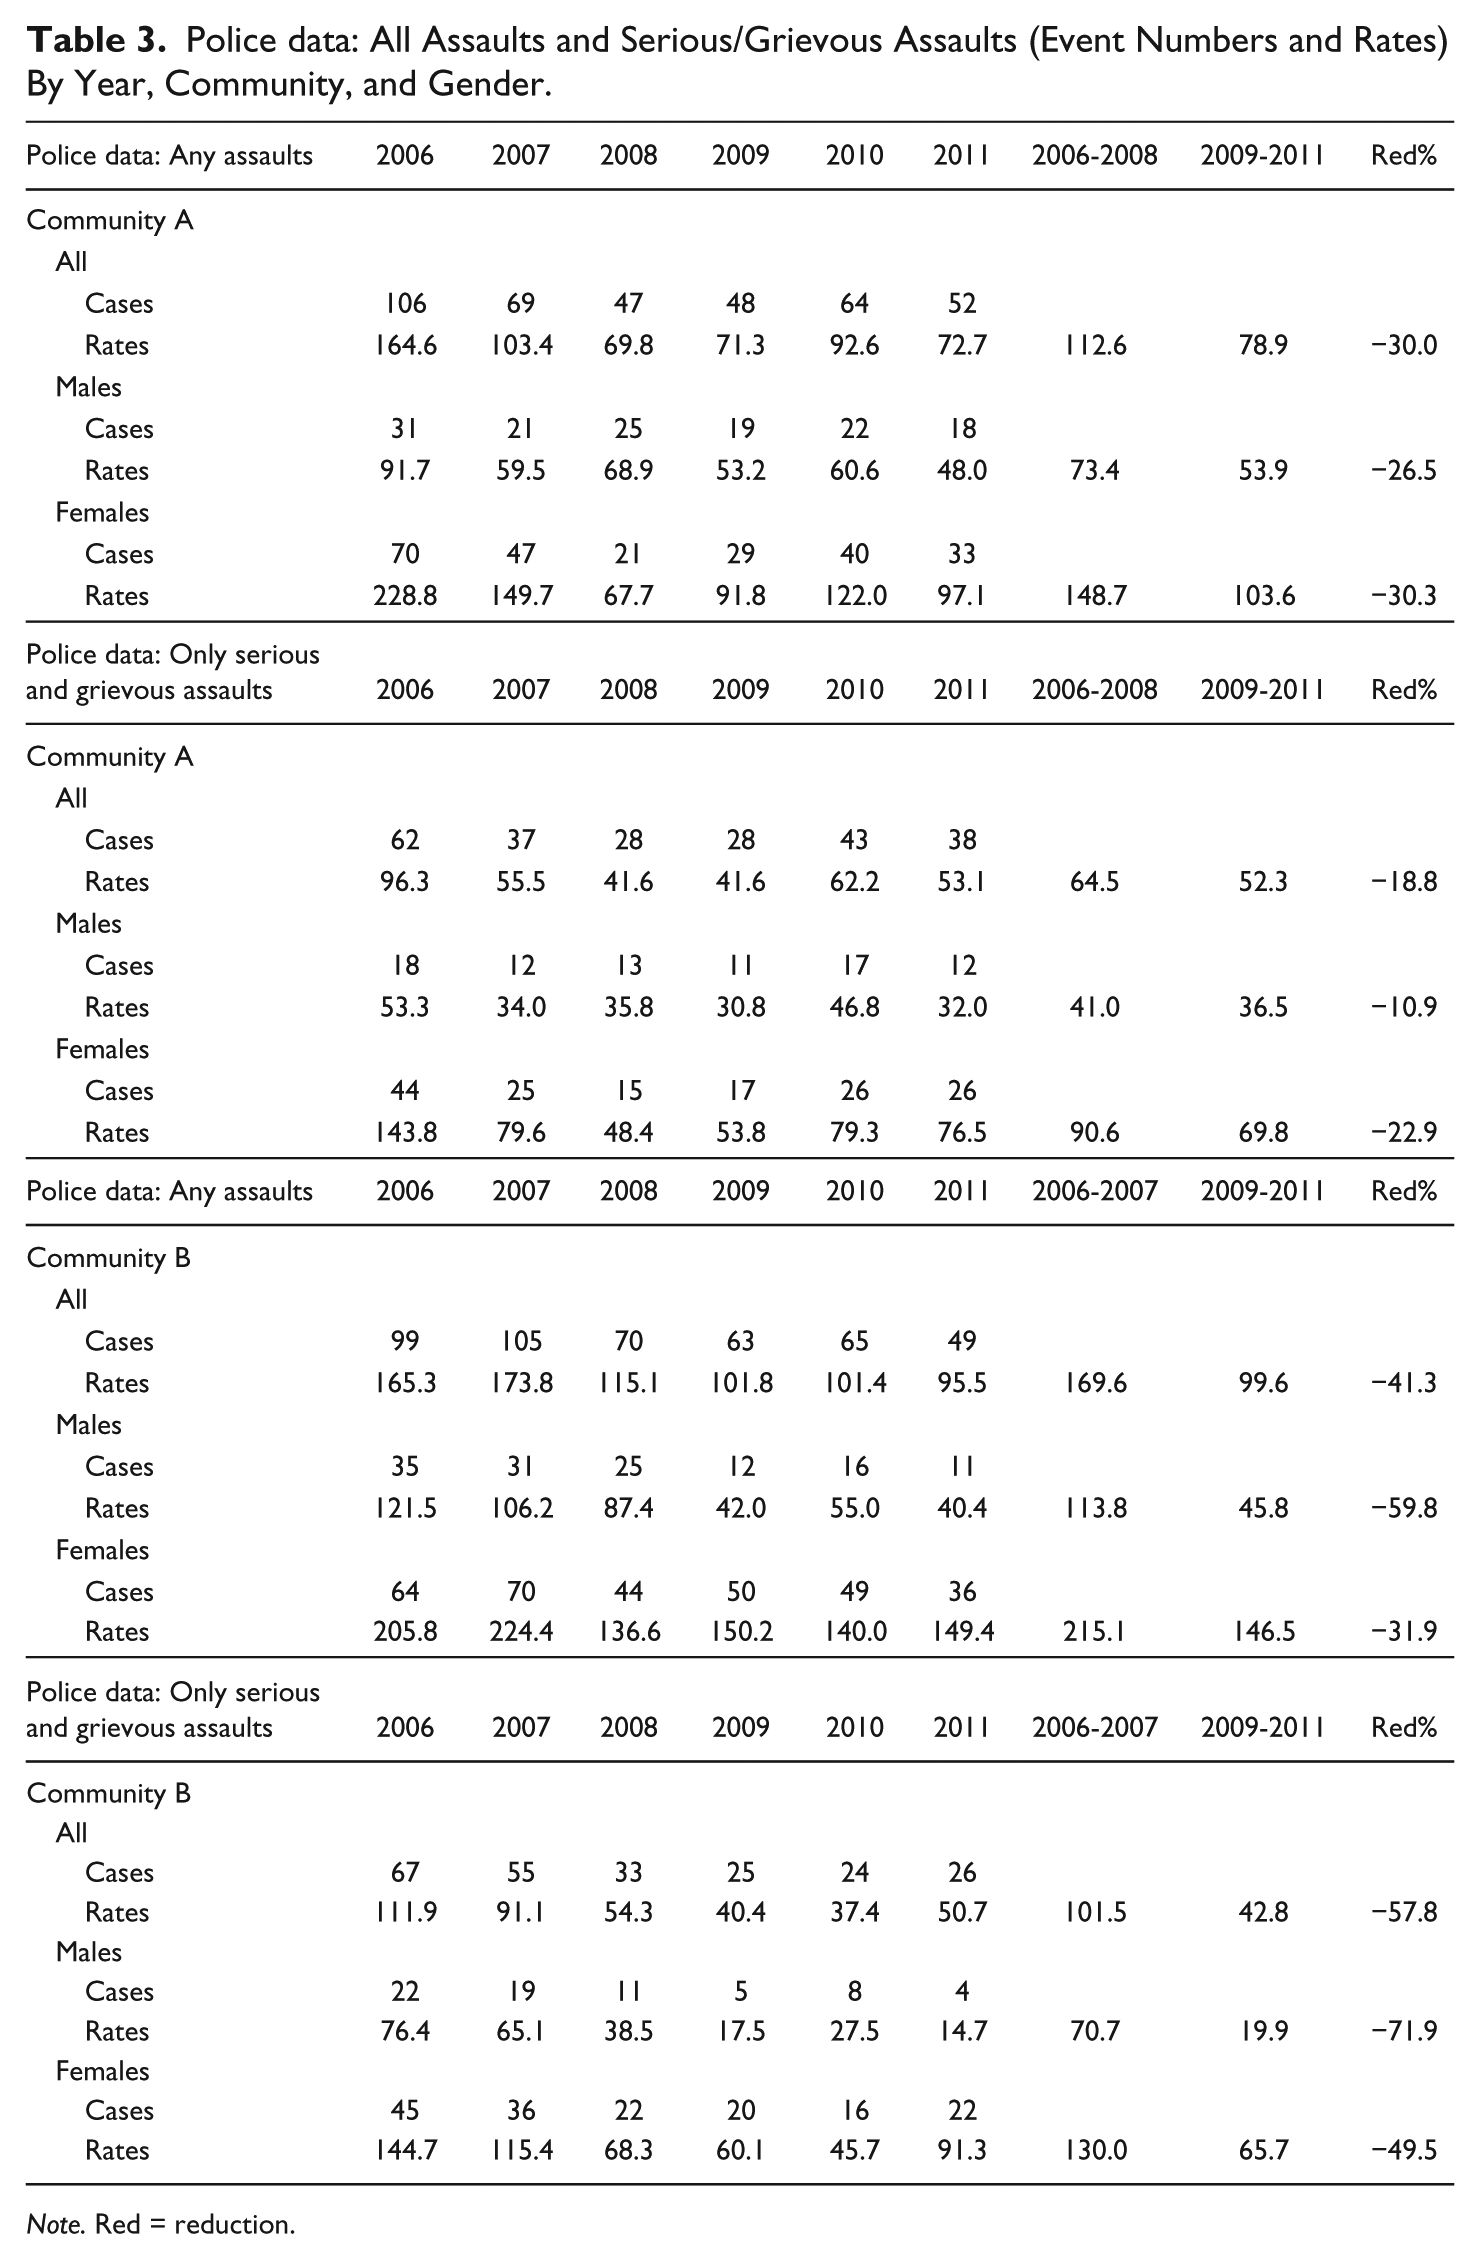
Note. Red = reduction.
Overall, it can be observed that the female rates across the board are generally between 2 and 3 times the respective male rates. The highest rates were exclusively found in females, especially in the 20-29 year old age group (e.g., 653.8/1000 for assault presentations in Community A in 2006, or 1,111.1 in this age group in Community B in 2007). The extremely high levels for this 20-29 year old female group are further detailed in Figure 1.
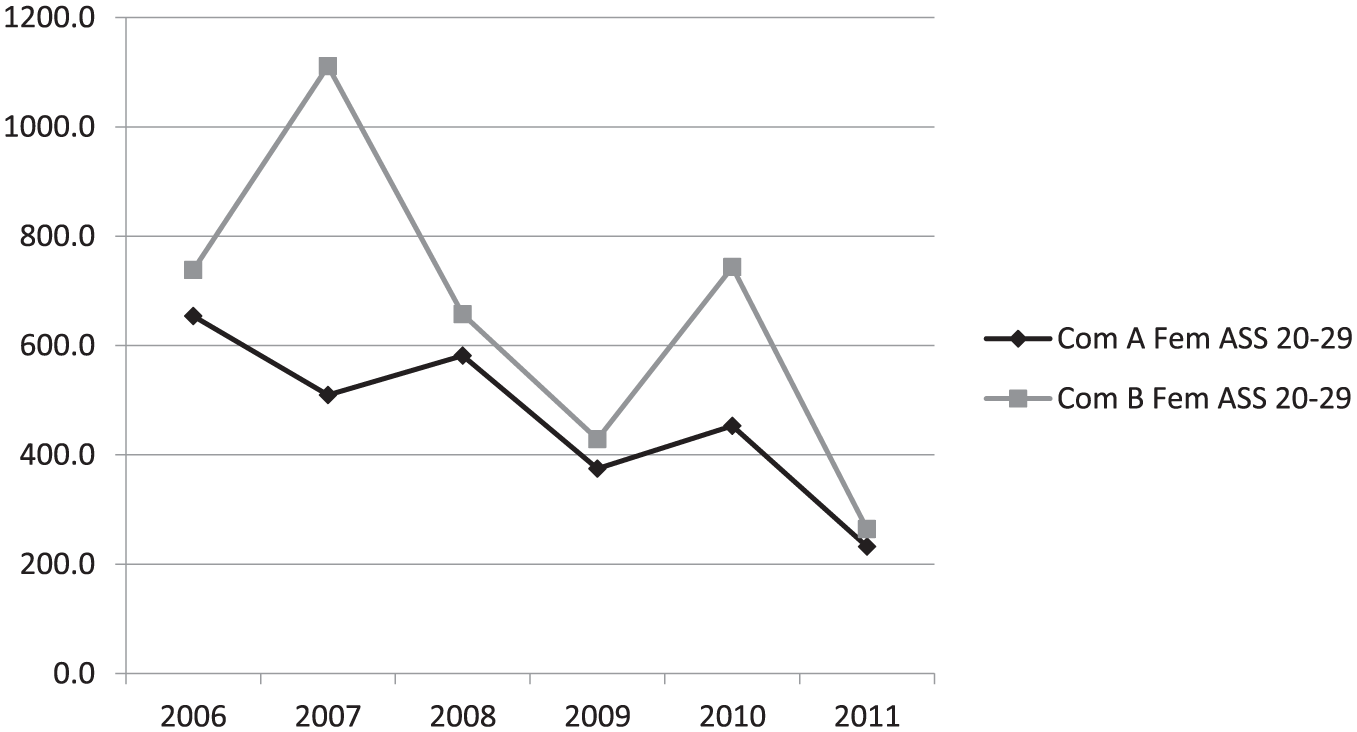
Time trends of female (age group 20-29) assault injury rates by community and year.
The time trends in assault presentation rates for females generally shows a reduction of around 50% or more between the start of the first year of the study period (2006) and its last (2011). The respective general trend in police-reported victims of assaults and serious or grievous assaults is consistent with this observation and displays a similar reduction (by 50% or more) in Community A, but smaller reductions (still by around 25-30%) in Community B. More details of time trends of female assault injury presentations and police reported assaults/serious assaults are provided in Figure 2.
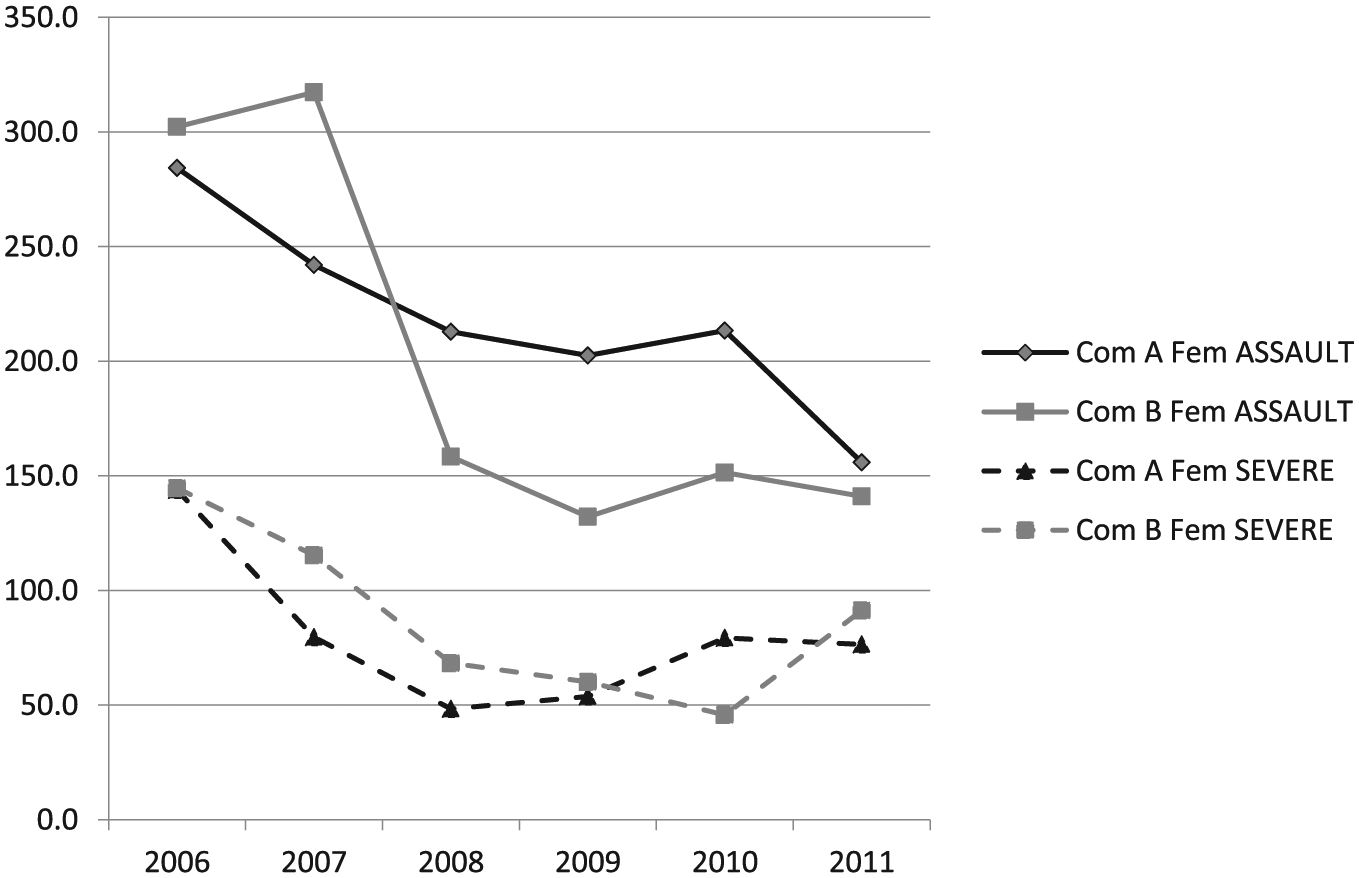
Time trends of female assault injury rates and serious/grievous assault police report rates by year and community.
If the time periods preincreased and postincreased alcohol restrictions are compared, female rates across the board declined substantially by at least 22.6% (assault presentations) in Community A and by up to 54.3% (assault presentations) in Community B.
The results show the marked effect that prohibition had on overall injury presentations (29.7%) when compared with increased restrictions alone (2.8%) and an even greater effect in assault and assault with alcohol injury rates (57.6 and 16%, respectively), thus supporting our first and second hypotheses. Female-specific assault-related injury presentations responded similarly to prohibition with a 54.3% decrease compared with the 22.6% decrease with tighter restrictions alone (Table 2).
This marked effect response was not only evident in injury presentations. Police data for all assault and serious/grievous assaults followed a very similar trajectory. Community A (increased restrictions) recorded a 30% decrease in all assault and serious/grievous assaults over the time period, and Community B (prohibition) a 41.3% decrease. Breakdown of the data shows female-specific serious/grievous assaults decreased substantially more with prohibition (49.5%) compared with increased restrictions (22.9%; see Table 3), supporting our third hypothesis.
Survey Responses
A total of n = 221 (Community A: n = 114; Community B: n = 107) surveys were conducted in the two communities with n = 186 participants (Community A: n = 96; Community B: n = 90) responding to the specified questions. Among these, 156 participants had lived in the communities for 6 years or more and were therefore likely to have lived through and witnessed events during the study period (January 1, 2006 to December 31, 2011), including the abrupt and significant 2008 changes to AMPs.
In the survey, 76.3% of the total respondents (119/156) agreed with the proposition that “the AMP has reduced violence against women in this community,” thus generally supporting our fourth hypothesis. In more detail, for participants who agreed with the statement and who provided a qualifying comment, different elements of the AMPs were perceived as contributing to the reduction in violence against women in their community. For some participants, it was the modifications to alcohol availability, including restricting takeaway sales from the canteen in Community A and the closure of the canteen in Community B. For others, the services implemented to assist women and families experiencing violence had supported the favorable reduction in violent encounters: There were lots of DV when we had takeaways. (Community A, Woman, 25-44) Much better than before with the canteen. (Community B, Woman, 45-64) There’s not much violence towards women. Not like there used to be . . . (Community A, Man, 25-64)
A similar sentiment emerged from the long-term community members and service provider personnel who also provided comment. As the first quote below illustrates, frontline service providers reported there has been a reduction in domestic violence-related presentations since the alcohol controls: . . . never a Friday night whet [sic] by when you weren’t called in for fights or family violence or whatever. . . . So it was fairly unpleasant. And once the alcohol management plan was introduced . . . there was a big difference. (Community B; Health Worker) Yeah, domestic violence has changed. . . . You usually seen domestic violence around the streets, yeah, when the canteen was open . . . there was a lot of people drunk, who may have come back and start fighting on the streets, the kids could see it, everyone could see it. But now, the canteen’s closed, not much violence on the street. (Community B, Woman, <25, Community member)
Participants also commented on the importance of robust prevention and treatment services aligning with the alcohol reform policy and the role these services play in the reduction of violence against women. Shelter, counseling, and justice services implemented in Community A, as part of the alcohol reform, have enabled women to leave high-risk situations and receive counseling and justice service support for individuals, couples, and families following an incident.
Discussion
To the knowledge of the authors, this is the first comprehensive evaluation study of AMPs with respect to effects on interpersonal violence against Indigenous women in Cape York communities. The two communities presented offer a unique insight into the major changes to liquor access which occurred in 2008 and as such provide much-needed evidence in these highly contentious and often challenging topic areas. Given that all study propositions could be evidenced, a strong case for dose–response relationship is provided: Clearly, the more restrictive AMPs reflected a stronger reduction in rates of violence against women in both health clinic presentations and reported assaults to police, especially for assaults involving alcohol. A similar direct relationship was evidenced in a study exploring overall injury presentations and AMPs (West, Muller & Clough, 2017).
Given the national data which indicate that 18- to 24-year-old females are a highly vulnerable population and twice as likely to experience a physical or sexual assault when compared with all Australian women (Australian Bureau of Statistics, 2013), particular attention was paid to the analysis of the age range 20-29 years where grossly disproportional assault and assault with alcohol injury presentations were seen in both communities (Community A: 2006-2008 581.6/1,000; 2009-2011 353.4/1,000. Community B: 2006-2008 924.6/1,000; 2009-2011 478.8/1,000) with averages triple that of all female assault presentations. Although a substantial reduction was witnessed (Community A: 39.2% and Community B: 48.2%), the gravity of violence experienced in this group remains at epidemic proportions.
Specific age groups were not analyzed in the police data, and as such, a specific high-risk age group was not identified. The findings overall, though, did show a reduction in all and in serious/grievous assaults against women in both communities.
Analysis of the survey data further supported the findings with more than three quarters (76.3%) of survey respondents agreeing that “the AMP has reduced violence against women in this community.” More women in Community B (75.6%) agreed with the statement than in Community A (67.6%), a perception which aligns with trends in the injury data, police assault data, and the women’s views on violence against women.
Given the uniqueness of these data sets, it is difficult to create a meaningful comparison of the findings with studies also conducted in Cape York which address violence against women and alcohol restrictions. Knowing this was the case, premediated decisions were made to ensure triangulation. Cross-verification of the injury and QPS assault data are supported by the voices of the residents and stakeholders collected in the qualitative surveys providing a powerful argument to support the findings and ensure confidence (Rothbauer, 2008) when comparing the women’s interpersonal violence rates with national figures.
Some comparison can be made with published reports from Indigenous communities in Western Australia, where evidence that alcohol and violence against women are strongly linked and show at least initial decreases when restrictive processes are put into place (Kinnane, Farringdon, Henderson-Yates, & Parker, 2009; Western Australian Drug and Alcohol Office, 2015). Both studies clearly show a decline in domestic violence rates with figures presented from verified assault offenses reported to the police and emergency room data; however, neither study provides a specific breakdown of sex- and age-related offenses. As such, only general violence comparisons can be made. The Halls Creek project (Western Australian Drug and Alcohol Office, 2015), as with this project, at least presents longitudinal data (5 and 6 years, respectively), which allow for insight into whether decreases in violent activity were sustained over time or were merely a knee-jerk reaction to the alcohol restrictions.
The dramatic decline seen in rates of injury and violence in the postprohibition period presented here is, however, consistent with the findings of Margolis et al. (2008), who published data describing similar decreases in aeromedical retrievals for serious injury by the Royal Flying Doctor Service. Margolis et al. (2008), included data from the same discrete communities described in this study and also captured the 2008 AMP changes (2006-2008 compared with 2009-2010)—Community A: 31.3% reduction; Community B: 75.7% reduction. The findings also corroborate the prevalence of assault and assault with alcohol presented by Gladman et al. (1997) in their injury study in five Cape York Communities from nearly 20 years ago. Gladman et al. (1997) similarly found that assault, including domestic violence, was the most common injury sustained and that alcohol played a major role in not only all injuries sustained but also specifically in assault-related injuries.
Interestingly, both assault and assault with alcohol injury presentations and assault and serious/grievous assault police presentations show a rise in 2010 in violent events (Tables 2 and 3). Anecdotally, this rise could be suggestive of a rise in illicit sale and consumption of alcohol (“sly grog”), which is a known community concern (Clough et al., 2017). Demand for alcohol from the “sly grog” market increased in some remote communities with AMPs after the second wave of restrictions which saw the closure of community taverns and prohibition of alcohol carriage (Fitts et al., 2017). Within the AMP communities, “sly grog” alcohol has been associated with rapid consumption to avoid police detection and sharing alcohol which can cost from 4-6 times, and up to 11 times, the legal trail value (Fitts et al., 2017; Robertson, Fitts, & Clough, 2017). There is also a perception within AMP communities that uptake of cannabis use has increased and is directly related to the introduction of alcohol restrictions (Robertson et al., 2017). The concern within the communities, then, is that any protection offered by alcohol restrictions may be adversely affected by changes in consumption practices of alcohol and consumption of illicit substances. Further exploration of the role alcohol and illicit drug use have with assault rates is therefore suggested.
Despite the decrease in violence against women presented in these findings, in the very best years rates of domestic violence experienced by Indigenous women remain higher than the rates reported among the general Australian population (see Table 2; Australian Bureau of Statistics, 2013). Although alcohol misuse is a serious contributing factor to violence against Indigenous women, there are a number of other interrelated factors that have been identified including gender and structural inequality, breakdown of culture, intergenerational patterns of violence, the fragmentation of kinship systems, poverty, and socioeconomic stressors (ANROWS Limited, 2016; Blagg, 1999; Day et al., 2013; Nancarrow, 2010; Willis, 2011). Any attempts to further reduce violence in Indigenous communities, where AMPs apply, require a multifaceted and holistic approach.
Strengths and Limitations
Although the data reported here are for just two communities, they have considerable depth. Not only are serious injury, death, and aeromedical retrievals captured within the data, but so also are less severe incidents associated with violent encounters; the latter is possibly more sensitive to change. The depth of data accessed in the clinical file audit and police reports provides the opportunity for specific subgroup analysis (community, gender, and age groups), permitting elucidation of specific events affecting women. Access to three data sources provides robust triangulation to the assumptions made and provides a truly comprehensive view of the phenomenon.
Violence against women covers a broad range of behaviors and can occur in a variety of forms including physical, sexual, emotional, and economic violence within any type of relationship against any person (World Health Organization, 2013). It can also include threatening, coercive or controlling behavior. So, the effects on each individual from an assault can differ greatly. Our data were not sufficiently detailed to permit us to examine this heterogeneity.
Although the findings in this article reflect violence data from two discrete Indigenous communities, in no way should the findings be generalized to the wider Indigenous community. Each community setting is unique in its composition of people, tradition, and culture, and should be viewed accordingly.
Finally, many violent incidents go unreported. Research shows that less than half of all people who have been victims of violence report the incident to police (Australian Bureau of Statistics, 2013; Birdsey & Snowball, 2013). This suggests the assault-related data accessed from clinical files and police reports, as used here, may represent a proportion only and not the total number of these types of incidents.
Conclusion
This is the first comprehensive evaluation study of AMPs with respect to effects on interpersonal violence against Indigenous women in Cape York communities. The findings of previous injury-specific research and studies of violence against women are reinforced and an extensive expansion on current knowledge, especially with regard to violence against Indigenous women in rural and remote communities, is offered. Specifically, this article offers a strong case for a dose–response relationship between restrictive level of AMPs and the reduction of rates of violence against women. Despite the substantial reductions observed, the evidence cannot be disputed that violence against women remains at intolerable levels. This study has further cemented the need for ongoing support and research in this highly contentious arena. Clearly, the issues surrounding AMPs are complex and any policy change must take the complexities into consideration.
Footnotes
Acknowledgements
The authors gratefully acknowledge the support of study participants and partner organizations.
Declaration of Conflicting Interests
The author(s) declared no potential conflicts of interest with respect to the research, authorship, and/or publication of this article.
Funding
The author(s) disclosed receipt of the following financial support for the research, authorship, and/or publication of this article: The study was funded by the National Health and Medical Research Council of Australia (NHMRC No. 1042532 Project Grant and NHMRC, ECR Grant No. 1070931). Funding bodies had no role in the study design; in the collection, analysis, or interpretation of data; or in the writing of the manuscript or the decision to submit the manuscript for publication.