
Abstract
Self-reported survey data on the extent and nature of rape and sexual assault experienced by a population represent an important source of information because these crimes often go unreported, and are thus undercounted in law enforcement or other official statistics. This article compares Campus Climate Survey Validation Study (CCSVS) data to Clery Act data in an effort to (1) assess the validity of the CCSVS data and the Clery Act data based on the extent to which they corroborate one another, and (2) estimate the extent to which Clery Act data potentially underestimate the true incidence of rape. The results help to establish the extent to which self-report surveys on sexual victimization are needed to understand the magnitude of the problem among a given population.
Background
Beginning in 2014, attention being paid to the problem of sexual assault among college populations increased dramatically. This increase in attention resulted from concerns about a student culture that is potentially conducive to sexual assault and some high-profile media coverage of how reported incidents of sexual assault had been handled by university administrators at some schools. This attention has led to a number of efforts intended to promote the use of “climate surveys” to gather self-reported data from students about their sexual victimization experiences and the climate or culture on campus and among students related to sexual harassment and sexual assault.
Campus climate surveys were identified in the first report published by the Task Force to Protect Students From Sexual Assault, established by the White House in January 2014, as one vehicle for measuring the problem of rape and sexual assault among college students. A major component of the Task Force's plan was to explore and encourage the administration of campus climate surveys to capture self-reported data on students’ experiences with rape and sexual assault and their perceptions of the climate related to sexual misconduct. Campus climate surveys were also identified as having the potential to collect information that is needed to understand which policies and programs are most effective at reducing the prevalence of rape and sexual assault, providing useful and necessary services to victims, investigating sexual victimization incidents, and holding perpetrators accountable.
The nature and definitional ambiguity of rape and sexual assault incidents can make accurately measuring such experiences somewhat challenging for researchers (see Cook et al., 2011; Fedina et al., 2018; Fisher & Cullen, 2000; Krebs, 2014); however, given the severe impacts that these crimes can have on victims, the importance of understanding the prevalence and nature of rape and sexual assault is widely recognized. Self-reported survey data on the extent and nature of rape and sexual assault experienced by a college population (or any other population, for that matter) represent an important source of information because these crimes often go unreported to school officials and police, and are thus undercounted in official law enforcement statistics. Among the general population, nationally representative estimates suggest that only 14% of women report rape experiences to law enforcement (Paul et al., 2014), and several studies have found that a smaller proportion of college women (about 5% of rape survivors) report their experiences to a law enforcement agency (Fisher et al., 2003; Koss et al., 1987). The low reporting rates of rape and sexual assault are often due to the sensitive and personal nature of these crimes, the fact that victims may not define or think about what happened to them as crimes, or victims’ lack of confidence that reporting the crimes to school officials or police will result in satisfactory responses or outcomes.
Of course, with any self-report survey data, assessing the validity of the data collected is a common and valued practice. Validating self-reported data increases one's confidence that the data can be used to inform understanding of a problem and efforts to assess or improve related policies and practices. In some fields, assessing the validity of self-reported survey data is a rather straightforward endeavor. This is primarily the case with estimates for which the “true prevalence” can be ascertained from other sources. For example, in a well-known article, data on health insurance coverage provided by respondents via self-report in a survey were validated using insurance company records on these individuals (Davern et al., 2008).
Unfortunately, with rape and sexual assault, no “gold standard” data source exists against which to validate self-reported survey data. It is typically considered a futile practice to use official data from schools or law enforcement agencies or some other official statistics source to compare estimates obtained from self-reported survey data because rape and sexual assault are crimes that are so rarely reported to school authorities or law enforcement agencies. Instead, researchers often look to measures of internal validity to assess the quality of self-reported survey data on rape and sexual assault, if or when assessments of validity are performed at all.
This article explores the extent to which climate surveys provide a more complete picture of what is happening on campuses than official statistics alone. This analysis entails comparing Clery Act data (official statistics reported to the Department of Education by institutions of higher education) to Campus Climate Survey Validation Study (CCSVS) data (self-reported survey data) to see how estimates of the number of completed rape incidents that meet criteria for reporting under the Clery Act compare for the nine schools that participated in the CCSVS. The Jeanne Clery Disclosure of Campus Security Policy and Campus Crime Statistics Act 1 requires institutions of higher education that participate in federal financial aid programs to keep and disclose information about crime on or near their campus. Among the requirements are that institutions publish an annual campus security report that documents a number of specified campus crime statistics, including sex offenses (rape, fondling, incest, and statutory rape).
In addition to determining the extent of the disparity between self-reported and official data on rapes experienced by undergraduate students, the current analysis also serves the secondary purpose of validating the (self-reported) CCSVS data with an external, secondary data source. The incident-based approach used in the CCSVS (which allowed for the generation of both prevalence estimates and incident counts and collected detailed information at the incident level) enables us to parse out incidents that should have been reported under the Clery Act by the nine schools that participated in the CCSVS. Some doubts exist about the validity or accuracy of data on rape and sexual assault reported under the Clery Act, given that sex crimes are rarely reported to authorities and because schools have some discretion over what gets reported. This analysis, therefore, can also be seen as an effort to potentially validate Clery Act data using the self-reported survey data collected for the CCSVS.
The CCSVS Methodology
Study Goals. The CCSVS was an effort that grew out of the energy, focus, and funding put forth by the White House Task Force to Protect Students From Sexual Assault. Funded by the Office on Violence Against Women (OVW) and the Bureau of Justice Statistics (BJS), the CCSVS was designed to develop and test a survey instrument and methodology for efficiently collecting valid school-level data on sexual victimization and the campus climate related to sexual misconduct.
School Selection. Data from the Integrated Postsecondary Education Data System (IPEDS) were used to identify eligible schools, 2 which were stratified by size, public versus private status, and 2- versus 4-year status. Schools were also selected to obtain some regional variation. Selected schools in each stratum were invited to participate in the CCSVS, with nine schools ultimately agreeing to participate. The identity of the nine participating institutions of higher education will remain confidential, and confidentiality was a condition promised by the CCSVS for their participation.
Sampling. Student rosters provided by each participating school were used to draw stratified random samples of undergraduate, degree-seeking male and female students who were at least 18 years of age. Sample sizes were designed to yield school-specific estimates of campus climate for males and females and sexual assault victimization rates for the 2014–2015 academic year for females.
Instrument Development. The survey instrument was developed following an extensive design phase, with the draft instrument undergoing two modes of cognitive testing to ensure item comprehension. Following best practices in survey research, the survey was a confidential, web-based survey, designed to be fully functional on smartphones, tablets, laptops, and desktop computers. The burden was limited to approximately 15 min to reduce breakoffs.
Data Collection Approach. The CCSVS Pilot Test was fielded in March 2015 and data collection stopped by the end of May 2015. The data were collected using a standardized methodology (e.g., within a standardized time period and using a standardized instrument and process) to generate estimates that could be compared across schools. Incentives were used to increase response rates and reduce nonresponse bias related to topic salience (Krebs et al., 2016). Students at five of the schools each received $25 gift certificates for participating. An incentive experiment was conducted at the remaining four schools, for which students at two schools were randomized to receive gift certificates worth either $10 or $25, and students at the other two schools being randomized to receive gift certificates worth either $25 or $40. 3
Response Rates and Data Assessments. Surveys were completed by more than 23,000 undergraduate students, including approximately 15,000 females and 8,000 males. The average response rate across all nine schools was 54% for females and 40% for males. Response rates for females ranged from 43% at one school to 71% at another, meaning that the expected response rate of 40% was exceeded at all schools. Male response rates ranged from 30% to 60%, and the expected response rate of 35% was achieved or exceeded in five of the nine schools.
For a survey response to be included in the analysis, respondents had to at least provide their gender and the number of unwanted sexual contacts they experienced during the 2014–2015 academic year. Among the approximately 23,000 respondents who met these criteria, 97% completed all six survey modules. Furthermore, the item nonresponse rate for determining if a student was a rape or sexual battery excluding rape victim was 0.5% and 0.1%, respectively. Nonresponse bias analyses, based on Cohen's Effect Sizes, indicated the likelihood of bias was small. However, to correct for any potential bias due to nonresponse, survey weights were calibrated to each school's population using a raking procedure (Folsom & Singh, 2000). Survey weights were calibrated by sex, race/ethnicity, age, year of study, transfer status, living on campus status, SAT/ACT score, GPA, and full/part-time status. The data quality and validity assessments indicated there was minimal evidence of nonresponse bias (e.g., differences in characteristics of respondents and the population of eligible students), very few breakoffs, and very little missing data. 4
Measurement. Three key types of criminal sexual victimization were measured in the CCSVS: sexual assault, rape, and sexual battery.
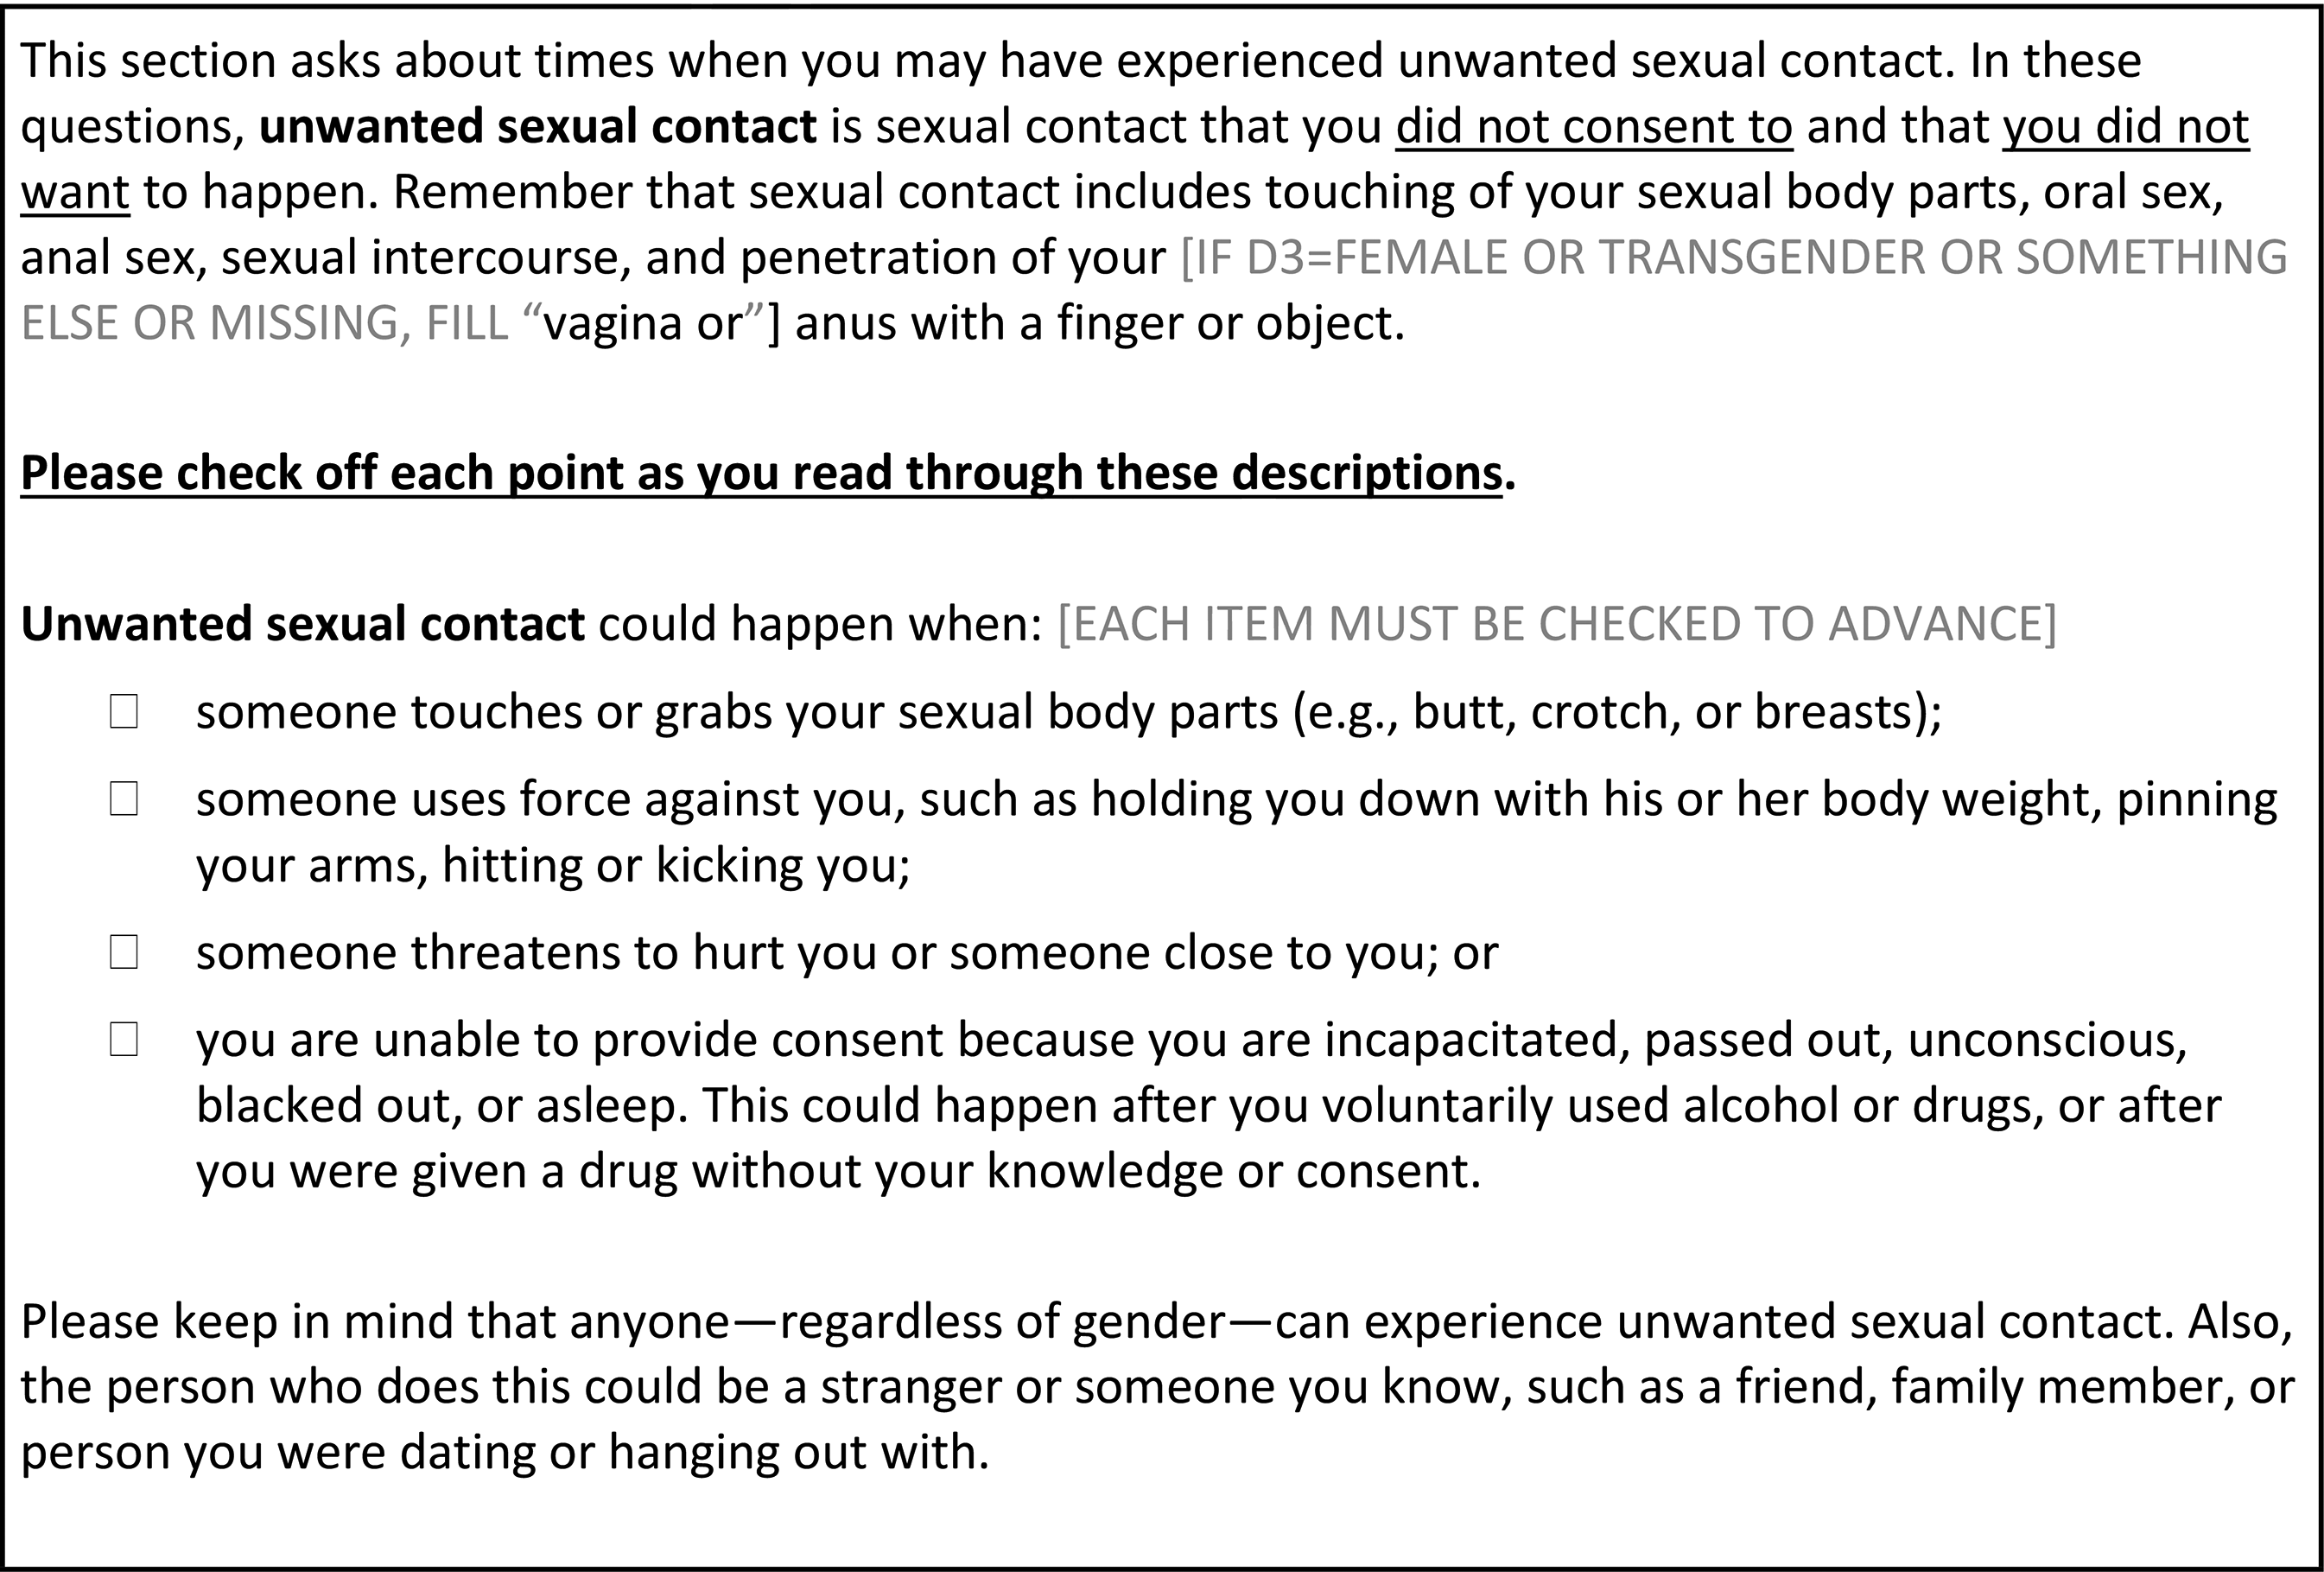
Before any questions about unwanted, nonconsensual sexual contact (e.g., sexual assault) were covered, respondents were asked about sexual harassment victimization and experiences with coerced sexual contact. 5 After answering the questions about sexual harassment and coerced sexual contact, respondents started a new section of the survey. They were provided with the definition of “unwanted sexual contact” and descriptions of tactics that could be used to perpetrate unwanted sexual contact. Respondents were required to check a box next to each of the tactics, which were shown one at a time, before advancing to the next screen (see inset below). This strategy was informed by the in-person cognitive interview process and implemented to increase the likelihood that respondents would read the definitions and descriptions.
Respondents were then taken to a new page that asked whether they had experienced unwanted/nonconsensual sexual contact since the beginning of the academic year, regardless of where it happened (Survey Item P1). Regardless of their response to P1, students were also asked on the same screen how many times they had experienced unwanted sexual contact during the reference period (see inset below). The question about the number of times (Survey Item P2) was used to develop the primary sexual assault victimization estimates (both prevalence and incidence rates) for the CCSVS.
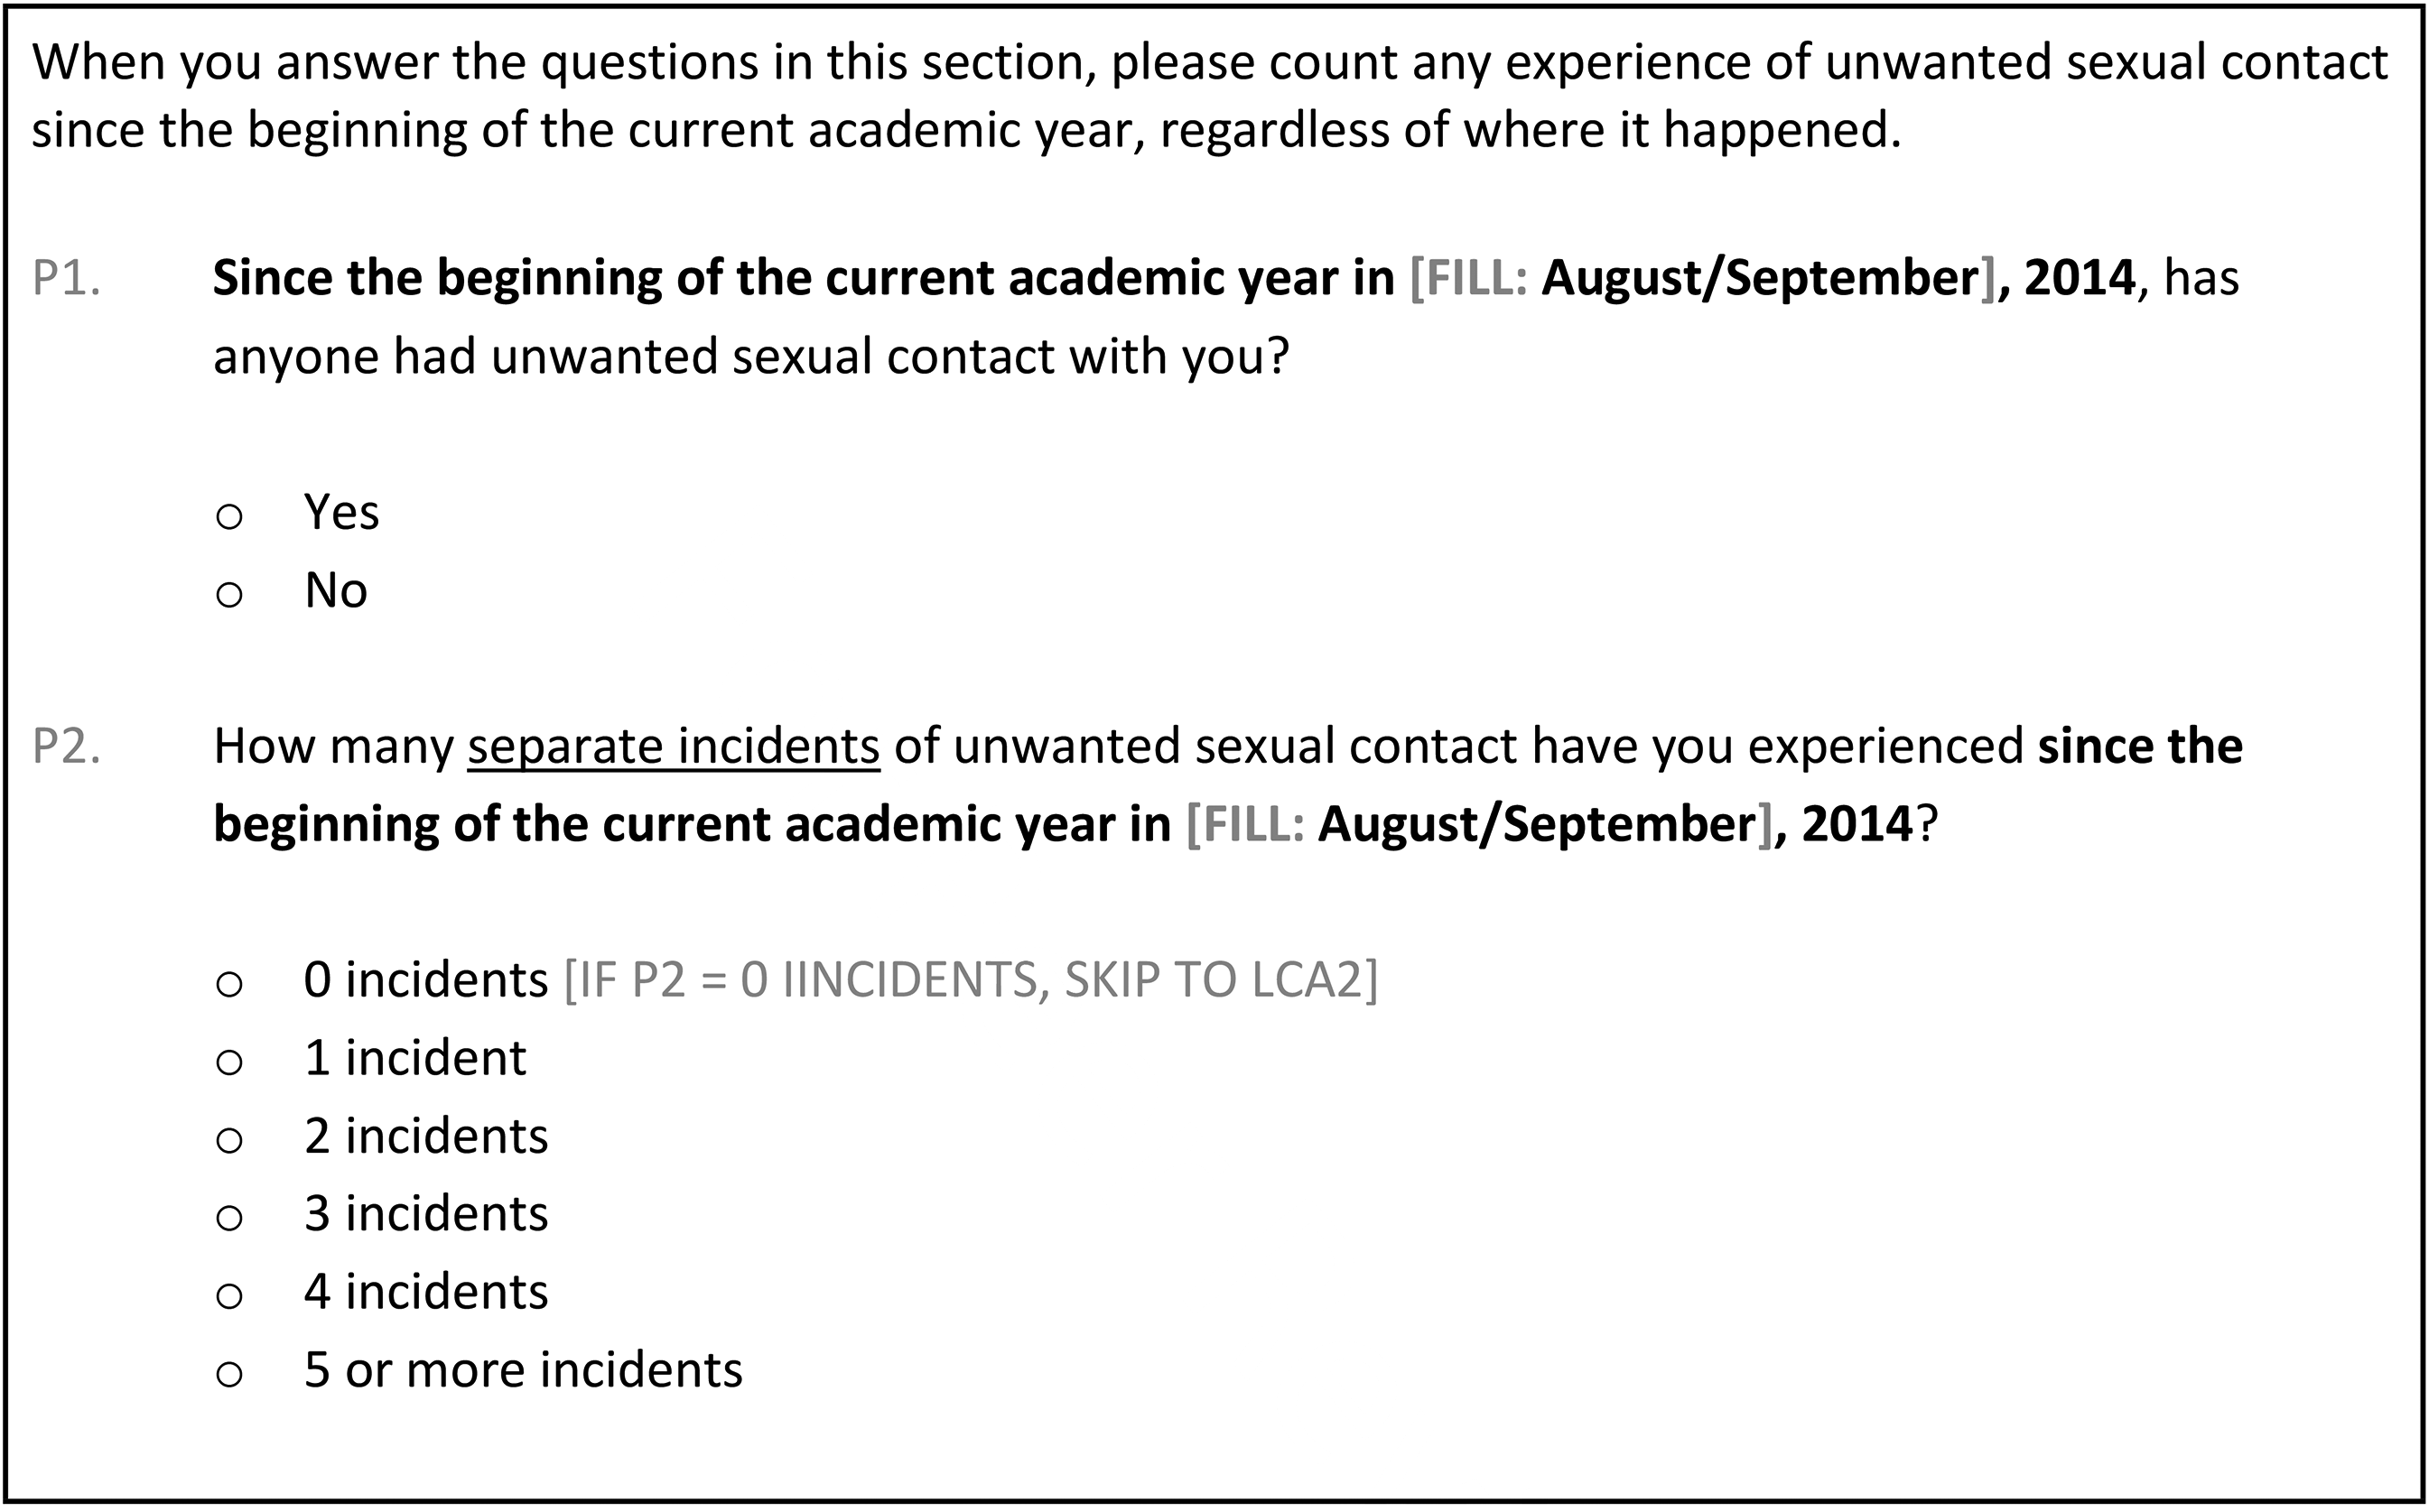
Respondents who reported experiencing 1 or more incident(s) in Survey Item P2 were then taken to a new page on which they were informed they would be asked a series of follow-up questions about each incident. Respondents were asked to date each incident within the months of the current (i.e., 2014–2015) academic year. After each incident was placed in time (calendar month), respondents were taken through a series of approximately 25 questions, depending on skip patterns, about each incident, for up to a maximum of three incidents. The first two questions documented the nature of the sexual contact (i.e., whether it involved sexual touching, oral sex, anal sex, sexual intercourse, and/or sexual penetration with a finger or object) and the tactic(s) used by the perpetrator to engage in the sexual contact (i.e., whether the perpetrator used threats of harm, used physical force, and/or took advantage of the victim when she was incapacitated and unable to provide consent). Data collected via the survey item on the nature of the sexual contact were used to determine if a respondent had experienced rape (i.e., unwanted sexual contact that involved penetration), which is the sexual victimization type that is the focus of this article.
Analytic Approach and Results
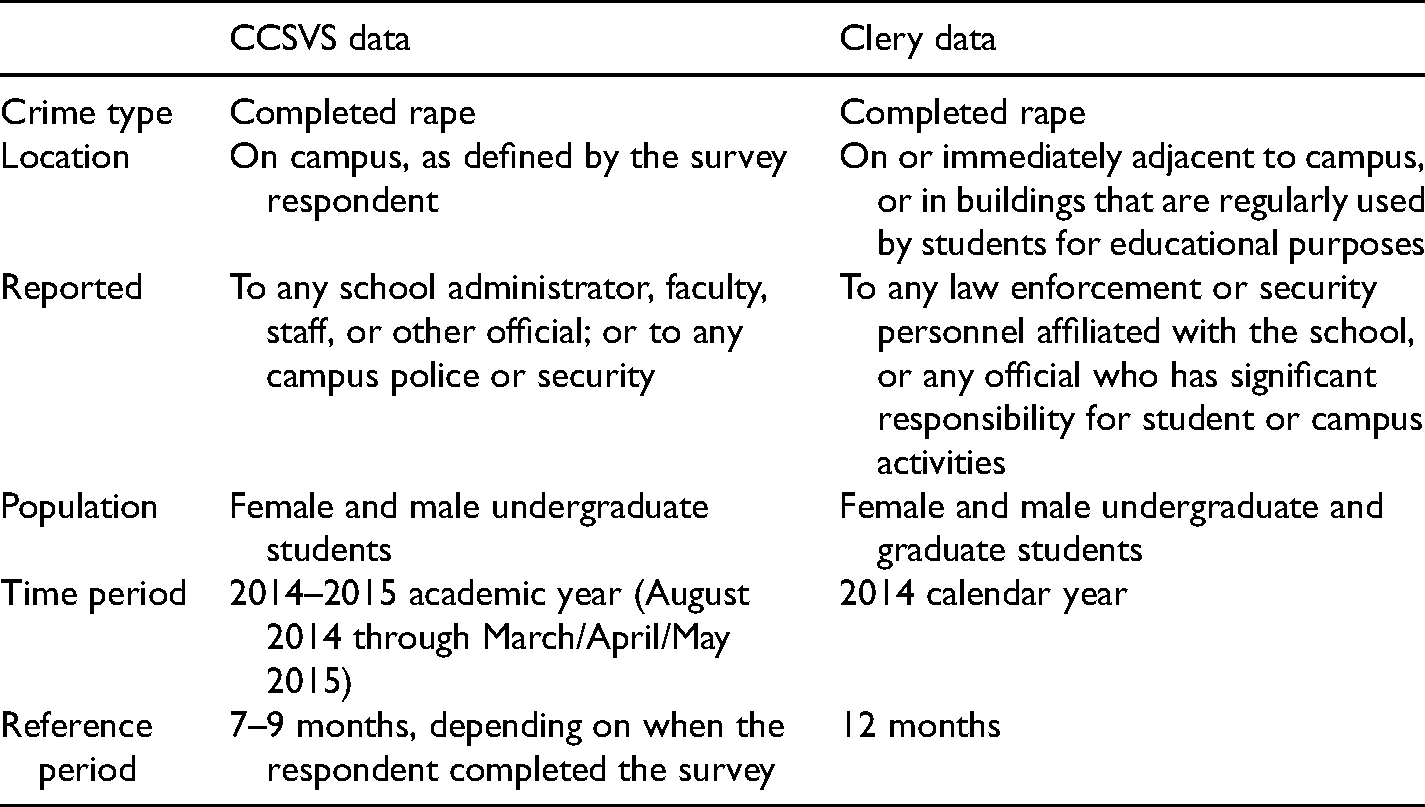
Clery Act data were obtained for the nine schools participating in the CCSVS from the Department of Education's Campus Safety and Security website (http://ope.ed.gov/campussafety/#/institution/list) for the calendar year 2014. To ensure that the CCSVS data and the Clery Act data were compared in as credible a manner as possible, some decisions were made in terms of which incidents would be included in the comparison. These decisions related to the nature of the incident, to whom the incident had been reported, and the location of the incident. By definition, incidents represented in the Clery Act data had to be reported to school authorities (including administrators, faculty, or other officials or staff at the school) or campus police, and had to occur on or immediately adjacent to campus. Therefore, it was decided that the most appropriate comparison would be between incidents reported under the Clery Act and the subset of incidents self-reported in the CCSVS data that had these characteristics. In addition, it was decided that only incidents involving completed rape would be included, to allow for the best comparison. This is because completed incidents of rape are more likely to be reported to authorities, and therefore are more likely to be represented in the Clery Act data, than other sex offenses, such as sexual battery incidents. Table 1 presents characteristics of the CCSVS and the Clery data so it is clear exactly which estimates were compared.
Characteristics of the Campus Climate Survey Validation Study (CCSVS) and Clery Act Data.
The nine schools that participated in the CCSVS reported a total of 40 completed rapes under the Clery Act for 2014, which by definition occurred on or immediately adjacent to campus and had been reported to school authorities or campus police or security. Because Clery data are not broken out by student characteristics, these rapes could have been experienced by male or female students, and graduate or undergraduate students.
Based on self-reported data from the CCSVS on the number of completed rapes reported by undergraduate men and women at the nine participating schools, an estimated 2,380 incidents of completed rape occurred across the nine schools during the 2014–2015 academic year, which was the primary reference period for the CCSVS. The 2014–2015 academic year does not align perfectly with the reference period for the Clery Act, the calendar year 2014, but the fact that the time periods overlap lends credibility to the comparison since the number of rapes occurring from year to year is relatively stable. Of the 2,380 rape incidents, 770 (32%) occurred on campus (according to the respondent) and 170 (7%) were reported to school authorities or campus police/security; however, only 60 of the 2,380 rape incidents (2.5%) identified in the CCSVS occurred on campus and were reported to school authorities or campus police/security (see Figure 1). Because the CCSVS data were collected from a representative sample of students, the resulting estimates have a confidence interval or margin of error around them, and for the estimate of incidents that occurred on campus and were reported to school authorities or campus police/security, the margin of error is between 30 and 90 rape incidents. In other words, less than 3% of all completed rapes captured by the CCSVS would be expected to be included under Clery Act reporting standards, and the number of rapes that occurred on campus and were reported to school authorities or campus police estimated with the CCSVS data (60) was not statistically different from the comparable number of rape incidents actually reported under the Clery Act (40) by the nine schools.
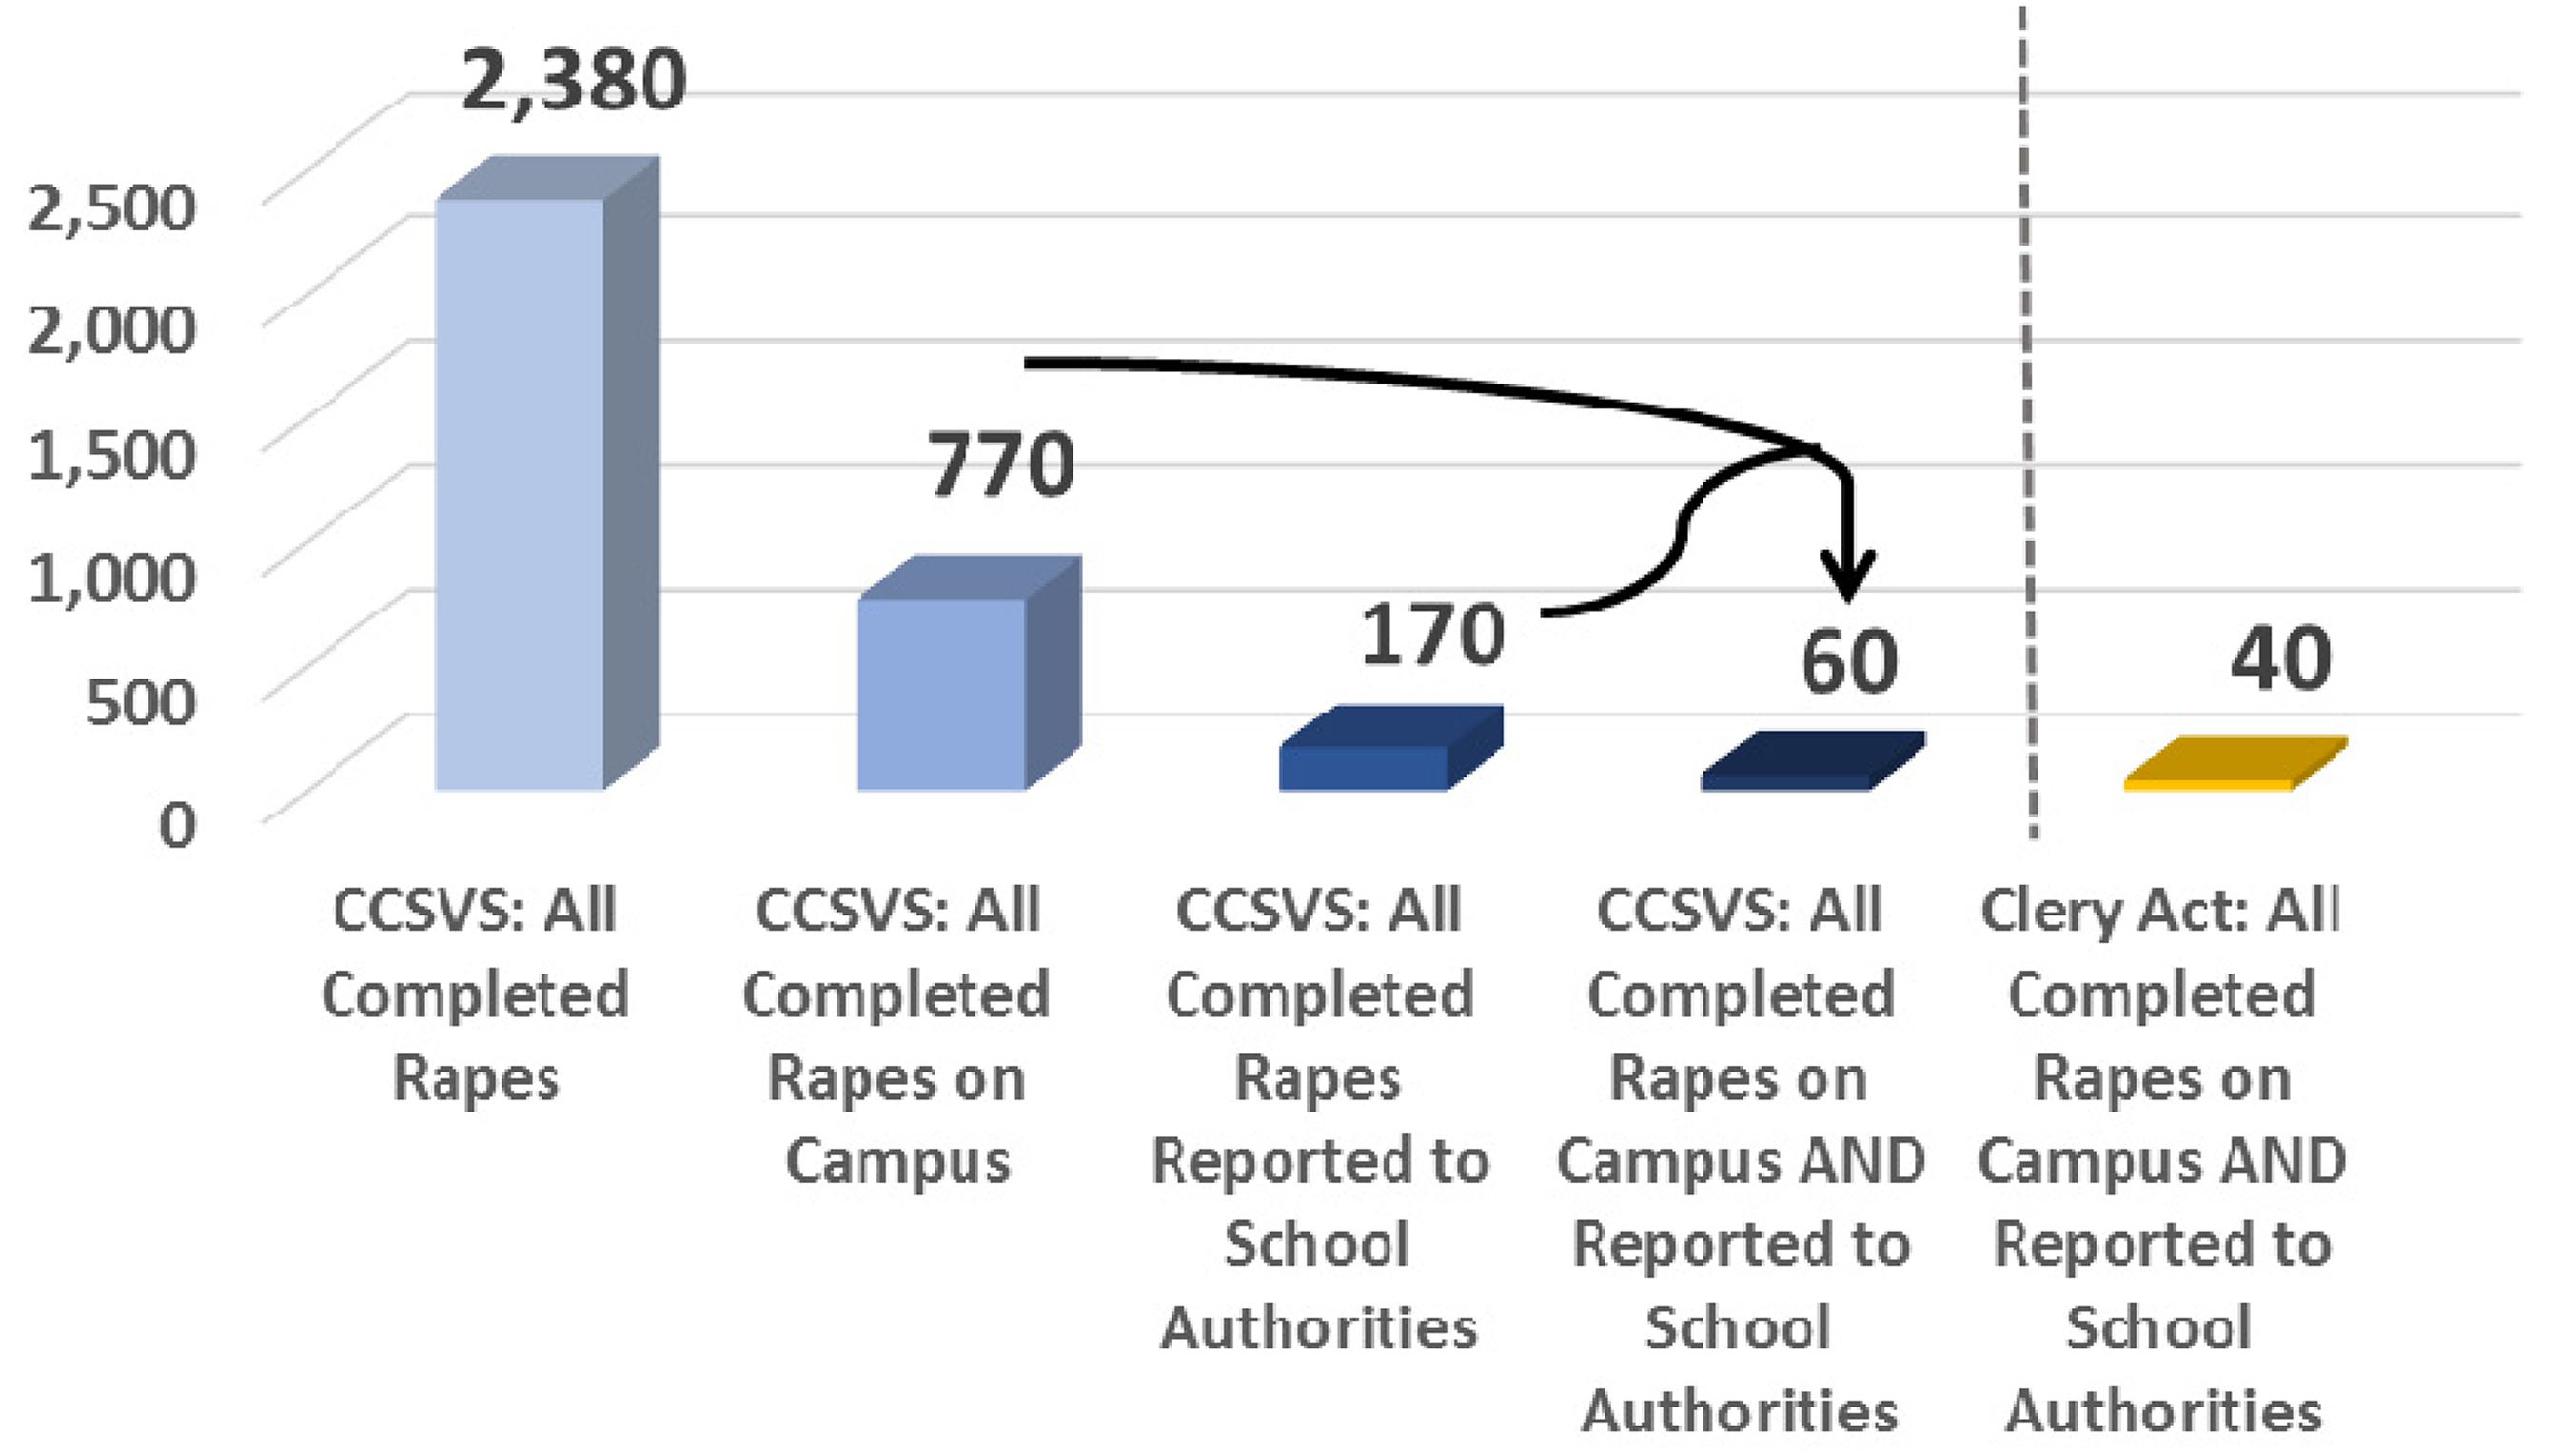
Comparison of the number of rapes identified in the Campus Climate Survey Validation Study (CCSVS) and the Clery Act data.
Discussion
The Clery Act data and the CCSVS data appear to converge in terms of the number of rape incidents that were committed on campus and reported to school authorities or campus police/security. This convergence illustrates two points. First, when compared against the Clery Act data, which represents an official source of data on the number of rape incidents, the fact that the self-reported CCSVS data generate an equivalent number of rape incidents eligible for reporting under Clery appears to support the validity of the CCSVS data. In other words, CCSVS respondents self-reported approximately the same number of incidents that one would expect based on their schools’ official statistics. If one believes that Clery Act data accurately reflect what they are intended to represent–in this case, the number of completed rapes that occurred on or adjacent to campus and were reported to school authorities or campus police/security–then the self-reported CCSVS data appear to be similarly accurate. Second, when compared against the self-reported CCSVS data, the fact that the Clery Act data show approximately the same number of incidents as what students reported in a confidential web-based survey appears to support the validity of the Clery data. In other words, the nine schools that participated in the CCSVS appear to have reported the number of rape incidents under the Clery Act that one would have expected these schools to report based on what students indicated they experienced in the confidential, self-reported survey. This could suggest that the nine schools that participated in the CCSVS are not suppressing or manipulating downward their Clery Act data.
The more important take-away from this analysis, however, is that official statistics, like those collected and reported under the Clery Act, represent only a small fraction of the rape incidents that are experienced by students. Schools never learn about the vast majority of sexual victimization incidents that are experienced by their students. Unfortunately, this means that schools never have the opportunity to report most sexual crimes through Clery, or more importantly, to investigate the incidents, provide services to victims, hold the perpetrators accountable, and discover patterns among their students and the culture on campus that could be used to inform policies and practices related to preventing and addressing sexual victimization. One way to develop a more accurate understanding of the prevalence and incidence of rape and sexual assault experienced by college students is to conduct methodologically rigorous surveys of students that enable them to share information about their sexual victimization experiences in a private, safe, and confidential manner.
Some caution should be used in interpreting these findings due to slight measurement differences between the CCSVS and Clery Act collections. Clery uses a calendar year reference period, whereas the CCSVS was administered in the Spring of 2015 and asked about incidents that occurred since the beginning of the 2014–2015 academic year. The reference period for CCSVS was therefore shorter, about 7–9 months. However, this represents the period that most students would be present on a college campus and suggests that the number of incidents would not likely increase dramatically if a 12-month reference period were used. In addition, the Clery data include all students, undergraduate, and graduate females and males, whereas the CCSVS represents only undergraduate females and males. However, a recent study that generated separate sexual assault estimates for graduate students and undergraduates found that female undergraduate students had estimated rates of nonconsensual sexual contact involving physical force or incapacitation that were three times higher than graduate/professional students (Cantor et al., 2015). Therefore, the exclusion of graduate students from the CCSVS estimate likely had minimal impact on the overall rape estimate. Finally, the Clery data could include incidents experienced by students who later dropped out of school (or transferred to another institution) after the incident and, therefore, did not have the opportunity to participate in the CCSVS. Although the precise influence of these measurement differences on the current comparison is unknown, the likely direction of the influence is that the CCSVS counts are smaller than they would have been if the comparison were in perfect alignment (e.g., if the CCSVS covered a 12-month reference period, and included graduate students and students who had transferred or dropped out). It is also possible that some students, when completing the CCSVS, provided false-positive responses (i.e., reported experiencing something we defined as rape when they did not) or false-negative responses (i.e., reported not experiencing something we would have defined as rape when they did), but the Clery Act data could similarly be impacted in either direction by this same potential threat to validity.
Even with these caveats, the CCSVS data show that the vast majority of rapes are not reported to school authorities or campus policy/security, and are thus not represented in an institution's Clery Act numbers. Self-reported, confidential surveys such as the CCSVS can produce a more complete picture of rape and sexual assault incidents experienced by students and provide detailed data about the characteristics of these incidents. Schools, in turn, can then use this information to inform their efforts to improve their prevention programs, service delivery, investigations, and related policies and practices. When implemented in a methodologically rigorous, standardized manner, climate surveys can also be used to compare estimates (and incident characteristics, such as reporting rates) across schools and over time, potentially allowing for a better understanding of variation across schools and the impact that programs, policies, and practices have on sexual victimization prevalence and reporting rates over time.
Footnotes
Declaration of Conflicting Interests
The authors declared no potential conflicts of interest with respect to the research, authorship, and/or publication of this article.
Funding
The authors disclosed receipt of the following financial support for the research, authorship, and/or publication of this article: This work was supported by the Office of Justice Programs, Bureau of Justice Statistics (grant no. 2011-NV-CX-K068).