




Abstract
This article investigates the relevance of spatial assimilation theory in Copenhagen, Helsinki, Oslo, and Stockholm. An important backdrop is the “Nordic model of welfare”: We assume that welfare generosity decreases the speed of spatial integration. The study uses non-Western immigrants as a target group and natives as a reference group. We register location in 2000 and 2008, and analyze integration in terms of neighborhood status and residential segregation. The results show, in all cities, a lack of aggregate upward mobility in the spatial hierarchy. We also find a negligible effect of upward earnings mobility on upward spatial mobility. Upward spatial mobility increases integration in ethnic terms, but other factors work in the opposite direction and contribute to prevailing segregation. The results as a whole strengthen the purported association between welfare state characteristics and spatial integration. Deviant outcomes, particularly in Helsinki, are explained by immigration history and housing market structure.
Spatial assimilation theory has received growing attention in European segregation research (Bolt and van Kempen 2010; Lersch 2013; Macpherson and Strömgren 2013; Magnusson Turner and Wessel 2013; Schaake, Burgers, and Mulder 2014; Skifter Andersen 2010; Zorlu and Mulder 2008). Most studies corroborate the crux of the theory: Cohorts of immigrants achieve proximity to natives through an upward trajectory that involves employment, income, education, and residence. The pattern, however, is far from uniform. There are differences between cities and countries that call for comparative research.
Our aim in this article is to explore spatial integration in four Nordic cities, Copenhagen, Helsinki, Oslo, and Stockholm, in the context of welfare state characteristics. Previous research has suggested that welfare systems affect the level of ethnic residential segregation through taxes, transfers, and public services, sometimes strengthened and sometimes counterweighted by housing provision and housing structure (Arbaci 2007; Wusten and Musterd 1998). The analytical logic in our study switches attention to individual adjustment and performance instead of macro-level outcomes. What we search for is a counterintuitive implication of welfare politics and egalitarian ideology, related to stability and reproduction of differences. The analysis is guided by two questions:
The suggested relationship is counterintuitive for several reasons. First, it is tempting to assume that individual-level integration and macro-level segregation are two sides of the same coin, that is, if Nordic cities are marked by weak segregation, then they should also exhibit fast spatial integration. Second, the association between equality and upward social mobility proves to be positive in empirical studies (Organisation for Economic Co-operation and Development [OECD] 2011). Third, and highly important, some of the Nordic countries appear with flattering results in rankings of integration policies (e.g., Huddleton et al. 2011).
Why, then, do we expect a slow pace of spatial integration? The arguments we advance relate to political, economic, and cultural characteristics. Welfare policies, particularly redistributive policies, may affect spatial integration through a double compression of differences, first in the system of social stratification and next in the social hierarchy of places. This compression implies that immigrants are integrated into urban contexts where opportunities are determined by a complex interplay of different factors and not only by earnings. It further implies that poor neighborhoods have been lifted to a higher standard through subsidies and regulations. Low-income immigrants may therefore perceive their neighborhood as adequate in terms of physical attributes, safety, transport facilities, and public services. A rather different point concerns immigrants’ adjustment to the labor market. If immigrants remain dependent on welfare, they will also remain concentrated in low-income areas. The very same outcome might appear if natives, due to the egalitarian heritage, engage in discriminatory practices, for example, labor market discrimination and selective migration.
Social and spatial equality are obviously intended outcomes of the welfare state. As such, this factor represents a benign influence: It reduces the need for upward spatial mobility. Lack of work and native discrimination, by contrast, are harmful influences that reduce the opportunity for upward spatial mobility. And as previous research suggests, spatial integration may facilitate economic participation (Dawkins, Shen, and Sanchez 2005; Massey 1985), cross-ethnic friendships (Huckfeldt 1983), and intermarriage (South and Messner 1986). Even sustained minority concentration that can be linked to redistributive policies may be seen as a problem in the Nordic context, given that mutual understanding and generalized trust form the “glue” of the welfare model (Rothstein and Stolle 2008). On this basis, one should not be surprised that residential segregation is a recurrent theme in Nordic political debate. Sharing neighborhoods is often viewed as a reinforcement of core values that underpin the welfare state (Olsson Hort 1992).
Our attention in the article is directed at the welfare state frame as a whole, that is, the “Nordic model of welfare.” It would have been desirable to use identical evidence from non-Nordic cities to assess the pace of integration. Such data are, unfortunately, not available. What we can do, however, is to utilize emerging differences between the Nordic countries.
We study the capital region of each country, and explore economic and spatial mobility over eight years, from 2000 to 2008. The analysis is confined to immigrants from Asia, Africa, and Latin America, with native Danes, Finns, Norwegians, and Swedes as reference groups. Two general points should be noted here. First, we are interested in the encounter between immigration and a reception context with unique historical features. It is not only the welfare model that contributes to a Nordic Sonderweg, as some historians call it. Equally important, and linked to the welfare model, is the history of ethnic relations. The Nordic countries do have older ethnic minorities, but these groups were to a large extent suppressed during the nation-building period in the twentieth century. All four countries pursued assimilationist policies as late as the 1950s, with minimal space for cultural difference (Hilson 2011). Immigration from distant parts of the world is thus a significant historical event, a drift away from ethnic, linguistic, and cultural homogeneity. It fits into the same picture that immigrants from all parts of Europe have a much lower level of segregation in Copenhagen, Oslo, and Stockholm (Skifter Andersen et al. 2015). The second point concerns the timing and size of immigrant flows. The recency of large-scale immigration to Helsinki makes it difficult to conduct a cross-case analysis of two generations. It is also difficult to pick single ethnic minorities that are sufficiently large in all four cities.
We continue with a brief overview of key patterns in the four cases. The subsequent sections present spatial assimilation theory, data and methods, neighborhood transitions, and, finally, conclusions.
A few words on concepts are appropriate. We use “spatial integration” and “spatial assimilation” as synonyms for an increasing fit between the settlement patterns of natives and immigrants. The key group in the study is labeled “immigrants” and “non-Western immigrants,” with no distinction between the two.
The Integration Context
Welfare state policies in the Nordic countries converge around economic/social equality, universal rights, and egalitarian ideology. Other important features concern labor market participation, social cohesion, trade union membership, labor market cooperation, and generous benefits. The legacy of this model, known as the “Nordic model,” is built through decades, and involves a diffusion of policies and institutions within the region, with Sweden ahead, Denmark and Norway not far behind, and Finland a “late developer” (Arter 2008). 1
Much of the variation in the development of the Nordic model can be explained by economic growth. Economic contraction may, in the same way, explain challenges to the model. Several episodes and shifts (industrial decline, conjunctural crises, the collapse of the Soviet market, and the impact of demographic aging) have led to welfare reforms and individualization of social risks, starting in Denmark in the early 1990s.
A summary of the new differences is given in Table 1. The data are extracted partly from OECD statistics (OECD Social Expenditure Database), relating to public spending, and partly from the “Comparative Welfare Entitlements Dataset” (CWED 2), relating to institutional features of welfare programs (Scruggs, Jahn, and Kuitto 2014). The CWED series represent a comprehensive effort to extend and improve the decommodification scores in Gosta Esping-Andersen’s (1990) “The three worlds of welfare capitalism.” The latest version, CWED 2, includes information about benefit replacement rates (the proportion of income that is replaced by benefit), duration of benefits, eligibility criteria, and program coverage. Scores (z-scores) for three programs, unemployment, sickness, and pensions, are summed and subsequently multiplied by the coverage rate (for unemployment and sickness) and the take-up rate (for pensions). A final step summarizes the results in five indices that capture the level and development of “welfare generosity” in each country. The most relevant of these indices for our purpose are the combined generosity index (TOTGEN) and the unemployment generosity index. Both measures are logically constructed, with increasing values representing increasing generosity (for a further description, see Scruggs 2014).
Indicators of Welfare Generosity, 2000–2009.
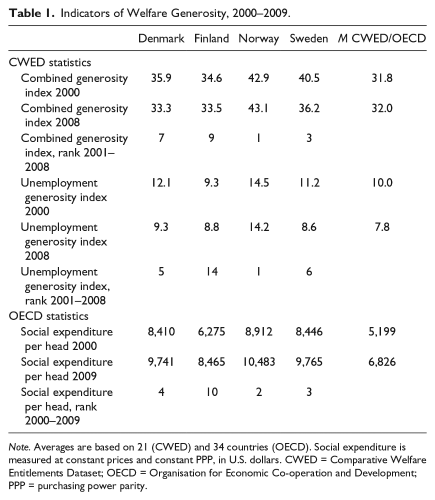
Note. Averages are based on 21 (CWED) and 34 countries (OECD). Social expenditure is measured at constant prices and constant PPP, in U.S. dollars. CWED = Comparative Welfare Entitlements Dataset; OECD = Organisation for Economic Co-operation and Development; PPP = purchasing power parity.
The most immediate impression from Table 1 is that Sweden has made a radical adjustment in its institutional-redistributive model. Government spending on welfare has been cut through changes in benefit levels, eligibility criteria, duration periods, and user fees. As a result, Sweden no longer serves as the best example of social democratic welfare policies. This role is now taken by Norway, which is ranked number one in the CWED series. Altogether, the data in Table 1 may be summarized in three levels of welfare provision. At the upper end, we find Norway, followed by Denmark and Sweden in the middle, and Finland at the bottom. Going back to 1990, Norway and Sweden emerged at the top, with Denmark and Finland a bit lower (Scruggs 2006).
Some background statistics for the four city regions (“cities” hereafter) are given in Table 2. We see, first, that all cities are marked by economic prosperity and progress. The presence of immigrants follows the national pattern, and can be explained in historical and political terms. Stockholm, just like Sweden, started to receive labor migrants on a notable scale in the mid-1960s, somewhat before Copenhagen and Oslo, and several decades before Helsinki. The same order exists for arrival of refugees, asylum seekers, and family migrants—Stockholm experienced large-scale influx of these groups somewhat before Copenhagen and Oslo, and long before Helsinki. Partly as a result, Stockholm has for long been more segregated than Copenhagen and Oslo, which in turn are more segregated than Helsinki. The differences are particularly pronounced for immigrants from Africa, Asia, and Latin America.
Demographic and Economic Indicators for Copenhagen, Helsinki, Oslo, and Stockholm.
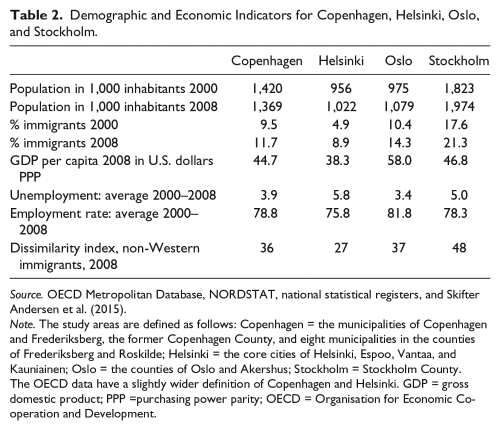
Source. OECD Metropolitan Database, NORDSTAT, national statistical registers, and Skifter Andersen et al. (2015).
Note. The study areas are defined as follows: Copenhagen = the municipalities of Copenhagen and Frederiksberg, the former Copenhagen County, and eight municipalities in the counties of Frederiksberg and Roskilde; Helsinki = the core cities of Helsinki, Espoo, Vantaa, and Kauniainen; Oslo = the counties of Oslo and Akershus; Stockholm = Stockholm County. The OECD data have a slightly wider definition of Copenhagen and Helsinki. GDP = gross domestic product; PPP =purchasing power parity; OECD = Organisation for Economic Co-operation and Development.
The Specifics of Spatial Integration 2
Park (1926) and Massey (1985) argued that residential integration is an important step in the larger process of immigrant integration: Immigrants will initially reside in undesirable, low-status neighborhoods, usually in the inner city. The dispersion from these neighborhoods is contingent upon a combination of increasing socioeconomic means and adjustment to mainstream culture (acculturation). Successful immigrants will, as part of the success, translate socioeconomic gains into higher-quality housing and neighborhoods. Less important but not negligible is a growing incentive to reside near the native majority (Alba and Nee 2005).
The driving forces behind spatial assimilation (social/economic mobility and acculturation) are expected to reflect economic structure, the level of urbanization, and other regional characteristics (Massey 1985). Politics and ideology, however, are not mentioned as part of the causal background. Thus, we had to look for arguments in related fields of research.
The first argument is economic in nature and relates to social stratification. A high degree of economic and social equality, combined with the dual breadwinner model, may affect mobility in several ways. It implies, first, a diluted relationship between economic rewards and housing market choice. Individuals who climb to a higher income rank will often experience a minor leap in purchasing power. Hence, although they are better off, their ability to change residence is easily counterweighted by other factors, for example, rising transaction costs, loss of partner, or (for tenants) rising housing prices.
The second argument concerns perceptions, preferences, and responses that are shaped by welfare entitlements: Low-skilled or unskilled individuals who face a small difference, or no difference at all, between public transfers and earned income may abstain from work (Brochmann and Hagelund 2012; Koopmans 2010). This argument is obviously well known in urban debate, particularly through the Murray–Wilson exchange in the 1980s. The present idea, however, differs in several respects from Murray’s harsh attack on social programs (Murray 1984) and even from Wilson’s portrait of pathological behavior in jobless neighborhoods (Wilson 1987). What is proposed is a limited economic adaptation, and not a pervasive pattern of dysfunctional values and behaviors. One specific claim is that natives and immigrants face different sources of relative deprivation. Natives who receive public transfers are likely to compare their current situation with better-off natives or with a favorable past situation. The same applies for many immigrants, but some immigrants may look backward, at their destitute situation before emigration, or outward, at family members and friends in the country of origin (Koopmans 2010; Zhang and Sanders 1999). A larger proportion of native recipients may thus feel severely deprived and, thereby, pushed toward work or education. Another claim is that immigrants, contrary to natives, face significant integration costs (language training, practical training, adapting to a new set of behavior, etc.) to enter work (Nannestad 2007).
The proposition that immigrants “assimilate into welfare” is obviously contested. A recent OECD (2013) Outlook report concluded that the fiscal impact of immigration is positive in most European countries, including the Nordic countries. Several Nordic studies have, on the contrary, documented a slow rate of economic assimilation among immigrants from non-European or non-OECD countries (Bratsberg, Raaum, and Røed 2010; Hammarstedt and Shukur 2006; Nannestad 2007). The big question, of course, is whether slow assimilation can be linked to welfare politics. Various studies do not agree upon this point; hence, what we do here is to present an argument that may or may not be justified.
The third argument corresponds closely to the first: There is a limited differentiation between neighborhoods of different quality in Nordic cities. Planning and policies aim, above all, to equalize the quality of schools, kindergartens, and other public services across urban districts. Other policies and measures include neighborhood planning, mixed tenure neighborhoods, and regeneration programs that target differences in housing quality, green spaces, and transportation infrastructure (Andersson 1999, 2006; Skifter Andersen 2002). These activities reinforce each other and are likely to attenuate the relationship between economic mobility and spatial integration. The equalizing effect is largest at the bottom of the housing market, where many redistributive measures, some citywide and some area-based, coincide. Even here, however, it is always a question of reduced differences.
The fourth argument invokes the environment within which institutions are embedded. Nordic politics have evolved within a specific cultural framework, which, just like politics, converges around a strong egalitarian value orientation (Graubard 1986). This framework is potentially threatened by increasing ethnic diversity, as argued by Hagelund (2002). The perceived threat may in turn have a bearing on contact, tolerance, and diversity. From our perspective, the most important effect would be “native flight,” that is, the tendency for natives to leave multiethnic neighborhoods, or “native avoidance,” that is, the tendency for natives to select themselves into less diverse neighborhoods. At least some research (e.g., Bråmå 2006) confirms that such mechanisms influence housing market behavior in Nordic cities.
The arguments presented above concern both socioeconomic gains and the translation of such gains into better neighborhoods. We further include effects of immigrant as well as native behavior, and relate behaviors to Nordic egalitarianism. One omitted argument suggests that particular groups of immigrants have been self-selected to the Nordic countries. If such a pattern obtains, it clearly has causal relevance. Self-selected immigrants may initially settle in ethnic territories and prefer to stay in these areas. However, given our research design, we cannot pursue influences that stretch beyond the Nordic context. Altogether, we end up with four hypotheses:
The first hypothesis is tested by statistics of labor market participation and earnings mobility, looking at sample means. The second hypothesis is tested by two contrasts, first between immigrants with different degrees of economic success (earnings mobility and labor market activity) in each city, and second between immigrants and natives in each city. The third hypothesis is tested by segregation indices, which are loosely compared with previous European research. Finally, we assess hypothesis four by a comparison of changes and stability in the four cities, using the analysis of welfare provision (Table 1) as a benchmark.
Data, Methods, and Descriptive Statistics
The main part of this study is based on panel data that derive, either directly or indirectly, from national statistical registers. One case, Helsinki, relies on a 10% sample of the native population and a corresponding 33% sample of the immigrant population. The three other cases include complete population samples.
We restrict the analysis according to three criteria. First, we only include individuals who lived in the respective regions throughout the period 2000–2008. Second, our target is the population of working age, so we omit people of dependent age. We also omit some cohorts due to limited data coverage in three of the cities (Copenhagen, Helsinki, and Oslo). The samples, hence, consist of individuals who were between 25 and 49 years of age in 2000. Third, we focus on one single but broad category of immigrants, people from Asia, Africa, and Latin America, who are compared with natives. Immigrants are restricted to first-generation arrivals.
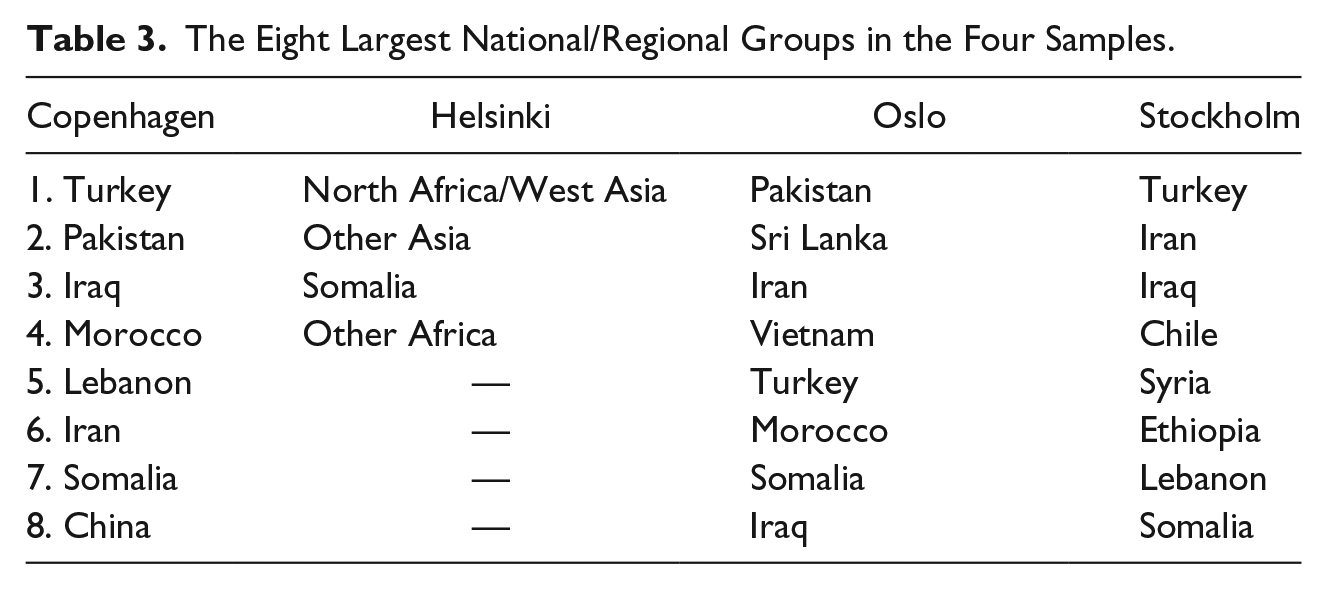
Our choice of a big lump category (“non-Western immigrants”) is not ideal, as some cities may have a larger share of upwardly mobile groups than others. We are, however, unable to detect any particular bias in the data. The composition of backgrounds in Copenhagen, Oslo, and Stockholm is quite similar at the level of continents and subcontinents, although with a larger share from Latin America in Stockholm and a larger share from East Asia in Oslo. Helsinki has a pattern that reflects international migration flows in the 1990s and 2000s, with large shares from Sub-Saharan Africa and East Asia. The differences between Copenhagen, Oslo, and Stockholm are larger at the national level, but four groups (Turks, Iraqis, Iranians, and Somalis) are among the eight largest minorities in the three cities (Table 3).
The Eight Largest National/Regional Groups in the Four Samples.
The analytical strategy is twofold. First, we strive to analyze the four cities as one case, an urban offshoot of the Nordic model. Our second mode of analysis has the opposite aim, that is, we search for differences within the Nordic context: Do the cities diverge in terms of social and spatial integration despite the common political heritage? Moreover, can we link different outcomes to the recent variation in welfare politics?
We present three types of output: first, a descriptive overview of population characteristics and economic mobility; second, a set of regression models of spatial mobility; and third, a subdivided calculation of segregation levels, measured by the dissimilarity index (D values). This latter analysis gauges whether upward spatial mobility increases proximity between immigrants and natives.
The models of upward spatial mobility are estimated separately for immigrants and natives. To facilitate comparison across models (Mood 2010), results are reported as average marginal effects (dy/dx, calculated in the margins command of STATA). Average marginal effects can be interpreted as the average percentage change (unit effect) in the probability of a particular outcome, calculated over all included individuals. The models include control for educational level, initial neighborhood status (year 2000), gender, age, civil status, family situation (married/couple or single), number of children, housing tenure, and duration of stay (only for immigrants).
We provide significance levels for all four cases even if three of them include total population samples. The reason for this is that we choose a particular time interval from a theoretical universe of many intervals. Two additional tests are given for the key independent variable. One test contrasts natives and immigrants in each city; the other one contrasts immigrants in the four cities.
Dependent Variable
Spatial mobility in this study is restricted to relocation across neighborhoods. We measure and compare neighborhood status in 2000 and 2008, and include both movers and nonmovers. Eight years may seem like a short period of observation, given the protracted nature of economic and spatial mobility. But eight years is still an interval during which there should be some signs of spatial integration. Corresponding time spans in previous European research are two years (Bolt and van Kempen 2010; Schaake, Burgers, and Mulder 2014), four years (Zorlu and Mulder 2008), six years (Macpherson and Strömgren 2013; Skifter Andersen 2010), one to nine years (Lersch 2013), nine years (Pan Ké Shon 2010), and 10 years (Magnusson Turner and Wessel 2013; Simpson, Gavalas, and Finney 2008). Note also that we control for length of residence in each country.
The neighborhoods are aggregates of census tracts and range in average size from 1,400 in Copenhagen to 3,000 in Helsinki and Oslo, counting only the adult population (20+). We consider these units to capture the notion of neighborhood rather well, as all four countries strive to maximize accordance with physical and social features in the urban landscape. The municipalities play a key role in this work to avoid artificial boundaries. That said, we would have preferred to construct the scale ourselves. Such methodology (see Östh, Clark, and Malmberg 2015) is currently hampered by legal restrictions in three of the countries (Denmark, Finland, and Norway).
Our measurement of neighborhood status relies on a socioeconomic index with three unweighted indicators, all relating to individuals aged 25 to 49: (1) share with upper secondary school as the highest level of completed education, (2) share with gross earnings in the lowest quintile, and (3) level of unemployment. The index is constructed in three steps: (1) neighborhoods are ranked on each indicator, (2) each distribution is aggregated into 10 groups (deciles) ranging from low to high values, and (3) the position in the spatial hierarchy is estimated as the average of the three decile values. 3 Finally, we construct three classes of individual mobility. “Upward” and “downward” mobility include individuals who moved to a socioeconomically higher and lower neighborhood class, respectively. “Others” are those who remained in the same neighborhood or moved to a neighborhood in the same socioeconomic class. Individuals who moved out of the region are excluded from the analysis. 4
Explanatory Variables
Simple logic suggests that housing choice increases with the amount of economic resources. Spatial assimilation theory requires in addition that economic resources are obtained through economic activities, primarily market-based resources.
These concerns lie behind our choice of earnings mobility as the key independent variable. Two years, 2000 and 2008, are compared, using the calendar year (annual earnings) as the basis of comparison. Upward and downward mobility require that individuals have some earnings in both years and that they move at least five percentiles up and down, respectively, in the frequency distribution of earners. The reference category is “stable earnings,” which includes those who remain within the confines of plus/minus five percentiles. We also include separate categories for individuals who lacked earnings in one or both years, partly as an attempt to reduce endogenous selection bias (Winship and Elwert 2014). The inclusion of un-/nonemployed individuals (“others”) secures a broader and more relevant basis for the assessment of upward mobility.
A sensitivity test for Oslo indicates that five-percentile change is a suitable trade-off between increasing effect size and decreasing group size. The measured effect on upward mobility increases in a fairly linear fashion up to five to seven percentiles, where it flattens out. Moving from five to 20 percentiles increases the effect by 22%.
We further include a set of control variables, which are meant to isolate the impact of earnings mobility. Age is divided into three categories, measured in 2000: (1) 25 to 34, (2) 35 to 44, and (3) 45 to 49. Gender takes the value of 0 for women and 1 for men. Civil status measures the status as “single” or “couple” (married or registered partner) in 2000 and 2008: (1) single both years, (2) from single to couple, (3) from couple to single, and (4) couple both years. Children in the household are defined as the number of people below 18 years of age, measured in 2000 and 2008: (1) no children in either year, (2) same number of children both years, (3) plus one child, (4) plus two children or more, (5) minus one child, and (6) minus two children or more. Two additional variables capture socioeconomic position but are not counted as key outcomes. Housing tenure is coded 1 for homeowners, measured in 2000–2001. Highest completed education separates between “low” and “high” education, measured in 2000 and 2008: (1) low education both years, (2) from low to high education, (3) high education both years, and (4) no information on education. The threshold for “low” education is upper secondary school in three of the cities (Copenhagen, Oslo, and Stockholm) and lower secondary school in one city (Helsinki). Duration of stay is the number of years since immigrants arrived in the country. Finally, we also include a control for neighborhood status, measured in 2000.
Strengths and Limitations
One important strength of the current study is our access to national register data in four countries. The quality of the variables is generally very high, and the variables are substantively similar to one another. Highest completed education, however, is an exception. Some of the cities (Helsinki and Oslo) have many immigrants without registered education. Over and above this, we fully acknowledge that register data have their limitations. Potentially important factors that cannot be measured include labor market discrimination, social networks, language and xenophobia, all of which may influence the form and pace of spatial integration.
Descriptive Statistics
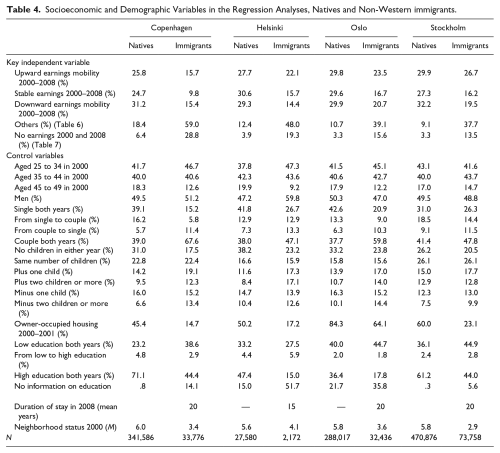
Summary statistics for the independent variables are given in Table 4. Four common features are apparent. First, attachment to the labor market is a critical factor in all four cities. The aggregate share of non-Western immigrants who lacked earnings/employment in one or both years (“others”) is three to four times higher than among natives. Second, despite differences in the historical development of immigration, we do not observe differences in mean duration of stay between Copenhagen, Oslo, and Stockholm. Helsinki is different, though, with few immigrants from the early wave of labor migration. Third, non-Western immigrants diverge from natives in terms of civil status, life stage, housing tenure, and initial neighborhood status. The former group has more couples, more households with children, more tenants, and a lower position in the sociospatial hierarchy. A logical implication is that natives have a smaller potential for improvement in neighborhood status. We further observe an important difference in housing tenure: Oslo has a much lower proportion of non-Western tenants than Copenhagen, Helsinki, and Stockholm.
Socioeconomic and Demographic Variables in the Regression Analyses, Natives and Non-Western immigrants.
Neighborhood Transitions
Spatial assimilation theory implies a strong thrust toward upward mobility among urban residents. Perhaps the best token of this assumption is found in numerous empirical studies that apply length of residence, that is, the mere passage of time, as an indicator of assimilation status (Alba and Nee 2005; Lieberson 1961; Simpson, Gavalas, and Finney 2008).
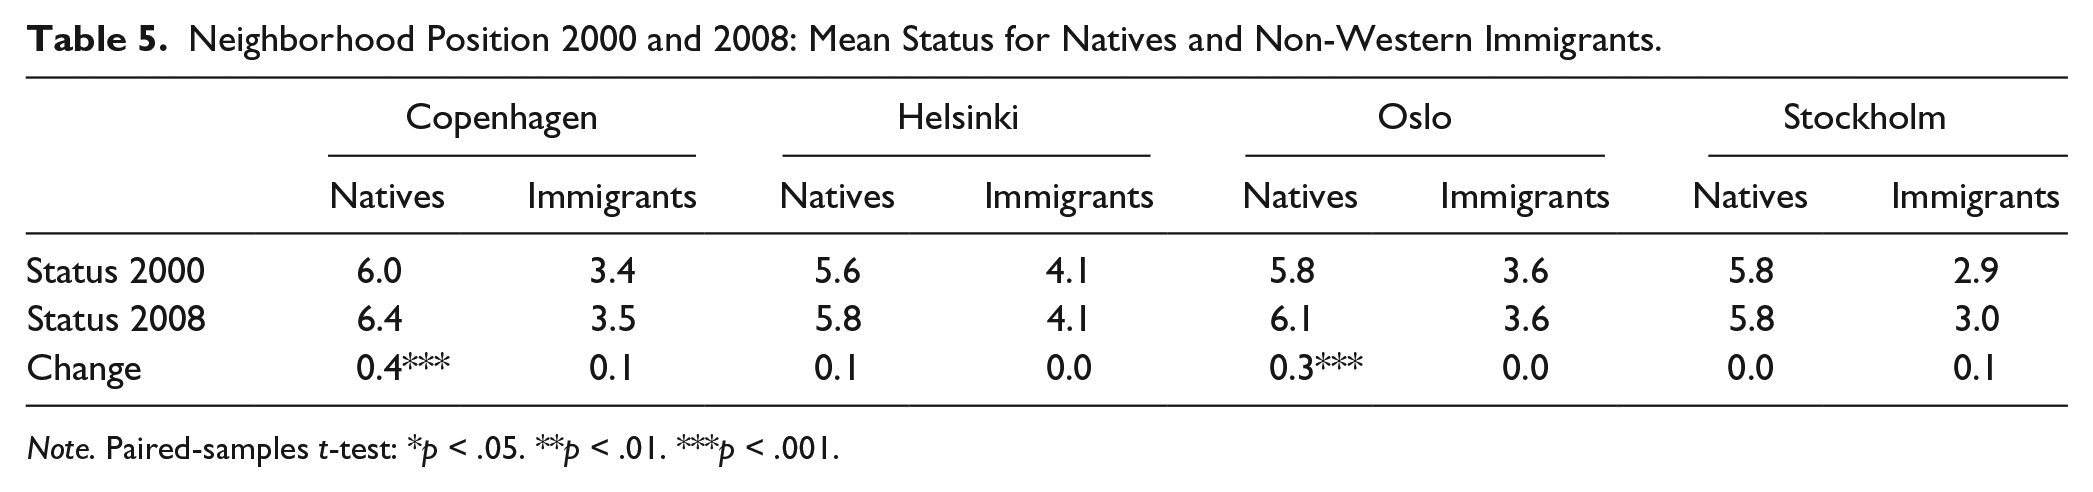
Our results are less encouraging. Non-Western immigrants do not, on average, improve their neighborhood status between 2000 and 2008 (Table 5). The same is true for natives in Helsinki and Stockholm, whereas natives in Copenhagen and Oslo improve their position.
Neighborhood Position 2000 and 2008: Mean Status for Natives and Non-Western Immigrants.
Note. Paired-samples t-test: *p < .05. **p < .01. ***p < .001.
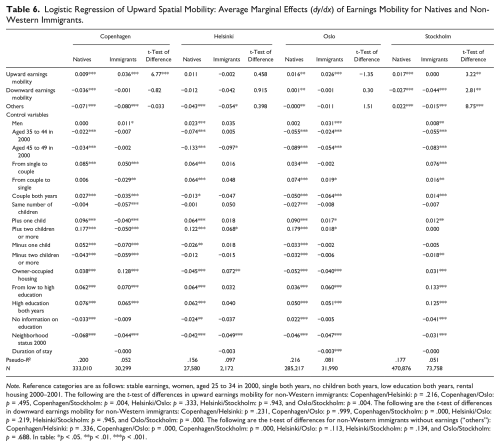
A lack of progress at the group level says a lot about urban ecology but less about locational attainment as an individual-level process. Is earnings mobility an important driver of upward spatial mobility? Our attempt at an answer is given in Table 6. The table reports average marginal effects for two groups of earners and one group with no earnings in 2000, 2008, or both years (“others”). Each coefficient expresses the average difference in the probability of upward spatial mobility compared with individuals with stable earnings (reference group). We see, as an example, that non-Western immigrants in Copenhagen who moved upward in the earnings distribution, that is, who improved their position by at least five percentiles, have the estimate 0.036. This means that the predicted probability for upward spatial mobility exceeds the probability of non-Western immigrants with stable earnings by 3.6 percentage points, after control for individual characteristics and initial neighborhood status. The corresponding estimate for Helsinki is −0.2 (nonsignificant), for Oslo 2.6, and for Stockholm 0.0 percentage points (nonsignificant). Two differences across the four cities, between Stockholm and Copenhagen, and Stockholm and Oslo, respectively, reach statistical significance (both p < .01).
Logistic Regression of Upward Spatial Mobility: Average Marginal Effects (dy/dx) of Earnings Mobility for Natives and Non-Western Immigrants.
Note. Reference categories are as follows: stable earnings, women, aged 25 to 34 in 2000, single both years, no children both years, low education both years, rental housing 2000–2001. The following are the t-test of differences in upward earnings mobility for non-Western immigrants: Copenhagen/Helsinki: p = .216, Copenhagen/Oslo: p = .495, Copenhagen/Stockholm: p = .004, Helsinki/Oslo: p = .333, Helsinki/Stockholm: p = .943, and Oslo/Stockholm: p = .004. The following are the t-test of differences in downward earnings mobility for non-Western immigrants: Copenhagen/Helsinki: p = .231, Copenhagen/Oslo: p = .999, Copenhagen/Stockholm: p = .000, Helsinki/Oslo: p = .219, Helsinki/Stockholm: p = .945, and Oslo/Stockholm: p = .000. The following are the t-test of differences for non-Western immigrants without earnings (“others”): Copenhagen/Helsinki: p = .336, Copenhagen/Oslo: p = .000, Copenhagen/Stockholm: p = .000, Helsinki/Oslo: p = .113, Helsinki/Stockholm: p = .134, and Oslo/Stockholm: p = .688. In table: *p < .05. **p < .01. ***p < .001.
A second test concerns the native/immigrant gap in neighborhood status. Our expectation is that immigrants have more to gain from upward earnings mobility than natives, given the large status gap in 2000. What we find, however, is a more complex pattern. Only one city, Copenhagen, conforms to the expectation, with a higher pace of upward spatial mobility among immigrants (p < .001). Stockholm has the opposite pattern (p < .01), whereas Helsinki and Oslo display nonsignificant differences between natives and immigrants.
The second subgroup in Table 6 experiences downward earnings mobility. Here, we observe significant differences in upward spatial mobility between Stockholm and Copenhagen (p < .001), and Stockholm and Oslo (p < .001).
Finally, looking at “others,” we see that Copenhagen has a large negative effect both for immigrants and natives. In other words, individuals without earnings in one or both years experience downward spatial mobility. The difference between Copenhagen on one hand and Oslo and Stockholm on the other is surprisingly large and highly significant in statistical terms (p < .001). The key question, of course, is whether Copenhagen sticks out due to welfare state characteristics. We cannot give a definite answer, but the pattern in Table 6 is generally consistent with national differences in employment protection. Employees in Denmark are, as documented by OECD statistics, weaker protected than employees in Finland, Norway, and Sweden (OECD 2010). The implication of this is clear: Individuals with a loose or insecure connection to the labor market may develop a careful approach to housing and housing location, based on the rationale that insecurity develops over time (Pidgeon, Kasperson, and Slovic 2003).
Most of the control variables yield results in the expected direction, for example, with a marked effect of high education on upward spatial mobility. Two exceptions are notable. First, while Copenhagen, Helsinki, and Stockholm display positive effects of homeownership, the opposite obtains for Oslo. Second, contrary to our expectation, we do not observe a positive effect of lengthy residence in the country. The former observation reflects the spatial distribution of housing tenures in Oslo, a topic we return to in the conclusion. The latter observation strengthens our key argument: Spatial integration in the Nordic context proceeds slowly and does not conform to the finer details of the assimilation model.
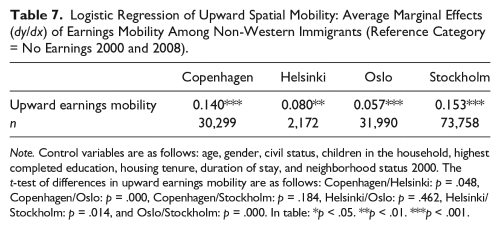
Our impression so far is that earnings mobility plays a negligible role in improving neighborhood status. It appears to be more important whether immigrants are firmly integrated in the labor market or not. All cities, even Helsinki, display significant negative effects for immigrants without earnings in 2000, 2008, or both years. A possible objection is that “others” in Table 6 stretches over many subgroups: Some are permanently unemployed/nonemployed; some move between jobs and unemployment; and some had not completed their education in 2000. The analysis in Table 6 is therefore repeated in Table 7, using individuals without earnings in both years as reference category. We restrict the presentation to immigrants who experienced upward earnings mobility.
Logistic Regression of Upward Spatial Mobility: Average Marginal Effects (dy/dx) of Earnings Mobility Among Non-Western Immigrants (Reference Category = No Earnings 2000 and 2008).
Note. Control variables are as follows: age, gender, civil status, children in the household, highest completed education, housing tenure, duration of stay, and neighborhood status 2000. The t-test of differences in upward earnings mobility are as follows: Copenhagen/Helsinki: p = .048, Copenhagen/Oslo: p = .000, Copenhagen/Stockholm: p = .184, Helsinki/Oslo: p = .462, Helsinki/Stockholm: p = .014, and Oslo/Stockholm: p = .000. In table: *p < .05. **p < .01. ***p < .001.
The results show a large and significant difference between Oslo and Copenhagen, amounting to 8.3 percentage points (p < .001), and Oslo and Stockholm, amounting to 9.6 percentage points (p < .001). This accords with our assumption regarding welfare state generosity: Individuals who are disconnected from the labor market face a more equal landscape of opportunity in a state with abundant public resources. We further notice a significantly weaker effect in Helsinki as compared with Copenhagen and Stockholm (p < .05).
There are, as noted, few studies with a comparable design. Some U.S. studies come fairly close, though, as they explore economic and spatial integration over time. These and other studies (e.g., Alba et al. 1999; Clark and Blue 2004; Iceland and Scopilliti 2008; Woldoff and Ovadia 2009) provide substantial support to the spatial assimilation model, although with great variations between minority groups.
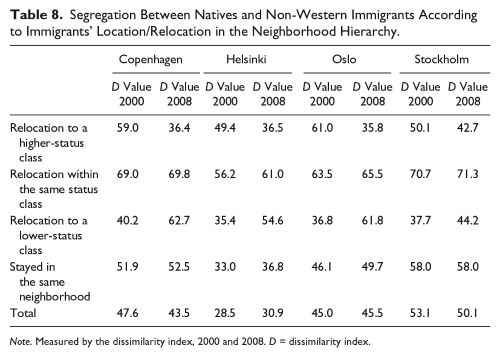
We will now, as the last step, explore how sociospatial integration corresponds to native/immigrant integration. The results, reported in Table 8, show that immigrants who move to higher-status neighborhoods achieve greater proximity to natives. Average reduction in the D value for this group is 17 percentage points, compared with a slight increase (two percentage points) among those who relocate within the same status class, and a substantial increase (18 percentage points) among those who move downward in the spatial hierarchy. The net result of all changes in D varies from a minor reduction in segregation in Copenhagen and Stockholm, via stability in Oslo, to a minor increase in Helsinki. It is intriguing to note that Stockholm displays a declining level of segregation despite a small change in all single categories. Relocation to a higher-status class, for instance, has the smallest bearing on native/immigrant segregation in Stockholm. Helsinki, by contrast, experiences increasing segregation in the target population despite a marked effect of upward sociospatial mobility. How can we explain this paradox? The most obvious answer is that Stockholm and Helsinki have reached different stages in the historical development of immigration and segregation. The ethnic geography of Stockholm has evolved over five decades, and reflects a large proportion of immigrants and a low proportion of natives on the lower rungs of the spatial hierarchy. This structure reduces, in plain words, the availability of natives as neighbors for successful migrant households. Helsinki has a larger proportion of natives at all levels in the spatial hierarchy. The data do not allow a safe assessment of native flight/avoidance, but they do point toward native behavior as a root cause of segregation. The outcome for immigrants who stayed in the same neighborhood is a good illustration: D for this group in Helsinki increased by almost four percentage points. It is more surprising that a similar increase occurred in Oslo, given the immigration history in these two cities. 5
Segregation Between Natives and Non-Western Immigrants According to Immigrants’ Location/Relocation in the Neighborhood Hierarchy.
Note. Measured by the dissimilarity index, 2000 and 2008. D = dissimilarity index.
Our research design prevents a direct comparison of Table 8 and other European studies. There can be no doubt, however, that most European research emphasizes spatial integration and reduction in segregation levels (e.g., Bolt and van Kempen 2010; Musterd 2012; Pan Ké Shon 2010; Schaake, Burgers, and Mulder 2014; Simpson, Gavalas, and Finney 2008; Zorlu and Mulder 2008). Our observation of D values in Copenhagen, Oslo, and Stockholm must be judged as a relatively high level, given the long window of adaptation (20 years on average). The complete lack of spatial integration in Oslo looms large in the picture, whereas the growth of segregation in Helsinki fits the historical experience of many European cities, with formulation and reformulation of clusters in the early stages of immigration.
Discussion and Conclusion
This article has investigated spatial integration of non-Western immigrants in Copenhagen, Helsinki, Oslo, and Stockholm. We have attempted to assess whether welfare state characteristics, broadly conceived as the Nordic model, reduces the relevance of spatial assimilation theory. The basic idea is that social and spatial equality, extensive welfare provision, and egalitarian values may contribute to slower spatial integration. We are thus interested in the net effect of highly different factors.
Our results correspond in several respects to the envisioned scenario. The first hypothesis is supported by descriptive statistics (Table 4), which show limited upward earnings mobility in the immigrant population. Many immigrants do not participate in economic activity, or move between activity and inactivity. This depressing circumstance sheds light on the finding in Table 5—a complete lack of spatial integration at the group level, measured in socioeconomic terms.
The second hypothesis postulated a weak relationship between upward earnings mobility and upward spatial mobility. Our findings support this proposition. A small positive effect is found in two cities (Copenhagen and Oslo), whereas two cities (Helsinki and Stockholm) display nonsignificant effects. Only one city, Copenhagen, had larger effects for immigrants than for natives. Even Copenhagen, however, diverges significantly from the U.S. experience, where earnings mobility is a key factor behind upward spatial mobility. What really drives upward spatial mobility in Nordic cities is labor market participation. 6
The third hypothesis suggested a small/negligible effect of spatial mobility on native/immigrant segregation. This proposition receives strong support. Immigrants who move upward in the sociospatial hierarchy achieve greater proximity to natives, but as other movements tend to increase the distance and as all movements take place in unstable ecologies, there is no major change in the proximity between the two groups. A minor reduction in segregation occurs in Copenhagen and Stockholm, whereas Oslo has a stable and Helsinki an increasing level of segregation (Table 8).
The fourth hypothesis pointed at differences between the four cities. We expected a systematic relationship between welfare provision and pace of spatial integration, with slow pace in generous systems and faster pace in the less generous systems. This implies a pattern where Oslo (Norway) and Helsinki (Finland) should be placed at each end of the spectrum. What we find is a slightly different picture. Oslo does indeed conform to the expectation, with a weak association between earnings mobility and upward spatial mobility (Table 6), a small difference between “winners” (individuals with upward earnings mobility) and “losers” (individuals without earnings in 2000 and 2008) (Table 7), and a stable level of native/immigrant segregation (Table 8). It also accords with the hypothesis that Copenhagen has a large negative effect for immigrants without earnings in one or both years (Table 6). Immigrants in Denmark are, just like natives, exposed to a larger employment risk than corresponding groups in Finland, Norway, and Sweden. We also find a great similarity between Copenhagen and Stockholm in the analyses of “winners” and “losers” (Table 7), and native/immigrant segregation (Table 8). Helsinki, then, is the odd case, as it is placed between Oslo and Copenhagen/Stockholm in the analysis of locational attainment, and at the same end as Oslo in the analysis of native/immigrant segregation.
The unexpected pattern in Helsinki can be explained by several factors. Perhaps most importantly, segregation is a recent challenge in Helsinki, and the city appears to be in a phase with increasing selective migration among native Finns. Another explanation concerns the spatial structure of the city. Helsinki has a more even distribution of social housing than Copenhagen, Oslo, and Stockholm (Lankinen 1997).
The pattern in Oslo requires a more detailed explanation. Does it boil down to negative incentive effects on labor supply? The small difference in upward spatial mobility between groups at the opposite end of the integration spectrum indicates that benefits do play a role. But available data do not support a narrow interpretation of this role—we do not endorse an explanation that puts all emphasis on work incentives. It is a fact, for instance, that non-Western immigrants in Oslo have a higher level of employment than similar groups in Copenhagen, Helsinki, and Stockholm. 7 It is therefore reasonable, or at least possible, to construe the even pattern in Oslo (Table 7) as an instance of equality—a potential for upward spatial mobility among immigrants who are disconnected from the labor market. A second factor is native mobility. We have seen that immigrants in Oslo who stayed in the same neighborhood experienced increasing separation from the native population. This result might be linked to a fundamental change in the distribution of immigrants, away from the inner city. Similar changes have occurred previously, or over a longer period of time, in Copenhagen and Stockholm. It is likely, therefore, that native flight has a different timing in these three cities. A third factor is the spatial structure of housing tenures. Owner-occupied dwellings are spread all over Oslo, even in the poorest districts. This particular feature makes it possible to access homeownership locally, without moving to a different part of the city. Many low-income households may even enter the market with a favorable “start-up loan,” provided by the Norwegian State Housing Bank. The loan is designed to assist marginal groups, including refugees and immigrants, into affordable homeownership. One study showed that 46% of the recipients in the major cities were immigrants/refugees (Barlindhaug, Johannessen, and Kvinge 2011).
It is more difficult to assess whether Oslo has been able to support poor districts to a larger extent than Copenhagen, Helsinki, and Stockholm. A relevant point is that ethnic school segregation has little or no effect on school results (Fekjær and Birkelund 2007). This pattern can be linked to massive economic support to schools with a high proportion of minority pupils. The problem, however, is that similar policies exist in all four cities, and we lack comparative data on transfers and distributive outcomes.
Our study should be seen as the first attempt to explore the welfare state context of spatial integration. A tentative conclusion is that redistribution and public investments explain more of the variation between the four cities than work incentives. It remains to be seen whether this conclusion applies at a higher level of analysis and over a longer period of time.
Other questions concern the Nordic context. One may wonder, for instance, whether Copenhagen and Stockholm displayed a weaker connection between economic and spatial mobility before the contraction of welfare policies in the respective countries. And if welfare provision affects spatial integration, what are the exact mechanisms that produce this pattern? A highly interesting line of research would be to investigate how welfare systems relate to benign ethnic clustering: Does welfare generosity facilitate voluntary segregation? State support to immigrants and immigrant organizations might, as an example, strengthen community cohesion in minority clusters. There is a plethora of ethnic networks and institutions in the Nordic cities, and these structures provide a potential buffer against insecurity and mental distress.
Finally, what are the policy implications of slow spatial integration? At least two courses of action seem appropriate. First, economic inactivity among immigrants may be targeted through a combination of qualification programs, incentive-building policies that encourage people into work, and measures against labor market discrimination. Education and qualification programs are far from new, but existing schemes are generally too weak or designed to solve traditional labor market problems. There is a need to expand schemes and measures that combine language and job training, targeting both refugees and voluntary immigrants. Incentive-building policies are called for in one country, Norway, where the intersection of certain programs (family-related benefits) undermines the principle that “work should pay” (The Norwegian government 2011). Moreover, although ethnic minorities have extensive civil rights, there is no doubt that labor market discrimination remains a problem. Field experiments in Oslo and Stockholm have documented that visible minorities are 30% to 80 % less likely to receive a job offer than natives (Birkelund et al. 2014). A more effective political approach in this field would include, beyond equal treatment acts, information and supervision activities, monitoring operations, and compliance clauses in public contracts. 8 Second, and turning to spatial integration, our results support redevelopment and revitalization of low-price housing areas. Concentration of ethnic minorities in such areas may not be disastrous, given that schools and public services have a decent standard. A long-term perspective, however, suggests that extensive native flight, native avoidance, and sustained minority clustering represent a threat to affective attachment between people. This in turn is a threat to the foundation of the Nordic model.
Footnotes
Declaration of Conflicting Interests
The author(s) declared no potential conflicts of interest with respect to the research, authorship, and/or publication of this article.
Funding
The author(s) disclosed receipt of the following financial support for the research, authorship, and/or publication of this article: This research was funded by the NORFACE program on Migration in Europe - Social, Economic, Cultural and Policy Dynamics.