



Abstract
The aim of this study was to investigate, in consideration of individual attributes and neighborhood-level social capital, the association between official crime rates and sense of neighborhood security among residents in the 23 wards of Tokyo, Japan, using data obtained from a national questionnaire survey and police statistics on crime for 511 neighborhoods. We found that crime rates affected residents’ sense of security differently according to the type of crime committed and the spatial scale. Regarding individual attributes, sense of security among men and those aged 35 to 49 years was in line with the actual property crime rate, whereas that among women and the elderly was in line with the actual violent crime rate. In addition, even when controlling for social capital, which had a strong positive effect on residents’ sense of security, and individual attributes, all crime rates except that for violent crime were significantly related to residents’ sense of security in their neighborhood.
Introduction
From the end of World War II to 1980, the number of annual crimes reported in Japan ranged between 1.3 and 1.5 million. However, crime began to surge in 1995, a year in which 6,434 people lost their lives in the Great Hanshin Earthquake and a sarin gas attack was carried out on the Tokyo subway. These events, coupled with a general mood of stagnation following the bursting of the “economic bubble,” led to a sudden drop in the nation’s sense of security. Reported crimes reached a peak of 2.85 million in 2002 (Ministry of Justice 2014), and in September 2003, the Ministerial Conference on Measures against Crimes, which comprises all cabinet members and is led by the Prime Minister, was established to formulate an “action plan for realizing a powerful society against crime.” This action plan intended not only to reduce crime but also to improve citizens’ sense of security (Hino and Schneider 2013). As a result, by 2012, the number of reported crimes had decreased to less than half the peak number reported in 2002. Japan has a lower crime rate (number of recorded crimes per 100,000 people) for homicide and theft than France, Germany, the United Kingdom, and the United States. The theft rate in Japan is less than one-third that of the United States, whereas the homicide rate is around one-sixth (Ministry of Justice 2014).
However, the nation’s sense of security with regard to crime remains low. In an opinion poll conducted by the Cabinet Office in 2012, 3,000 members of the general public aged 20 years and above were asked, “How do you rate public security in Japan now compared with 10 years ago?” In spite of the fact that crime had decreased by half, more than 80% of the respondents selected “worse” or “rather worse” (Cabinet Office 2012). Therefore, as part of the political agenda in Japan, improving citizens’ sense of security seems to be just as important as reducing crime. Another opinion poll conducted annually by the Tokyo Metropolitan Government asks 3,000 members of the general public aged 20 years and above to select five among 28 separate political agendas that should be ranked highest in terms of priority. For seven consecutive years between 2004 and 2010, “crime prevention” was identified as the highest priority issue for the government. Although “disaster prevention” has been consistently ranked as the highest priority issue since the Great East Japan Earthquake in 2011, “crime prevention” was identified as the second highest (48%) in 2014, outpacing both “medical care and sanitation” and “public finance” (Tokyo Metropolitan Government 2014). However, Hiroshi Kubo, a retired manager of the Office for Youth Affairs and Public Safety of the Tokyo Metropolitan Government, suggested that the government takes advantage of this weakening sense of security to promote policies that favor the government, and that the lowered sense of security reflects factors other than crime (Kubo 2006). In other words, the boundary between sense of security and other kinds of anxiety and concern has become blurred (Sparks, Girling, and Loader 2001). Therefore, whether the actual crime rate in the real world affects sense of security among residents remains unclear.
To address this issue, it is first necessary to distinguish “sense of security” from “fear of crime.” “Sense of security” (or “perceived crime”), a cognitive judgment, is fundamentally different from fear, which is more affective or emotive in character (Ferraro 1995). Although females and older persons typically have more fear of crime (Zhao, Lawton, and Longmire 2015), individual attributes affect fear of crime and sense of security differently (e.g., see LaGrange and Ferraro 1989). Rountree and Land (1996b) pointed out not only similarities between fear of crime and perceived risk, such as a positive association with neighborhood incivility, but also dissimilarities, such as neighborhood integration, which has a negative association with perceived risk and a positive association with fear of burglary. In relation to spatial scale, risk perception varies across tracts and neighborhoods, whereas burglary-specific fear varies only across neighborhoods (Rountree and Land 1996a). Similarly, Hinkle (2015) reported that while physical disorder in a neighborhood appears to serve as a visual cue that helps residents determine their level of safety, it does not appear to drive an emotional fear of crime, and Skogan (1990) reported that the relationship between disorder and fear was not significant when controlling for crime conditions.
Many studies have investigated the relationship between fear of crime and objective crime, but relatively few have investigated the relationship between perceived and objective crime. Among these, Wilcox, Quisenberry, and Jones (2003) examined the effects of the built environment on subjective community crime risk; Drakulich (2013) predicted perceived crime with observed disorder; and Russo, Roccato, and Vieno (2013) reported that a high crime rate had a positive effect on the perception of crime risk. In addition, Hipp (2007b, 2013) investigated the relationship between official crime rates and residents’ perception of crime in census tracts over a 25-year period, and found that residents’ perception of crime was most strongly related to official rates of violent crime. However, because all of these studies were based on a large-scale sampling units, such as census tracts, likely because of data constraints, more attention should be paid to the appropriate level of aggregation when estimating neighborhood effects (Hipp 2007a), and relevant neighborhood size and boundaries should be determined to test specific theories that could inform area-based policy (Lupton 2003). One such example is the study by Brunton-Smith and Sturgis (2011), which focused on the Crime and Disorder Reduction Partnership.
Some factors other than objective crime have been reported to affect sense of security or perceived crime. The first such factor is social capital, which has been shown to have a significant positive relationship with sense of security. 1 Based on responses to a public health survey in Malmö, Sweden, Lindström, Merlo, and Östergren (2003) suggested that neighborhood social capital, measured as electoral participation, partially explained an individual’s sense of security. Sampson, Raudenbush, and Earls (1997) focused on collective efficacy, a measure of “informal social control” and “social cohesion and trust” similar to social capital, and showed that it was strongly negatively associated with perceived violent crime, even after controlling for social composition. Hirschfield and Bowers (1997) reported finding lower levels of crime in disadvantaged areas with high levels of social cohesion, and Messner et al. (2004) found that there was a reciprocal relationship between social trust and homicide rates; these studies suggest that social capital even affects actual crime rates. In Japan, social capital has been shown to affect local capabilities of disaster management (Marumo 2012) and progress toward sustainability (Kusakabe 2013). The present study is expected to add important information regarding the effects of social capital on sense of security in Japan.
A second factor is the mass media. 2 Mohan, Twigg, and Taylor (2011) reported that newspaper readership had a strong association with perceptions of national crime rates, and created a gap between perceptions of national and local crime rates. Lowry, Josephine Nio, and Leitner (2003) reported that television news had a fourfold greater effect than actual crime rates on public perception of crime. In addition to the mass media, police and municipalities frequently disclose crime statistics to the public, and these reports may cause an information gap and lead to a substantial difference in sense of security based on individual attributes.
A third factor is the spatial scale for aggregation, as noted above. 3 Hanyu et al. (2009) reported that sense of security is influenced not only by individual attributes but also by a “scale bias.” In other words, sense of security at the city or prefectural level is perceived to be worse than that at the neighborhood level, and that at the national level is thought to be even worse. This suggests that sense of security at the metropolitan or national level is separate from that at the neighborhood level. A scale bias was observed in a survey conducted on 2,028 Japanese adults by the Nikkoso Foundation for Safe Society in 2014. In that survey, around 70% of the respondents answered that security in their neighborhood had “remained constant,” whereas more than 50% answered that security in Japan had “worsened” (Nikkoso Foundation for Safe Society 2015). Duffy et al. (2008) also pointed out that people were generally much less pessimistic about local than national crime rates. In addition, sense of security affected neighborhood satisfaction when aggregated to the micro-neighborhood, but not when aggregated to census tracts (Hipp 2010).
The final factor is nationality. Quillian and Pager (2001) confirmed the presence of a relationship between neighborhood racial composition and residents’ perception of crime after controlling for crime rates and other neighborhood characteristics. Although race can be an important factor in relation to perception of crime, Japan is a racially homogeneous country. Therefore, in this study, instead of racial composition, we focused on characteristics specific to the Japanese. Using data obtained from General Social Surveys conducted in the United States and Japan, Sakaguchi (2008) pointed out that a higher risk of crime was perceived among younger people and those in higher economic and educational classes in Japan; these characteristics are specific to the Japanese.
Based on these studies, the aim of the present study was to explain residents’ sense of security with official crime rates (objective crime), individual attributes, and social capital at the neighborhood level in the 23 special wards of Tokyo. 4 To achieve this, we have formulated the following three hypotheses:
The uniqueness of the present study is as follows: We investigated the relationship between residents’ sense of security (not “fear of crime”) and official crime rates in consideration of a scale bias, individual attributes, and social capital; we treated various crimes separately and aggregated them into two spatial scales corresponding to areas of safety activities; and, while most previous studies have targeted cities in the United States or European Union, we focused on Tokyo, a city in Asia with a low crime rate. A summary of the variables used in the present and previous studies to investigate the relationship between fear/perception of crime and objective crime is shown in Table 1.
Summary of the Variables Used in the Present and Previous Studies to Investigate the Relationship Between Fear/Perception of Crime and Objective Crime.

Note. MSOA = Middle Super Output Area; CDRP = Crime and Disorder Reduction Partnership; PHMC = Philadelphia Health Management Corporation.
Data
Sense of security at the neighborhood level was based on responses to an item regarding satisfaction with “security and crime prevention” of the living environment in a questionnaire survey (Jyu-seikatsu Sogo Chosa [Comprehensive Survey on Housing Life]) conducted by the Ministry of Land, Infrastructure, Transport and Tourism in 2008. The objective of that survey, which comprises a home-visit questionnaire and is conducted every five years, is to obtain basic information for designing policies on residence and living environments. Samples are selected from households all over Japan using two-stage stratified random sampling. In the 2008 survey, questionnaires were distributed to 96,845 households in late November and collected from 83,292 in early December.
Neighborhood social capital was assessed by respondents’ satisfaction with “interaction with neighbors and the community” from the same questionnaire. The Organisation for Economic Co-operation and Development (OECD 2007) defined social capital as “networks together with shared norms, values and understandings that facilitate co-operation within or among groups” and rephrased it as “real-world links between groups or individuals.” Therefore, we thought responses to this question could be regarded as a proxy variable for social capital. These two questions were answered by 2,413 households in 511 of 3,140 neighborhoods (and in 434 of 851 school areas) in the 23 special wards of Tokyo.
Official crime rates in the neighborhoods of the respondents were based on the natural logarithms of numbers of felonies (homicide, robbery, arson and rape), violent crimes, home burglaries, and nonburglaries (theft of/from motor vehicles and purse snatching) 6 per 10,000 people plus one. The numbers of crimes were based on the total number of crimes reported by the Metropolitan Police Department from 2006 to 2008 and arranged by Amemiya and Iwakura (2012). The populations were based on the average values for the same three years (as of January 1) in the residential basic book system of the Tokyo Metropolitan Government.
Method
Sense of Security and Scale Bias
The Kruskal–Wallis test was used in place of one-way analysis of variance because the data of official crime rates did not show a normal distribution. All respondents were divided into four groups based on sense of security, and then ranked by the crime rates in their neighborhood and school district. To identify differences among groups, we compared the median ranks and then conducted post hoc analysis using the Mann–Whitney U test with Bonferroni correction.
Association with Individual Attributes
The Kruskal–Wallis test was used to compare median ranks according to sex and age. Based on the results of the “Sense of Security and Scale Bias,” the crime rate at either the neighborhood or school district level was selected as the explanatory variable for each crime.
Association with Social Capital
Multivariate and categorical regression was then used to identify the relative effect of explanatory variables on residents’ sense of security (1 = satisfactory, 2 = rather satisfactory, 3 = rather unsatisfactory, 4 = unsatisfactory), which was used as the outcome variable. Categorical regression quantifies categorical data by assigning numerical values to categories, resulting in an optimal linear regression equation for the transformed variables. Numeric categories are treated as ordered and equally spaced (interval level) (IBM Corporation 2014); therefore, the crime rate was divided into four categories, the same number of categories as sense of security. We then created three models. The explanatory variables in Model 1 were the crime rates, selected in the same way as described in the “Association with Individual Attributes.” In Model 2, individual attributes were added, and in Model 3, social capital, ranked between 1 (satisfactory) and 4 (unsatisfactory), the same as sense of security, was added as an explanatory variable. All statistical analyses were conducted using IBM SPSS Statistics 23 (IBM Corp., Armonk, NY, USA).
Results
Questionnaire responses regarding sense of security and social capital are aggregated in Tables 2 and 3, respectively. In terms of the demographic characteristics of the respondents, no significant sex- or age-based differences were found in relation to satisfaction with sense of security or social capital. This result was contrary to findings from a survey conducted in Italy (Russo et al. 2013) reporting that being a woman or an older person was predictive of having an increased perception of crime risk. Although the differences were not statistically significant, younger respondents tended to be more satisfied with security, whereas older respondents tended to be more satisfied with social capital. Descriptive statistics and a correlation matrix of crime rates are shown in Tables 4 and 5, respectively.
Satisfaction with “Security and Crime Prevention” at the Neighborhood Level.
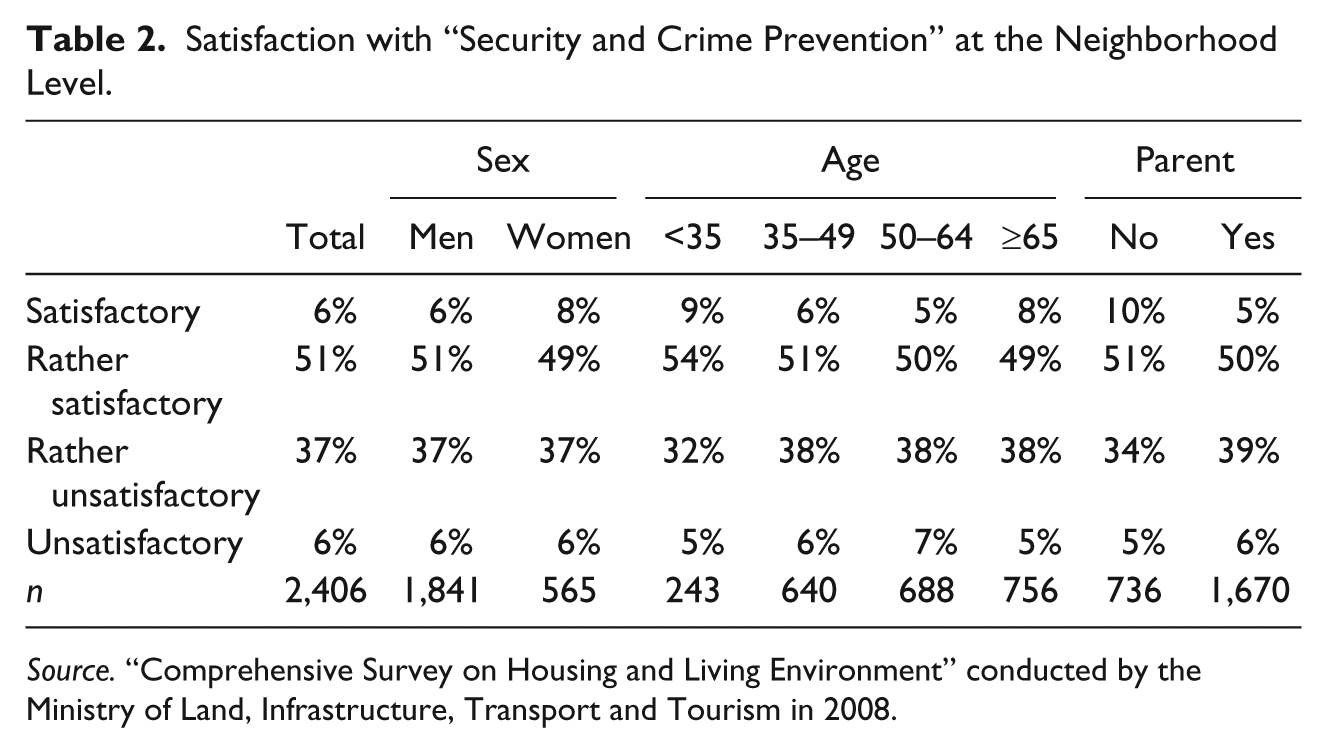
Source. “Comprehensive Survey on Housing and Living Environment” conducted by the Ministry of Land, Infrastructure, Transport and Tourism in 2008.
Satisfaction with “Interaction with Neighbors and the Community” at the Neighborhood Level.

Source. “Comprehensive Survey on Housing and Living Environment” conducted by the Ministry of Land, Infrastructure, Transport and Tourism in 2008.
Descriptive Statistics of the Crime Rate.

Correlation Matrix of Crime Rates.

Sense of Security and Scale Bias
Significant relationships were found between residents’ sense of security and all crime rates, except that for violent crime. This finding suggests that residents’ perceptions of crime risk in their neighborhood are in line with actual crime rates. When comparing crime rates between neighborhood and school district, the chi-square values for violent crimes and home burglaries were higher for neighborhood, whereas those for nonburglaries were higher for school district, despite the expected scale bias. Regarding felonies, the chi-square value was slightly higher at the school district level, but the relationship between the median rank and level of satisfaction was accurate at the neighborhood level (Table 6 and Figure 1).
Results of the Kruskal–Wallis Test Comparing Crime Rates Among Four Groups with Different Senses of Security.

p < .10. **p < .05. ***p < .01.
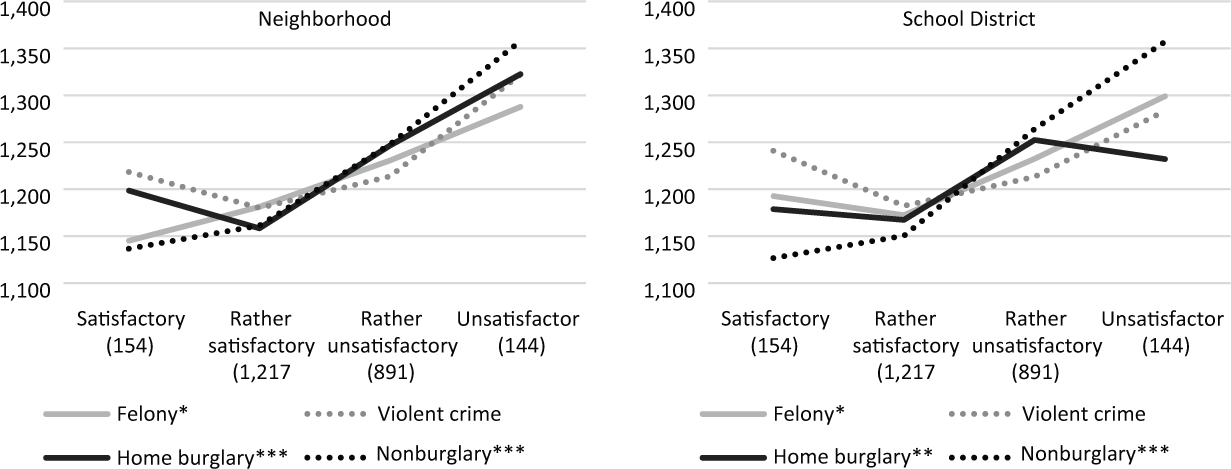
Median rank of crime rates by groups with different senses of security.
Association with Individual Attributes
The effect of respondents’ sex and age on the relationship between official crime rates and residents’ sense of security at the neighborhood level was also analyzed. Considering the results from the “Sense of Security and Scale Bias,” crime rates regarding felonies, violent crimes, and home burglaries were based on the neighborhood level, whereas the crime rate regarding nonburglaries was based on school district.
Sex
As seen in Table 7 and Figure 2, regarding men, the median rank increased, and a significant relationship was evident between three crime rates and residents’ sense of security. Regarding women, a significant relationship was only seen between violent crime and sense of security. This suggests that women are only more sensitive than men to violent crime, and that they perceive their situation better, possibly because women are a more vulnerable population.
Results of the Kruskal–Wallis Test Comparing Crime Rates Among Four Groups with Different Senses of Security by Sex.

Note. The significance level testing differences between groups was set at .05. Felony, violent crime, and home burglary crime rates were based on neighborhood, and the nonburglary crime rate was based on school district.
p < .10. **p < .05. ***p < .01.

Median rank of crime rates by groups with different senses of security.
Age
All respondents were divided into the following four age groups: <35, 35 to 49, 50 to 64, and ≥65 years. No significant relationship was found between any of the crime rates and residents’ sense of security in the <35 and 50 to 64 age groups. Regarding the 35 to 49 age group, significant relationships were observed between home burglaries and nonburglaries and sense of security (Table 8 and Figure 3). Regarding the ≥65 group, the only significant relationship found was that between violent crime and sense of security, possibly because older residents tend to be less resilient to violent crime.
Results of the Kruskal–Wallis Test Comparing Crime Rates Among Four Groups with Different Senses of Security by Age.

Note. The significance level testing differences between groups was set at .05. Felony, violent crime, and home burglary crime rates were based on neighborhood, and the nonburglary crime rate was based on school district.
p < .10. **p < .05. ***p < .01.

Median rank of crime rates by groups with different senses of security.
Association with Social Capital
The results of categorical regression are shown in Tables 9 and 10. The outcome variable was residents’ sense of security. Crime rates, as explanatory variables, were categorized into four levels, except the crime rate for felonies, which was binarized as zero or more than zero because no felonies were reported in 47% of the respondents’ neighborhoods.
Results of Categorical Regression.

Note. Felony, violent crime, and home burglary crime rates were based on neighborhood, and the nonburglary crime rate was based on school district. Violent crime, home burglary, and nonburglary crime rates were categorized into four levels. Only felony was binarized.
Quantification of Categorical Variables (Model 3).
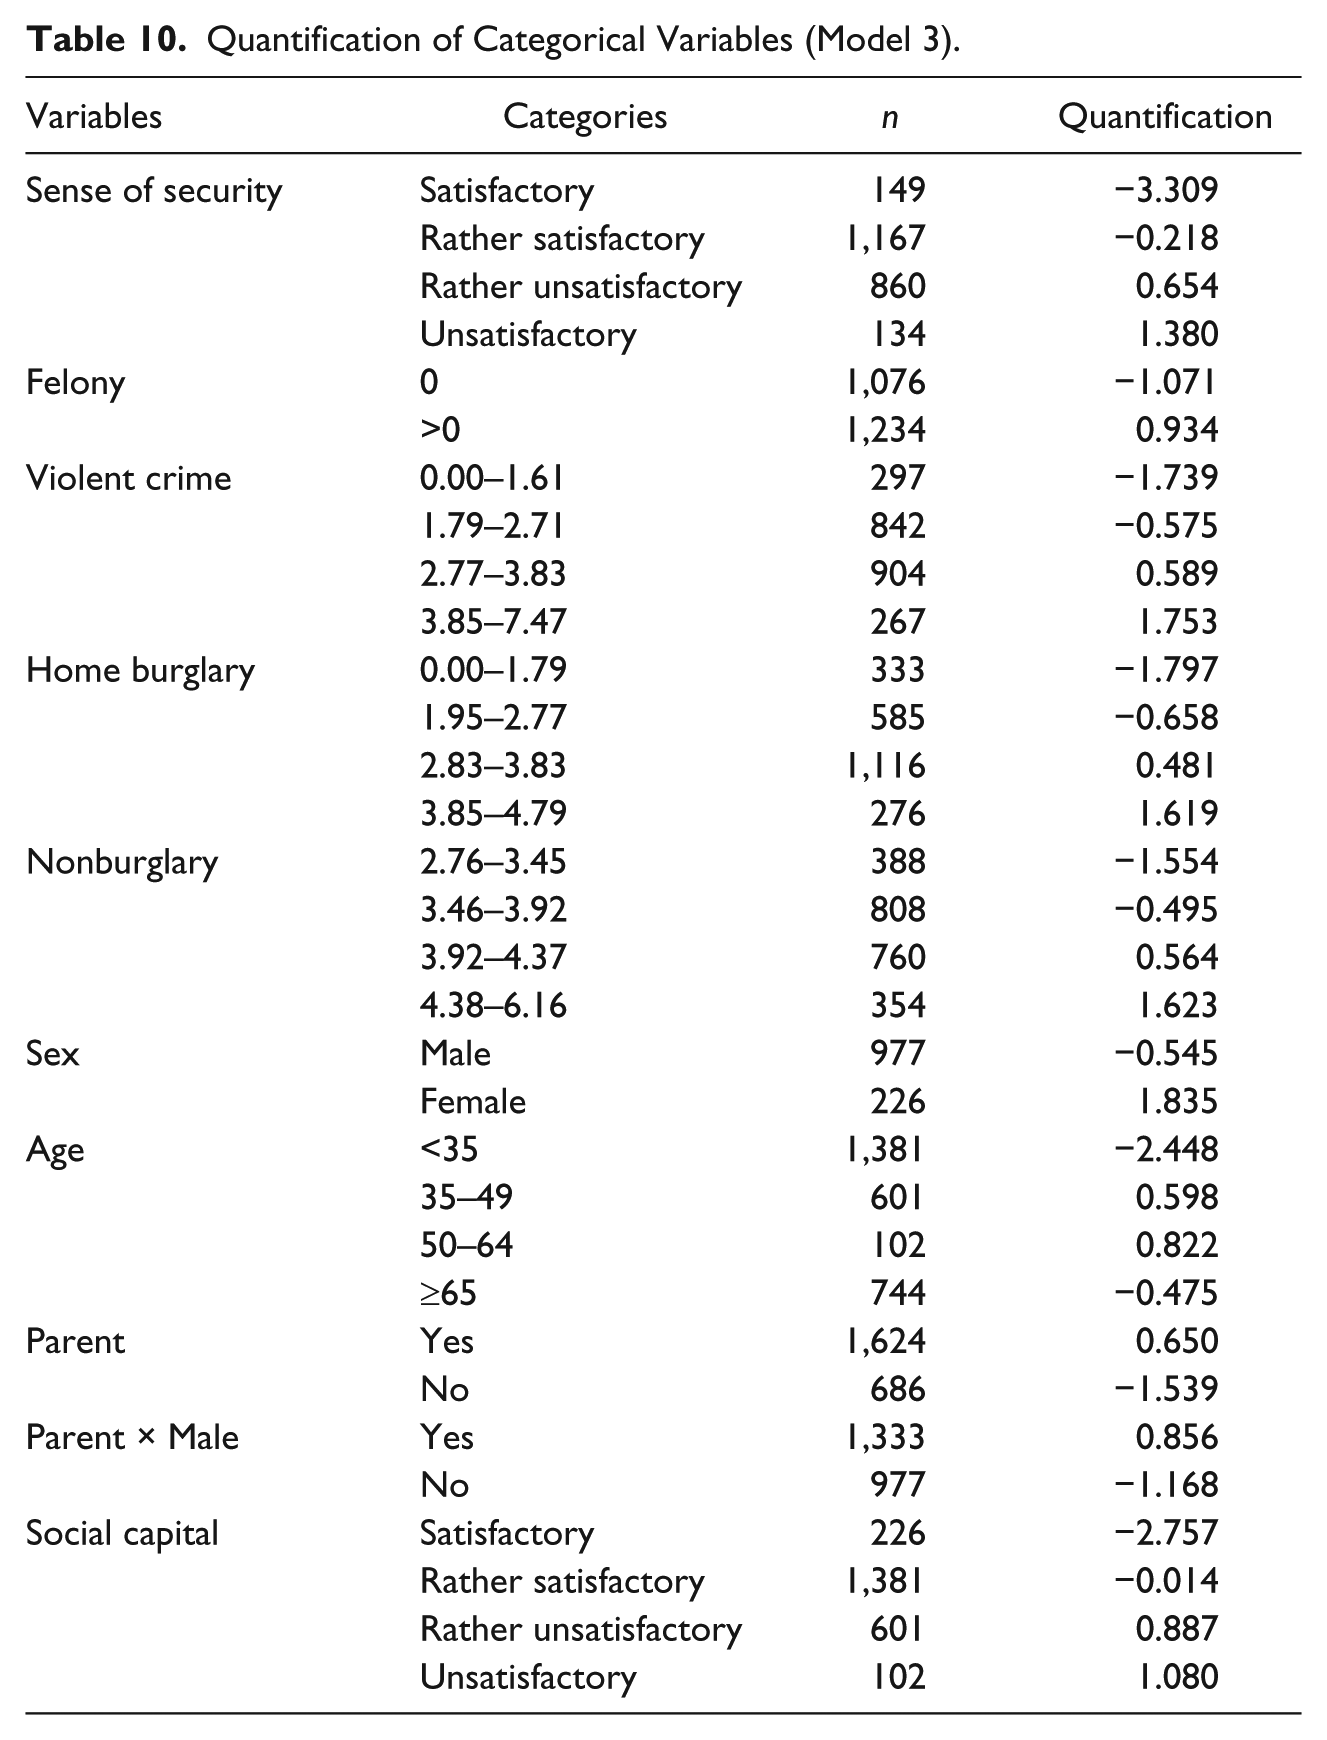
In Model 1, the crime rates for felony, burglary, and nonburglary were significantly related to residents’ weakened sense of security (p < .01); the effect of the nonburglary crime rate was largest, which is consistent with the results from the “Sense of Security and Scale Bias,” and the regression was significant. In Model 2, respondents’ attributes, including sex, age, and parental status, and one interaction term (Parent × Male) were added as explanatory categorical variables; the regression was also significant, and adjusted R2 values were slightly improved. The crime rates for felony, burglary, and nonburglary that were significant in Model 1 were also significant (p < .01) in Model 2, even when considering the effect of individual attributes. Moreover, the interaction term (Parent × Male) was significant, which suggests that being male has a positive effect on sense of security, whereas being a male parent has a negative effect. In Model 3, for which social capital was added as an explanatory variable, social capital had a significant positive relationship with sense of security, and adjusted R2 values were greatly improved. The standardized coefficient of social capital was the largest (.348), yet the crime rates for felonies, home burglaries, and nonburglaries maintained a significant effect, even though the effect of home burglaries was less significant (p < .10). These results suggest that these three crime rates have a robust effect on residents’ sense of security in their neighborhood, even when controlling for both individual attributes and social capital. The interaction term (Parent × Male) was significant, which was similar to Model 2. The interaction effect of parental status and sex on sense of security shown in Figure 4 indicates that sense of security in men decreases after they have children, whereas that in women remains nearly the same.

Interaction effect of parental status and sex on sense of security.
Discussion and Conclusion
The present study showed that crime rates affect residents’ sense of security in their neighborhoods, and that these effects differ by the type of crime and spatial scale, which confirms the presence of a scale bias (Hanyu et al. 2009). Regarding violent crimes and home burglaries, crime rates for neighborhoods had a stronger effect on residents’ sense of security than those for school districts. This suggests that perceived crime rates are more in line with actual crime rates in smaller neighborhoods. Residents’ voluntary crime prevention activities in Japan are generally carried out in each neighborhood to promote a sense of security (Van Houwelingen 2012), and the results of the present study are expected to directly benefit these activities and the supporting public authorities. Regarding nonburglaries, crime rates for school districts had a stronger effect on residents’ sense of security than those for neighborhoods. This may be because information on nonburglaries is usually posted by police on bulletins, such as neighborhood signboards at the site of the crime, and is therefore more widely disseminated. As shown in Table 1, numerous studies have investigated the association between sense of security and violent crime, with some finding a significant relationship (e.g., see Drakulich 2013). No significant relationship was found in this study; this may have been because violent crime is defined differently in Japan, or because the respondents tended to be older than the age group at the highest violent crime risk.
The size of the relationship between official crime rates and residents’ sense of security in their neighborhood differed depending on individual attributes. Regarding sex, sense of security was more in line with crime rates among men; this may be because traditionally, men are expected to bear the primary responsibility for the safety of their family. This resembles the altruistic fear that people have for their loved ones whose safety they value such as their children, spouses, and friends (Warr and Ellison 2000). Regarding age, sense of security was more in line with actual property crime (burglary and nonburglary) rates among the 35 to 49 age group, which may be because this group is primarily concerned with increasing their financial assets, and thereby most sensitive to property crime. The fact that women and the elderly (≥65 years) were only more sensitive to violent crime was likely due to their relatively higher vulnerability.
Based on the results from categorical regression, social capital had a strong positive effect on residents’ sense of security. This could be because neighborhoods with strong social capital tend to have more active residential patrol programs, which could promote an increased sense of security among residents. Nevertheless, three types of crime rates had significant and robust relationships with sense of security among neighborhood residents, even when controlling for social capital and individual attributes. These results support those from previous studies on U.S. cities (Drakulich 2013; Ferraro 1995; Rountree and Land 1996b) and show international similarities. On the contrary, the result that the youngest group (<35 years) had a significantly positive sense of security contradicts previous studies (Drakulich 2013; Russo et al. 2013; Wilcox, Quisenberry, and Jones 2003). As international similarities and dissimilarities have to be examined to generalize the findings, the present study is expected to be helpful.
Regarding the difference between fear of crime and sense of security, domestic research from Japan showed that women and individuals in their thirties and forties had more fear of crime, whereas individuals above 60 years of age had less (Nikkoso Foundation for Safe Society 2015). In the present study, in terms of sense of security, individuals below 35 years of age evaluated public safety relatively positively when controlling for social capital. The fact that younger people had more fear of crime and a greater sense of security suggests a difference between the affective fear of crime and the cognitive sense of security. The differences observed based on individual attributes may have been due to the degree of exposure to crime information, as well as the traditional values noted above. The effect of the mass media, such as television news (Lowry, Josephine Nio, and Leitner 2003; Weitzer and Kubrin 2004) and newspapers (Brunton-Smith and Sturgis 2011; Hanslmaier 2013), on sense of security and fear of crime has been discussed in previous studies. As new media, such as email services that deliver notifications to parents of schoolchildren, are becoming increasingly widespread, the effect of different forms of media cannot be ignored. Although being a man has a positive effect on sense of security, we found that being a father has a negative effect, which is a unique result of this study. This finding may be because fathers collect crime information for their families via these types of email services. The relationship between official crime rate, sense of security, fear of crime, individual and family attributes, and neighborhood attributes is shown in Figure 5. Official crime rates affect fear of crime via sense of security (Ferraro 1995; Lagrange and Ferraro 1989). The effect of neighborhood attributes varies by individual attributes (Hinkle 2015; Rountree and Land 1996a). The present study provided supporting evidence to the presence of a relationship between official crime rates, sense of security, individual and family attributes, and social capital.

Relationship between official crime rate, sense of security, fear of crime, individual and family attributes, and neighborhood attributes.
The OECD (2011), which regards Japan as one of the safest among its 34 member countries, has pointed out weaknesses in relation to the social capital of Japanese people. To improve sense of security, various policies that aim to build social capital are needed, as well as improved crime prevention by the police. The Adachi Ward, which is located in the northeastern part of Tokyo, has a population of 678,000 and is known for undertaking serious efforts to reduce crime and improve its image (Hino and Schneider 2013). It has recently introduced various measures to strengthen social ties or bonds and prevent vulnerable populations, especially the elderly, from becoming isolated. These types of measures are also expected to be useful in improving sense of security in the ward.
This study did have some limitations. We cannot deny the existence of confounding factors that have a correlation with both sense of security and crime rate. The well-known “broken windows” theory (Wilson and Kelling 1982) notes that disorder has an effect on crime, and Taylor (1999) quantitatively referred to neighborhood-level correlations between crime rates and perceived incivilities. Regarding the effect on perception, Innes (2004) proposed that people tend to construct their perceptions of criminogenic risk around certain “signal” incidents, including not only signal crimes but also signal disorders. Hinkle (2015) reported that physical disorder indicates that an area might be unsafe, or that criminal activity is likely to occur. Wyant (2008) analyzed the relationship between fear of crime and perceived risk, noting that the effect of incivilities on fear at the individual level is not completely mediated by perceived risk.
The findings of the present study are expected to be valuable because they show the effects of each type of crime on residents’ sense of security. To the best of our knowledge, no other studies in Japan have targeted detailed crime types classified according to a spatial scale from the district level to the neighborhood level. However, the effect of disorder and incivility on residents’ sense of security in Japan, which is a relatively orderly country, should be investigated in a future study.
Footnotes
Declaration of Conflicting Interests
The author(s) declared no potential conflicts of interest with respect to the research, authorship, and/or publication of this article.
Funding
The author(s) received no financial support for the research, authorship, and/or publication of this article.