



Abstract
Recent research shows that inequality between racial groups is a critical determinant of redistributive policy in the United States. Using various measures of local and state spending and examining multiple levels of geographical and political jurisdictions, we extend this research to government spending on local public goods. Specifically, we examine (1) whether the extent to which income inequality falls along racial lines dampens local and state government spending on public goods, (2) which types of public goods are most affected by the racial structure of inequality, and (3) whether political variables such as local leaders’ racial identities and party affiliation mediate the relationship between racial inequality and spending on public goods. The findings reaffirm the need to consider racial diversity and inequality jointly as influences on policy.
Recipient of the Best Paper in Urban or Regional Politics presented at the 2017 American Political Science Association conference.
Introduction
Classical public choice models of redistributive policy in democracies assume that the median voter opts for a rate of redistributive taxation that maximizes his or her own posttransfer income (Meltzer and Richard 1981; Romer 1975; cf. McCarty, Poole, and Rosenthal 2006). These models predict that the median income voter will choose a higher level of redistribution as pretax income inequality rises.
But the power of group identities and attitudes to shape voters’ preferences about redistribution complicates this prediction (Alesina and Glaeser 2004; Hero 1998; A. Lee 2017; Tajfel and Turner 2004). If voters judge redistributive policies on the basis of how they affect groups they identify with or dislike, they will often oppose policies that transfer income away from their own group to others, even if these policies make them individually better off (Alesina and Glaeser 2004; Gilens 1999; Luttmer 2001). Group stereotypes may also color the way that policy makers and program administrators explain economic inequality, assess its urgency, and formulate plans for dealing with it (Soss, Fording, and Schram 2008, 2011). 1
These insights have focused growing attention on the racial and ethnic “structure” of inequality as a critical determinant of redistributive policy (Baldwin and Huber 2010; Hero and Levy 2016, 2017; Lind 2007). 2 By racial “structure,” scholars have meant the extent to which total disparities in income are a result of inequality among individuals within salient social groups or of inequality between members of different groups. Under standard assumptions, 3 and holding the total level of income inequality and racial diversity constant, redistribution entails greater intergroup transfers as intergroup inequality rises (Hero and Levy 2016, 2017; Lind 2007). If the pivotal influence on policy is drawn from the wealthier group and feels animus toward the subordinate group or stereotypes it as “undeserving,” more intergroup inequality is expected to dampen redistributive generosity. A large body of research explores the influence of total income inequality and racial diversity on redistribution and has reached mixed conclusions (Alesina and Glaeser 2004; Benabou 2000; though see Boustan et al. 2013; Hopkins 2011; Milanovic 2000). Research on the racial structure of inequality has obtained more consistent results by attending to the interdependence of these two factors: inequality can affect redistribution in different ways depending on whether it straddles or parallels ethnic group boundaries (Lind 2007), and diversity has a more pronounced negative impact on redistribution when between-group income differentials are wide (Hero and Levy 2017; see also Matsubayashi and Rocha 2012).
Research on this topic in the United States has focused on welfare policy as a dependent variable (Hero and Levy 2017; Lind 2007). Welfare is arguably an “easiest case” for theories linking the racial structure of inequality to redistribution because it is a racialized policy domain that entails pure transfers of income. But this article argues that the racial structure of inequality influences a considerably broader range of public policies that involve some measure of redistribution. We focus on the local provision of public goods, a policy area that has been found to be influenced by variation in the level of racial diversity (Alesina, Baqir, and Easterly 1999; though see Boustan et al. 2013; Hopkins 2011).
Following Hero and Levy (2016, 2017), we measure the racial structure of local income inequality using the Theil Index, which is an entropy-based measure of inequality that can be decomposed into between- and within-group components. Using a variety of data sources that span multiple geographic and political jurisdictions and encompass an era in which American political leaders often linked fiscal distress with immigration and demographic change, we explore whether variation in the between-race component of income inequality predicts variation in the local provision of public goods. We also theorize and examine which types of public goods would be most affected by retrenchment in response to rising between-group inequality. We argue that public goods that admit private substitution are most likely to be affected by racial inequality. Finally, we analyze political factors that would be expected to mediate the relationships between demographics and policy, including the party affiliation of local leaders, descriptive representation, and the degree of metropolitan fragmentation.
Group Attitudes and Support for Public Goods Spending
Research has found strong relationships between group animus and conservative fiscal attitudes, including opposition to redistribution. Notably, these findings often hold even when the policy in question has no overt connection to race or ethnicity. The most consistent findings link a variety of measures of White prejudice toward Blacks to opposition to welfare (Bobo and Hutchings 1996; Gilens 1999; Lind 2007; Luttmer 2001; Sears, Sidanius, and Bobo 2000). Some have also linked conservative fiscal preferences to opposition to immigration or anti-Latino sentiment (Hajnal and Rivera 2014). Racial diversity may also erode interpersonal trust, participation, and other forms of engagement with the public sphere (Putnam 2007), a dynamic that is stronger among those high in racial animus (Alesina and La Ferrara 2002; Costa and Kahn 2003). Issue framing and elite messaging also play an important role in policy racialization. Gilens (1999) traced the rise of imagery of Black Americans in news stories about welfare and argued that the increasing prominence of racialized portrayals of welfare beneficiaries led to diminished support for the program among American Whites after the 1960s.
Consistent with theories positing in-group bias in the allocation of resources, researchers have often found links between racial/ethnic context and local or state economic policy. States and localities with higher Black populations tend to have lower expenditures on welfare and public goods (Blalock 1967; Fellowes and Rowe 2004; Fording 2003; Hero 1998; Johnson 2003; Key 1949; Luttmer 2001; McGuire and Merriman 2006; Vigdor 2002; Wright 1976; for extensions to multiracial contexts with mixed results, see Abrajano and Hajnal 2015; Fox 2004; Hero and Preuhs 2007; Hero and Tolbert 1996). 4
Recent scholarship has convincingly demonstrated relationships between racial inequality and welfare spending at the state level. Matsubayashi and Rocha (2012) found that the impact of states’ Black population shares on welfare spending depends on whether Black–White income inequality is high (less spending) or low (more spending). Lind (2007) and Hero and Levy (2017) found that between- and within-race inequality have different effects on welfare effort and generosity in the states. Lind (2007) found that within-race inequality is positively correlated with spending whereas between-race inequality appears to have no net effect. This makes sense because more between-race inequality has two potentially offsetting effects: It raises inequality overall, which may lead to more demand for redistribution, but it also accentuates average inequality between groups, which may have the opposite effect. Hero and Levy (2017) proposed that a critical variable is the share of total income inequality that can be explained by interracial disparities (as opposed to by disparities within racial groups). Controlling for the total level of income inequality and the level of racial diversity, they show that this share, which isolates the racial structure of inequality from the level of inequality, is powerfully negatively correlated with welfare spending after the 1996 national welfare reform that gave more discretion to the states but not before it.
Just Welfare?
A critical question is to what extent the racial structure of inequality influences policy domains other than welfare. Research has documented associations between intergroup inequality and public goods such as education, where older Whites may reject using “our” tax dollars to finance “their” schooling (Myers 2007; Poterba 1997) and even “developmental” spending (Peterson 1981) on goods such as transportation and sanitation (Alesina, Baqir, and Easterly 1999). Trounstine (2016) found that racially segregated locales are most prone to such effects, presumably because reductions in spending on public goods can be targeted so that they minimally affect the services available to the dominant group.
Even though sales and property taxes that finance many public goods tend to be regressive, most public goods tend to be financed more by wealthier citizens and consumed more by poorer citizens, who are more likely to lack private alternatives to public goods. Thus, as in the case of welfare spending, we hypothesize that, at a given level of total income inequality and ethnoracial diversity, larger racial disparities in income will reduce support for public spending generally, including on goods that are not usually classified as redistribution.
However, we note three reasons that the applicability of social affinity models of redistribution to the provision of public goods should not be taken for granted. First, political pressure to reduce taxes or bond issues that fund spending on local public goods may be strongly counteracted by structural forces inherent in competitive federalism. Local governments must compete for high tax-paying individuals and produce public goods needed to support an employer base (Peterson 1981). Unlike cutting welfare spending and other programs targeted at the poor, cutting funds for infrastructure, education, and policing may conflict with these imperatives. Second, and relatedly, local public officials may find ways to circumvent public opposition to redistributive taxation (Rugh and Trounstine 2011). Third, whereas welfare policy is known to be “racialized” (Gilens 1999), it is less clear to what extent citizens’ judgments about bond levies or taxes collected to fund public goods such as education, police protection, parks, and sanitation are as well. Thus, group inequalities may foster less resistance to spending on these goods than they do on welfare. Indeed, empirical research on the links between racial diversity and public goods spending have turned up mixed results at best (Boustan et al. 2013; Hopkins 2011), though this research has not zeroed in on the racial structure of inequality, instead treating income inequality as a separate potential influence on policy.
However, neither changes in public opinion nor responsiveness to them are necessary for racial inequality to influence policy outcomes. In the same way that policy makers’ conceptions of poverty in particular are shaped by the racial influences and stereotypes, perceptions of economic inequality more generally may be informed by the local structure of inequality across racial groups, as in Soss, Fording, and Schram’s (2011) “Racial Classification Model.” This, in turn, may feed into evaluations of the usefulness of taking steps to shore up equality of opportunity or equal access to a wide range of public services.
Which Types of Public Goods?
Economic theories on public goods provide a basis for conjecturing about which public goods between-race inequality should be more or less likely to affect, and under what circumstances. Not all public goods share the same characteristics nor are they financed in the same way, and those that strike citizens as more clearly redistributive, or more likely to transfer income between groups having different social affinity, would seem most likely to be affected by the core factor we have highlighted here. Efforts to typologize public goods inevitably face challenges. Peterson (1981), for example, struggled with the issue of whether education should be considered a “developmental” or a “redistributive” good. In reality, of course, it is both.
One especially useful framework is provided by Besley and Coate (1991), who argue that the redistributive consequences of the public provision of goods are larger for goods that admit private substitution. They reason that if the quality of such a good provided in the public sector is low, rich households will be willing to pay for a higher-quality good in the private sector while lower-income households will still consume the publicly provided good. Education is probably the most widely scrutinized example of such a good, but health care and hospitals (e.g., Jimenez 2014; Peterson 1981; Schneider 1989), parks and recreational spaces, and even policing and security (see, for example, Bergstrom and Goodman 1973; Borcherding and Deacon 1972) are subject to similar dynamics. By contrast, it is more difficult to imagine private substitutes for highways, sanitation, fire protection, and libraries. 5
Applying this reasoning, we hypothesize that the public goods most affected by racial structure of inequality will be those that admit private substitution more easily by their nature. The policy areas that most clearly have these characteristics are education, health or hospital services, parks and recreation, and police protection. Those who can afford are more likely to educate their children in private schools, use private hospitals with higher-quality care, and enjoy more amenities in private parks and recreational spaces through their membership. The high-income households also hire private securities to protect their properties and neighborhoods. Of course we acknowledge that this is only one dimension that would affect the degree to which racial inequality would be expected to dampen spending on any given public good.
Political Mechanisms
How does the structure of inequality influence these policy outcomes? Prior research suggests several possible political mechanisms. Whites living in economically unequal areas may tend to elect more conservative and Republican leaders, who in turn enact fiscal retrenchment (Carsey 1995; Gelman 2009). They may also be more reluctant to vote for minority elected officials because they expect that these leaders will pursue programs that induce more intergroup transfers (Citrin, Green, and Sears 1990). In contrast, more conservative and Republican leaders may respond to the majority group’s preference for lower taxation and less spending on public goods that entail redistribution. They may also share the view that higher spending on public goods is illegitimate or wasteful because it tends to benefit “undeserving” members of minority groups who will not use it productively. Thus, the partisan and racial identities of local and state elected officials may mediate the relationship between racial inequality and spending on public goods.
Institutional factors may also come into play as moderators of these effects. Some research finds that direct democracy fosters the adoption of policies that harm minority group interests and rights (Hajnal, Gerber, and Louch 2002). Political fragmentation in metropolitan areas is asserted to produce similar dynamics. The social stratification-government inequality (SSGI) thesis, developed by Hill (1974) and Neiman (1976), suggests that highly fragmented metropolitan areas are characterized by entrenched income segregation with the affluent majority concentrated in high-income suburban municipalities with more ample tax bases. The slack resources in these areas are more likely to flow to members of the same group and those in nearby municipalities, not to minorities who reside disproportionately in central cities. Lowery (1999), for example, called the fragmented arrangements “institutionally racist in their profound, albeit unintended, consequences.” Intensified interjurisdictional competition in highly fragmented metropolitan areas may therefore moderate any dampening effects on public goods investment (Jimenez 2014; Minkoff 2009, 2012; Peterson 1981). Consequently, we expect that metropolitan fragmentation may moderate the effects of racial income inequality on local public goods spending. To the extent that available data permit, we test each of these possibilities in turn.
Independent Effects of Racial Diversity and Income Inequality
Although our focus is on the impact of the racial structure of inequality, it is worth briefly addressing what relationships we would expect to emerge for racial diversity per se and total income inequality once the relative magnitude racial component of inequality is statistically controlled. Here we must outline competing expectations rather than clear hypotheses. Prominent research by Alesina, Baqir, and Easterly (1999) argues that racial diversity could weaken support for public goods spending due to the heterogeneous preferences that members of different groups have over the form that public goods should take (what curriculum a school should offer, say, or what neighborhoods a road should run through). If this mechanism is correct, we might expect that more diverse locales would produce lower amounts of public goods even when the racial structure of inequality is held constant. However, intuitively, racially diverse locales in the United States also contain larger shares of non-White voters who may have more economically liberal views and pressure on government for more spending on public goods. This would lead to a positive relationship between diversity per se and local public goods spending.
Turning to inequality, a standard expectation from the public choice literature is that more inequality leads to greater public support for redistributive taxation (e.g., Meltzer and Richard 1981), which may in turn lead to more ample provision of public goods. However, research going back to Dye (1969) finds that inequality is sometimes negatively related to redistribution. Hero and Levy (2017) found that total inequality, controlling for the racial structure of inequality, is not consistently related to welfare spending in the states. They speculate that inequality has many overlapping group dimensions, such as class, gender, urban versus rural, suburb versus central city, and immigration or citizenship status that may dampen any positive effect of total inequality on social spending even when racial inequality is taken into account.
Data and Variables
Our analytic approach examines the relationship between the racial structure of local income inequality and government spending on public goods and services. 6 We begin by constructing four panel data sets at different levels of political geographic unit—cities, metropolitan areas, states, and school districts—in the United States over three Census years (1980, 1990, and 2000). 7 There are two reasons for choosing these different governmental jurisdictions. First, under the fiscal federal system of the United States, there are various types of local governments which share financial responsibilities for the provision of local public goods. The divisions of fiscal responsibilities are not comparable across cities (Peterson 1981); this complicates the interpretation of findings in studies of local public goods with aggregated finance data, because we cannot tell at which levels of jurisdiction the relationship pertaining to a specific public good is observed. For this reason, we start our analysis with a fiscally standardized set of cities for local finance.
Second, our analyses examine whether the local provision of public goods is determined by the level of between-race income inequality within a jurisdiction. However, Tiebout (1956) sorting of residents into communities is a potential threat to our analysis at the city level. If wealthy White residents select out of jurisdictions that are highly diverse or racially unequal and into homogeneous locales, bias is introduced and our measures of between-race inequality and racial diversity would not be exogenous to the model. However, as sorting is arguably more likely to occur within the jurisdictions that comprise a metropolitan area than between the metro areas, using a metro sample should mitigate such potential Tiebout bias at least to some degree. We further extend the testing of our hypothesis with a state sample, in which the Tiebout sorting is least likely to occur, and we also analyze school districts for public spending on education. If the results from testing the hypothesis across the several different jurisdictional levels are essentially similar, then our argument is better supported. 8 However, we would expect that the results would be less precisely estimated in the larger units as there is no direct correspondence between the aggregate diversity in these units and the jurisdictional levels across which spending on most of the public goods we analyze is being aggregated.
Our city sample comes from the Fiscally Standardized Cities (FiSC), a publicly available database at the Lincoln Institute of Land Policy. FiSC database specifically allows for comparisons of local government finances across the nation’s 112 largest urban cities by accounting for differences in the structure of local governments. 9 For our metro sample, we use a consistent Metropolitan Statistical Area (MSA) definition given by Office of Management and Budget as of June 2003. There are 362 MSAs by this definition which are made up of 1,086 urban counties. Our city and MSA sample indicates that the analysis will essentially be an examination about urban public goods provision. For school districts, we construct a sample with independent jurisdictions with populations of at least 2,500 across the nation, whether they are elementary, secondary, or unified. The data sources for all our independent variables are listed in Table A2 in the Supplemental Material.
The dependent variables are 10 categories of local spending on public goods: hospitals, health, police protection, parks and recreation, housing and community development, highways, sanitation (sewerage and trash pick-up), fire services, libraries, and education The finance data are from the direct expenditure category in the Census of Governments (1982, 1992, and 2002). As mentioned, however, FiSC provides its own finance data at the city level. All our spending data are measured in constant dollars (2011 $), per household. For education, it is per pupil expenditures, also in constant dollars (2011 $). As our interest is the local provision of public goods, for our metro and school district samples, we deduct the intergovernmental revenues of the federal and state governments from the local direct expenditures, following Peterson’s (1981) suggestion. 10 It should be noted, however, that there is essentially no intergovernmental revenue from higher levels of government for the local provision of police protection, fire services, parks and recreation, and libraries in the Census of Governments data sets.
Between-Race Group Share of Total Income Inequality
While income inequality measures, such as the Gini coefficient, interquantile income ratios, and the ratio of mean to median income, have been commonly used in applied social science research, one of the limitations of these measures is that they are not decomposable between and within groups. An additively decomposable inequality measure is defined as a measure such that the total inequality of a population can be expressed as a weighted average of the inequality within subgroups of the population and the inequality between them. Bourguignon (1979) showed that Theil’s (1967) T index meets these criteria.
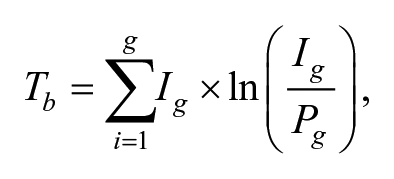
where Tb is the inequality between the g groups, Ig is group g’s income share, and Pg is group g’s population share.
To understand the Theil index, consider the ln(Ig / Pg) term. It expresses how large each group’s income share is relative to its population share. If all groups’ income shares and population shares are exactly equal, there is no between-group inequality in that population, for the groups indexed by g. This makes the fractions all equal to one, and their natural log is zero, leading to a between-group T of zero. However, if a group possesses more income share than their population share, it positively contributes to income inequality. If a group has less income share than their population share, it negatively contributes to income inequality. But as each of these contributions is weighted by the group’s income share, the positive deviations from parity outweigh the negative deviations in the sum, and the greater the deviations, the greater the between-group T becomes.
Note that this between-group inequality measure accounts for the total inequality between groups indexed by g. It is not simply the mean difference in incomes between groups in society, a variable that could be quite large even if a society is highly heterogeneous but has a small minority population that is extremely disadvantaged relative to the majority. Instead, this measure of between-group inequality accounts for both this “depth” of inequality and its breadth—how much of the society’s total income it pertains to. Modest disparities between groups may nevertheless contribute substantially to explaining total inequality if more than one group holds a significant share of the total income. But even very large disparities between groups may contribute little to a society’s total income inequality if almost all of the income resides in one group, which can happen in sharply unequal but still quite racially homogeneous settings.
We first calculate the total income inequality by applying this formula to Theil’s T index with the “groups” simply being household income brackets according to the U.S. decennial Census and call this total income inequality. Note that this process underestimates the total amount of income inequality because it captures inequality only between groups defined by income brackets, not between all individuals or households in the society. We also calculate Theil’s T index with the groups being race/ethnic groups and label this between-race inequality. For the race and ethnic groups, we use “Non-Hispanic White,” “Black,” “Asian,” “Native American,” and “Hispanic.” Our main explanatory variable racial inequality is the share of between-race inequality of total income inequality, measuring the extent to which total income inequality is accounted for by between-race disparities. Table A1 in the Supplemental Material presents the summary statistics for key variables of our four samples.
Table 1 lists the 10 most and least racially unequal and heterogeneous cities in 2000 from our city database. Of particular note is that the cities in which racial inequality explains the highest portion of total inequality do not overlap greatly with the cities with the highest level of diversity per se. Predictably, there is greater overlap between the least racially unequal and the least diverse settings. Intuitively, this is because places with very little racial diversity must also be ones in which between-group inequality contributes very little to income disparities.
Ten Most and Least Racially Unequal and Heterogeneous Cities in 2000.

Note. Racial inequality is calculated with Theil’s T index whereas racial diversity is calculated with an inverse of Herfindahl–Hirschman index. The universe of the sample is 112 largest cities in the United States.
An illustrative comparison can help underscore the nature of our theoretical expectations about racial inequality and urban public goods provision. Consider, for example, that in 2000, both New Orleans and Cleveland were highly racially diverse cities, similar in population size, unemployment rates, poverty rates, and average household incomes. And New Orleans had a higher level of income inequality overall, which according to standard public choice models would promote a higher level of income redistribution. However, between-race income disparities explained a considerably larger share of income inequality in New Orleans than in Cleveland. In New Orleans, more than 13% of the total income inequality was due to the disparity between the city’s racial groups, a percentage that was two times higher than the national average. Despite its racial diversity, Cleveland’s between-race income gaps explained merely 3% of total inequality. In keeping with this article’s theoretical framework, New Orleans spent much less on public goods ($3,000 per household in 2011 constant dollars) than the national average ($4,600 per household in 2011 constant dollar), whereas Cleveland spent much more ($6,800 per household in 2011 constant dollar). Of course there are myriad other potentially influential differences between these two cities, underlining the need for the systematic analysis we turn to next.
Empirical Model
The relationship between racial inequality and local public finances is estimated using the following panel model specification:

where i indexes a city, or MSA, or state, or school district in Census year t; y is a local provision of public goods such as direct expenditures per household (constant 2011 $). Note that all our right-hand-side variables are lagged by one year. For the metro and state sample, all local government spending in m
etro and state boundary are aggregated.Our main independent variable Racial Inequality is the share of between-race income disparities of total inequality, T is a vector of total inequality, D is a vector of racial diversity, 11 and X contains a set of demographic characteristics of the sample units, known to affect local public goods spending from the literature including log of total population, average household income, the share of the population over 25 years of age with a college degree, the share of the population 65 years old or more, the unemployment rate, and the poverty rate under 100% of the federal poverty line. Z represents local public goods-specific conditions such as crime rate for the police spending model and hospital bed rate, physician rate, and the number of hospitals for the health and hospital spending models. P is a set of political and institutional variables that measure if a mayor or governor is racial minority and their political party affiliation. 12 For the state-level analysis, we also use citizen ideology score which is borrowed from Berry et al. (1998). The metropolitan area-level analysis includes the degree of political fragmentation—the number of municipalities in a metropolitan area.
The coefficient
We take advantage of the longitudinal data structure in two ways. First, even though the evidence presented here cannot cleanly identify a causal relationship, using conservative fixed-effects specifications that limit the analysis to variation within units over time rather than random-effects eliminates unobserved time-invariant confounders. This partly addresses the concerns on the possibility of omitted variable bias. We also include Census year fixed effects to capture the association between unobserved variables and local spending on public goods to account for unexplained time trends.
Results
Effects on Total Public Goods Spending
Table 2 presents the results with demographic control variables from the three different samples of jurisdictional responsibility. The dependent variable is the sum of local and state spending on the nine public goods we examine. What stands out is that the effects of racial inequality on total public goods spending are consistently negative and statistically significant, whereas the effects of racial diversity and total income inequality are not. Consistent with the social affinity models described above, the extent to which inequality is a by-product of disparities between races is a key determinant of aggregate spending on public goods. The total amount of income inequality or the level of ethnic diversity per se does not exert a consistent effect.
Effect of Racial Inequality on Total Public Goods.

Note. Robust standard errors clustered by each sample unit in parentheses. R2-within reports variation within units explained by the covariates as a percentage of total within-unit variation. MSA = Metropolitan Statistical Area; HH = Household.
p < .1. **p < .05. ***p < .01.
The city and metro results in Table 2 show the negative signs for both racial inequality and diversity, but only racial inequality is negative and significant (p < .05). The same pattern obtains in the state results, although racial inequality falls short of statistical significance (p = .11). But even this weak relationship is arguably notable given that states have little direct financial responsibility for local public goods.
Comparing the results at three different jurisdictional levels, the effect of racial inequality is amplified as the political unit increases in size, consistent with the possibility that estimates at lower levels of aggregation are biased toward zero due to residential selection effects. Because the state-level results should be least susceptible to Tiebout sorting, the effect of racial inequality should be largest. But they are also playing out over a larger jurisdiction in which some municipalities and school districts may be relatively less affected by racial inequality in the state as a whole. This explains why these units show the largest effects but the least precisely estimated relationships (i.e., large standard errors).
While the Herfindahl–Hirschman index is a measure that is commonly used for racial diversity in the literature, its potential drawback is that the index mechanically treats homogeneous Black, Hispanic, and White cities alike. Because our study taps a variation of income differentials across groups, differentiating these cities needs to be considered. In Table A3 in the Supplemental Material, we report the results with share of Black and Hispanic household of the Herfindahl index of racial diversity (Panel A). This alternative model specification does not change the main findings reported in Table 2. Rather, it seems to reinforce the significance of racial inequality effects on total public goods spending.
To allay potential concerns about outlier effects and high leverage points, in Panel B in Table A3, we also report the results with our dependent variables logged. The results show that racial inequality still manifests a negative effect in the city sample (p < .05), whereas in the metro sample, the standard error gets larger but the magnitude and sign of the estimates remain consistent with the theory that a higher between-race share of total inequality dampens spending on local public goods.
These results strongly corroborate our expectation that such effects are not confined to welfare redistribution. Clearly, there is a link between local-level inequality and the provision of public goods that are not as well known to be racialized and whose stated purpose is not to redistribute income. Notably, most of the categories of public goods we analyze are not classified as “redistributive,” instead falling under headings such as developmental or allocative (Peterson 1981).
By contrast, the independent effects of racial diversity and income inequality are quite varied and never statistically significant. To speculate, it may be that the competing expectations we outlined for the independent effects of racial diversity and income inequality do offset to some extent. Racial diversity may make it more challenging to reach agreement on how public funds should be spent and the form that goods should take, weakening support for the necessary compromises. But it may also tend to increase support for spending on public goods because more diverse areas tend to have more non-White voters, who also tend to have more left-leaning attitudes toward government spending and taxation. Inequality may produce more demand for taxation but if there are between-group dimensions of inequality that our analysis has not considered (e.g., class or immigration status) and are not fully captured by the racial inequality component, these intergroup disparities might push in the opposite direction. However, why the effects would offset differently at different levels of aggregation remains puzzling, and with the caveat that causal effects cannot be perfectly identified in such models, a second possibility is that these variables tend not to matter, on balance, in and of themselves except inasmuch as they overlap. We will have more to say about these effects below, where we disaggregate effects on total public goods spending by category.
Which Public Goods?
Which public goods in particular are being reduced? Our theory led us to expect negative impacts to be largest in several categories: education, health or hospitals, parks and recreation, and police protection. Recall that these goods allowed the greatest substitutability to privately provided services and hence seemed more prone to being cut.
We start by describing the education spending results at the school district level. Table 3 shows negative effect of racial inequality on school district spending, and the results are robust across seven different model specifications.
Results at the School District Level.

Note. We define outliers as the school districts with the largest 1% and smallest 1% of changes in either racial inequality index or in the school district spending on education by decade. For the models (1) through (4), the dependent variables deduct the intergovernmental revenues from higher-level government to measure local provision. For the models (5) through (7), the dependent variables do not deduct the intergovernmental revenues. Deducting the intergovernmental revenue for the models (5) through (7), however, does not change the results. For the court-ordered school finance reform coding, we follow Card and Payne’s (2002) taxonomy. The school districts with high discretion over their finance are defined as those whose share of state intergovernmental revenue in their total local education direct spending is below the median (56.13%) as of 1980. The districts with low discretion are above the median in 1980. Robust standard errors clustered by school districts in parentheses. SFR = School Finance Reform; IGR = Intergovernmental Revenue from State; FE = fixed effect. HH = Household.
p < .1. **p < .05. ***p < .01.
In column 1, we analyze a fully balanced school district sample (n = 21,267); in column 2, we display the results excluding outliers; and in column 3, we further eliminate the districts with negative expenditures under our definition of local provision. In column 4, the model accounts for school finance reform that occurred during the period of our study. School districts had substantial changes in their finance sources—a shift from local funding toward greater state funding, fueled in part by court-ordered school finance reform (Card and Payne 2002; Corcoran and Evans 2010; Hoxby 2001; Murray, Evans, and Schwab 1998). Controlling for this factor is meant to account for the changes in the structure of school finance. The reform was in place to equalize local school finance by redistributing the resources from the wealthier districts to the poorer districts. We use average household income as a reasonable proxy for the wealth of the district (see, for example, Card and Payne 2002), and through the interaction term, we allow the effect of district-level average household income to vary by a state’s school finance regime.
Because intergovernmental revenue from states constitutes to be a main funding source in school district spending, we do not deduct intergovernmental revenue from the total district spending in column 5, but instead control for intergovernmental transfer as an independent variable. Either approach yields similar results, however. In columns 6 and 7, we further sort out the districts with high discretion over the use of their funds from those with low discretion. Our expectation is that we would see stronger negative effect of racial inequality for those with high discretion over their funds, whereas the effect would be weaker for the districts with low discretion. The results in columns 6 and 7 confirm this prediction as well.
Next, turning to city, metro, and state-level analyses, we examine whether these predictions are corroborated for the other public goods we highlighted, after controlling for the goods-specific condition variables. Table 4 shows these results. The broad patterns we observe are consistent with our theoretical expectations, though predictably also imperfectly so.
Budget Cut Effect of Racial Inequality on Public Goods.

Note. Robust standard errors clustered by each sample unit in parentheses. R2-within reports variation within units explained by the covariates as a % of total within-unit variation. Demographic variables are controlled (not shown). NA notes data not available.
p < .1. **p < .05. ***p < .01.
Our city-level results in Panel A show that racial inequality triggers the municipal budget cuts for the investment on hospitals, police protection, and parks and recreation. On the contrary, there is no substantial effect of racial inequality on city spending on highways, sanitation, fire, libraries, and housing and community development. The metro-level results in Panel B illustrate that the budgets of health and police protection are similarly cut as racial inequality grows. However, the budgets of parks, highways, sanitation, fire, libraries, and housing and community development are not significantly affected by racial inequality in the areas. In state-level analysis (Panel C), the budgets are also cut for police protection, and park and recreation services. Housing and community development is also one of the budget cut policy areas that racial inequality influences. The sign of racial inequality on housing and community development spending is negative in all three samples (Panel A through C) but only significant at the state level, possibly because local revenues only constitute 25% of total state and local spending in this policy area.
The consistency of the results across the public goods largely corroborates our theoretical expectation that the effects of racial inequality would be strongest for privately substitutable goods. In Table A4 in the Supplemental Material, we summarize an array of evidence examined at different levels of jurisdictions and across a variety of public goods. It shows that racial inequality is a strong predictor of variation in government spending on local public goods, with clear negative impacts. 14
Turning again to the independent effects of racial diversity and income inequality, the picture is quite a bit murkier. Racial diversity is statistically significant no more often than we would expect by sheer chance in estimating many separate regression models, and each of the two significant coefficients is differently signed. This in fact parallels mixed findings in the research literature (S. Lee, Lee, and Borcherding 2015; cf. Alesina, Baqir, and Easterly 1999). 15 The positive relationship between diversity and education spending at the school district level is consistent with our speculation that in more diverse settings, controlling for racial inequality, more spending would be achieved as a function of the more fiscally liberal preferences of non-Whites. However, this conjecture does not find clear support for any other public good.
To the extent that we obtain significant results for total inequality, they are negative, which goes against the standard expectation in public choice models that more income inequality will lead to more support for redistributive taxation and hence, presumably, to more ability to spend on public goods. This may reflect the influence of other between-group dimensions of inequality. Or perhaps the median income voter models from the public choice literature simply do not pertain well to the U.S. case, either because policy making is frequently insulated from mass opinion or because voters’ appraisal of trends in inequality does not match economic reality.
Political Mechanisms
To examine whether the political mechanisms we highlighted mediate the relationship between racial inequality and local public goods spending, in Table 5, we add a set of political and institutional variables with a focus on racial identities and party affiliation of those who control the local and state political institutions and the citizen ideology. Because the number of cities in the sample becomes smaller with these political variables, we first report the baseline results with the same smaller sample size. Then, we examine whether adding the political variables mediates the relationship reported in the baseline results. For the metro-level analysis, we investigate whether metropolitan fragmentation moderates the effect of racial inequality on local public goods spending. To save space, in Table 5, we focus on the results on racial inequality with these political variables.
Results with Political and Institutional Variables.

Note. Robust standard errors clustered by each sample unit in parentheses. Demographic variables are controlled (not shown). The model estimates each column separately;
HH = Household. *p < .1. **p < .05. ***p < .01.
The results overall suggest that the political and institutional variables do not mediate or moderate the relationship between racial inequality and local public goods spending. Whether the cities and states elect non-White mayors and governors or not and Republican or Democrat leaders does not mediate the effect of racial inequality on local public goods provision (Panel A and C). The null mediation effects from Berry et al.’s (1998) citizen ideology score further suggest that the citizens’ perceptions of economic inequality between groups and their unwillingness to pay for other groups’ greater benefit may be so profound that the set of political, institutional, and public opinion variables we consider here do not mediate the relationship at all (Panel C). Or, as Soss, Fording, and Schram’s (2011) “Racial Classification Model” suggests, policy makers’ conceptions of economic inequality may be informed by the local structure of inequality across racial groups, regardless of their racial identities or party affiliation. Contrary to expectations, the metropolitan fragmentation environment does not moderate the relationship at the metro level, either (Panel B).
Conclusion
The results of extensive analyses across four different jurisdictional levels and many areas of local government responsibilities broadly support the core theoretical claim: The more that income inequality is attributable to inequities between racial and ethnic groups, rather than between individuals within groups, the less investment localities make in public goods. By contrast, we find little evidence that the overall level of income inequality is consistently linked to local investment in public goods, and there is no consistent negative or positive relationship between racial diversity per se and public goods spending.
These results are generally consistent with Lind (2007) and Hero and Levy (2017), who find a negative association between the extent of between-race inequality and welfare redistribution at the state level. That is, the racial “structure of inequality,” rather than aggregate inequality or social heterogeneity in and of themselves, is a critical factor. Thus, it seems that it is not just welfare policy which is affected by between-race inequality; its impacts are also evident regarding a range of ostensibly non-redistributive policies at the local level as well (cf. Hersh and Nall 2016).
Much clearly remains to be illuminated in future research. For one, it would be useful to link between-race inequality to public opinion or vote choice or to local elected officials’ interpretation of public opinion, as this would provide more direct evidence of the mechanism most researchers have proposed (Hajnal and Rivera 2014; Hersh and Nall 2016). However, this bottom-up mechanism is not mutually exclusive of the alternative explanation we noted, namely the application of racial biases by policy makers in developing understandings of the nature of local inequality and utility of investing in expansive public services. For another, it would be useful to ascertain whether these results might help explain some of the inconsistency in findings concerning the relationship of diversity with public goods spending. While Alesina, Baqir, and Easterly (1999) reported fairly robust results, others (e.g., Boustan et al. 2013; Hopkins 2011) have not corroborated their findings. Hopkins (2011) also showed that the cross-sectional relationship Alesina et al. present appears to diminish over time. If the growth in local racial diversity has outpaced the growth in between-group inequality, and between-group inequality rather than diversity is the proximate causal agent, this is the pattern we would expect.
In the contemporary context, the political significance of race may well be most clearly manifest through between-race economic inequality and its impacts on explicitly redistributive policies. However, our analyses of public goods provision suggest that the impact of racial inequality on public policies may go well beyond welfare and thus be more pervasive and more profound than previously recognized. In any case, the findings of between-race economic inequality and public policies identified here and elsewhere underscore the importance of further and careful inquiry to better understand how, how much, and why those relationships exist and persist within and across levels of the American political system and to the importance of considering inequality and diversity jointly as influences on political outcomes rather than as separate variables.
Footnotes
Declaration of Conflicting Interests
The author(s) declared no potential conflicts of interest with respect to the research, authorship, and/or publication of this article.
Funding
The author(s) received no financial support for the research, authorship, and/or publication of this article.
Notes
Supplemental Material
Supplementary material is available for this article online.
Author Biographies
References
Supplementary Material
Please find the following supplemental material available below.
For Open Access articles published under a Creative Commons License, all supplemental material carries the same license as the article it is associated with.
For non-Open Access articles published, all supplemental material carries a non-exclusive license, and permission requests for re-use of supplemental material or any part of supplemental material shall be sent directly to the copyright owner as specified in the copyright notice associated with the article.
