



Abstract
Research often finds a positive relationship between public transportation investment and gentrification in nearby neighborhoods. This dynamic is particularly important in urban contexts that plan for transit-oriented development and creating future “walkability.” In this study, I demonstrate a link between transit investment and changing neighborhood racial and ethnic composition, using a case study of the recent light-rail project in Seattle, Washington. Descriptive analyses and difference-in-difference models suggest that affected neighborhoods in Seattle experienced rising shares of non-Hispanic Whites following the start of light-rail construction, while neighborhoods at the suburban periphery of the line saw substantial growth in racial and ethnic diversity. These findings highlight the role of transit infrastructure in restructuring demographic trajectories of nearby neighborhoods and contribute evidence about shifting patterns of residential segregation in the area around the transit line.
Residential segregation remains a defining feature of U.S. metropolitan areas. Studying processes of neighborhood change provides insight into forces that recreate segregation in relation to shifts in the greater metropolitan opportunity structure. Public investments in transportation facilitated suburban growth throughout the twentieth century, suggesting theoretical reasons for why contemporary forms, such as light-rail transit, might also matter for prevailing patterns of metropolitan demographic change (Jackson 1987). Assessing the effect of new infrastructure on neighborhood trajectories is difficult given this process’s reciprocal nature. However, a relationship between these phenomena still informs of public capital’s importance in changing neighborhood trajectories and patterns of residential segregation. This study investigates the significance of modern public infrastructure investments for neighborhood composition by analyzing trends in racial and ethnic groups’ population shares near a recent light-rail (LR) project in Seattle and its suburbs.
In the modern political economy of transportation “mega-projects” and urban renewal, neighborhoods are a comparatively small unit in a larger context of public and private actors competing to define project success (Altshuler and Luberoff 2004; Hyra 2012). At state and county levels of governance, “smart growth” policies designate particular areas (usually well-served by transit) as targets for increased population and ecological density. At the city level, planners work with private developers and community groups to revitalize station areas as amenity-rich spaces with transit-oriented development (TOD). These broader goals prove to matter particularly when areas impacted by infrastructure development show potential “rent gaps” according to their current land use (Molotch 1976; Smith 1987).
By improving transit access, but more crucially, enabling significant efforts at redevelopment, investments in infrastructure reshape the local economy. A project such as LR transit has the potential to shift housing demand to new areas, with stations acting as possible anchors for outward waves of gentrification (Zuk et al. 2017). Proponents of such investments often point to appreciating housing values as a beneficial outcome. However, rising housing costs and stiff market competition in gentrifying places imply that lower socioeconomic status (SES) households may benefit less from the resulting neighborhood upgrades to infrastructure and housing. Although SES gives insight into the process of gentrification, the history of racial discrimination in housing and credit markets assures that race is also a central dimension in conversations about transit-induced neighborhood change.
The legacies of de jure segregation left many majority-minority and racially integrated neighborhoods disinvested and disadvantaged. These dimensions now factor prominently into the calculus of where a project should go and whose neighborhoods it will impact most. Discriminatory housing and credit policies restricted African-Americans and other racial minorities’ access to the suburbs, starved central city neighborhoods of housing investment, and created racial residential stratification (Freund 2010; Massey and Denton 1993; Rothstein 2017). Central-city neighborhoods saw the greatest rises in neighborhood poverty and economic decline as deindustrialization and suburbanization pushed middle-class and affluent households outward (Jargowsky 1997; Kasarda 1989; Quillian 2012; Wilson 1987). Lasting consequences of discriminatory policy help to explain racial differences in vulnerability to directly experiencing project impacts. Segregation circumscribed many minority neighborhoods to places proximate to urban central business districts, an important predisposing factor for current inequities in urban redevelopment. This era, however, also created the contextual disadvantages in these neighborhoods important for revitalization opportunities. Vestiges of historical discrimination, therefore, underpin redevelopment opportunities created by public investments in racially diverse, central-city neighborhoods.
“Back-to-the-city” mobility among affluent, generally White households continues to reshape the housing market to reflect the tastes of this group with relatively unrestricted mobility. While large concentrations of racial and ethnic minorities (i.e., >40% for a single group) appear to condition the likelihood of gentrification, evidence suggests that racially integrated neighborhoods match the preferences of these advantaged households and now hold an increasingly valuable location in some growing cities (Hwang and Sampson 2014). Public-infrastructure investments, such as LR transit, fit perfectly with trends of urban gentrification, creating amenities especially desirable to those among the ranks of the “creative class” (Florida 2014). Transit projects add “walkability” to nearby neighborhoods via new, reliable transit access to many valued locations such as the central business district (CBD), while transit-oriented redevelopment upgrades the built environment with new residential and commercial spaces. Gentrification-related demographic change would contradict stated goals such as creating “Growing Transit Communities” with existing residents of LR neighborhoods. 1 Nonetheless, this outcome does coincide with the City’s and developers’ respective interests in increased property tax revenues and profitable land-investment opportunities (Uitermark, Duyvendak, and Kleinhans 2007). The benefits of these projects for some, however, do not diminish the costs for residents whose interests lose out to growth.
As neighborhoods grow and densify around new infrastructure, only those more vulnerable to gentrification pressures may bear the costs associated with growth. Disrupted social networks and relocation to places with weaker opportunity structures are two plausible negative consequences of household mobility from gentrifying contexts. Regional planning literature from the present case describes displacement of more vulnerable groups from impacted neighborhoods with higher minority representation as inequitable. 2 However, if households become unable to relocate within their existing neighborhoods when they choose to move again, this gradual process will still result in neighborhood succession and change even if not displacement in a traditional sense (Freeman 2005). Thinking more broadly, gentrification can also be thought of as one side of a metropolitan phenomenon called “demographic inversion” currently redefining the geography of opportunity in many U.S. metros (Ehrenhalt 2012). This concept describes how forces, such as concentrating affluence in cities, put pressures on less advantaged groups to locate in suburban contexts (whether as the result of a move or as a first destination). Changing patterns of residential segregation correspond to broader shifts in the spatial distribution of neighborhood advantage within a metropolitan area.
The present study uses Seattle’s Link Light Rail project to explore neighborhood change across the planning, construction, and inauguration of a large public investment into transit infrastructure. The empirical evidence and implications of this research contribute to discussions of gentrification and equitable development by documenting how neighborhood populations changed in the period following LR investment. The findings of this study also suggest changing neighborhood opportunity structures and patterns of residential segregation within growing urban contexts such as Seattle. I first review studies testing the relationship between transit-induced gentrification and relate implications of these substantive debates to the Seattle context and Link’s planning. Next, empirical analyses of neighborhood composition assess average trends in neighborhoods near Link and the surrounding area. After reviewing descriptive maps and statistics about composition within the study area, I model how the neighborhoods near Link saw additional differences in ethnoracial composition levels net of the other substantial change occurring throughout the study area. Equally important, this study contrasts findings from Seattle with the substantively different trends for the suburbs of Tukwila and SeaTac that Link also traverses. While a few studies address transit-induced changes in racial compositions, this research adds to the literature by connecting divergent patterns of neighborhood change between city and suburbs to shifts in the shape of metropolitan residential segregation.
Literature Review
Transit Investment and Neighborhood Gentrification
The concept of gentrification describes the process of how working-class neighborhoods change in their social and built environments amid an influx of higher-status households as part of a wave of “back-to-the-city” mobility (Lees, Wyly, and Slater 2010; Zukin 1987). Definitions almost always include some notion of upheaval in the relative status of neighborhoods and/or the class composition of residents. However, scholars disagree somewhat regarding displacement as an additional dimension or prerequisite of gentrification (Lees, Shin, and Lopez-Morales 2015). While evidence about gentrification-related displacement is mixed, the implications for residential segregation and contextual inequality are clearer (Freeman 2005). New White residents do not integrate with social networks of existing residents of color. Long-standing residents feel ambivalent about the cost of new neighborhood amenities, and patterns of broader residential segregation slowly evolve to reflect the new urban concentration of affluence (Freeman 2011). For these reasons, the intersection of race and class (particularly in the United States) implies that gentrification tends to have a disproportionate impact on minority groups even if gentrification is typically conceptualized only in economic terms.
Research looking at transit-related gentrification investigates changing sociodemographic contexts and built environments, with a relatively extensive body of research assessing the latter of these outcomes. Rising housing prices are an expected consequence in gentrifying neighborhoods, making value appreciation a straightforward and consistent indicator of gentrification. The evidence mostly suggests that proximity to LR transit raises the housing values of nearby properties (Ko and Cao 2010; Pagliara and Papa 2011; Zuk et al. 2017). Neighborhood sociodemographic contexts and built environments explain heterogeneity in this relationship. Differences in housing value appreciation also emerge when comparing impacted neighborhoods by their land-use mix, that is, whether they are near a “Walk-and-Ride” station or a “Park-and-Ride” station. A study from Phoenix, Arizona, showed that neighborhoods near the former type of station appreciated in value to a greater degree than the latter (Atkinson-Palombo 2010). Other work found that special station area zoning for transit-oriented development predicted stronger housing value appreciation (Bartholomew and Ewing 2011).
Transit-related impacts on housing market value tend to start in the transit corridor’s immediate surroundings (i.e., near the station areas), diffusing outward over time (Cervero 2006; Lin 2002). However, these changes do not necessarily wait for the project’s completion, with some evidence suggesting that the official announcement of a transit line can begin a trend of appreciation in areas expected to become LR neighborhoods (Immergluck 2009; Knaap, Ding, and Hopkins 2001). Altogether, this body of research informs how trajectories of transit-related housing appreciation partially depend on local decisions for at least two reasons.
First, the land-use mix around stations matters insofar as it creates additional amenities above and beyond transit access, suggesting that transit investment by itself may be insufficient to precipitate waves of gentrification or demographic change. Second and equally important, the planning process (i.e., selecting neighborhoods and determining optimal land-use mix) can serve as a signal of future land value in affected neighborhoods, ushering in gentrification alongside transit construction rather than after. The observed correspondence between land-use mix and rising property values may, however, depend on broader demographic processes happening around impacted areas (for example, the suburbanization of minority populations). For these reasons, this literature generates expectations about where and when housing value appreciation is more likely to occur, but also raises questions about how these places’ demographic compositions may likewise experience changes amid housing appreciation.
Other research about gentrification focuses on the ways that public transportation projects can relate to changing neighborhood socioeconomic composition nearby. Confirming the importance of land-use mix, a study of rail projects built in 14 U.S. metros from 1970 to 2000 found that neighborhoods near “Walk-and-Ride” stations showed the largest transit-related increases in their shares of college-educated households and home prices, while those near “Park-and-Ride” stations actually saw increases in household poverty (Kahn 2007). Complementing this research finding, another study considered this process in LR neighborhoods of Toronto, Montreal, and Vancouver and observed patterns consistent with neighborhood gentrification in two of the three Canadian metros (Grube-Cavers and Patterson 2015). The impacted neighborhoods in the greater Vancouver area differed in their postconstruction trends. Rather than experiencing rising shares of college graduates, white-collar workers, and household income, suburban neighborhoods near this rail line saw rising poverty and socioeconomic inequality (Ley and Lynch 2012). Described as segmenting Vancouver into three different cities, the formerly middle-class neighborhoods of the “City 3” in which minority and immigrant groups now disproportionately live are lower income and segregated from the concentrating wealth within the urban core (“City 1”).
This Vancouver case study proves to have unique relevance for the present context, not simply due to Vancouver’s relative proximity to Seattle, but also because it portends the role that these projects may have in catalyzing a two-pronged process of “demographic inversion” (Ehrenhalt 2012). This concept draws focus to dynamics of neighborhood change underway in both cities and suburbs. As gentrification creates new flows of wealthier households to urban neighborhoods, lower-income households are moving farther outward to find neighborhoods with affordable housing.
Economic theory predicting the concentration of less advantaged groups near transit access (e.g., Glaeser, Kahn, and Rappaport 2008) still holds amid demographic inversion. However, the spatial location reflects trends observed in other growing metros, that is, concentrating affluence within the central city pushes lower-income and middle-income households to suburbs just outside (Allard 2017; Soursourian 2012). Literature on transit-induced gentrification demonstrates how public transportation projects have the potential to attract higher SES households to urban neighborhoods, but the counterflow of less advantaged households to the suburbs also requires theoretical attention. By restructuring housing demand to urban transit-rich neighborhoods, “priced out” households may in turn need to expand their housing searches to new neighborhood destinations, though they may be less desirable locations, with fewer neighborhood resources and weaker market demand (notions that regional planning literature from the present case corroborates). 3 Overall, the research on transit-induced gentrification demonstrates the benefit of analyzing both suburban and central-city trends, and a need to situate neighborhood trends as part of changes in the broader metropolitan region.
Although the topic of neighborhood ethnoracial composition needs additional attention in literature on transit-related gentrification, some research paves the way for the present study and generates valuable theoretical expectations. Descriptive comparisons of postinvestment trends in 12 metropolitan areas with new LR showed that impacted neighborhoods near the transit line saw larger relative increases in their non-Hispanic White populations between 1990 and 2000. These places also experienced decreases in the share of non-Hispanic Black residents compared with trends in the broader metropolitan area (Pollack, Bluestone, and Billingham 2010). However, limitations to the analytic approaches used in prior studies raise questions about their validity.
The first issue concerns the omission of cases due to changing neighborhood boundaries. Despite noting that many block groups’ boundaries had changed over their study period, they omitted cases with boundaries that were not identical or “near-identical” between the 1990 and 2000 Censuses. Because the Census Bureau redefines these lines primarily after trends of population growth, this methodological decision could bias the relationship in either direction depending on how affordable and accessible the excluded “newly transit-rich neighborhoods” remained after projects opened. The other issue regards how this previous study used metropolitan trends to contrast LR neighborhood trends against, a decision that prohibited estimates of uncertainty and any additional controls for starting heterogeneity in population or housing characteristics. If metropolitan averages do not approximate demographic trends that these specific neighborhoods would have followed but for the LR project, then the extent to which their “large differences analysis” measures transit-related differences in composition is unclear. For these reasons, comparing treated and control neighborhoods and using comparable spatial definitions across time constitute necessary methodological refinements. Overall then, the extant research corroborates the present theoretical framework, but motivates further empirical analysis.
Planning for Seattle’s Link Light Rail
Planning for Link in the Seattle and King County, Washington, area dates as far back as the mid-1980s. Transit corridor studies identified Link’s current region spanning from the Seattle CBD through the Rainier Valley to SeaTac as an important first step toward building a regional transit network. King County voters approved the “Sound Move” measure in 1996, with Link’s construction beginning in 2002 after securing all necessary funding and land. The LR segment studied here began operation in 2009.
Figure 1 maps the spatial extent of the study region, showing its location within the greater King County area. I denote the boundaries of the City of Seattle with a bold gray line. Block group boundaries are present only within the study region to demarcate its limits. The map shows the LR line, stations, and their station names to describe the particular geography of Link. The neighborhoods near stations filled in with gray shading are the “LR-Treated” cases in all empirical analyses that follow. The Link LR line starts in Seattle’s CBD at Westlake Station and extends outward to the Seattle-Tacoma International Airport in the suburban periphery. Sound Transit—Link’s operating agency—expanded the line with two new stations north of the CBD and one south of SeaTac Airport; those stations are not considered here due to their later construction starts (2005 for the urban stations, 2013 for the suburban station) and inaugurations (2016) relative to the rest of the line.
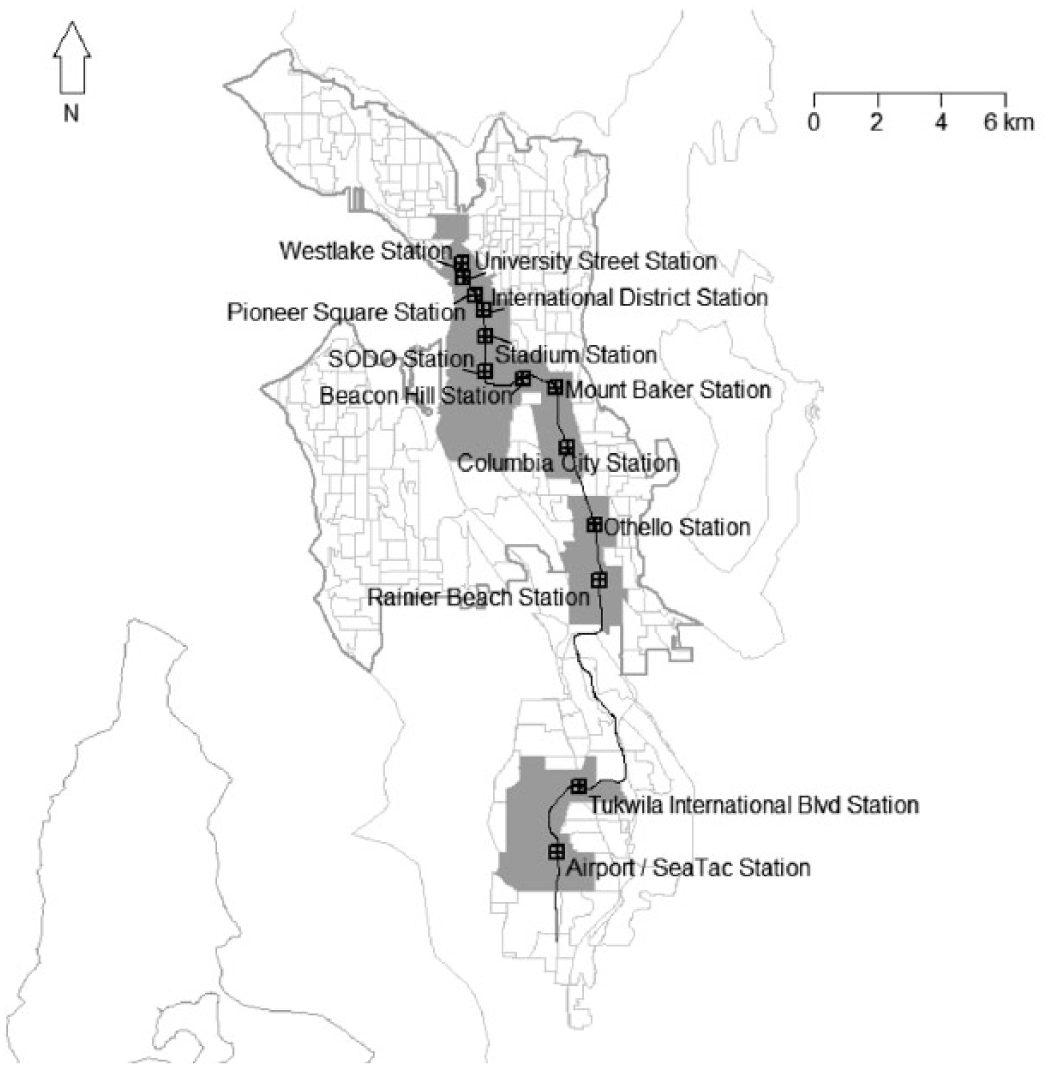
The Link Light Rail study region.
Local leaders promoted Link as an opportunity to revitalize neighborhoods, reduce traffic congestion, and improve access to employment opportunities. Documents from the planning stages of Link identify measures for evaluating project performance such as “increased commercial activity,” “reducing or controlling sprawl,” and improved “property value in areas near transit investment.” 4 Two of these goals are complementary to transit-induced gentrification. Concurrent with early planning for Link, the City of Seattle’s Department of Planning and Development held community gatherings about how best to create “Station Area Overlay Districts” for the neighborhoods near stations within the city. 5 This planning phase provided community stakeholders with a means to give input on the optimal land-use mix near their neighborhoods, a process described as “collaborative” by a study observing these efforts (Sirianni 2007). While this example of the so-called “Seattle process” gave communities’ opportunities for input on the particular configurations of TOD near different stations, growth policies and planning effectively set the agenda (i.e., economic development and revitalization).
Station areas in Seattle coincide with particular land designations where higher-level policies and planning preordain trajectories of density and development (25% of housing growth, 35% of employment growth). 6 Since 1994, the City of Seattle’s Comprehensive Plan designates particular areas as “urban villages” and “urban centers” as a way to responsibly plan for future growth and development. The guidelines for these areas, in tandem with King County’s own comprehensive plan, satisfy Washington State’s 1990 Growth Management Act. 7 Dense urban spaces necessitate transit access, so proximity to Link factors prominently in designated areas’ overlap with Seattle station locations. Under this planning scheme, growth in the smaller, residential “urban villages” near Link encompasses revitalizing existing neighborhood business districts as walkable spaces and increasing density with new mixed-use developments.8,9
In contrast to the Seattle neighborhoods, the two suburban stations saw less planning for growth. The Tukwila Station is the only “Park-and-Ride” option along the line, while the SeaTac Airport Station’s overlay district was adopted closer to the start of Link’s operation than groundbreaking (as was the case in Seattle). A regional typology of transit neighborhoods in the Seattle metropolitan area described the Seattle neighborhoods as “emerging to strong real estate demand and community characteristics that indicate an immediate risk of displacement.” 10 The same typology described the suburban neighborhoods much differently: “many will face challenges to implementing TOD given auto-oriented environments, weak market demand, and limited access to opportunity.” These differences in planning support separate consideration of central city and suburban locations, and also suggest that changes in neighborhood composition overlap with changing patterns of racial inequalities in neighborhood context.
Research Questions
The review of the empirical and planning literature motivates a set of research questions for the following empirical analyses related to the Seattle case. First, to what extent did neighborhoods “treated” by proximity to a new LR station see significant changes in their ethnoracial composition after Link’s groundbreaking and completion? An important feature of this is determining Link’s salience for neighborhood change, net of the trends that were going on throughout the study area and differences in neighborhood composition prior to Link Light Rail’s planning. Second, did patterns of neighborhood change differ between Seattle (i.e., central-city) and suburban neighborhoods?
Analytical Framework
Data
I employ an integrated set of data from decennial Census and American Community Survey (ACS) to investigate the relationship between transit investment and neighborhood ethnoracial composition. The decennial censuses provide information about long-term trends from 1980 to 2010, while ACS 5-Year Estimates from 2010–2014 indicate more recent neighborhood compositions in the study area. The panel of neighborhood data come from three secondary sources. Table 1 documents data sources for all variables used in the following analyses. The 1980 and 1990 data are from Geolytics. Estimates for the 2000 and 2010 periods come via the Minnesota Population Center’s National Historical Geographical Information System (Manson et al. 2017). The 2010–2014 ACS data were obtained directly from the Census Bureau.
Data Sources by Variable and Year.

Note. BG = block group; NH = non-Hispanic; NHGIS = National Historical Geographical Information System; ACS = American Community Survey; LR = light-rail; GIS = geographic information system; HU = housing unit.
The unit of analysis is what the Census Bureau calls a “block group.” These Census enumaration units are divisions of Census tracts and cover a contiguous geographic area. All observations describe the same small-area units as those used for the 2010 Census, with historical data from 1980, 1990, and 2000 harmonized to these block group boundaries. There were no changes to block group geography between the 2010 Census and the 2010–2014 ACS in King County, Washington. These neighborhood areal summaries are the most granular unit available for all periods of data, designed such that each covers an area with about 1,000 persons (though there is considerable variation around this). The data’s spatial consistency over time removes any bias from changing definitions between time points. Because the Census Bureau subdivides block group boundaries when neighborhoods experience population growth, analyses of neighborhood change require constant geographic definitions to accurately describe the trends for a consistent geographic area.
The sample of neighborhoods used in the following analyses began with all cases whose neighborhood boundaries fell within the Seattle, Tukwila, or SeaTac jurisdictions (i.e., the cities through which Link runs). 11 I dropped one Seattle control case that had no residents in 2000 because composition measures are invalid for this year. 12 Due to their demographic dissimilarity from the neighborhoods impacted by Link and physical separation from this area by a body of water, I excluded block groups from North Seattle from the sample used in the following analyses of neighborhood change. Descriptive statistics in the section “Results” include a column for these excluded cases to highlight their compositional differences.
Method
The following analyses use two different approaches to investigate the importance of LR-transit investment to neighborhood ethnoracial composition. First, a set of descriptive analyses combine insights from line graphics and dot-density maps to illustrate trends in neighborhood composition throughout the study region on average and across space. Averages disaggregated by treatment group for each period in the panel data correspond to the general trajectories that LR neighborhoods and their control counterparts followed on the neighborhood composition indicators outlined in the section “Measures.” To identify if there are central-city/suburb differences, I also disaggregate these statistics according to whether neighborhoods are located within the city limits of Seattle or the suburbs (i.e., Tukwila and SeaTac). The other descriptive component to the study uses patterns of dots to summarize the spatial distribution of different groups’ absolute sizes in the study region. Each dot on the map corresponds to 200 persons of a given group. With a series of these dot-density maps for each period starting since 1990, this descriptive component visualizes LR neighborhoods’ location and prominence in the average and Link-related trends. Overall, this empirical description informs how neighborhoods changed over the 1980–2014 interval.
To test for a relationship between LR treatment and differences in neighborhood demographic composition, I estimate two panels of difference-in-difference (DD) models. DD models are common in program and policy evaluation and use a set of covariates to estimate the average difference related to some intervention net of the average differences related to time (Bertrand, Duflo, and Mullainathan 2004). I specify models according to the following formula:

Each model predicts one of four group’s composition
I estimate separate models for neighborhoods within and outside of Seattle’s city limits, as Seattle’s central-city location and greater land-use planning create differences in these neighborhoods’ likelihood of gentrification compared with suburban locales. A restricted model specification assesses trends in composition using the DD covariates, with control only for 1980 levels of the dependent variable (i.e., levels prior to Link’s planning). The full model for each outcome adds controls for the three other racial/ethnic groups’ 1980 shares of the neighborhood population, along with indicators about population density, housing unit density, and housing unit value.
Measures of ethnoracial and neighborhood composition from 1980 (
DD models’ focal assumption of parallel trends requires that the trends that control neighborhoods followed postintervention approximate the trends that treated neighborhoods would have experienced if not for the treatment. Although no statistical test can conclusively determine the validity of this assumption, visualizing the trends between treatment and control groups helps assess its general appropriateness. Evidence discussed in the section “Results” corroborates DD’s advisability in the present context.
I use robust standard errors clustered by block group to correct for heteroskedasticity and error correlation within a neighborhood (Bertrand, Duflo, and Mullainathan 2004). I include Bayesian Information Criterion (BIC) and
Measures
The focal dependent variables for the following analyses indicate the relative composition of neighborhoods’ composition in terms of their non-Hispanic White (henceforth, White), non-Hispanic Black (henceforth, Black), Asian/Pacific Islander, and Hispanic populations. Hispanic composition indicates a block group’s share of persons identifying as Hispanic from any racial group. For all periods after 1980, the Asian/Pacific Islander composition measure measures the share of non-Hispanic Asian/Pacific Islanders. A non-Hispanic Asian/Pacific Islander count cannot be obtained from the 1980 Census, so for this period only the Asian/Pacific Islander and Hispanic counts might overlap. Given the relative paucity of Hispanic persons in 1980 and lack of alternatives, this methodological compromise is necessary but should not bias results.
LR treatment is indicated with a dummy variable, coded 1 if a block group’s boundaries intersected a quarter-mile Euclidean buffer around any of the Link stops. In other words, treated neighborhoods were cases whose boundaries were within a quarter mile of a station “as the crow flies.” This operationalization corresponds with the City of Seattle’s Station Area Overlay Districts (SAOD) that retooled the zoning in station areas to facilitate TOD. A set of dummy variables specifies the time period for racial composition estimates, each interacted with the treatment indicator to give a complete set of treatment group-specific trends in composition over time. The panel cross-sections do not perfectly align with the 2002 construction start and 2009 inauguration. Assuming that transit-related change proceeds gradually over time (rather than at a whirlwind pace), the 2010 estimates should roughly cover during-construction differences while the 2010–2014 ACS estimates describe any postinauguration transit-neighborhood change relationship. I use an additional dummy variable to stratify models by central-city/suburb distinction, with this measure distinguishing between block groups that fall inside or outside of Seattle’s city limits.
The remaining covariates control for observable heterogeneity in population and housing composition at the start of the analytical time frame. Pre-LR planning (i.e. 1980) composition measures include population density (population/areal size), housing unit density (housing units/areal size), levels of each ethnoracial composition measure, median gross housing unit value, median gross housing unit rent, and the count of vacant housing units. The median gross housing unit value and rent measures use 1980 dollars. These covariates adjust for relative differences in the four ethnoracial groups’ population shares, along with neighborhood housing unit cost and availability in the period before Link’s planning. This, accordingly, helps rule out observed heterogeneity in starting composition as a confounder for trends from 1990 to 2014, and gives a more robust estimate of expected differences in composition related to LR treatment.
Results
Descriptive Analysis
Table 2 reports summary statistics for all cases in the study at their 1980 baseline levels, disaggregated by treatment group and central-city/suburban location. These population and housing characteristics provide insight into the relative similarity between neighborhoods in the treatment and control group prior to Link’s planning. Overall, Seattle block groups differed from suburban cases in their relative racial composition, with the former group relatively more diverse on average. While suburban cases were nearly all-White in 1980, people of color comprised about 30% of neighborhood residents in the Seattle block groups (with the three minority groups studied here accounting for the vast majority of this non-White share). Moving to the other dimensions, the overall estimates indicate that Seattle cases were relatively denser than their suburban counterparts in population and housing units at the beginning of the study time horizon. The North Seattle cases excluded from the study’s control group differed in average racial composition and housing cost compared with the remaining neighborhoods in Seattle included in the study sample.
Pre-LRT Planning Descriptive Statistics, 1980 Census.

Note. LRT = light-rail transit; PI = Pacific Islander; HU = housing unit.
p < .05. **p < .01. ***p < .001.
Within Seattle, the significant t tests indicate that 1980 average racial composition and housing unit characteristics differed some between the study groups. Left uncontrolled, this heterogeneity would otherwise jeopardize the DD’s validity by biasing the implied counterfactual trends for the Seattle LR-treated neighborhoods toward those of mostly White, higher-cost areas. Theoretical reasons for this include the Link’s location along Martin Luther King Way (a relatively busy thoroughfare) through much of the southeast Seattle corridor, an ecological factor that likely suppressed demand and housing costs in this area prior to Link’s redevelopment. In the suburban cases, though fewer in absolute numbers, the data show parity on all dimensions as of 1980. The observed heterogeneity in 1980 composition for the Seattle study groups requires statistical control in the regression models, because these alternative explanations potentially confound differences related to the Link project. Supplementary analysis with 1990 averages of the same covariates found a pattern comparable to the 1980 statistics in Table 2.
Figure 2 graphs the trends in Asian/Pacific Islander, Black, Hispanic, and White composition from 1980 to the 2010–2014 ACS, breaking down these trends by central-city/suburb location and also by LR treatment study groups. Light-blue lines denote the average trends for control neighborhoods, while dark-blue lines show those of LR-treated. I also include a dashed dark-blue line for comparing LR-treated neighborhoods’ observed trends against those assumed by the DD framework as their counterfactual (i.e., what these neighborhoods would have seen, if not for the LR investment). A vertical dashed black line at year 2002 corresponds to Link’s groundbreaking.
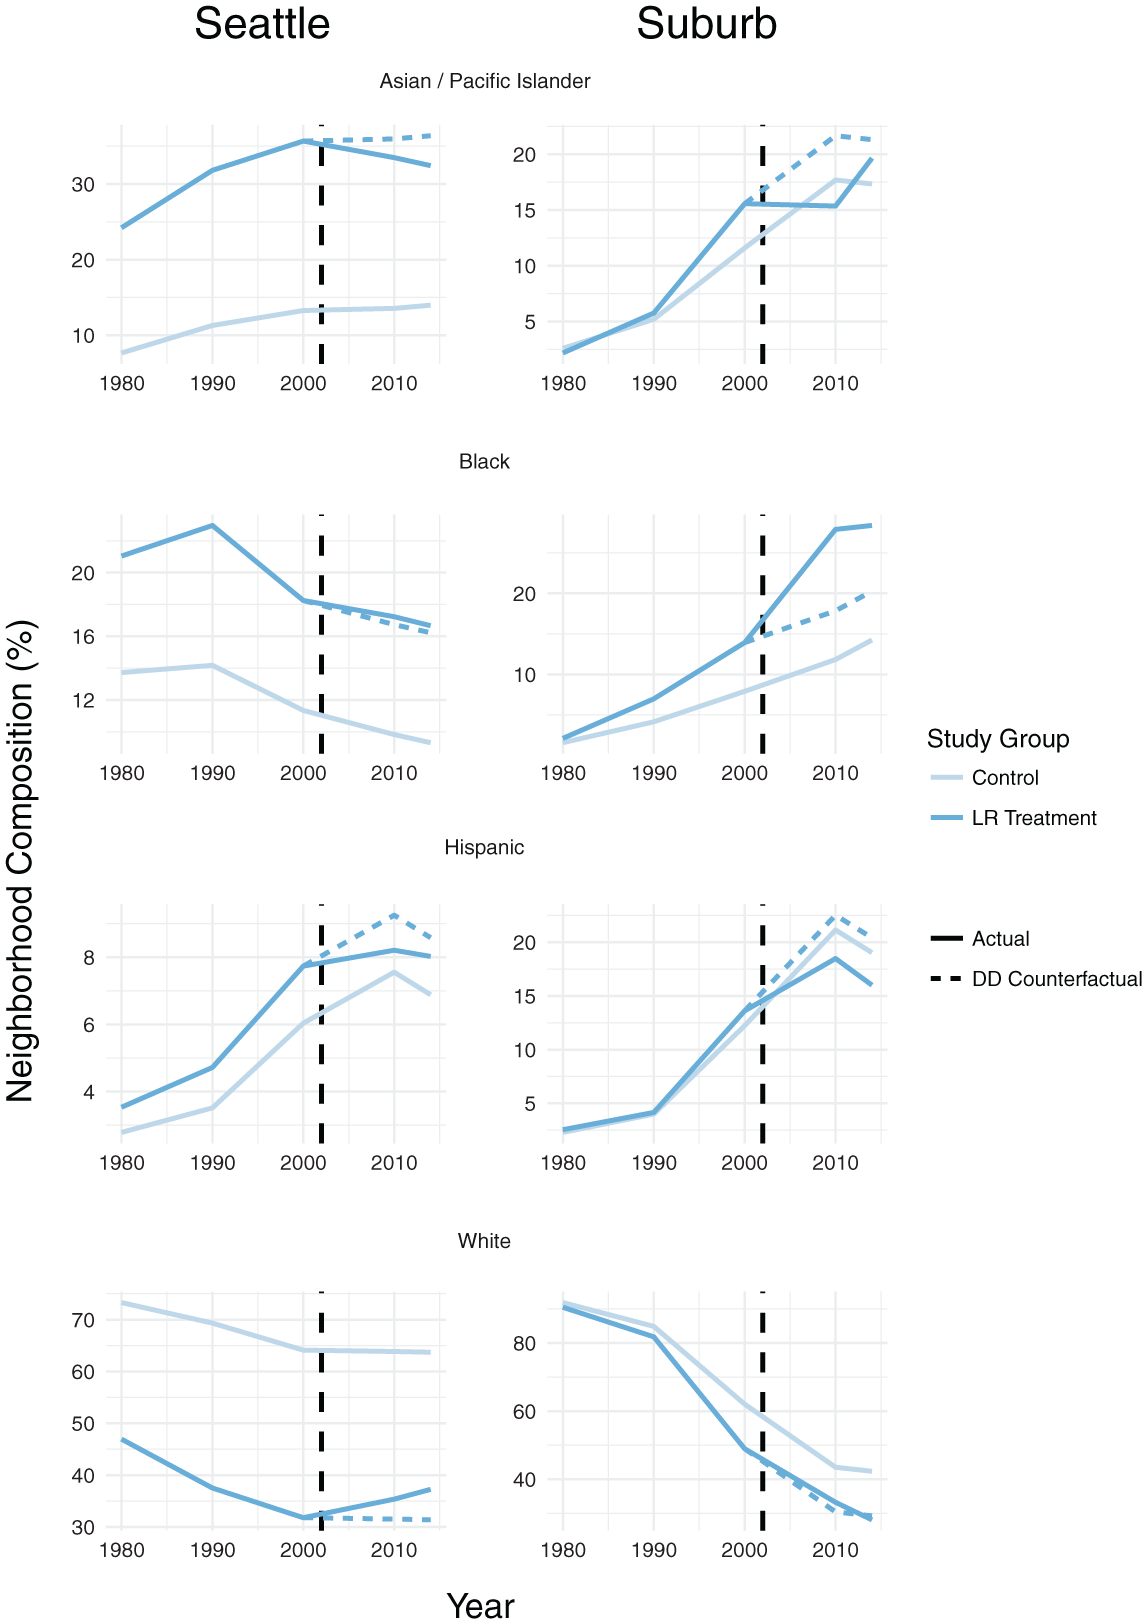
Average trends 1980-2014 for control and treated neighborhoods, by outcome and Seattle/suburb location.
Starting with Seattle neighborhoods, LR-treated neighborhoods show the following trends. First, Asians and Pacific Islanders increased in their relative share of residents up until 2000 across both study groups. Following Link’s groundbreaking in 2002, LR neighborhoods had decreases in percentage Asian and Pacific Islander. These trends were otherwise unexpected compared with those of control block groups. Steady decreases characterize trends in percentage Black throughout Seattle. Trends for treated cases were in line with those of control neighborhoods (with <1% difference from the DD counterfactual after 2000). The following spatial description over time evinces how the declines in treated neighborhoods did not differ enough to outweigh the increasingly complete outmobility of Blacks from the Central District neighborhoods in the control group. Hispanics, though less than 3% of all residents in 1980, grew substantially in their share throughout Seattle. Although these increases were smaller between 2000 and 2010 for treated cases, we observe substantively similar trends in percentage Hispanic between study groups. There was a modest decline in percentage Hispanic from 2010 to the 2010–2014 ACS.
White shares were declining from 1980 to 2000 in Seattle cases. Following 2000 and corresponding with Link’s construction, LR-treated neighborhoods saw an increase of about 6 percentage points for White composition. Although Seattle neighborhoods near LR remain majority-minority on average through the latest data in the panel, the slope of increasing White shares post-2000 nearly mirrors the downward trends from the prior decade. Even within the control neighborhoods farther out from Link, the trends suggest an end to declining White composition at the point of construction in 2000, flat-lining for the remainder of the data’s coverage. Although the data cannot forecast with much certainty where these estimates will trend by 2020, increasingly, White neighborhoods appear possible in the Seattle cases near Link.
Trends differed substantially in suburban neighborhoods, where Asian/Pacific Islander, Black, and Hispanic shares grew through most of the study period. LR-treated neighborhoods increased from about 15% Asian/Pacific Islander in 2000 to around 19% by the 2010–2014 ACS. Although these gains were slightly delayed relative to control neighborhoods, both groups reach a comparable level by 2014. Black shares in suburbs increased throughout the 1980 to 2014 ACS period, particularly for LR neighborhoods between 2000 and 2010. In LR neighborhoods, the 2000–2010 period corresponded to a near doubling in the neighborhood percentage Black. Following 2010, LR neighborhoods’ trends of increasing percentage Black leveled off. Control cases saw a fairly linear increase in percentage Black from 2000 to 2014. Hispanic shares grew throughout most of the data’s temporal span, with treated and control cases reaching respective levels of about 16% and 19% by 2014. Between 2000 and 2010, LR neighborhoods’ growth in percentage Hispanic was lower than expected based on control cases’ trends. Opposite all these trends was a steep decline in the White share of neighborhood residents, a roughly 50% decrease from the 1980 levels over the panel’s timespan.
The suburbs in the study are on a trajectory of increasing racial and ethnic integration, though Whites appear to be leaving amid these changes. Through the reciprocal process of increasing rising diversity in the suburbs and rising gentrification in the Seattle area, the increasing concentration of people of color in the suburbs either lowered Whites’ relative demand for these neighborhoods, or worse, actively induced “White flight” from these contexts toward new urban and suburban spaces. While Seattle neighborhoods plausibly gentrified based on theory about this process and the observed trends, the relatively weaker potential for growth and observed trends in the suburban LR areas may correspond to greater housing affordability and availability.
These descriptive results suggest that treated neighborhoods’ composition trends diverged from those of control cases in the period following Link’s opening. The quality of Link-related differences, however, varied based on location within or outside of central-city Seattle. Seattle treated cases experienced increasing White shares and decreasing Asian shares from 2000 relative to the counterfactual trends of the control group. The average trend for Suburban treated neighborhoods suggests unexpectedly large gains in their share of black residents, a slightly delayed growth in their Asian/Pacific Islander population shares, and lower-than-expected increases in their Hispanic populations’ relative sizes.
To visualize these trends spatially, Figure 3 gives dot-density representations of 1990, 2000, 2010, and 2010–2014 ACS levels of the four racial and ethnic composition measures. Each symbol corresponds to 200 persons of a given group residing within the neighborhood. As Census estimates are aggregate summaries for neighborhood areas, this visualization randomly distributes points within the boundaries to produce a description of the neighborhood context. So while these plots provide information on changing compositions and patterns of segregation, they do not map specific locations within neighborhoods. The purple plus symbols correspond to non-Hispanic White persons, the blue rectangles to non-Hispanic Black persons, the green triangles to Asian and Pacific Islander persons, and the yellow hollow squares to Hispanic persons.
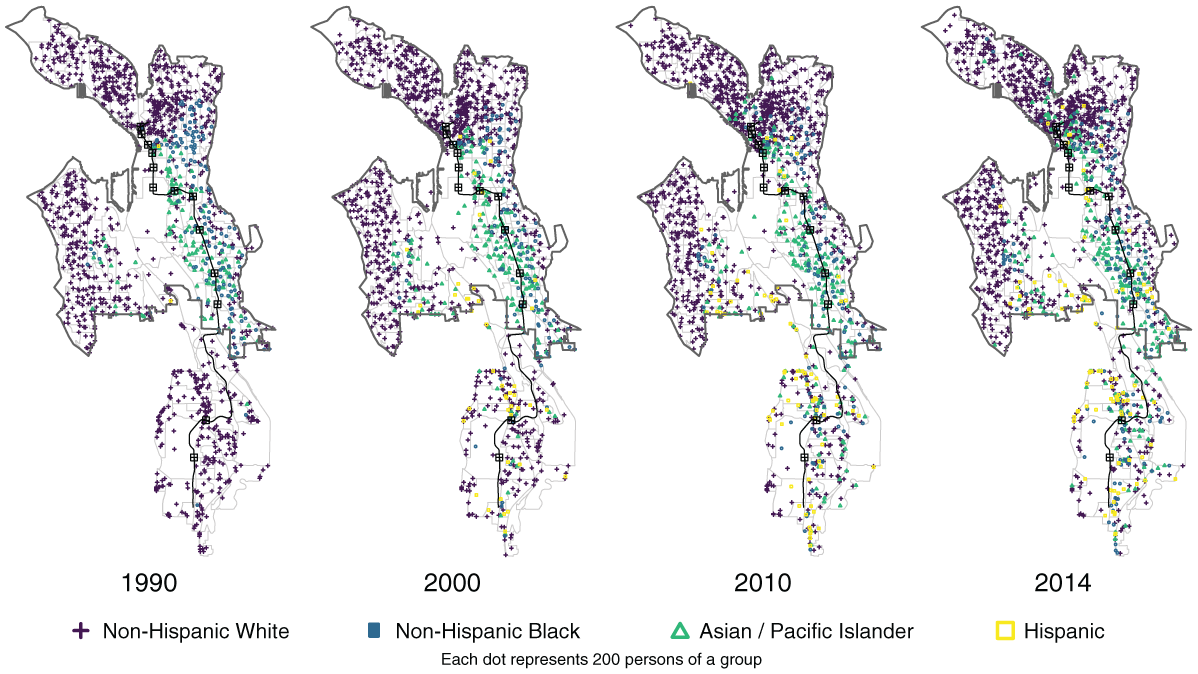
Dot-density maps of residential composition near Link, 1990-2014.
Starting in 1990, the study area is at its most segregated. Predominantly White neighborhoods (purple) made up most of the periphery in Seattle. 13 An island of Black neighborhoods (blue) clustered in the Central Area immediately east of Link’s future northern terminus. The mostly Asian/Pacific Islander International District (green) is located in the area just south of the Central Area. These neighborhoods are just outside the CBD, the fourth stop from Link’s terminus downtown.
Seattle’s sports stadiums are situated near the fifth stop, and the somewhat sparsely populated area near Link’s sixth station is mostly industrial toward the north, becoming slightly more residential as one looks due south. Moving farther southeast, the residential neighborhoods along Martin Luther King Way (Beacon Hill, Mt. Baker, Columbia City, Othello, and the Rainier Beach station areas) in the middle of Link stand out as the most racially integrated region—non-Hispanic Black and Asian/Pacific Islander shares of the population make up most of the neighborhood composition. Suburban neighborhoods had populations that were predominantly White.
As time elapses, the Black Central Area disintegrates as increasing shares of other groups (particularly Whites) change these neighborhoods’ compositions. This substantial shift in these Seattle control neighborhoods was similar to some of the losses in this group’s shares within LR neighborhoods farther south along Link. These neighborhoods’ proximity to the growing CBD and South Lake Union areas factored into their earlier gentrification. Neighborhoods parallel to Link’s third and fourth stops (Pioneer Square and International District) kept relatively stable compositions into the latest data. The neighborhoods near the Beacon Hill, Mt. Baker, and Columbia City (7th–9th Link stations) show increasing White concentration in LR neighborhoods, with fairly stable White populations in the areas just beyond. Columbia City, the farthest among these station areas, offers an estimated 18-minute transit time to the CBD via Link.
Toward Othello and Rainier Beach, the eighth and ninth stops, apparent differences due to LR start to fade. These areas remain mostly the same as they were in earlier time points (largest shares are Asian/Pacific Islander and Black), other than some notable gains in their Hispanic populations. The southernmost suburban region of the mapped area showed considerable increases in the share of racial minorities over time. Here, shares of Black, Asian/Pacific Islander, and Hispanic all grow, while the White share proportionately decreases. At the suburban stops, a ride to the CBD terminus takes about twice as long as at Columbia City (35 vs. 18 minutes).
These maps help situate the average trends spatially within the study area. To some extent, they also provide evidence of “demographic inversion” occurring around Link. As gentrification increases the value and relative advantage of living in the Link neighborhoods just outside of Seattle’s downtown, the demographic composition of these areas shifted in turn. Rippling from the gentrification-related change in many Seattle neighborhoods, ethnoracial diversity rose in the neighborhoods at the suburban periphery. Although suburban neighborhoods are well-served by LR in some cases, the patterns nonetheless suggest growing separation of racial minorities from some of the gentrifying urban spaces near Link. While these descriptive analyses are useful for contextualizing trends over time in the study region, the models in the following section help precisely determine how Link’s construction fit within these trends.
Difference-in-Difference Models of Neighborhood Composition
The following section reviews statistical models estimating a relationship between transit investment and changing neighborhood racial composition. Table 3 displays sets of model coefficients and standard errors for Panel A, predicting racial composition outcomes across the time for Seattle neighborhoods. I refer to models by their Panel and respective number within each panel throughout this section. For example, the restricted model of Seattle trends for percentage Black is A1. As a reminder, the base level for time is 2000, to assess LR-related differences relative to the neighborhood composition immediately preceding Link’s construction. For Panels A and B, we do not observe significant differences in pretreatment trends (indicated by time = 1990 × LR Treated) between LR and control block groups.
Panel A: Difference-in-Difference Models of Racial/Ethnic Composition of Seattle Neighborhoods.

Note. Standard errors in parentheses; base level of time is 2000, that is, preconstruction. NH = non-Hispanic; PI = Pacific Islander; LR = light-rail; HU = housing unit; BIC = Bayesian Information Criterion.
p < .05. **p < .01. ***p < .001.
Models of percentage Black (A1/A2) show that Seattle neighborhoods followed average declines over time. The lack of significance for any of the interactions of LR treatment with time covariates indicates no difference in trends between study groups following the Link project. The overall decline in Black shares in all Seattle neighborhoods from 1990 to the 2014 ACS estimates corresponds to Black households moving to other areas like the nearby suburbs (numerator of the percentage) and/or not moving to Seattle locations at the rate of the rest of the population (denominator of the percentage).
Models A3 and A4 predict trends in the White composition and indicate a significant increase in LR neighborhoods following the start of Link’s construction. The larger coefficient for the 2014 DD term (i.e., time = 2014 × LR-Treated) relative to 2010 shows that the treatment-related difference in percentage White grew larger in the period after Link opened. These differences persist even after controlling for heterogeneity in 1980 composition.
The analyses of Asian/Pacific Islander composition suggest a postinauguration difference related to Link. The coefficients for A5 indicate how LR-treated cases experienced an additional 4% decline in this groups’ share of neighborhood populations by the panel’s final 2010–2014 ACS observation. This matches the trend described in Figure 1 in which the Asian/Pacific Islander shares of Seattle LR-treated cases dipped downward amid relative stability in control cases. These differences persisted after controlling for 1980 population and housing characteristics.
Last, for Panel A, the models confirm increasing trends for the Hispanic population in Seattle neighborhoods since 2000, though these changes occurred at essentially the same pace in LR and control neighborhoods. While the restricted and full models predict increasing Hispanic composition over time, average levels of this group remain the smallest of the four studied by the end of the data’s temporal coverage.
Table 4 shows model estimates for suburban neighborhoods (Panel B). These ordinary least squares (OLS) models predict levels of the racial and ethnic group shares across time for block groups in the suburban cities of Tukwila and SeaTac. Model B1 of percentage Black shows a significant difference in trends for LR neighborhoods for the period of 2010, capturing the large uptick that was unique to these locations within the suburban jurisdictions of Link. By 2014, this treatment-related difference weakened such that the predicted level was substantively similar between groups. Nevertheless, the short upswing in the Black share that likely preceded Link’s opening in 2009 presents evidence in line with a theory that declining shares throughout Seattle created gains in suburbs, particularly the neighborhoods that would still provide direct access to Link. The 2010 postconstruction difference remains significant after adjusting for differences in 1980 housing and population covariates.
Panel B: Difference-in-Difference Models of Racial/Ethnic Composition of Suburban Neighborhoods.

Note. Standard errors in parentheses; base level of time is 2000, that is, preconstruction. NH = non-Hispanic; PI = Pacific Islander; LR = light-rail; HU = Housing Unit; BIC = Bayesian Information Criterion.
p < .05. **p < .01. ***p < .001.
Models B3 and B4 predict trends in suburban neighborhoods’ White shares, and show a fairly precipitous decline over time, with a predicted decrease of about 20% in Whites’ population share between 2000 and 2014. The interaction of LR-treated with the period-specific fixed effect for 2010 indicates a slightly shallower decline in LR block groups, but both groups’ trends are mostly similar in predicting substantial decline since 1980 (about 18–19% period-specific difference for 2010 and 2014). Overall, trends for neighborhood percentage White in the suburban areas show a general decline to less than half of this group’s share in 1980. This trajectory is consistent with suburbs’ average majority-minority composition by the last time point.
The models for percentage Asian/Pacific Islander in the suburbs (B5 and B6) show that the 2010 trends related to a lower-than-expected share in LR-treated neighborhoods, though this Link-related difference reversed in the short period following the transit line’s opening. Figure 2 displays this pattern, with suburban LR neighborhoods seeing an average increase in their shares of Asian/Pacific Islander residents between 2010 and the 2010–2014 ACS amid the share of this group ticking downward slightly in control neighborhoods.
Hispanic shares grew from 1980 to 2000 but diverged some following Link’s groundbreaking. LR neighborhoods saw a significantly lower level predicted for 2010 relative to the trends of control cases, though this difference became nonsignificant by the 2010–2014 ACS observation. These models predict that the Hispanic share of the overall population grew by about 7% between 2000 and the 2014 ACS.
Summary of Results
Table 5 summarizes the findings from the two panels of models for the posttreatment period from 2000 through the 2010 and 2014 observations. The Average Trend column indicates significant change between 2000 and 2014 among all neighborhoods in the panel. The 2000–2010 Link Difference and 2000–2014 Link Difference columns denote where the models showed significant changes in neighborhood composition related to LR investment.
Summary of Difference-in-Difference Model Results.

Note. “+” = increasing shares, “–” = decreasing shares, “.” = no difference.
The only LR-related differences robust through 2014 are within Seattle. Treated cases within the city limits saw increased percentage White and decreased percentage Asian/Pacific Islander by the end of the study period. Seattle neighborhoods saw average decreases in percentage Black and increases in percentage Hispanic from 2000 to 2014 regardless of LR investment. Suburban neighborhoods had some LR-related differences emerge between 2000 and 2010. However, estimated differences related to Link all diminished by 2014 in suburban neighborhoods. The uncertainty around these estimates is partially related to the small number of treated suburban cases. Another partial explanation draws on the substantial change occurring throughout all suburban cases, something that may have overwhelmed suggested LR-related differences (i.e., in 2010) by the end of the data coverage.
Discussion
This study sought to investigate the relationship of LR transit investment with nearby neighborhood change in racial and ethnic composition. I found that much of the study region changed in its ethnoracial composition between the 1980 Census and 2010–2014 ACS. LR-treated neighborhoods in Seattle saw related increases in their share of White residents following the start of construction, amid decreases in their Asian/Pacific Islander composition after Link’s inauguration. Meanwhile, suburban neighborhoods near Link showed larger-than-expected increases in their Black shares following the start of construction, though the relative importance of LR treatment for trends leveled off after Link’s opening. Suburban LR neighborhoods had relatively suppressed growth for Asian/Pacific Islander and Hispanic composition at first, but after Link opened, this growth came to parity with trends in the suburban control neighborhoods.
One possible interpretation of these suburban findings is that Asian, Pacific Islander, and Hispanic demand lagged behind that of Black households. Amid high demand from these groups postinauguration, the trends of growing Black shares halted and unexpectedly low gains for percentage Asian/Pacific Islander and Hispanic dissipated. Metropolitan-wide growth in Asian/Pacific Islander and Hispanic populations is also a plausible contributing factor. By this reasoning, increasing size of these populations eventually tempered trends of growth in neighborhood Black representation. Whether these interpretations or others hold in the long-term will require additional data and research.
Observable changes in aggregate neighborhood trajectories near Link in Seattle corroborate a general preference for living near transit. A key difference relates to who is moving where as these transit neighborhoods take root. Theory about gentrification suggests that those moving to urban LR neighborhoods, on average, are socioeconomically advantaged and White, while those impacted are disproportionately less advantaged and people of color. The results of this study indicate a plausible trajectory of whitening compositions for Seattle Link neighborhoods in future years. All the while, trends for nearby suburbs show durable patterns of increasing racial and ethnic diversity.
For those invoking a “right to the city” among all, these differences alone suggest inequitable benefits and costs to this urban investment. The transition of racial and ethnic diversity to areas with fewer resources and weaker opportunity (as acknowledged by planners) has implications for racial inequality and residential segregation in U.S. metros. While residents in neighborhoods affected by Link had opportunities to voice their concerns about the project, higher-jurisdiction policies of “growth management” that channel growth and development to designated areas appear to win out in aggregate. Overall, the findings of this study matter because they assert the importance of changing racial/ethnic composition amid transit investment and related gentrification. They also illustrate the continued role of public investments in metropolitan demographic trends and patterns of segregation.
There are a few limitations to the study worth noting. First, as this is not a randomized-controlled trial (RCT), I cannot rule out that unobserved factors may yet confound the observed relationship between LR investment and neighborhood change. However, it seems unlikely that such a study could be designed, suggesting that the present approximation of an experimental design is a reasonable alternative. Use of relative composition measures for the four ethnoracial groups outcomes implies that either differences in the numerator, denominator, or both sides may drive any observed divergence in trajectory over time. Even if growing overall populations explain some of the differences related to Link (for example, declining Asian/Pacific Islander shares within Seattle), such an outcome still suggests a given group has differential access to housing in these places relative to the overriding trends of population growth.
This research is highly specific to the United States’ metropolitan structure and history of racial and ethnic stratification. However, the findings documented here speak generally to marginalized groups’ disadvantaged location within the urban political economy of large-scale infrastructure projects. The models do not attempt to explain the role of housing value appreciation as a mediating pathway, so this element of the study’s conceptual framework remains unobserved. While many studies theoretically predict this consequence, particularly in a rapidly growing city like Seattle, the models do not explicitly account for this part of the theorized relationship.
The conclusions of this study motivate future studies into the ways that public-transit development (particularly with corresponding revitalization) can relate to shifting trajectories in neighborhood demographic context and patterns of residential segregation. Future research should investigate the transit investment/neighborhood change relationship in other locations, particularly those outside of the growing West region of the United States. Evidence from other regions might accordingly inform of metropolitan and neighborhood differences (i.e., concentrated poverty, racial segregation) that condition the likelihood or qualities of LR-related neighborhood change. Another important line of research motivated by these findings concerns individual and household motivations regarding mobility. Assessing whether or not these moves align with theoretical concepts of displacement or succession would further shed light on the perceived costs and benefits of these projects to different households.
In the meantime, the lessons from this project are clear: public transportation projects matter for the social fabric of the neighborhoods they disrupt, and unfold alongside broader waves of demographic change occurring in many U.S. metropolitan areas. With multiple Link expansions underway in Seattle, local leaders can learn from this by (1) requiring greater shares of affordable housing within new transit-oriented developments and (2) giving existing neighborhood residents assistance with locating housing in these areas. Policy makers and planners in contexts considering new infrastructure projects should weigh options for keeping access to transit-rich neighborhoods equitable to preserve historically diverse neighborhood social contexts.
Footnotes
Declaration of Conflicting Interests
The author(s) declared no potential conflicts of interest with respect to the research, authorship, and/or publication of this article.
Funding
The author(s) disclosed receipt of the following financial support for the research, authorship, and/or publication of this article: Partial support for this research came from a Shanahan Endowment Fellowship and a Eunice Kennedy Shriver National Institute of Child Health and Human Development training grant, T32 HD007543, to the Center for Studies in Demography & Ecology at the University of Washington.
