
Abstract
This article contributes to the research on the new geography of poverty by examining how low-income residents fit into the governmental patchwork that defines metropolitan America. Our analysis pays particular attention to two features of local governments: their size and their status as incorporated municipalities or unincorporated areas. Relying on Census data, we study these patterns for the five largest metropolitan areas in each of the five Census-designated regions of the country (25 metros total) from 1990 to 2012–2016. We show that the distribution of poor people across jurisdiction types, and their concentration in particular jurisdictions or places, has changed over time. In the older metros of the Northeast and Midwest, poverty grew in smaller secondary cities while it expanded in unincorporated areas in the South and in larger secondary cities in the West. We conclude with a discussion of the implications of these shifts for studying local governance and poverty.
Until the 1990s, metropolitan spatial inequality was primarily understood in terms of two governance types: the poor minority city versus middle-class White suburbs, a chocolate city with vanilla suburbs, as one article put it (Farley et al. 1978; Schuetz et al. 2017). But over the next two decades, researchers began to grapple with the emergence of a more complex set of spatial patterns. This work has illuminated a much different reality. Research has shown that low-income residents can be found throughout most metropolitan areas, not simply in cities and inner suburbs (Allard 2017). A wide array of typologies has identified the economic and demographic features of declining suburbs, where many low-income residents live (Kneebone and Berube 2013). And studies of gentrification have charted the economic transformation of some urban neighborhoods as well as the resulting crisis of affordable housing for low-income residents (Florida 2017; Martin and Beck 2018; Moskowitz 2017).
In this article, we contribute to the research on the new geography of poverty by examining how low-income residents fit into the governmental patchwork that defines metropolitan America. Much of what we know about the shifting distribution of people across metropolitan areas draws from Census-tract data (Cooke and Denton 2015; Reardon and Bischoff 2011). This work portrays a new geography of inequality in which the rich and the poor are increasingly segregated, and middle-income neighborhoods have declined. Yet, we know less about how demographic changes map onto metropolitan governing arrangements. Documenting the shifting distribution of the poor across local governments and assessing the characteristics of those jurisdictions provides insights into what support low-income residents can expect to receive from the local public sector. It also sheds light on the new political challenges that efforts to assist low-income residents may confront.
Our analysis pays particular attention to two features of local governments: their size and their status as incorporated municipalities or unincorporated areas. Size matters for several reasons. Municipalities below 50,000 in population do not directly receive funds from key federal programs, including the Community Development Block Grant (CDBG). Instead, they must compete with each other to win the attention of county officials charged with distributing these grants. Incorporation status matters because residents in unincorporated areas, lacking municipal government, must rely on counties for services. Counties vary widely in the types and levels of services they provide but many offer only minimal services and often overlook the needs of the poor (Anderson 2008). Moreover, poor residents in unincorporated areas may face special challenges in organizing and having their voice heard at the county level.
Most studies of the changing geography of poverty focus on a single metropolitan area or provide a snapshot of nationwide trends. We add a new dimension to this research by examining variation across metropolitan areas and tracking changes over time. Scholars have long noted the distinctive development patterns and governing arrangements of the newer sunbelt metros compared with the older metros of the North and Midwest (Rusk 1993; Strom 2017). 1 By comparing metros in different regions of the country, we can assess what such differences mean for the political geography of poverty. But metros do not stay the same over time. Major economic and demographic shifts as well as individual decisions about where—and where not—to live transform localities. Moreover, governance arrangements change as some jurisdictions grow through annexation and new ones form through municipal incorporation. As we assess change over time, we ask whether governance changes build walls that allow the successful to secede, as Robert Reich (1991) once put it, and whether they isolate the poor or bring them into larger jurisdictions.
We address these questions by examining how poor residents and racial and ethnic minorities are distributed across different types of political jurisdictions in the metropolitan areas in different regions of the country. Relying on Census data, we study these patterns for the five largest metropolitan areas in each of five Census-designated regions of the country (25 metros total) from 1990 to 2012–2016. We show that the distribution of poor people across jurisdiction types, and their concentration in particular jurisdictions or places, has changed over time. In the older metros of the Northeast and Midwest, poverty grew in smaller cities, while it expanded in unincorporated areas in the South and in larger suburban cities in the West. We conclude with a discussion of the implications of these shifts for studying local governance and poverty, highlighting the challenges of addressing poverty in smaller cities and unincorporated areas.
Governance and Spatial Inequality
The Significance of Local Governance
A large body of research has demonstrated how diverse features of local jurisdictions directly influence the public goods available to low-income residents. The array of local jurisdictions in a metropolitan area also matters indirectly because it influences location decisions of residents and firms in ways that can leave low-income residents, particularly African-Americans and Latinos, isolated in poor jurisdictions.
Although most local governments do not directly spend significant sums on redistributive programs, their fiscal capacity nonetheless matters for low-income residents. In a study of the 100 largest cities, Hajnal and Trounstine (2010, pp. 1144, 1150) estimated that local governments spent only 9.6% of their budgets on redistribution, including education. But their work showed that cities with the strongest fiscal capacity spent the most on redistributive purposes. Craw (2010), in contrast, found no clear relationship between fiscal capacity and direct spending on redistribution but his analysis did show that larger municipalities were more likely to spend on social welfare functions. He also demonstrated that larger “entitlement cities”—those that receive federal assistance in the form of CDBG and HOME funds as an entitlement—received more funds from intergovernmental social welfare programs than nonentitlement cities, controlling for race and income among other factors (p. 916). Local spending beyond redistribution also matters. Local expenditures on basic infrastructure—including police, fire, roads, transportation, and public libraries—all affect the well-being of low-income residents. Public libraries, for example, offer free children’s programs, English language class, and computer access, all of particular value to low-income residents. The ability of local governments to manage blight by razing abandoned housing is especially important for poor neighborhoods.
Local governments can expand the resources available to the poor not only by direct spending but also by their decisions about whether to participate in intergovernmental grant programs, such as federal housing programs, and health and social service grants (Craw 2010). Thus, even when funds flow from state and federal sources, local decisions to participate in programs that assist the poor are the key step making funds available. Craw (2010, p. 917) finds that political factors influence these decisions. Notably, cities with larger Black and Latino populations exhibit greater participation in intergovernmental programs, while higher homeownership and a stronger business community lead to less participation.
Low-income residents living in unincorporated areas face special challenges. Most must rely on county governments for services. Although many counties have expansive service capabilities, others remain quite limited (Lobao et al. 2012; Miller and Cox 2014, pp. 153–57). Most suburban counties have weaker capacities for addressing poverty than do cities. City-based infrastructure for assisting the poor expanded in the 1960s, fueled initially by the War on Poverty and later, by the expansion of federal block grants. Pressed by newly empowered minority communities and by nonprofit advocates, city governments took on new responsibilities for the poor, and city-based nonprofits expanded dramatically (Hula and Jackson-Elmoore 2000). The history of suburban counties, driven by middle-class housing development and by White flight, was quite different. As a consequence, the public and nonprofit service infrastructure for assisting poor residents in suburban counties has remained far less developed, even as some counties work to build new capabilities (Allard 2017, p. 163).
Counties also face a more complex challenge with regard to service delivery than do cities. Although unincorporated poverty in metropolitan counties may resemble rural poverty, it is often found in counties that the Census classifies as “central” to the metropolitan area, as we show in this article. In many suburban counties, leapfrog development and selective incorporation have left pockets of poverty interspersed among more affluent incorporated jurisdictions (Anderson 2010). Even counties with relatively strong capabilities find it difficult to address these scattered pockets of unincorporated poverty due to long distances and the low visibility of the poor. At the extreme, unincorporated places lack basic infrastructure, including water, sanitation, and paved roads (Anderson 2008). Much like urban low-income communities of color, areas of unincorporated suburban poverty suffer from a disproportionate share of undesirable land uses, including highways and landfills (Anderson 2008, p. 1098; Durst 2014; Lichter et al. 2007).
The presence of low-income minority communities in unincorporated areas is frequently by design. Anderson (2008) defines a process of underbounding, in which annexations deliberately bypass poor Black and Latino neighborhoods on the outskirts of municipalities. In a study of metros in 38 states, Durst (2018) finds that underbounding is highly political. It is most likely to occur when annexation decisions are made with the participation of current city residents, rather than a third party, and when the Black and Latino unincorporated neighborhoods have no input into the decision.
Not only do local capabilities and decisions matter, the degree of governmental fragmentation in a metropolitan area also greatly affects the fate of low-income residents. More than half a century ago, Tiebout (1956) praised the political fragmentation of metropolitan America, arguing that the diverse size and service levels offered by local governments allowed residents to search for the combination that best suited their needs. Many studies have since documented the incentives for exit and sorting created by fragmentation and the negative impact on low-income residents. In the postwar decades, the strategy of defensive localism—creating separate political jurisdictions—allowed White residents to control suburban space through land-use regulation and sent many central cities into downward spirals as middle-class residents departed, and local tax bases suffered (Freund 2007; Weir 1994). Local boundaries matter, Weiher (1991) argues, because they act as signals about the future of a jurisdiction. Because separate jurisdictions use their zoning and land-use powers to shape the income profiles of their residents, and indirectly, the racial composition of their communities, jurisdictional boundaries can serve as informational shortcuts about the future. Weiher suggested that Whites use such signals to avoid places that might become racially and economically diverse in the future. Savitch and Adhikari (2017) showed that over the past two decades, jurisdictional fragmentation has increased even where population has declined. Moreover, they demonstrated that public authorities, which have arisen to provide some coordination across space, prioritize developmental functions, doing little to mitigate spatial inequalities rooted in fragmentation.
A wide range of studies confirms the impact of jurisdictional fragmentation on segregation by race and income. Gary Miller’s (1981) study of Los Angeles County’s Lakewood Plan in the 1950s demonstrated how the creation of new governments spurred racial and economic segregation. Dreier, Mollenkopf, and Swanstrom (2014, pp. 46–47) show how fragmentation segregates the poor into jurisdictions with weaker public-goods provision, making them vulnerable to exit by more affluent residents. Metropolitan political fragmentation makes it more difficult for Blacks and Latinos to convert rising income into residence in more prosperous, racially mixed neighborhoods. A key force driving this outcome is the movement of higher income Whites away from more economically and racially diverse areas. This “exit” option is more available in politically fragmented metropolitan areas (Pais, South, and Crowder 2012).
Governance Patterns Across Place and Time
As metropolitan development made older distinctions between city and suburb increasingly obsolete, two research agendas have emerged to make sense of the new political geography. The first is the growing literature on the suburbanization of poverty. The second, inspired by the booming growth in sunbelt metros, examines alternative patterns of metropolitan political geography. Both bodies of work illuminate a metropolis quite distinct from the vanilla suburb/chocolate city, but both raise additional questions about the role of local governance and the trajectory of changes in metros in different parts of the country.
The growth of suburban poverty spawned an array of typologies seeking to make sense of the new social and political geography (Kneebone and Berube 2013; Mikelbank 2004; Murphy 2010; Orfield 1998). This work characterizes the great variety of suburban settings that experience poverty, racial segregation, and fiscal stress. The most recent studies show that suburban poverty is not limited to “inner suburbs” but appears in many different parts of metropolitan areas (Allard 2017). Yet, with the exception of Orfield, economic and demographic factors drive these analyses, telling us little about the governmental patterns that overlay—and potentially influence—the metropolitan spatial organization of race and income and its significance for low-income residents.
The second stream of work documents the distinctive patterns of spatial development in the metros of the South and Southwest. For more than a century, the big cities of the North and Midwest have served as the model for the study of urban development. The Chicago School offered central place theory and made immigration the driving force through which urban space changed over time. Later, studies of suburbanization and White flight provided the basis for understanding the fragmented metropolis (Danielson 1976). Development in sunbelt cities has occurred quite differently. Although there is no consensus on what constitutes the Sunbelt, most definitions include cities in the South and Southwest, where major growth occurred in the latter half of the twentieth century (Strom 2017, pp. 199–200). Because they expanded during the automobile era, sunbelt cities defied the tenets of central place theory. The automobile made it possible for them to expand in all directions at once without defining a true center (Fishman 1987).
Most sunbelt cities faced fewer barriers to expansion than their northern counterparts. Dominated by growth-oriented real estate interests with power in state and as well as local politics, these cities could count on laws and policies designed to promote growth (Bridges 1997). Moreover, most sunbelt cities could expand their boundaries through annexation. Less likely than older Northern cities to be hemmed in by incorporated jurisdictions on their borders, most of these metros exhibited little of the suburban fragmentation so characteristic of postwar development in the North and Midwest. 2
David Rusk captured these distinctions in his analysis of “elastic” sunbelt cities and “inelastic” frostbelt cities. The less dense elastic cities had room to grow through infill as well as through annexation. Drawing on 1990 Census data, Rusk showed that low-income and minority populations experienced less segregation in the elastic cities of the Sunbelt (Rusk 1993). Because these cities could more easily annex their suburbs, these metros were much less likely to exhibit sharp city–suburb differences by income and race. While core cities in the North and Midwest housed a disproportionate share of the metropolitan area’s poor and minority population, sunbelt cities, by virtue of their size alone, remained more economically and racially diverse. Such economic diversity brought with it a larger tax base and possibilities for more racial and economic integration, if, in Rusk’s (2013, p. 52) words, “that government has the vision and courage to do so.”
Annexations continue to shape political geography, especially in the South and West. Examining annexation activity between 1990 and 2005, Edwards (2011) showed that these regions accounted for 83% of the total acres annexed in the country. Ongoing annexation may indicate that elastic central cities continue to grow, as Rusk argued. But annexation can also contribute to spatial inequality when it bypasses poorer areas on the metropolitan fringe or when it selectively increases the size of newer affluent municipalities. Ongoing annexation, thus, may not benefit the largest central city, it may instead advantage newer, more affluent municipalities.
Sunbelt governing arrangements have also shifted as a result of new incorporations. Metros in these regions have been the site of a disproportionate number of municipal incorporations over the past three decades. Smith and Debbage (2006) found that southern incorporations account for half of all new municipalities formed between 1990 and 2005. From 2000 to 2010, more than half of new incorporations were in the South (U.S. Census Bureau 2017).
The growth of suburban poverty and the evolution of jurisdictional boundaries in the Sunbelt indicate the need for a closer look at what the shifting municipal boundaries mean for low-income and minority communities. Do the changes conform to the pattern Rusk identified—bringing people of different income levels and racial backgrounds into the same political jurisdiction—or are sunbelt municipalities creating new forms of exclusion that will hoard opportunity and resources in some municipalities and limit them in others? To answer such questions means going beyond the city–suburb distinction that drives much research on metropolitan inequality. It requires investigating poverty and racial segregation, not only by Census tract, but also by political jurisdiction.
Research Questions and Methodology
To understand where the poor fit into shifting suburban governance patterns and to gauge regional variations in those political configurations, we focus our analysis on three questions. First, we assess the size of the suburban jurisdictions where poverty is growing. Is poverty rising in small secondary cities, and if so, do these jurisdictions fall below the threshold (50,000 people) for receiving key federal block grants as entitlements? Second, we ask whether poverty is concentrating in just a few suburban jurisdictions or if it is spreading evenly, that is, is there a jurisdiction-level separation of rich and poor in the suburbs? Finally, we measure the growth or decline in the number of poor in unincorporated areas. For each, we consider how these geographic patterns intertwine with race and ethnicity; we document regional differences and areas of convergence between older cities of the Northeast and Midwest and newer cities of the Sunbelt; and we consider the trajectories of change over time.
We focus on two main geographies within metropolitan areas in addressing these questions. The first consists of what we call “secondary cities,” incorporated jurisdictions that are not designated as principal cities by the Census, which we categorize by whether they have greater or fewer than 50,000 people. 3 The second consists of unincorporated county populations, including both Census-designated places (CDPs) and overall unincorporated county areas. 4 We analyze these geographies for 25 U.S. Census-designated Metropolitan Statistical Areas (MSAs) using data from 1990, 2000, 2010, and 2012–2016 on poverty and race and ethnicity (Manson et al. 2017). 5
To ensure regional variation, our sample includes the five largest metropolitan areas in each of five Census-designated U.S. regions: the Midwest, Mountain West, Northeast, West, and South. We assembled a longitudinal data set that accounts for the evolution of counties and cities as political entities over time, including annexations, incorporations, and disincorporations. 6 We use 2014 nominal definitions of the counties and places that make up each metro area, projecting backward to 1990, 2000, and 2010 (Missouri Census Data Center 2014). 7
Addressing the question of whether poverty is concentrating in just a few secondary cities and CDPs or spreading evenly requires setting a threshold for what we consider “concentrated” poverty. The literature defines concentrated poverty at the Census-tract level as 40% or more people living below the federal poverty line (Jargowsky 1997; Wilson 1987). Other research has considered a neighborhood high poverty at 20% to 40% poverty (Kneebone and Holmes 2016). A Congressional Research Service report notes that “. . . areas for which the poverty rate reaches 20% experience systemic problems that are more acute than in lower-poverty areas,” including less access to public services (Dalaker 2017, p. 1). At the county level, a 20% or greater poverty rate qualifies as high. For example, the American Recovery and Reinvestment Act of 2009 set a threshold of 20% poverty at the county level when directing certain rural development funds, and subsequent legislation has sought to apply this definition to other funding sources (Dalaker 2017, p. 1).
However, using the fixed threshold poverty rate in the literature for concentrated poverty in secondary cities and CDPs presents problems for making comparisons over time, both within and across metros. First, a city’s poverty rate rises and falls with economic cycles. Although important, this makes it difficult to measure trends in where poor people are moving within a region, that is, which cities and CDPs are becoming more poor compared with the rest of the region. For example, a city whose poverty rate hovers right around the threshold might fall above the line in one decentennial Census year and below it the following year. This measurement would show a decline in concentrated poverty in that city, even though the share or concentration of the region’s poor population in that city might actually have increased. Second, measuring concentrated poverty using the fixed 20% threshold poverty rate in the literature produces an unnecessarily stark picture of a metro compared with other metros. For example, a metro where most or all cities have a poverty rate below 20% (typical in West Coast metros) will appear to have little or no shift in the geography of poverty. Conversely, a metro with many cities above 20% poverty (typical in Midwest metros) may also show little or no change, even as poverty suburbanizes. Such an all-or-nothing metric, although correct in an absolute sense, fails to shed light on the reconcentration of a metro’s poor population in secondary cities and CDPs over time and in comparison with other metros.
To overcome these limitations, we construct a variable index of high-poverty cities and CDPs. Rather than using the fixed concentrated poverty threshold in the literature, we peg each metro’s concentrated poverty threshold to its own average poverty rate for cities in a given year. We set a fixed marginal interval above that average metro poverty rate for the year and allow the concentrated poverty threshold for individual metros to fluctuate accordingly. As described above, this prevents recessions/upturns and the inherent economic strengths/weaknesses of different metros from clouding our view of the relative shifts in the geography of poverty within metros. In selecting this marginal interval, we used the concentrated poverty threshold in the literature as a target. On average, the metros in the study had a poverty rate (averaged from their cities) of about 12%. This made for a difference between the average metro poverty rate and the concentrated poverty rate in the literature about 8%. Thus, we added 8% to each metro’s poverty rate in a given year to assign it a variable high-poverty threshold that relates to the threshold in the literature while enabling comparisons of shifting concentrations of poverty within and across metros. 8
Governing Arrangements and the Metropolitan Poor
In the vast majority of the metros we studied, poverty rates in the historic central city exceeded that of the region, and racial minorities continued to be overrepresented in most central cities (Appendix Table A1). But consistent with the suburbanization of poverty literature, our data underscore the decline in the share of the poor who reside in the historically largest cities of their region. Between 1990 and 2012–2016, all of our metros, with the exception of Oklahoma City, saw the share of the poor population shrink in the historically largest city (Table 1). In only three of our metros (Oklahoma City, New York City, and Philadelphia) did the historic central city house a majority of the region’s poor population in 2012–2016 (Table 1).
Share (and Absolute Change since 1990) of Total Metro Poor Population Living in Central/Suburban Jurisdictions in 2012–2016.
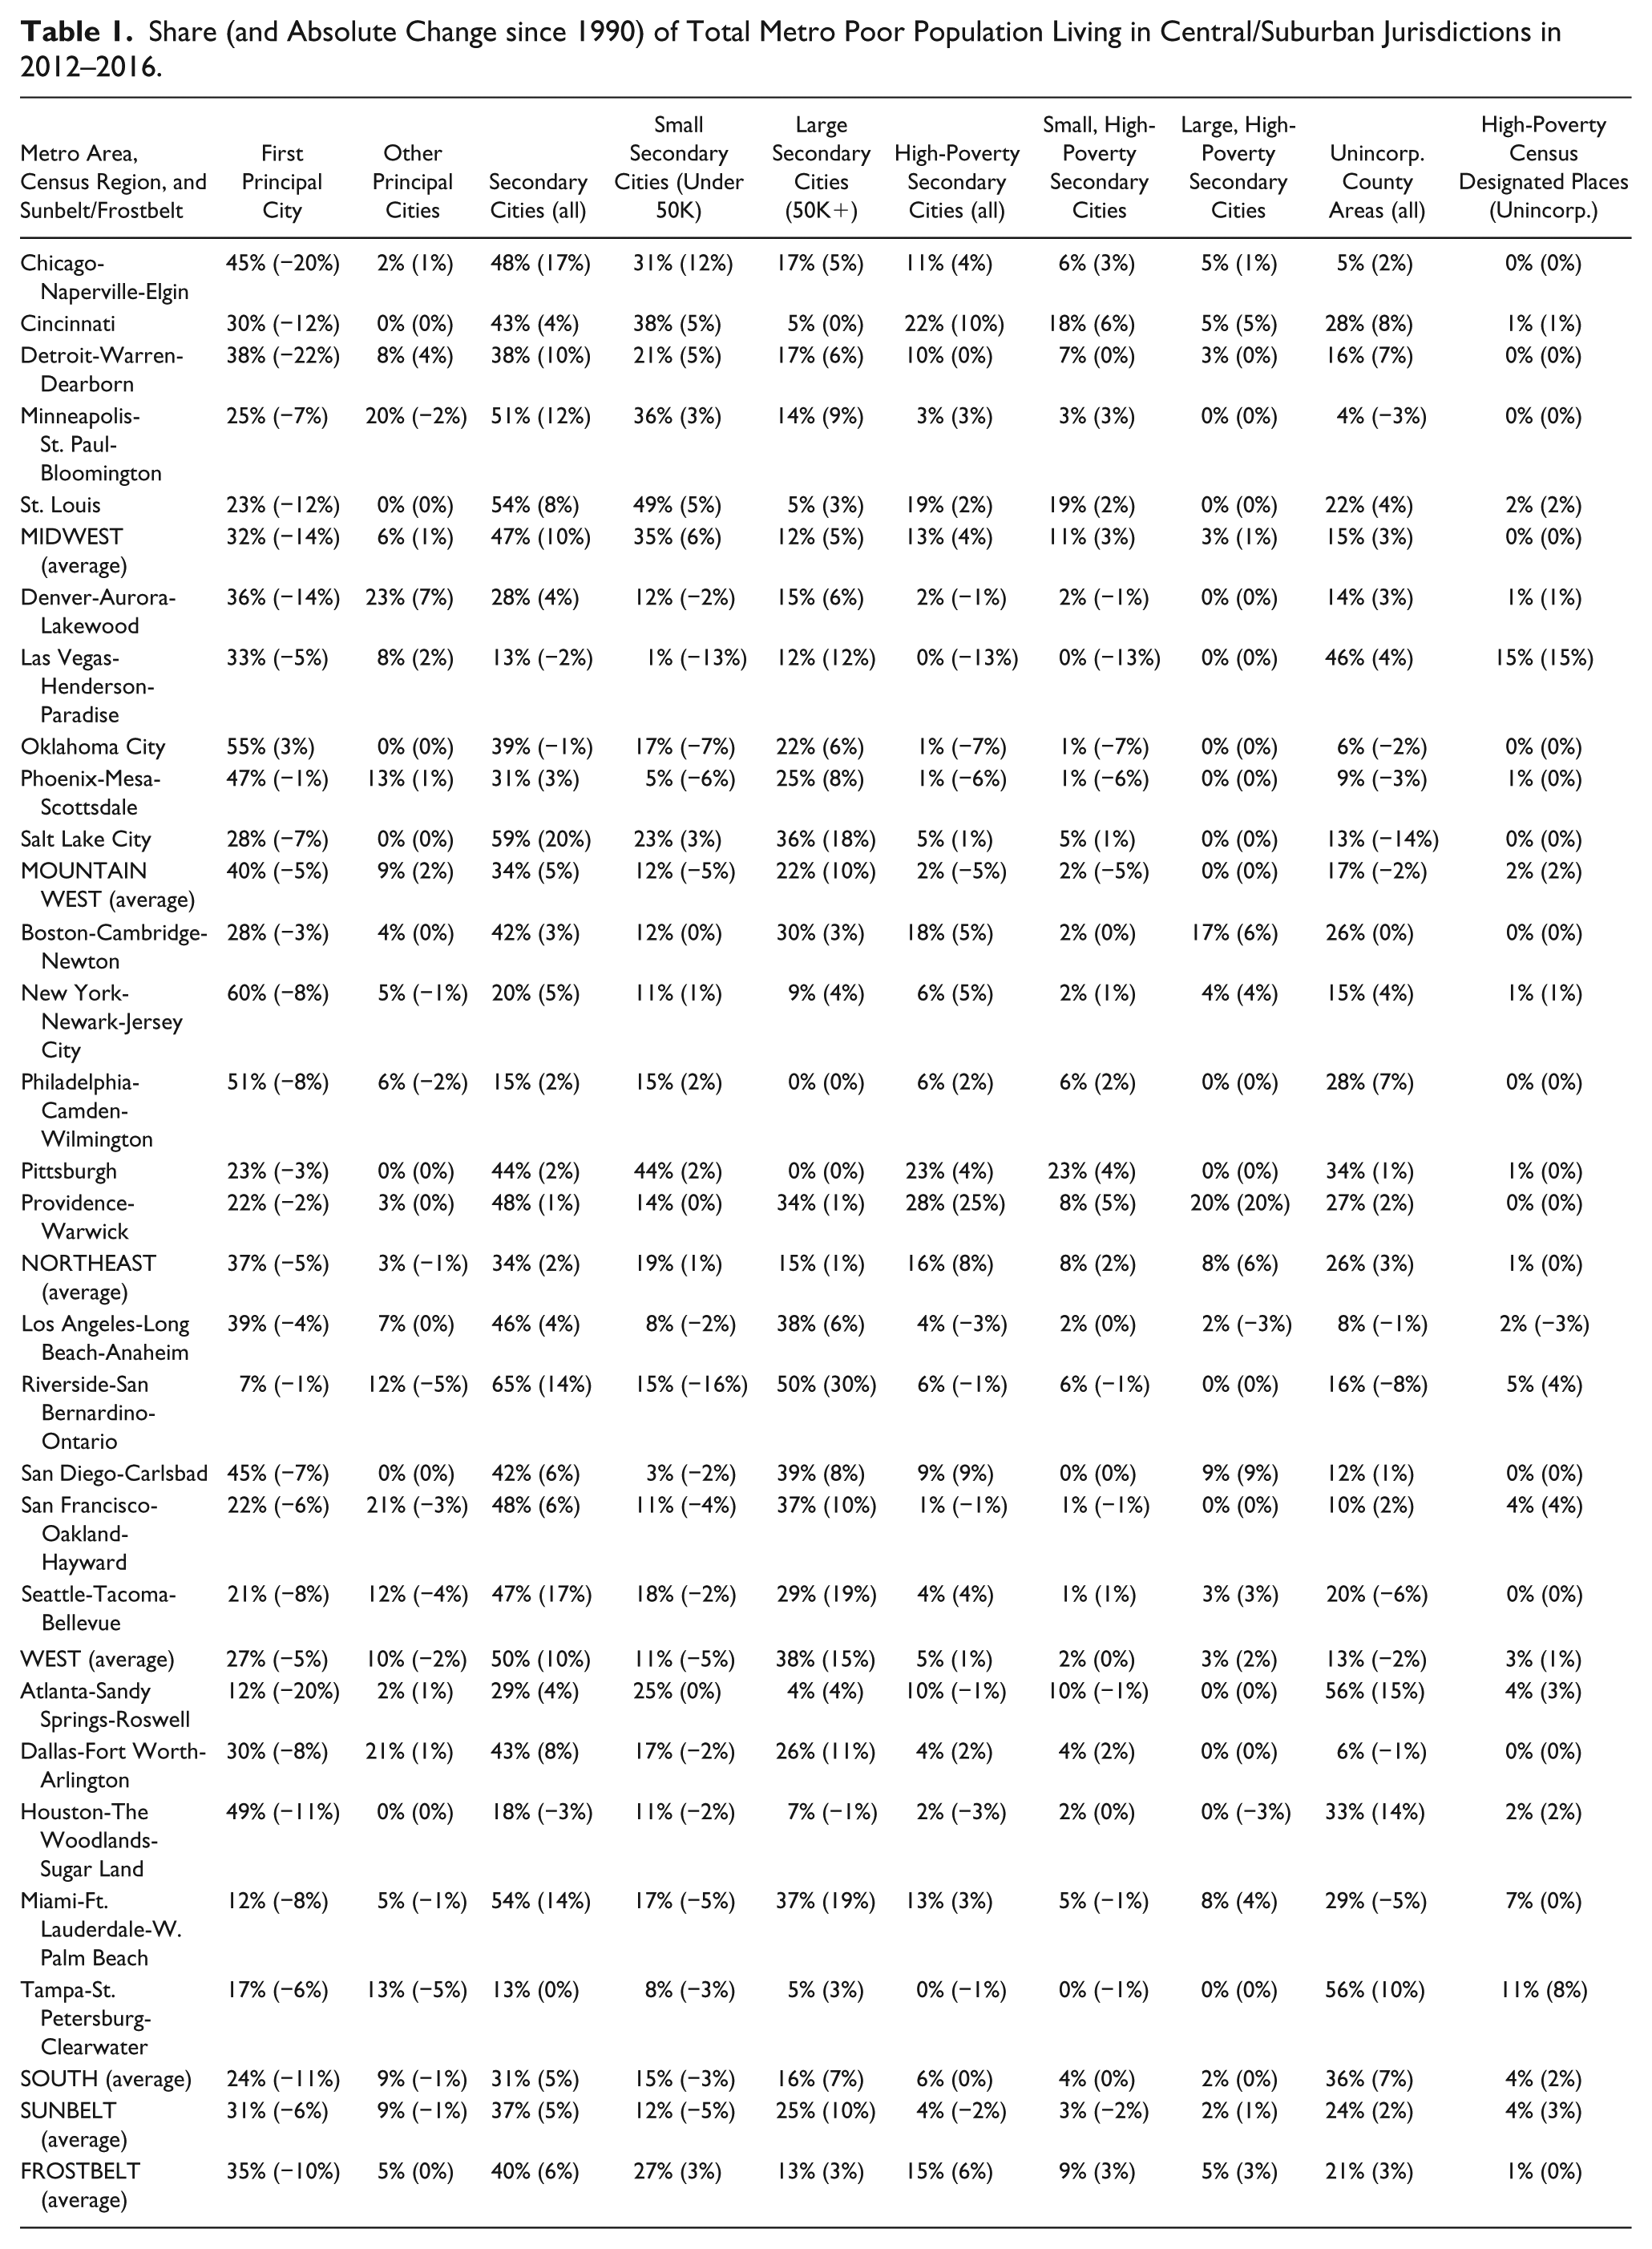
As the share of regions’ poor residents living in the historically largest cities declined, poverty grew in secondary cities and in unincorporated areas. Yet, as we show below, these patterns differed by region. Poverty in smaller secondary cities rose from already higher levels in the Midwest and Northeast, while sunbelt metros saw poverty increases in larger secondary jurisdictions with more than 50,000 residents (Table 1). The poor were not spread evenly across these jurisdictions, rather, they tended to cluster in some cities and not others. Unincorporated poverty grew most dramatically in the South, which also had the highest share of regional poor living in unincorporated areas of any region in the country by 2012–2016.
The Rising Share of Poverty in Secondary Cities
The large share of the metropolitan population living in secondary cities and the growth of poverty in these cities makes it particularly important to understand their features, including size, concentration of poverty by jurisdiction, and racial composition. Analyses that group all smaller jurisdictions under the label of “suburb” miss the wide variation in the characteristics of these jurisdictions and in how the poor are distributed across them. Secondary cities, which range in size from hundreds of thousands of residents to the smallest incorporated town of a few hundred people, have become home to increased shares of the regional poor in 21 out of 25 of our metros since 1990 (Table 1). Between 1990 and 2012–2016, the proportion of metro poor people living in secondary cities grew from 32% to 39% on average for the metros we studied.
The share of the metro poor in secondary cities was highest in the Midwest and the Pacific West (47% and 50%), but every Census region had at least one metro with half or nearly half of the poor living in secondary cities in 2012–2016 (Table 1). More than half of the low-income populations in the Minneapolis, St. Louis, Salt Lake City, Riverside, and Miami regions lived in a secondary city, and more than 40% of the poor in the Chicago, Cincinnati, Boston, Pittsburgh, Providence, Los Angeles, San Francisco, Seattle, and Dallas metros lived in a secondary city by 2012–2016.
Whether the geographic dispersion of the poor is associated with increased opportunity depends in part on the size of the secondary cities, how poverty is distributed across them, and their racial composition. Size matters because smaller secondary cities (under 50,000 people) must compete for federal block grant dollars with other jurisdictions in a county and as Craw (2010) argued, are less likely to redistribute. Moreover, smaller cities typically have more limited municipal staff capacity to compete for state and federal grants; their philanthropic communities are likewise smaller. The distribution of poor people across small secondary cities is indicative of whether they are clustered in a few very poor places with a limited tax base or are living in places with higher opportunity and greater resources. Similarly, a disproportionate share of racial and ethnic minorities living in secondary cities could indicate a move to opportunity or a new kind of exclusion depending on the resources of the locality.
Jurisdiction size
Our data show that northeastern and midwestern metros contained the most—and the smallest—secondary cities (Appendix Table A2). Midwestern metros had the highest average share of the metropolitan poor population living in a secondary city under 50,000 in 2012–2016 (35%), followed by the Northeast (19%) (Table 1). For example, 49% of poor people in the St. Louis metro area lived in secondary cities under 50,000 in 2012–2016. Although a number of metros across the country—Cincinnati, Minneapolis, Salt Lake, Providence, Los Angeles, Riverside, San Diego, San Francisco, and Miami—had more than a third of metro poor living in small secondary cities (under 50,000) in 2012–2016, the Midwest accounted for the most growth in this area since 1990. For example, Chicago’s share of metro poor living in secondary cities under 50,000 by 2012–2016 increased by a factor of 1.7 relative to 1990 levels.
In the Pacific West, which had the highest shares of regional poor living in secondary cities, the poor tended to live in larger secondary cities. The Riverside metro area more than doubled its share of metro poor in large secondary cities to 50%, an absolute change of 30 percentage points, by 2012–2016 (Table 1). Even western metros with older urban centers had a significant share of regional poor living in larger secondary cities. For example, in the Los Angeles and San Francisco regions, more than a third of the regional poor population lived in secondary cities with a population greater than 50,000 in 2012–2016 while in the Seattle metro, more than a quarter did. The share of the poor in secondary cities tended to be smaller in the South, with the exception of Miami, the only southern metro in the top 10 for share of poor in secondary cities.
These data make it clear that even as poverty has increased in suburbs across the country, it takes distinct forms in different regions. In the Midwest and Northeast, poverty has grown in smaller jurisdictions, while it has risen in larger suburban cities in the West and Mountain West.
Concentration of poverty
Policy makers and scholars have long thought of the dispersion of poor populations as a net positive, with jobs, good schools, and better housing often located in the suburbs. But differences in the distribution of the rising numbers of poor people in secondary cities affects whether this shift represents a move to opportunity or simply a new concentration of poverty in particular suburban jurisdictions. Although secondary cities’ shares of metro poor (and poverty rates) have been increasing across the country, the metros of the frostbelt (15%) had a greater share of metro poor living in high-poverty secondary cities than the Sunbelt (4%) in 2012–2016 (Table 1). Relatively small average shares of metro poor lived in high-poverty jurisdictions in the Mountain West (2%) and West (5%) compared with the Midwest (13%) and Northeast (16%) in 2012–2016.
Suburban poverty has become more concentrated over time in frostbelt jurisdictions. Of the poor people living in secondary cities, the average share in a high-poverty jurisdiction was 36% in the frostbelt and 10% in the Sunbelt in 2012–2016 (Table 2). This has diverged over time: In 1990, frostbelt and sunbelt metros displayed similar shares of secondary city poor living in high-poverty jurisdictions (24% and 23%, respectively). On average, metros in the Northeast and Midwest increased in their share of secondary city poor living in high-poverty jurisdictions by a factor of 1.5, while in sunbelt metros, this figure shrank by almost half (relative change). This suggests that the growth of suburban poverty may be associated with greater opportunity in the West and Mountain West and more of a reconcentration of poverty in the Midwest and Northeast. Yet, whether that opportunity materializes depends on the resources of individual jurisdictions.
Share (and Absolute Change since 1990) of Secondary City Poor Population in HP Secondary Cities in 2012–2016.
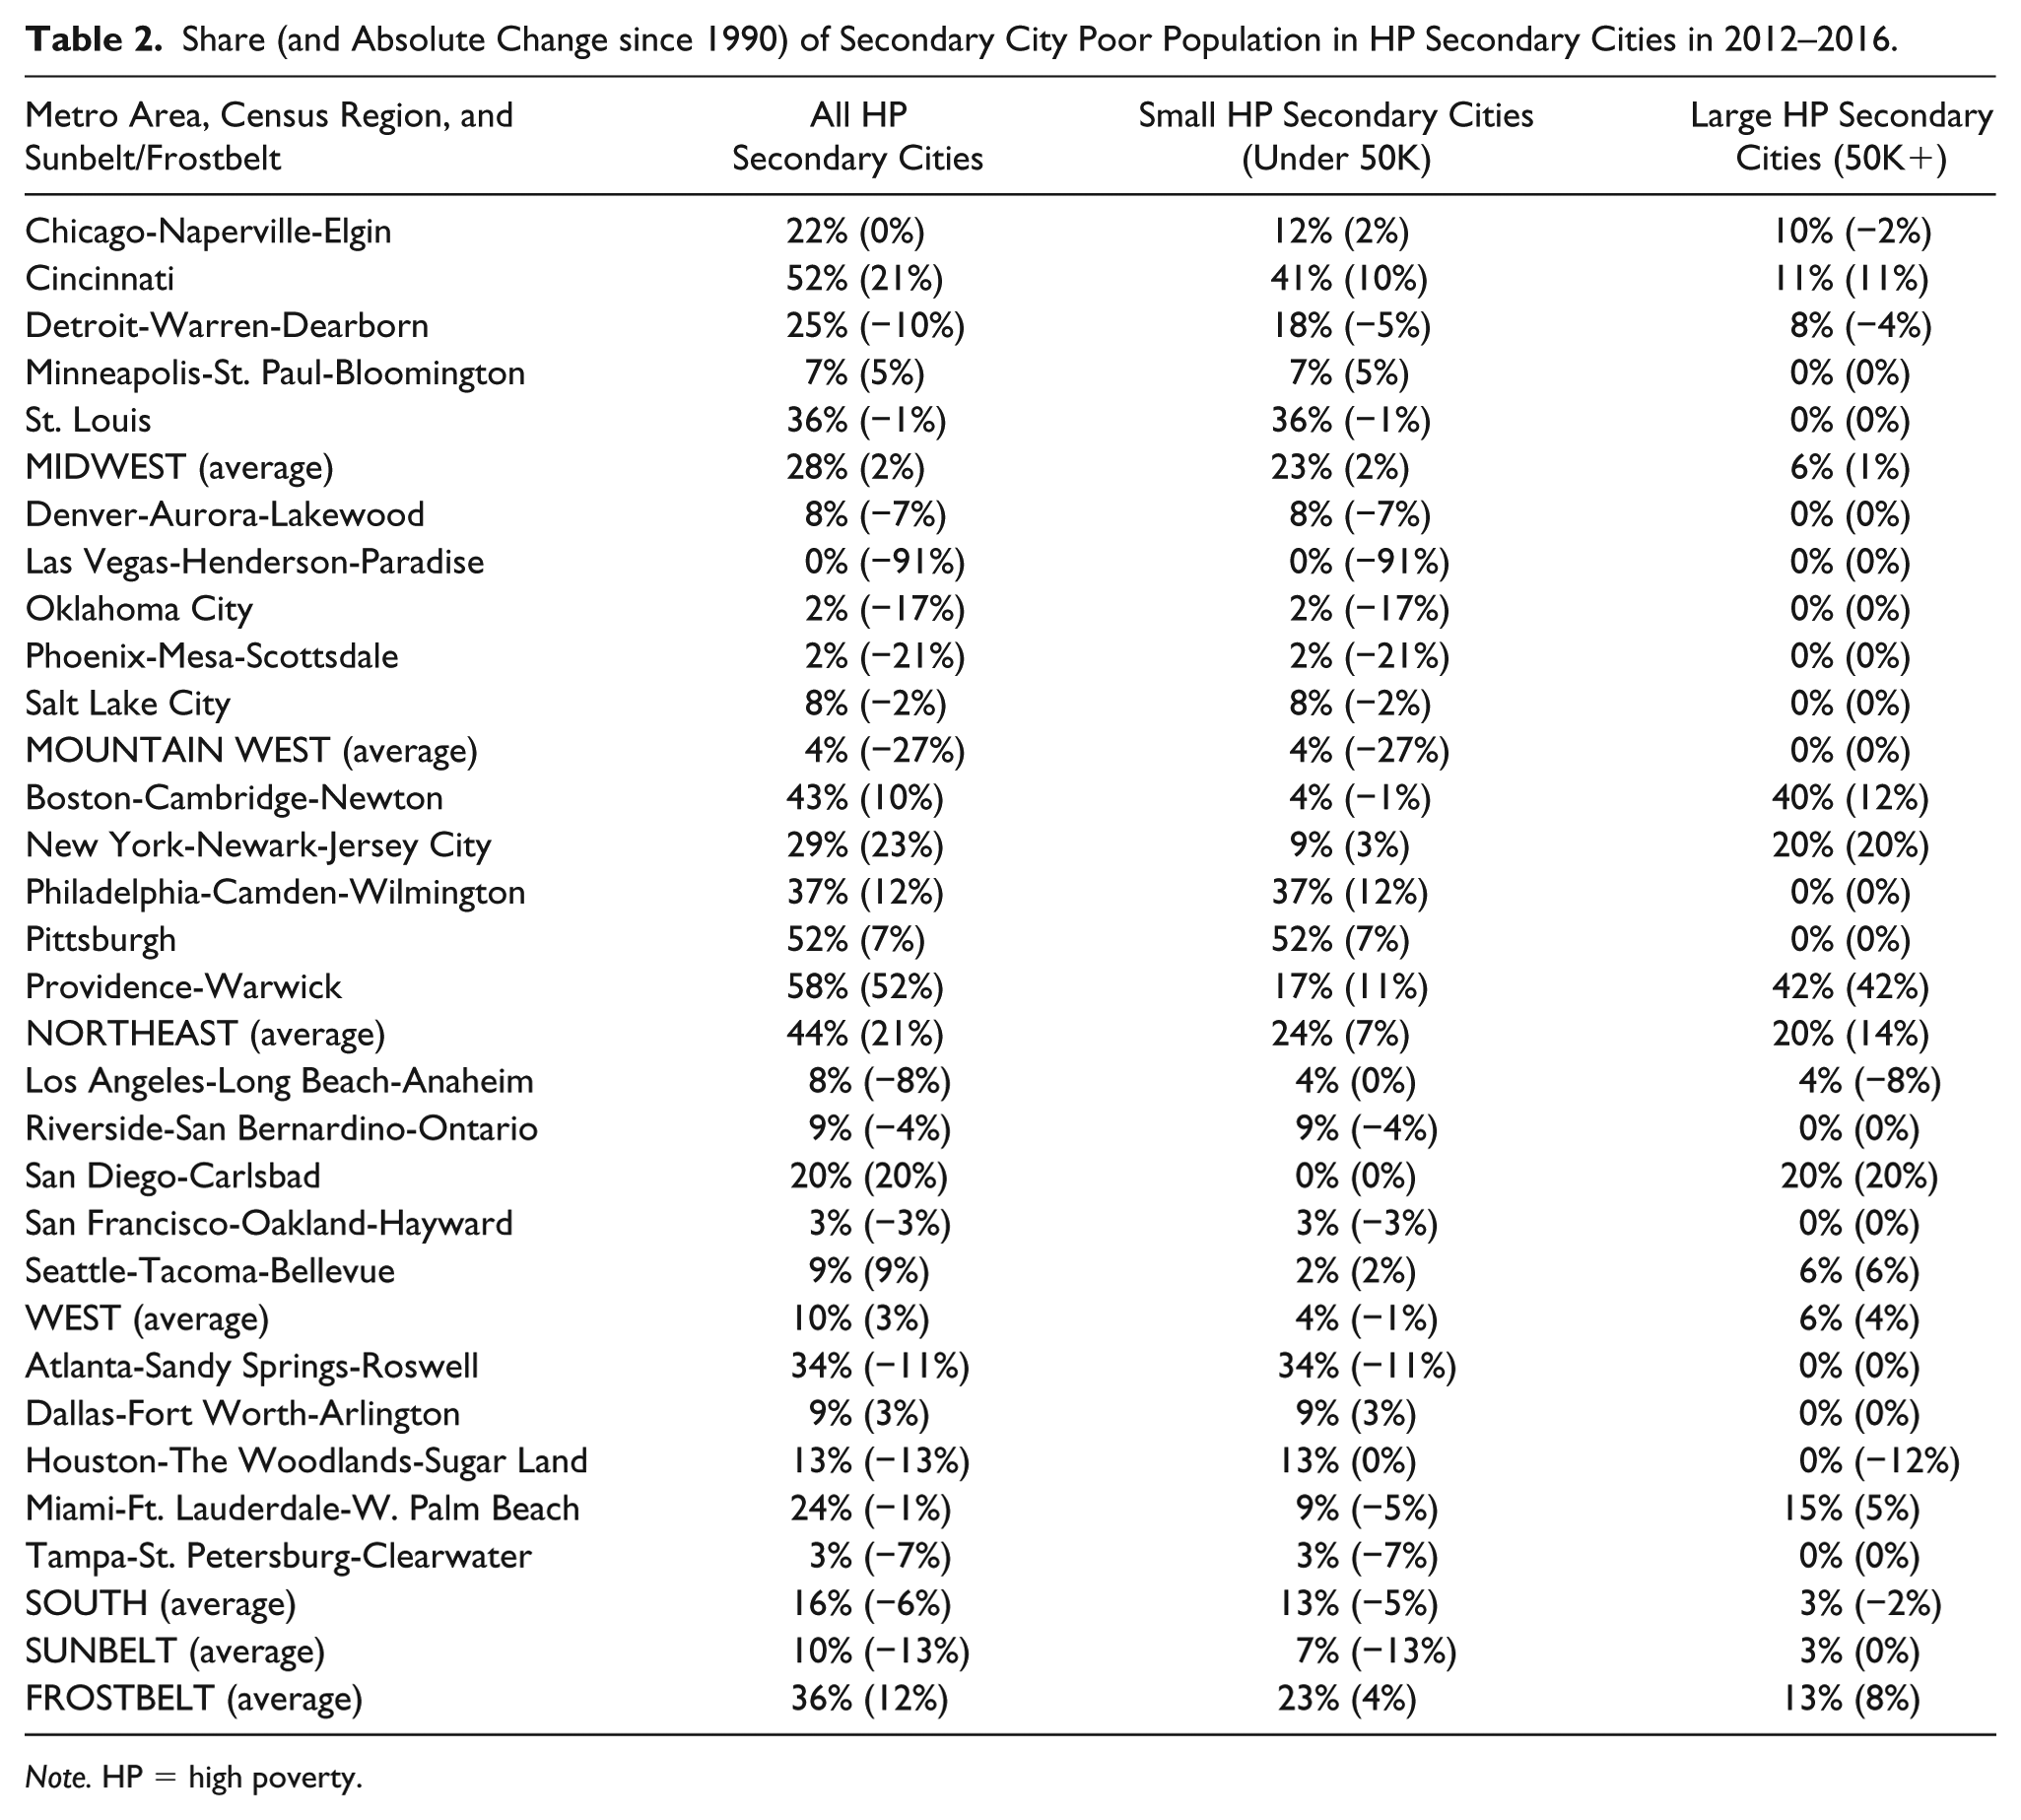
Note. HP = high poverty.
In the frostbelt, suburban poverty concentrated more in small jurisdictions. Smaller shares of the total secondary city poor population in sunbelt metros lived in small high-poverty secondary cities (7%) in comparison with the frostbelt (23%) on average in 2012–2016 (Table 2). In Pittsburgh, Cincinnati, Philadelphia, and St. Louis, a large share (52%, 41%, 37%, and 36%, respectively) of secondary city poor lived in small, high-poverty secondary cities. St. Louis had a total of 273 secondary cities, 71 of which were high poverty in 2012–2016 (Appendix Table A2). In the Mountain West and Pacific West, by contrast, the suburban poor tended to live in large secondary cities, few of which qualified as high poverty. Moreover, the trend from 1990–2016 was declining concentrations of suburban poverty in “high poverty” secondary cities in the Mountain West (Table 2).
Racial composition
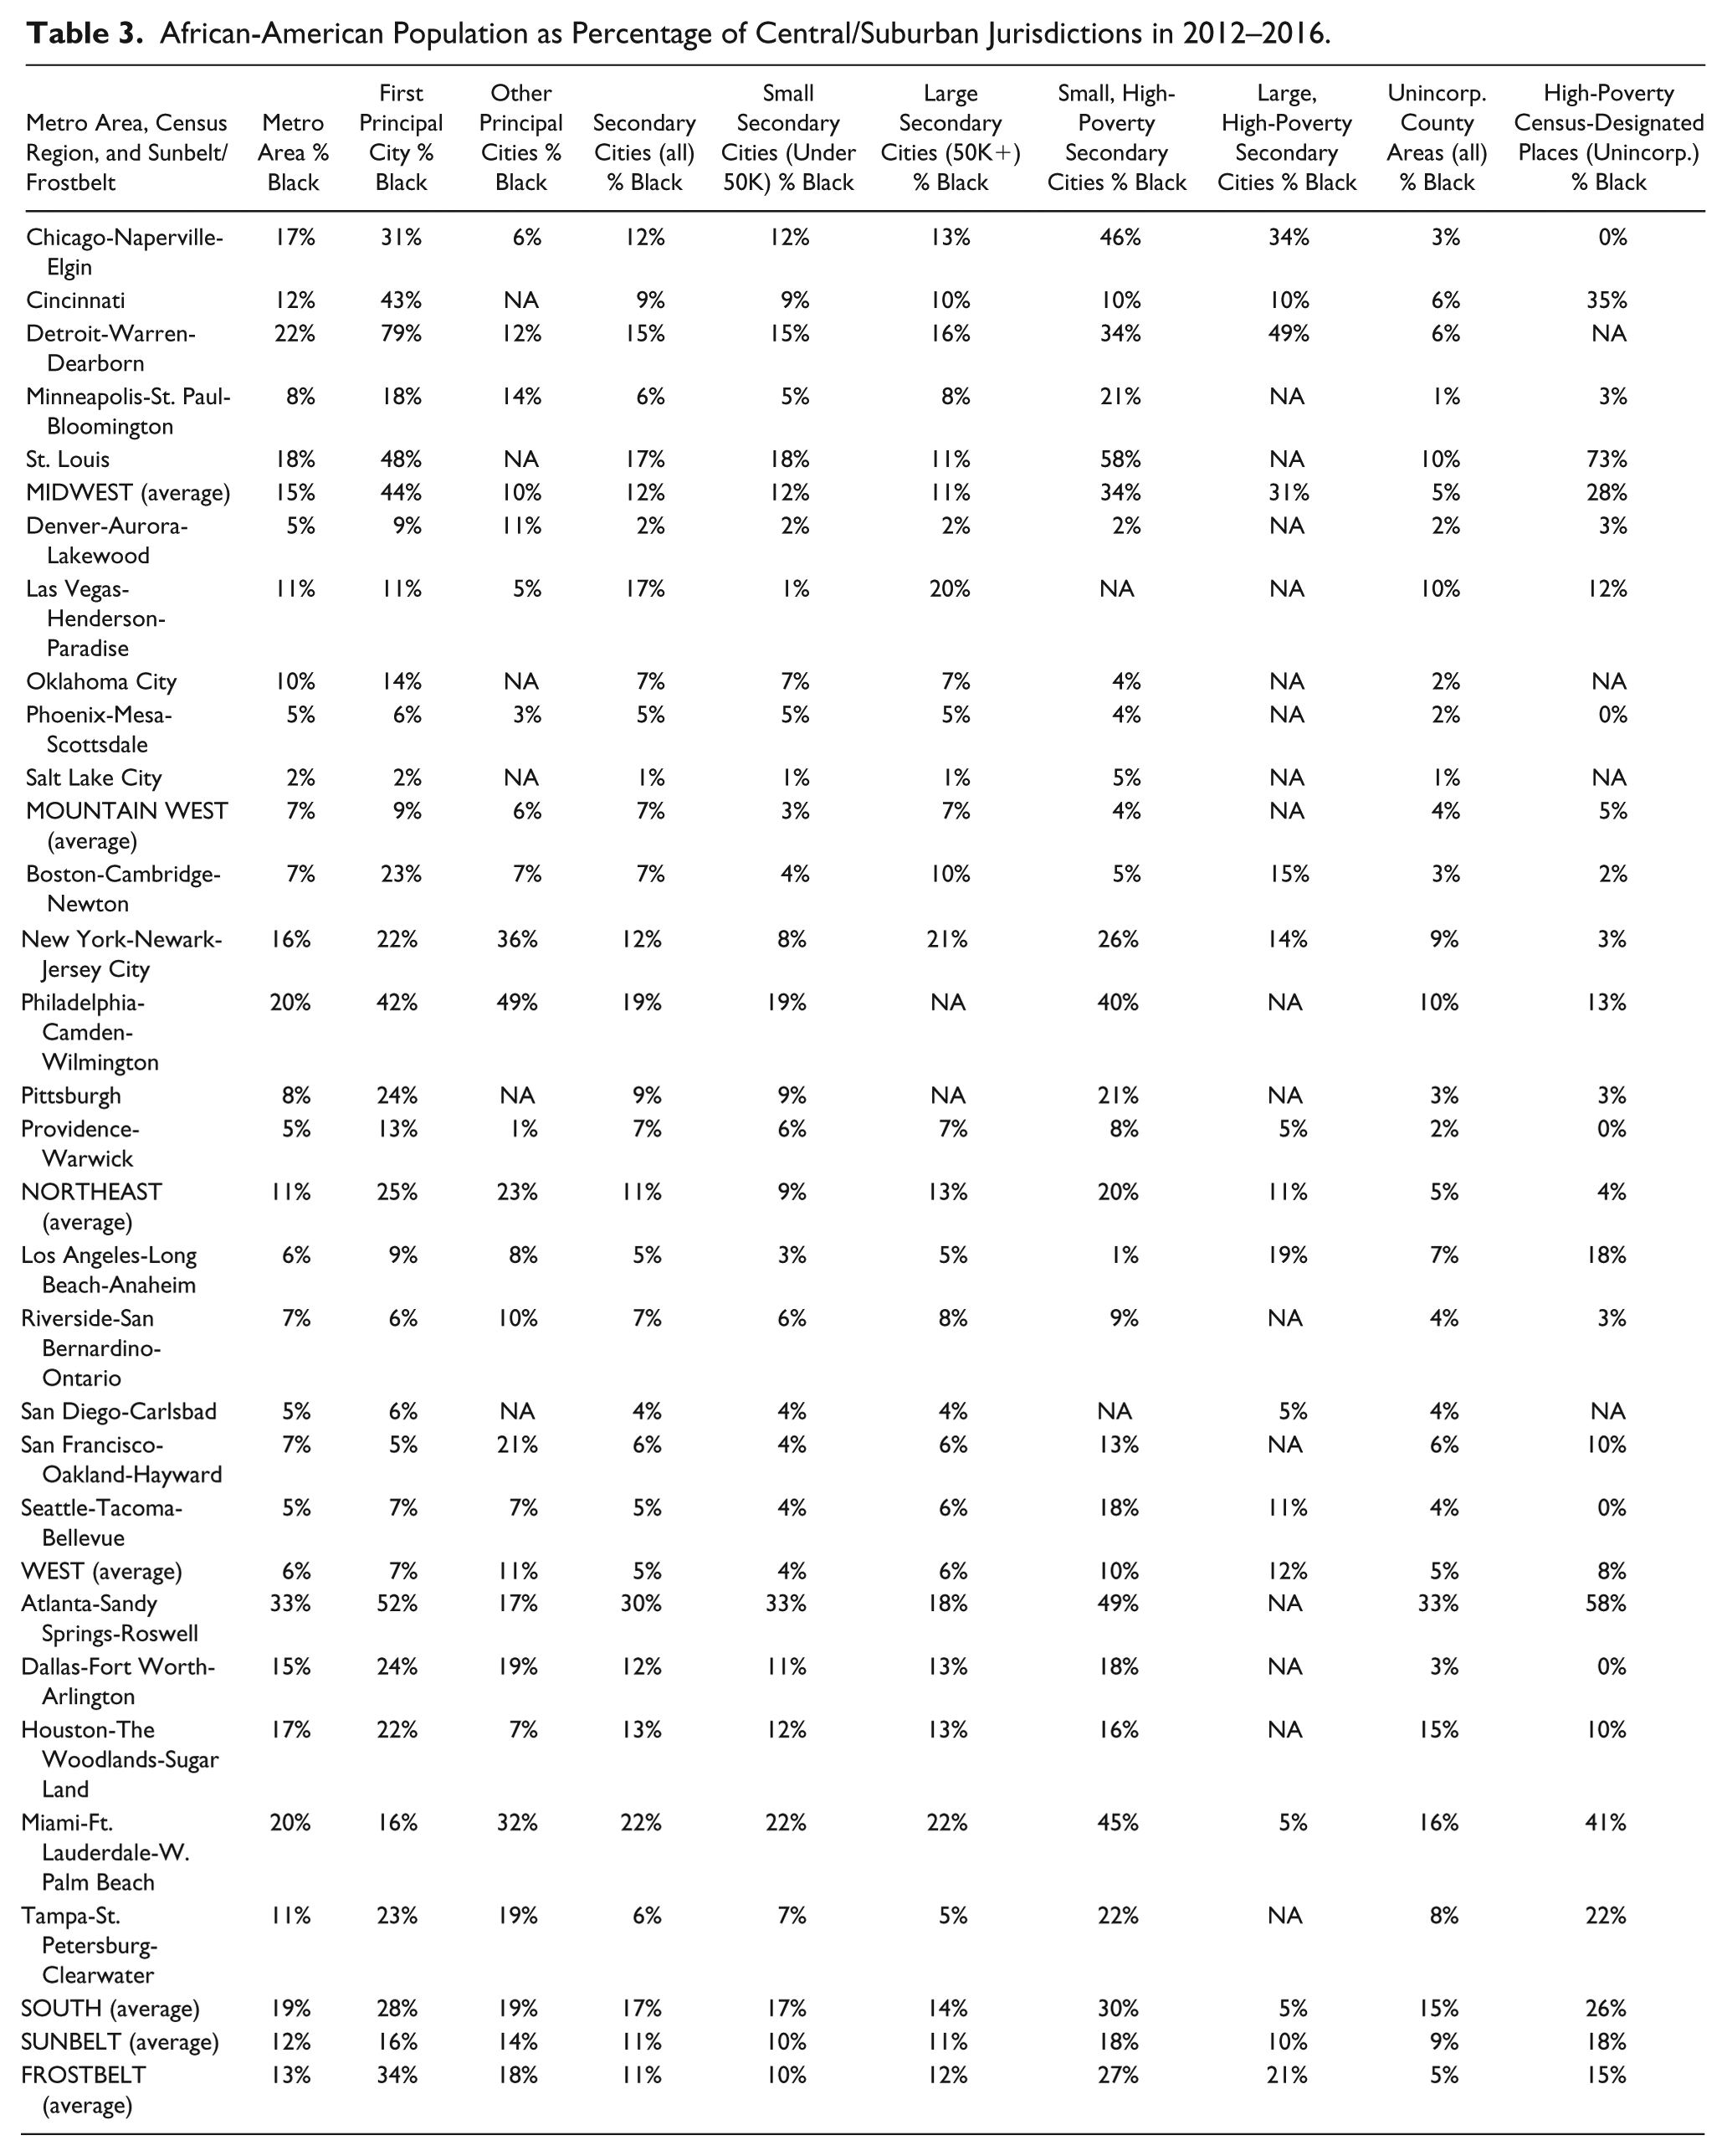
In the frostbelt, Blacks and Latinos were overrepresented in the small, high-poverty secondary cities where the metro poor increasingly reside. For example, midwestern small, high-poverty secondary cities were 34% African-American, although Blacks comprised only 12% of the population of all small secondary cities in the Midwest in 2012–2016 (Table 3). Within that region, Chicago’s small, high-poverty secondary cities were 46% Black in 2012–2016 although its secondary cities were only 12% Black overall. In St. Louis, small, high-poverty secondary cities were 58% Black, although small secondary cities in that metro were only 18% Black overall. Elsewhere in the frostbelt, Philadelphia’s small, high-poverty secondary cities were 40% Black, although small secondary cities in that metro were only 19% Black overall. Hispanics were similarly overrepresented. Small, high-poverty secondary cities were 66% Hispanic in Boston and 31% Hispanic in Providence, while only making up 13% and 15% of the population of all secondary cities in those respective metros in 2012–2016 (Table 4). In small, high-poverty secondary cities, there may be less opportunity for mobility for even middle or higher earning minorities than there would be in small secondary cities without as much concentrated poverty, which tend to have larger White populations.
African-American Population as Percentage of Central/Suburban Jurisdictions in 2012–2016.
Hispanic Population as Percentage of Central/Suburban Jurisdictions in 2012–2016.
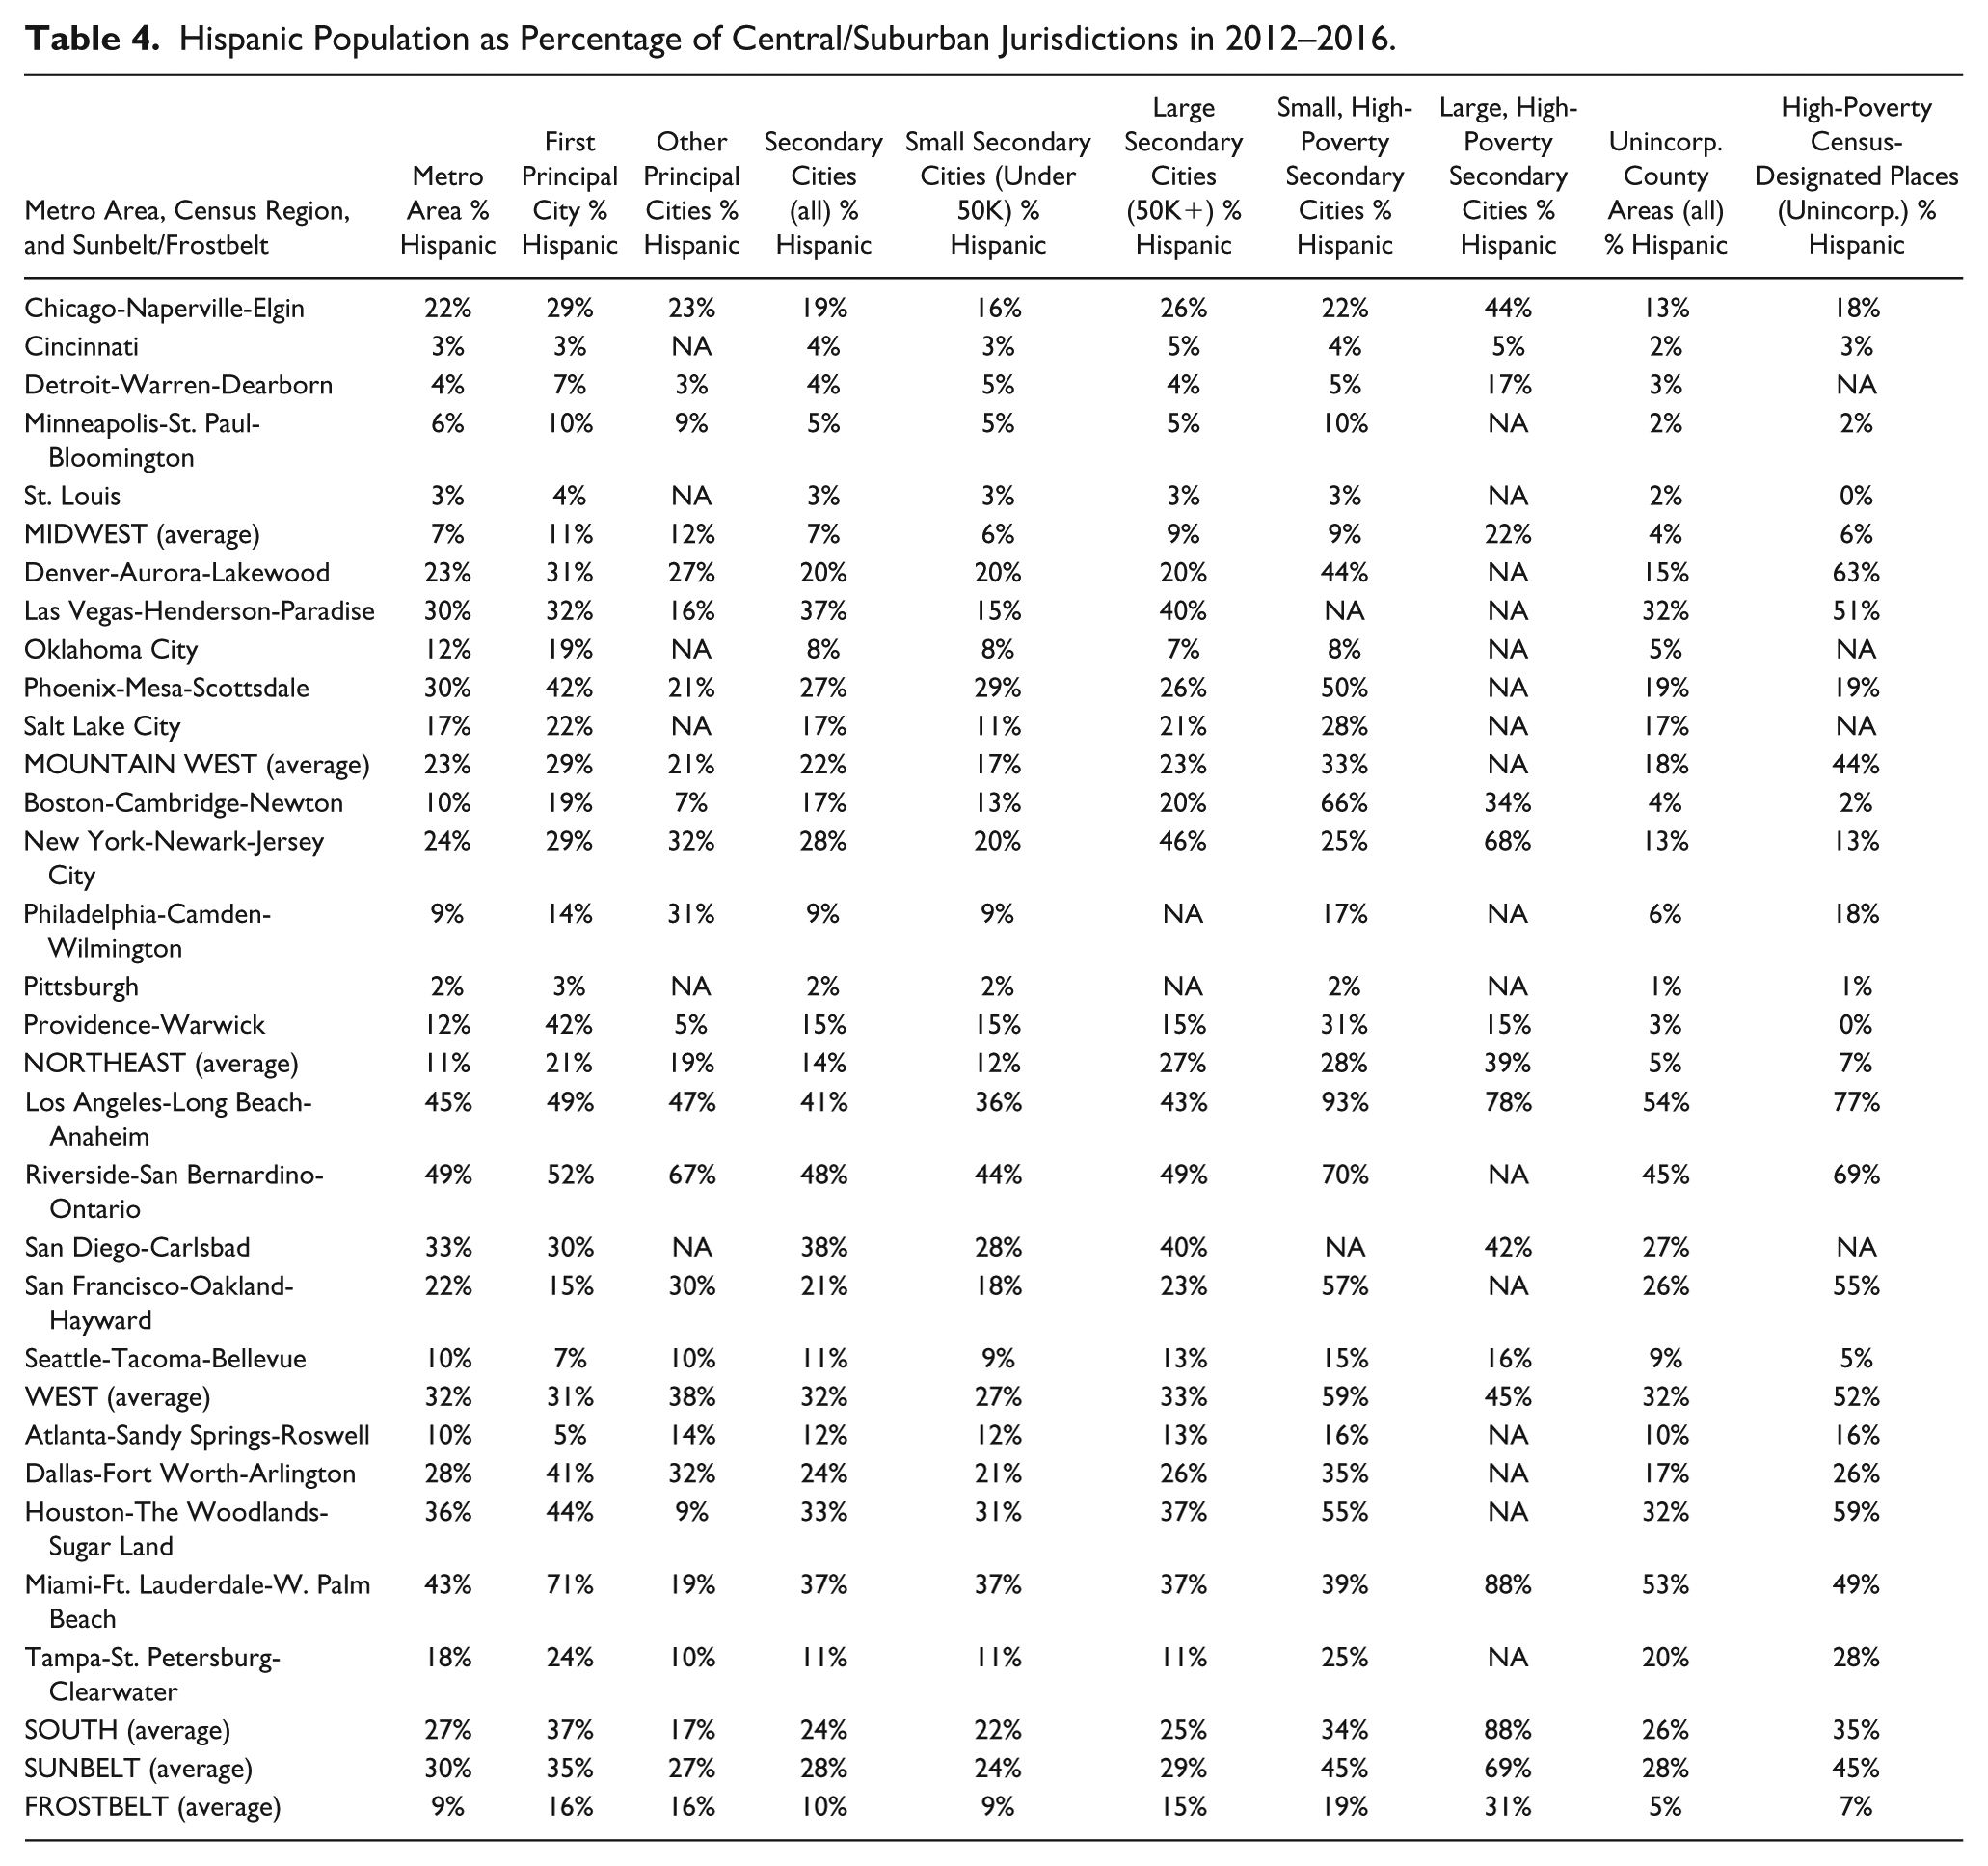
In the Sunbelt, the few large, high-poverty secondary cities had disproportionately large minority populations. However, due to their size, these cities are entitled to federal block grant dollars and may be more competitive for other state and regional resources. For example, the Los Angeles metro’s large, high-poverty suburbs were 19% Black, compared with all large suburbs in the metro area, where only 5% of the population was Black in 2012–2016 (Table 3). Los Angeles’s large, high-poverty secondary cities were 78% Hispanic; among all large secondary cities in the Los Angeles metro, Hispanics made up only 43% of the population in 2012–2016 (Table 4). An even more extreme example, Miami’s large, high-poverty suburbs were 88% Hispanic, while the total population of its large secondary cities was only 37% Hispanic. Although there is an overrepresentation of minority populations among large, high-poverty secondary cities in the Sunbelt, their size may enable them to provide better opportunities than the small, high-poverty jurisdictions in the frostbelt.
In a few frostbelt metros, the disproportionate representation of Blacks in small, high-poverty secondary cities accounted for a significant share of the regional Black population. In Pittsburgh and St. Louis, more than a quarter of the metro Black population (27% and 26%, respectively) lived in small, high-poverty secondary cities in 2012–2016 (Appendix Table A3). By comparison, the Black population in the Chicago metro was more spread out among secondary cities: By 2012-2016, 45% of the region’s Black population lived in secondary cities but only 7% lived in small, high-poverty cities, and another 5% lived in large, high-poverty cities. In all metros of the West, Mountain West, and South, the shares of the total metro Black and Hispanic populations living in high-poverty secondary cities were under 10% in 2012–2016.
This analysis of the size of the suburban cities where poverty has grown, its concentration, and racial dimensions reveal important regional differences. Much as Rusk (2013) suggested, the “small box” metros exhibited more high-poverty jurisdictions even as poverty suburbanized. Yet, sunbelt metros can no longer be characterized as “cities without suburbs.” Incorporation and annexations have created large affluent jurisdictions on the outskirts of the historic sunbelt cities. Suburban poverty has grown in these metros as well. Because of their larger size, these jurisdictions are less likely to concentrate poverty and are less vulnerable to fiscal stress. But, as Strom (2017) points out, we know little about what the pattern of political and social organization in these jurisdictions means for their ability and willingness to address the needs of their low-income residents.
The Poor in Unincorporated Areas and Newly Incorporated Municipalities
The balance between incorporated and unincorporated territory represents an important feature of metropolitan governance. In many newly developed areas, unincorporated status is simply a way station on the road to annexation. But many metros include significant territory that remains unincorporated for decades. The income and racial characteristics of incorporated and unincorporated places tells us much about the regional governance of poverty and about how it intersects with race and ethnicity. Significant shares of poor residents in unincorporated areas mean that counties and an array of special districts play a central role in governing the poor. Whether the poor are geographically clustered or spread over a large area within the unincorporated parts of a county impacts service delivery and the trajectory of governance boundaries for that population. Similarly, the income and racial profiles of new municipalities provide information about whether incorporation is leaving the poor behind in unincorporated areas and about how the poor and members of minority groups are distributed across newly incorporated places.
The South had the largest share of metro poor—36%—living in unincorporated areas in 2012–2016 (Table 1). The Atlanta and Tampa metros had the highest shares of the total population (about 61% each) and the poor population (56% each) living in unincorporated areas. (As we discuss below, Atlanta presents a moving target—a recent rash of incorporations has continued beyond the time frame of our data.) Much of this poverty is not rural in the sense of being located on the fringes of the metropolitan area. Indeed, a considerable amount of unincorporated poverty is located in suburban counties that the Census categorizes as “central.” For example, our data show that of Atlanta’s poor population living in unincorporated areas, 82% lived in counties designated as “central” by the Census Bureau. Four populous counties closest to Atlanta (excluding Fulton) accounted for 58% of the poor in unincorporated areas. 9 Unincorporated poverty in the Northeast was variable, ranging from 15% of metro poor in New York to 34% in Pittsburgh in 2012–2016 (average 26%). The Mountain West ranged from 6% of metro poor living in unincorporated areas of the Oklahoma City metro to about 13% in Denver and Salt Lake, with the exception of Las Vegas, where 46% of metro poor lived in unincorporated areas. 10 The Midwest and West had the lowest average shares of metro poor living in unincorporated areas (15% and 13%, respectively).
The South also experienced the biggest increases in unincorporated poverty as a share of the total poor in a metro area from 1990 to 2012–2016 (Table 1). With the exception of the Dallas and Miami metros, where unincorporated poverty shrank slightly, southern metros saw growth in unincorporated poverty. In Atlanta, the share of metro poor in unincorporated county areas grew by 15 percentage points to 56% of metro poor. Houston experienced a 14-percentage-point growth to 33% of metro poor in unincorporated areas (an increase by a factor of 1.7) and in Tampa, the unincorporated share of poor grew by 10 percentage points to 56% of metro poor. Growth in the share of poor in unincorporated areas was relatively low or declined slightly in the West and Mountain West, but increased slightly (1–7 percentage points) across the Northeast and in most of the Midwest.
Racial composition
Minority populations in the South grew in unincorporated areas and dropped in central cities, much as they rose in secondary cities elsewhere in the country. The South experienced an average increase of 7 percentage points in the share of the metro area’s total Black population and a 5-percentage-point increase in the share of the metro Hispanic population living in unincorporated areas since 1990 (Appendix Table A3). The greatest increases in the share of the Black population living in unincorporated areas were in Houston (21 points), Tampa (21 points), and Atlanta (15 points). In Miami, this figure shrank by 19 percentage points after a spate of incorporations in the 1990s (Waldner and Smith 2015). Houston experienced an 18-percentage-point increase in the share of its Hispanic population living in unincorporated areas over this period of time.
Concentration of poverty
Whether the growth in poverty in unincorporated areas represented a move to opportunity or not depends on many factors, including the geographic dispersion or concentration of poverty. Unincorporated areas are made up of two parts—one is the collected “census-designated places” or CDPs and the other is the “unincorporated remainder” of a given county. CDPs are geographic clusters of people in unincorporated areas, and the remainder is everyone else who lives scattered around the county outside of a CDP. CDPs are a natural measure of geographic concentration of people because the Census chooses to denote a population center. The presence or absence of high-poverty CDPs could be indicative of future incorporations or underbounding, and point to geographic dynamics that influence low-income populations’ ability to compete for services within a county.
Unincorporated poverty was more concentrated in the Sunbelt than in the frostbelt. High-poverty CDPs were more numerous (Appendix Table A2) and represented a greater share of the metro poor population (Table 1) in the Sunbelt, particularly in the South, than in the frostbelt. High-poverty CDPs also tended to have higher percentages of minorities than the surrounding unincorporated areas (Tables 3 and 4). However, poor CDPs were less likely to incorporate than wealthier unincorporated areas in our metros.
New municipal incorporations
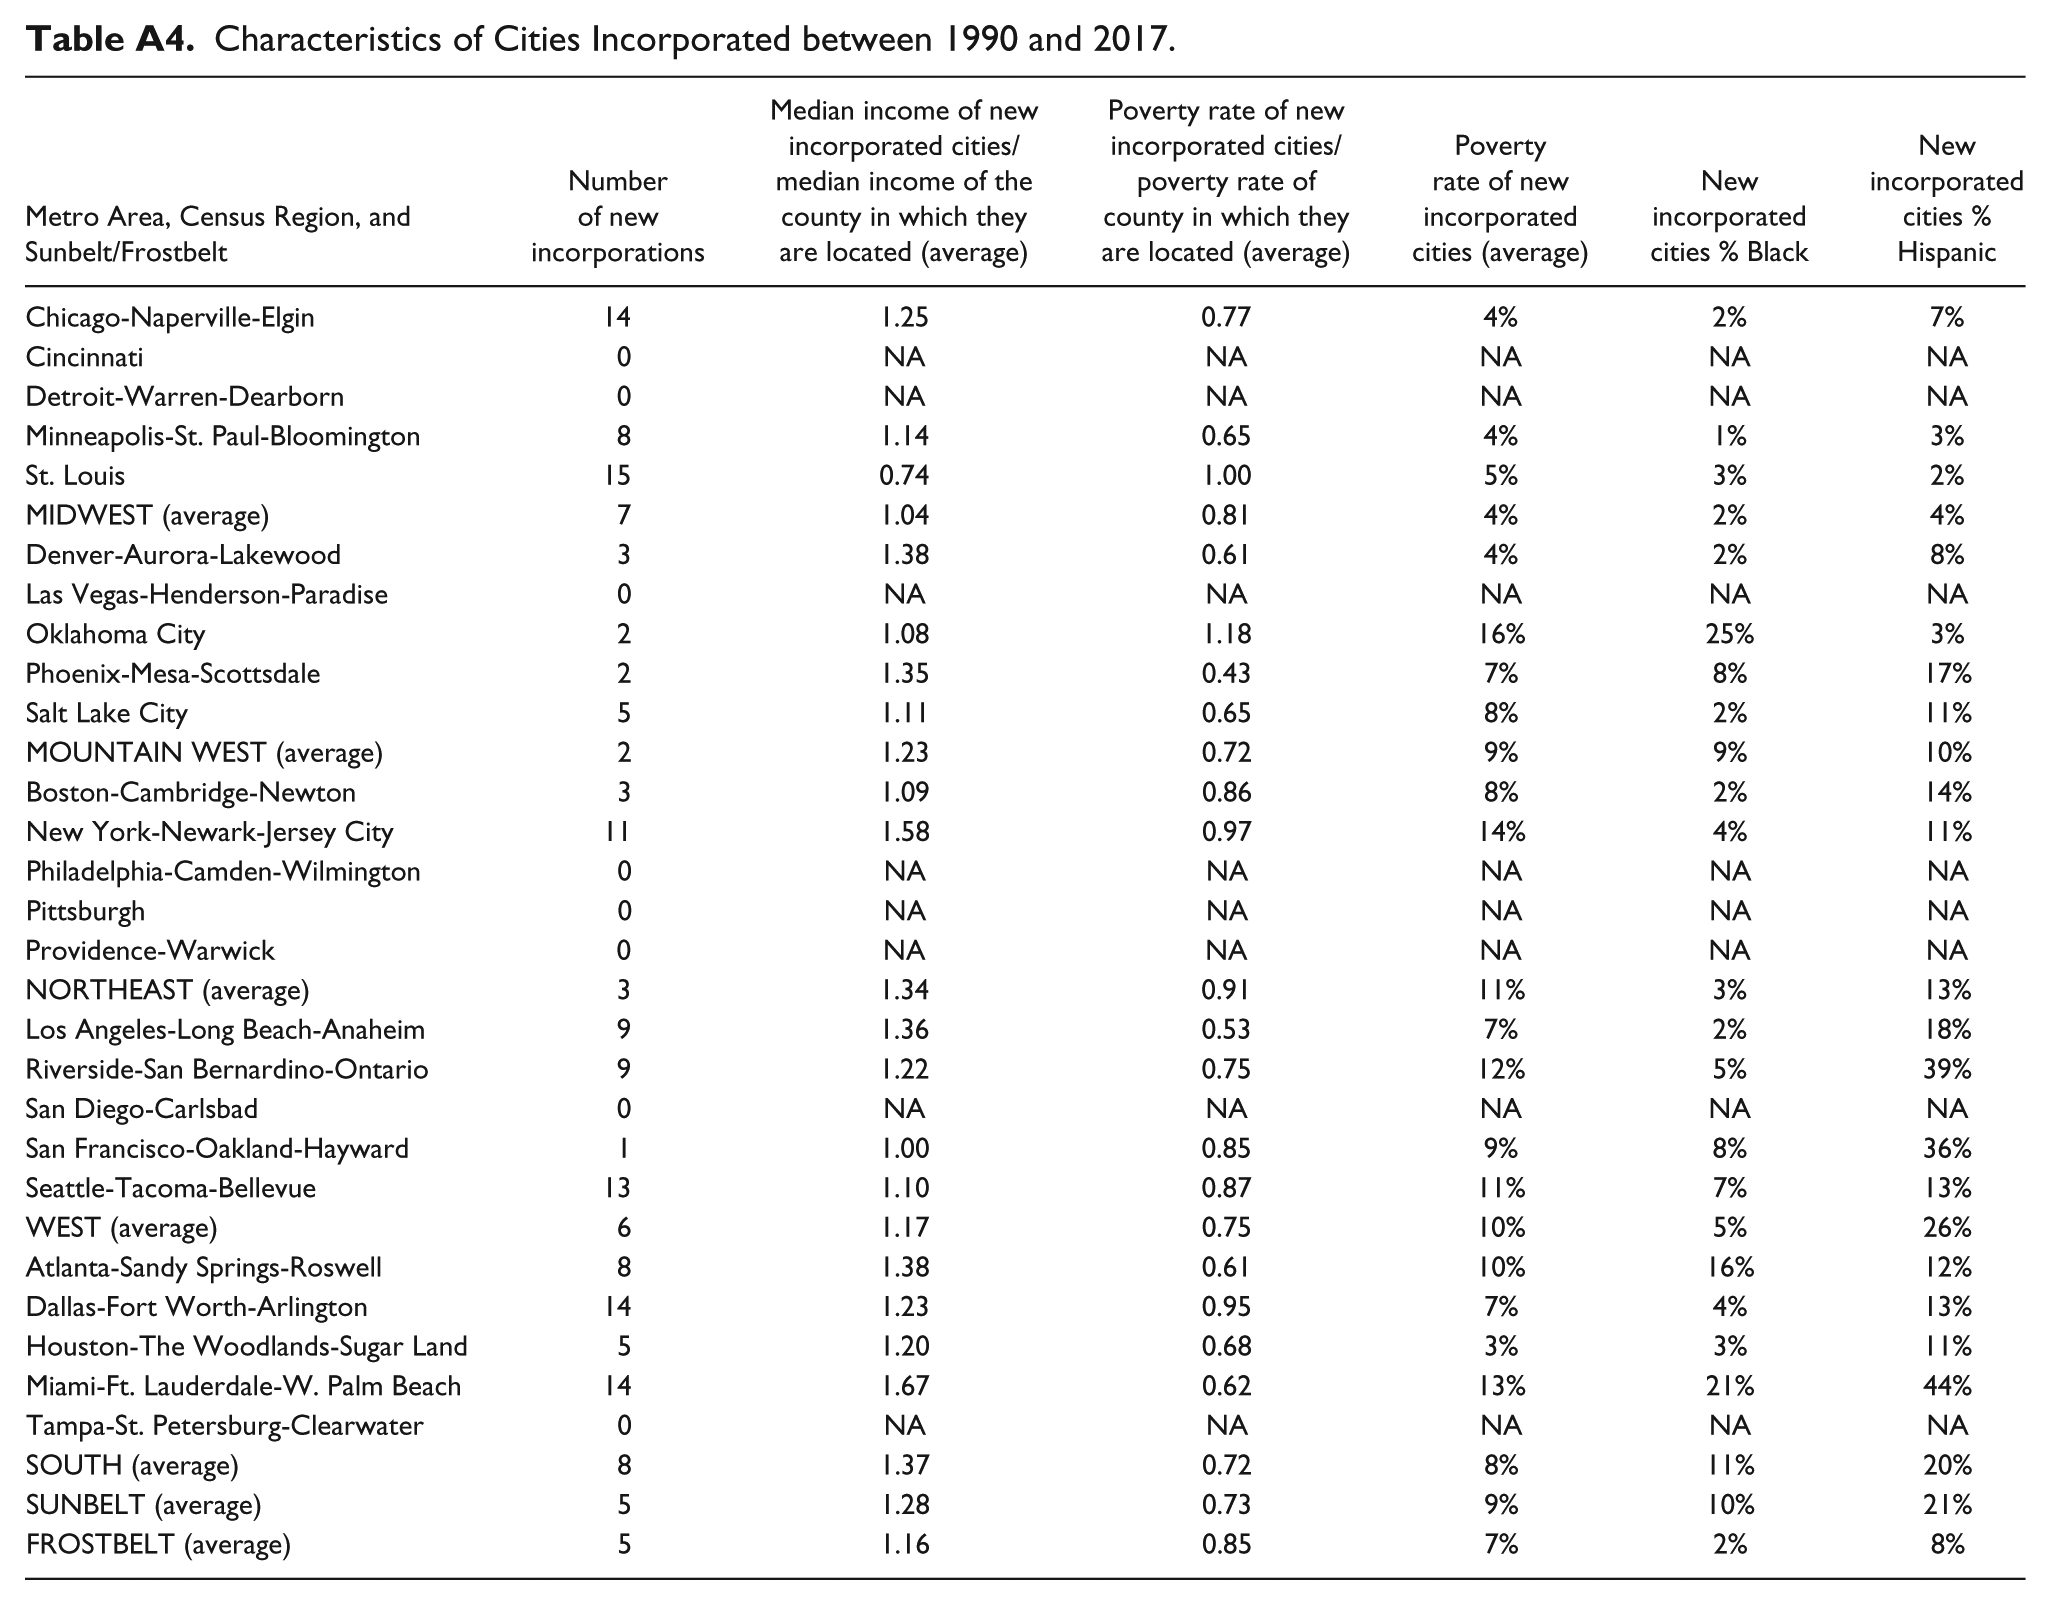
The growth of unincorporated poverty in the South reflects rapid patterns of development but it is also affected by decisions about municipal incorporation and annexation. A closer look at the patterns of municipal incorporation shed light on the political dynamics surrounding unincorporated poverty. Between 1990 and 2012–2016, 18 of our metros experienced one or more municipal incorporations (Appendix Table A4). Most of these metros were located in the West, Mountain West, or South, and in most, the newly incorporated municipalities had median incomes that were substantially higher than that of the county in which they were located. For example, the 14 new municipalities in the Miami area had an average median income that was 67% higher than the county; the six in Atlanta were 38% higher than the county. 11 Examining news accounts of incorporation clusters, including those in Miami, Atlanta, and Seattle, Waldner and Smith (2015, p. 187) characterized the movement to create new municipalities as a “mass revolt against the county government” by the new wealthier municipalities. Residents of the new municipalities sought—and received—lower taxes and higher service levels by seceding from the county. These incorporations left the counties with responsibility for the remaining areas of unincorporated poverty and depleted tax bases with which to provide services (Waldner and Smith 2015).
In the Atlanta region, a “cityhood” movement is transforming a region once governed by a handful of cities and powerful county governments. After 2005, when the state eased the restrictions on forming new municipalities, Sandy Springs became the first to break away from Fulton County, home to the city of Atlanta. With a higher income and larger White population than the rest of the county, Sandy Springs had long sought autonomy (Connor 2015). Since then, Fulton and DeKalb counties have experienced a rash of incorporations, totaling 10 by 2018. Wealthier areas with more Whites initiated the move to incorporate but have since been joined by less affluent, predominantly Black communities. In Fulton County, the 2017 incorporation of South Fulton, a majority Black city, left little unincorporated territory within the county. Incorporations have clustered in the two counties with the largest Black populations and with Black county leadership. In DeKalb County, incorporations have concentrated in the northern, more affluent, predominantly White parts of the county, although the remainder of the county has also sought to incorporate (Mock 2018). These two counties now resemble the governmental patchwork of the North and Midwest: municipalities divided by income and race. However, the larger size of the cities and the substantial Black middle class in the Atlanta region suggests that new Black municipalities will have a brighter fiscal future than the smaller cities of St. Louis and Chicago metros. 12 Even so, it is unlikely that these municipalities will replicate the high levels of social spending of Fulton County. 13
Even with recent municipal incorporations and annexations, the South has experienced a reconcentration of poverty in unincorporated areas, much as poverty is reconcentrating in small secondary jurisdictions in the frostbelt and is shifting to (but not concentrating in) large secondary jurisdictions in the West. Pockets of deep poverty, with disproportionately Black and Latino residents, remain outside municipalities, subject to county governance. The location of poverty in diverse settings in physically large counties makes the challenge of providing services especially challenging.
Implications for Governance
Since the 1960s, the American debate about poverty has been rooted in the picture of Black urban poverty. The War on Poverty targeted big cities—and to a lesser extent, rural areas; later, programs, such as CDBG and HOME, made large jurisdictions entitlement cities. Most studies of poverty take either a national perspective or a focus on big cities or rural areas. The shifting political geography of poverty we have documented in this article raises a new set of governance questions for scholars studying the intersection of place and poverty.
The first concerns the challenge posed by high-poverty smaller cities, found especially in the Midwest and the Northeast. Small, poor jurisdictions are especially vulnerable to decline in regions with slow growth. For example, Chicago’s high-poverty small jurisdictions experienced a 14% population drop between 1990 and 2012–2016; in Detroit, the decline was 20%. Small, high-poverty jurisdictions often possess weak fiscal capacity and, even with high tax rates, find it difficult to provide even basic services. Harvey, Illinois, a majority Black secondary city of 24,908 in Chicago’s south suburbs, provides a stark example. Struggling with pension payments, a budget shortfall, and a 38% poverty rate, the city laid off a quarter of its police force and 40% of its firefighters in 2018 (Koeske 2018; Slowik 2018). Moreover, small, poor, suburban secondary cities are less able to count on federal dollars than are larger cities. For example, although the number of poor residents is higher in St. Louis County than in the city of St. Louis, the county’s allocation of community development grant dollars is less than a third of what the city receives (Swanstrom 2019).
A related issue is the fate of small majority–minority cities with poverty levels above the regional median. Many of these cities have long, proud histories as places of community and autonomy from White power structures (Wiese 2004). Others are new. Smith and Waldner (2018) found that majority–minority municipalities accounted for 10% of the total new incorporations between 1990 and 2010. Perry (2017) shows that 3,643,007 Black people live in medium-sized majority Black cities with populations between 2,500 and 50,000; another 4,781,392 live in cities with populations greater than 50,000. In a study of the 50 largest metropolitan areas, Orfield and Luce (2013) estimate that 20 million people lived in predominantly non-White suburban municipalities in 2010 and another 53 million in diverse suburbs, which they define as more than 20% non-White (p. 400).
We need to know more about the demographic and political trajectories of such cities, as well as their advantages and disadvantages for low-income residents. When majority–minority jurisdictions are the product of racial transition and White flight, the shift to minority political leadership may lag, exacerbating racial tensions, as in the case of Ferguson, Missouri. Many majority–minority cities struggle financially, and many were badly harmed in the foreclosure crisis. Yet, these cities and towns also have strengths. Cities controlled by African-Americans may offer relief from disparate police treatment and offer low-income residents more influence over city resources (Latimore 2018; Perry 2017). Likewise, with control over land use, these cities may be able to shield themselves from undesirable land uses, as Smith and Waldner (2018) suggest. Craw’s (2010) research finds that cities with larger Black and Latino populations are more likely to receive intergovernmental grants. Further research is needed to understand the role that counties, states, and the federal government can play to support these municipalities.
The political voice of small, poorer cities in state government also merits attention. Research has examined the mixed experiences of big cities in state politics, one that is often conflictual. Big cities do not always get what they want (Gamm and Kousser 2013; Weir, Wolman, and Swanstrom 2005). Yet, big cities cannot be ignored by governors or state legislatures: They have large state delegations and often represent powerful interests. The same cannot be said of smaller municipalities. We need to know more about how suburban cities, especially poorer, smaller cities, fit into state-level coalitions, when they coalesce to present a united voice in state politics, and what difference it makes. What impact do designations such as Massachusetts’ “Gateway Cities” or suburban consortia such as Cleveland’s “First Suburbs Consortium” have on the political voice of distressed cities?
A second set of questions concerns the critical role of county governments in assisting small, high-poverty jurisdictions and the poor in unincorporated areas. Charged with distributing CDBG and HOME funds to these areas, and administering other important functions, including county health departments, counties are pivotal to the well-being of the poor in small cities with high poverty rates. Counties, special districts, and townships (where they exist) are the only government for most of those living in unincorporated areas. Research on regional cooperation shows that while large jurisdictions may cooperate horizontally with other cities, smaller jurisdictions are more likely to make vertical connections with counties (Carr, Gerber, and Lupher 2007). The literature on service contracting with counties offers an example of such cooperation but we know little about other kinds of connections between counties and, especially, fiscally stressed cities with large, low-income populations. Counties may be less eager to take on the problems of these troubled municipalities.
Moreover, relationships between counties and municipalities are likely variable and political in ways that merit more scrutiny. Political party loyalties and racial divisions may drive the relationship between counties and smaller, poorer cities. Cook County, Illinois, provides some insight. Long tied to the Chicago machine through party politics, the county used its resources in service of its political allies in the city, largely ignoring the growing distress in its southern suburbs. However, in 2010, a new Black county executive less beholden to the Chicago machine took office and launched an initiative to assist these struggling communities. 14 Dynamics may also differ, for example, when Republican county executives make decisions that affect poorer minority Democratic cities.
While political relationships may mediate the connections between counties and low-income residents in poor municipalities, the poor in unincorporated areas can easily remain invisible to county leaders, especially when they are spread out across the county (Allard 2017). Moreover, counties may have limited capacity to address the needs of low-income populations. In Harris County, home to the city of Houston, the unincorporated population has grown to 1.8 million, approaching the 2.2 million in the city of Houston. Poverty in unincorporated Harris County has exceeded population growth: In 1990, 8% of residents were poor; by 2016, the percentage had jumped to 13%. Yet, the state restricts the county’s revenue source to the property tax and sharply limits how much the property tax can be raised. Such state rules can have a profound impact on the poor in unincorporated places by restricting—or facilitating—counties’ capacities to govern (Feuk 2018).
In big cities, nonprofit organizations often take the lead in representing the interests of low-income residents. Especially in the older cities of the Northeast and Midwest, these organizations include large, well-established agencies that forge close ties to political leaders and city health and human service bureaucracies. As Nicole Marwell (2004) has shown, nonprofits may establish machine-like ties to state legislators, through which the nonprofits receive streams of state funding in tacit exchange for supporting their benefactor electorally. We know much less about the relationship of nonprofits to county governments. Regional nonprofits, such as Catholic Charities, have long enjoyed ties to city governments, but we know little about their connections to county governments, especially suburban county governments. The distinctive history of most suburbs and many sunbelt metros means that they have few long-established, high-capacity nonprofit organizations aimed at assisting low-income residents (Weir and Schirmer 2018).
A final area for further inquiry concerns the impact of the new political geography on regional collaborations. Smaller towns can have a harder time getting on the radar for regional collaborations that increase local capacity and bring in philanthropic and government grant dollars (Mattiuzzi 2017). Regional authorities focus on economic development, largely avoiding redistributive measures (Savitch and Adhikari 2017). Yet, there are instances of philanthropically sponsored collaborations specifically targeted on clusters of small, poor, Black suburbs. For example, 24:1 (24 Communities, 1 Vision) in the St. Louis region, which brings together 24 small, poor, largely Black municipalities that are part of a single school district. Anonymously funded, the collaboration has pursued an ambitious agenda of economic development, affordable housing, and improved schooling (Swanstrom et al. 2013). The changing racial composition of suburbs may open new possibilities for regional initiatives. In 2014, Clayton County, a majority Black county south of Atlanta, voted to join Atlanta’s transit system MARTA. In doing so, it became the first suburban county to embrace the city-based system, long resisted by White suburban counties on openly racial grounds (Karner and Duckworth 2018).
The political geography of poverty was never as simple as the old city/suburban/ Black/White depiction suggested. But over the past three decades, poverty has shifted in the legacy metros of the Northeast and Midwest, and it has grown in sunbelt metros, where urban development did not follow the older model of extreme jurisdictional fragmentation. The more diverse set of jurisdictions that are now home to poor residents in all regions of the country increases the risk that the poor can be pushed “out of sight, out of mind.” The small secondary cities and unincorporated areas where poverty has grown have fewer tools to assist their poor residents. Understanding the different political arrangements that now govern the poor in metropolitan America represents a vital step toward assessing the opportunities and risks that emerge from the intersection of place and poverty.
Footnotes
Appendix
Characteristics of Cities Incorporated between 1990 and 2017.
| Metro Area, Census Region, and Sunbelt/Frostbelt | Number of new incorporations | Median income of new incorporated cities/median income of the county in which they are located (average) | Poverty rate of new incorporated cities/poverty rate of county in which they are located (average) | Poverty rate of new incorporated cities (average) | New incorporated cities % Black | New incorporated cities % Hispanic |
|---|---|---|---|---|---|---|
| Chicago-Naperville-Elgin | 14 | 1.25 | 0.77 | 4% | 2% | 7% |
| Cincinnati | 0 | NA | NA | NA | NA | NA |
| Detroit-Warren-Dearborn | 0 | NA | NA | NA | NA | NA |
| Minneapolis-St. Paul-Bloomington | 8 | 1.14 | 0.65 | 4% | 1% | 3% |
| St. Louis | 15 | 0.74 | 1.00 | 5% | 3% | 2% |
| MIDWEST (average) | 7 | 1.04 | 0.81 | 4% | 2% | 4% |
| Denver-Aurora-Lakewood | 3 | 1.38 | 0.61 | 4% | 2% | 8% |
| Las Vegas-Henderson-Paradise | 0 | NA | NA | NA | NA | NA |
| Oklahoma City | 2 | 1.08 | 1.18 | 16% | 25% | 3% |
| Phoenix-Mesa-Scottsdale | 2 | 1.35 | 0.43 | 7% | 8% | 17% |
| Salt Lake City | 5 | 1.11 | 0.65 | 8% | 2% | 11% |
| MOUNTAIN WEST (average) | 2 | 1.23 | 0.72 | 9% | 9% | 10% |
| Boston-Cambridge-Newton | 3 | 1.09 | 0.86 | 8% | 2% | 14% |
| New York-Newark-Jersey City | 11 | 1.58 | 0.97 | 14% | 4% | 11% |
| Philadelphia-Camden-Wilmington | 0 | NA | NA | NA | NA | NA |
| Pittsburgh | 0 | NA | NA | NA | NA | NA |
| Providence-Warwick | 0 | NA | NA | NA | NA | NA |
| NORTHEAST (average) | 3 | 1.34 | 0.91 | 11% | 3% | 13% |
| Los Angeles-Long Beach-Anaheim | 9 | 1.36 | 0.53 | 7% | 2% | 18% |
| Riverside-San Bernardino-Ontario | 9 | 1.22 | 0.75 | 12% | 5% | 39% |
| San Diego-Carlsbad | 0 | NA | NA | NA | NA | NA |
| San Francisco-Oakland-Hayward | 1 | 1.00 | 0.85 | 9% | 8% | 36% |
| Seattle-Tacoma-Bellevue | 13 | 1.10 | 0.87 | 11% | 7% | 13% |
| WEST (average) | 6 | 1.17 | 0.75 | 10% | 5% | 26% |
| Atlanta-Sandy Springs-Roswell | 8 | 1.38 | 0.61 | 10% | 16% | 12% |
| Dallas-Fort Worth-Arlington | 14 | 1.23 | 0.95 | 7% | 4% | 13% |
| Houston-The Woodlands-Sugar Land | 5 | 1.20 | 0.68 | 3% | 3% | 11% |
| Miami-Ft. Lauderdale-W. Palm Beach | 14 | 1.67 | 0.62 | 13% | 21% | 44% |
| Tampa-St. Petersburg-Clearwater | 0 | NA | NA | NA | NA | NA |
| SOUTH (average) | 8 | 1.37 | 0.72 | 8% | 11% | 20% |
| SUNBELT (average) | 5 | 1.28 | 0.73 | 9% | 10% | 21% |
| FROSTBELT (average) | 5 | 1.16 | 0.85 | 7% | 2% | 8% |
Acknowledgements
For very helpful comments, we thank Rolf Pendall, Keith Ray, Jessica Schirmer, Todd Swanstrom, and two anonymous reviewers. We thank Susan Moffitt and participants at the Anton-Lippitt Conference on Citizenship and the City at the Watson Institute, Brown University, for additional feedback. We gratefully acknowledge the support of the MacArthur Foundation Research Network on Building Resilient Regions. Invaluable research assistance was provided by Will Gomberg and April Yee. Views presented in this work are not necessarily those of the Federal Reserve Bank of San Francisco or of the Federal Reserve System.
Declaration of Conflicting Interests
The author(s) declared no potential conflicts of interest with respect to the research, authorship, and/or publication of this article.
Funding
The author(s) disclosed receipt of the following financial support for the research, authorship, and/or publication of this article: The authors thank the MacArthur Foundation for research funding provided through the Research Network on Building Resilient Regions.