



Abstract
Urban scholars have devoted significant attention to the “cultural city,” but less attention has been paid to how different forms of culture relate to each other and to the larger urban environment. In this article, we compare two quintessential forms of culture-led urbanization that represent opposite ends on a spectrum: iconic architecture and neo-bohemia. While iconic architecture is a “top-down” approach to culture involving large budgets, elite “starchitects,” and powerful clients, neo-bohemia tends to be a “bottom-up” phenomenon formed as individual artists gravitate toward particular neighborhoods, establishing arts scenes. Using a combination of neighborhood case studies and national-level quantitative analysis, we investigate the ecological relationship between these two phenomena. In doing so, we provide new insights into the geographic and social structure of the cultural city.
The Cultural City
The “cultural city” refers to a city that is economically, socially, and/or politically oriented around the production and consumption of artistic products and experiences. Whereas most large cities have historically been home to arts and cultural institutions (Evans 2001), scholars have argued that culture plays an even more important role in the postindustrialized era (Clark 2004; Florida 2002; Lloyd 2006). Reflecting this importance, cities around the world have embraced “culture-led” development projects (Miles and Paddison 2005) from flagship cultural institutions (Patterson 2012), to arts districts (Mommaas 2004), to music festivals (Wynn 2015).
Research on creative cities has tended to approach the topic primarily as a political-economic phenomenon, focusing on issues such as the effectiveness of culture-led development in generating economic growth (e.g., Evans 2005; Markusen and Schrock 2006; Plaza 2006), the role of the arts in driving gentrification and the displacement of the poor (Grodach, Foster, and Murdoch 2014; Peck 2005; Zukin 2008), and the rise of culture-led planning policies (Grodach 2013). While important, these issues have tended to overshadow the characteristic that makes culture-led developments “cultural” in the first place: They serve as symbols that communicate meanings about place and identity. Growing evidence suggests, however, that cultural meanings have a significant impact on both the political (McGovern 2009; Miller and Silver 2015; Patterson 2016) and economic (Silver and Clark 2016; Silver and Miller 2013) characteristics of cities and neighborhoods. Thus, it is not only important that the cultural sector as a whole has gained prominence within urbanization; it is also important to account for particular types of culture-led development, the variable meanings they express, and the implications of those meanings for life in the city.
With this concern in mind, this article seeks to develop a better understanding of the multiple ways in which the cultural city manifests itself within the urban landscape and the implications of these differences. Toward this end, we adopt a multi-method approach to compare two of the most prominent manifestations of the cultural city: iconic architecture and neo-bohemia. Iconic architecture refers to eye-catching buildings designed by elite, world-renowned architects (“starchitects”) that are intended to serve as “hard brands” for the cities in which they are built (Evans 2003). Typically developed by large, powerful organizations, iconic architecture represents a “top-down” approach to cultural development (Kaika and Thielen 2006; Sklair 2017). Neo-bohemia, by contrast, is a “bottom-up” phenomenon in which individual artists migrate en masse into particular neighborhoods, establishing multifaceted arts scenes often associated with hip counterculture (Halasz 2015; Lloyd 2006). While some neo-bohemias may involve central planning, most do not and in some cases, begin in violation of existing laws and regulations (e.g., Catungal, Leslie, and Hii 2009, p. 1099; Zukin 2010, p. 42).
Representing extreme ends on a spectrum, the differences between iconic architecture and neo-bohemia highlight the complexity of the cultural city and raise important empirical questions. How do top-down, flagship cultural projects relate to the more diffuse, bottom-up establishment of neo-bohemias? How do both manifestations of the cultural city relate to other elements of the urban landscape? In response to these questions, we propose three possible hypotheses:
Conformity: Iconic architecture and neo-bohemias are two manifestations of the same basic phenomenon. They will be found in the same culture-oriented neighborhoods and positively correlate to the same elements of the urban landscape.
Contradiction: Iconic architecture and neo-bohemias are mutually exclusive manifestations of the cultural city and will be found in different places and correlate to different elements of the urban landscape.
Correlative: Iconic architecture and neo-bohemias are distinct but correlated phenomena. They will be found in the same metro areas, but not within the same neighborhoods. While they may positively correlate with some of the same aspects of the urban landscape, they will also have distinct differences, particularly at the neighborhood level.
The conformity hypothesis is implicitly assumed by research that does not distinguish between different forms of culture-led urbanization. Meanwhile, as will be discussed, the respective literatures on iconic architecture and neo-bohemia suggest a contradictory relationship.
Through a combination of qualitative and quantitative analysis, this article ultimately finds the most support for the third hypothesis: correlation. The analysis begins with a comparative case study of Minneapolis and Chicago, two cities that are home to several iconic buildings and neo-bohemian neighborhoods. Through these case studies, we reveal that while iconic architecture and neo-bohemias tend to locate in different areas of the cities, the two are correlated and share a complementary relationship in an ecological sense (though not necessarily a social or political sense). Iconic architecture tends to occupy central places attached to major institutions, such as central business districts and university campuses, whereas neo-bohemias tend to form on the edges of the core allowing residents to commute via alternative modes of transportation such as public transit and cycling. We then expand these findings using national-level data, demonstrating that this correlation can be observed across the United States.
In addition to furthering our understanding of two quintessential forms of culture-led development, this article makes a broader contribution by developing an ecological analysis of the cultural city. Following the Chicago School, we situate different types of cultural practices within larger human-ecological structures, demonstrating how they relate to each other and to the other social and economic practices found within different areas of the city, ranging from retail amenities, to commuting practices, to the demographic and socioeconomic characteristics of residents. We argue that this perspective helps to build on the existing political-economic accounts of the cultural city by taking into account the cultural city’s internal structure and the interrelationships that exist between seemingly unrelated or contradictory cultural forms. To conclude, we discuss how this perspective might be expanded to confirm and clarify the findings of this article, and tackle new questions such as the relationship between cultural development, gentrification, and displacement.
Iconic Architecture
An icon is an object with a striking and recognizable visual form that articulates powerful cultural meanings (Solaroli 2015, p. 1). From Roman triumphal arches to modern skyscrapers, urbanization has often been closely linked with the creation of iconic architectural structures. Despite this long history, however, the forces of globalization, mass media, and the rise of the symbolic economy have elevated the place of the architectural icon to new heights figuratively and, in the case of the “supertall” skyscraper, literally (Evans 2003; Sklair 2017).
In recent decades, an industry devoted to the production of iconic buildings has emerged, centered on a small number of charismatic “starchitects” such as Rem Koolhaas, Zaha Hadid, and Frank Gehry (McNeill 2009). These figures, like the buildings they design, have become internationally recognizable, appearing on magazine covers and in television documentaries, for example. While not every building they design becomes iconic, hiring a starchitect is one of the clearest signs of the developer’s intention to achieve iconic status. As such, the most common clients of these firms are public cultural institutions, including art museums, universities, and libraries—that is, organizations that have a direct interest in placing themselves at the center of public life within cities (Patterson 2012). However, the audiences for these projects are not just locals. The popularity of iconic architecture has been supported by the idea that these projects lead to economic growth by attracting international tourists and investment—a phenomenon often referred to as the “Bilbao effect” after the Gehry-designed Guggenheim Museum became credited with transforming postindustrial Bilbao into an international, cultural hotspot.
Critics charge that iconic architecture represents the interests and tastes of global elites above local communities and local cultural expression (e.g., Kaika and Thielen 2006; Sklair 2017). Ho (2006, p. 97), for example, cautioned that iconic projects, designed by elite global firms and aimed at an international audience, may have little resonance with local residents . . . Participation in such transnational spaces may yield economic rewards for some, but as single-minded spaces, [iconic projects] lack the intimacy, diversity as well as the regularity of interaction to reproduce a set of social and civic relations that underpin community.
Similarly, Patterson (2016) demonstrated that the developers of two iconic projects in Toronto exhibited a more cosmopolitan sense of place than local residents, which led to conflict over how the projects should be designed in relation to their surrounding context.
Critics have also pointed to a lack of physical integration between iconic projects and their local surroundings. Urbanists such as those at the Project for Public Spaces (PPS) have accused starchitects of placing grand aesthetic gestures aimed at the global tourist market ahead of integrating with the surrounding neighborhood, respecting local architectural heritage, and creating walkable, pedestrian-friendly environments (Speck 2012, pp. 244–45).
Neo-bohemia
Like iconic architecture, bohemian neighborhoods are characterized, in part, by their ability to convey powerful cultural meanings. Indeed, neighborhoods such as Montmartre, Greenwich Village, or Haight-Ashbury have greatly influenced the identities of their respective cities. However, in contrast to the elitism associated with iconic architecture, bohemia’s traditional image is one of political, social, and economic marginality, and a devotion to cultural authenticity defined in opposition to bourgeois society (Bourdieu 1996; Halasz 2015; Lloyd 2006). As noted by Wilson (2000, p. 28), bohemia emerged in the nineteenth century as young people seeking to “escape” from traditional responsibilities associated with family and work saw “beauty in the sublime desolation and ugliness of the industrial city.” In doing so, Bohemians embraced cultural expressions that were suppressed among the bourgeois.
Whereas iconic architecture is associated with elite global architectural firms, large and wealthy clients, and flagship cultural amenities, bohemian neighborhoods are typically understood as places where cultural industries and practices develop more organically as individual artists appropriate and thrive within areas of the city that have particular ecological and cultural characteristics (Lloyd 2006; Moss 2017; Moss, Wildfeuer, and McIntosh 2019). For example, Jane Jacobs’s ([1961] 1992, p. 188) famous phrase “new ideas must use old buildings” indicated the importance of the existing built environment in nurturing human creativity as opposed to designing new, purpose-built architecture. Decades earlier, Ernest Burgess (1925, p. 56) expressed a similar view, pointing to the important function that inner-city industrial districts played as spaces of “regeneration” where artists, immigrants, and political radicals, “all obsessed with the vision of a new and better world,” generated new ideas and new forms of cultural expression. More recent studies have supported these views, demonstrating the strong association between the emergence of artistic clusters and social diversity (Deener 2012; Graif 2018).
This relationship works the other way around as well. Jeong (2019) demonstrates that cultural amenities and bohemian cultural characteristics encourage nondriving commuting choices among residents. Thus, there is evidence that Jacobsian urbanity and bohemianism form a mutually supportive relationship.
Despite bohemia’s traditional association with economic marginality, concentrations of artists and arts establishments are immensely important to the modern symbolic economy (Florida 2002; Lloyd 2006; Markusen and Schrock 2006; Silver and Clark 2016). Like iconic architecture, therefore, contemporary bohemias—or “neo-bohemias” (Lloyd 2006)—are distinct in that they are increasingly seen through the lens of “culture-led” development. David Brooks’s (2000) Bobos in Paradise, Richard Florida’s (2002) Rise of Creative Class, and Richard Lloyd’s (2006) Neo-Bohemia have all identified a twenty-first-century synthesis between the traditionally opposed bourgeois and bohemian sensibilities (hence, Brooks’s term “bobo,” referring to someone who merges a bourgeois-capitalist orientation with bohemian countercultural values of tolerance, creativity, and authenticity). 1
For Florida (2002, p. 15), artists and bohemians are now part of a larger “creative class” that dominates the symbolic economy as the main source of new ideas and innovation that drives economic growth. Like Brooks’s “bobos,” Florida’s creative class shares traditional bohemian values and is attracted to “communities [that] provide the stimulation, diversity and a richness of experiences that are the wellsprings of creativity” (also see Graif 2018; Moss 2017). Thus, the creative class tends to locate in places with particular types of urban amenities, including cafés, galleries, vibrant public spaces, and walkable neighborhoods, as well as places characterized by tolerant, progressive attitudes, particularly toward gays and lesbians. As creative class members move to these kinds of places, they produce the kind of innovation that drives economic growth. Indeed, Florida’s analysis suggests that cities with these characteristics demonstrate strong economic vitality—though this finding is not without critiques both methodological (Clark 2004; Markusen 2006) and political (Peck 2005). For Florida, therefore, culture-led urbanization occurs not through mega-projects but rather, through the combining of more diffuse cultural elements that create an environment that attracts creative people and facilitates innovation.
Conformity, Contradiction, or Correlation?
Thus, much of the literature on iconic architecture and neo-bohemias suggest support for the contradiction hypothesis: While both forms of urban development are “cultural,” they convey opposite cultural meanings. In addition, the literature also suggests that iconic architecture and neo-bohemia relate to the larger urban landscape in very different ways. In terms of transportation, iconic architecture is seen as antipedestrian, whereas neo-bohemias have been shown to relate positively with alternative modes of transportation. Economically and demographically, iconic architecture is associated with wealth and power, while neo-bohemias are associated with economic and social marginality as well as demographic diversity. To what extent do these seemingly contradictory differences hold up to systematic, comparative analysis? To answer this question, we turn now to the methodology approach used in this article.
Methodology
Measuring Iconic Architecture
Because we are interested in iconic architecture as a purposeful “culture-led” development strategy, our focus is on buildings specifically designed to be iconic, independent of whether or not they achieve that status. One of the clearest signs of this intention is the hiring of an elite “starchitect.” Our data on iconic architecture, therefore, come from the portfolios listed on the official websites of firms that we consider “starchitects.”
While “starchitect” is a vague and normative concept, we operationalize it as a combination of four dimensions: (1) consecration, as indicated by prestigious architectural awards; (2) an aesthetic orientation toward avant-garde and postmodern designs; (3) global reach, indicated by commissions in multiple countries and continents; and (4) charisma, indicated by a personal presence in mainstream media. Guided by these indicators, we established a list of architects/firms from award winners, the names of architects that appeared most frequently in Factiva database searches for the terms “starchitect” and “starchitecture,” and our own background knowledge of the architectural field. Each architect was then evaluated against the four criteria. As there is no clear line that distinguishes starchitects from regular architects, we began by selecting those architects that most closely reflected the term (e.g., Frank Gehry), and gradually expanded our selection until we reached architects that, in our view, no longer fit. 2 In the end, we included twenty-nine architects/firms who had a combined 305 completed projects in the United States (see Table 1). We excluded any projects that were not constructed by the time of data collection (May 2017). We also excluded certain types of projects: single-family homes, interior designs, master plans, and design concepts. The types of buildings we did include were cultural buildings such as museums (N = 110), educational buildings (N = 77), residential towers (N = 25), office buildings (N = 21), civic buildings such as courthouses or government offices (N = 20), hotels and retail buildings (N = 13), infrastructure and transportation buildings including bridges and airports (N = 11), health care facilities (N = 10), public spaces, parks, and public sculptures (N = 9), and other buildings including sports stadiums and industrial factories (N = 9).
Architects and Firms Included in Data.

Architects were included in a more restrictive measure of starchitect used to test the robustness of our data.
While seventy-nine U.S. metropolitan areas had at least one iconic building, the buildings were concentrated in only a few cities and almost one-third were located in either New York City or Los Angeles. As Figure 1 demonstrates, the top fifteen metros all contained at least five pieces of iconic architecture.
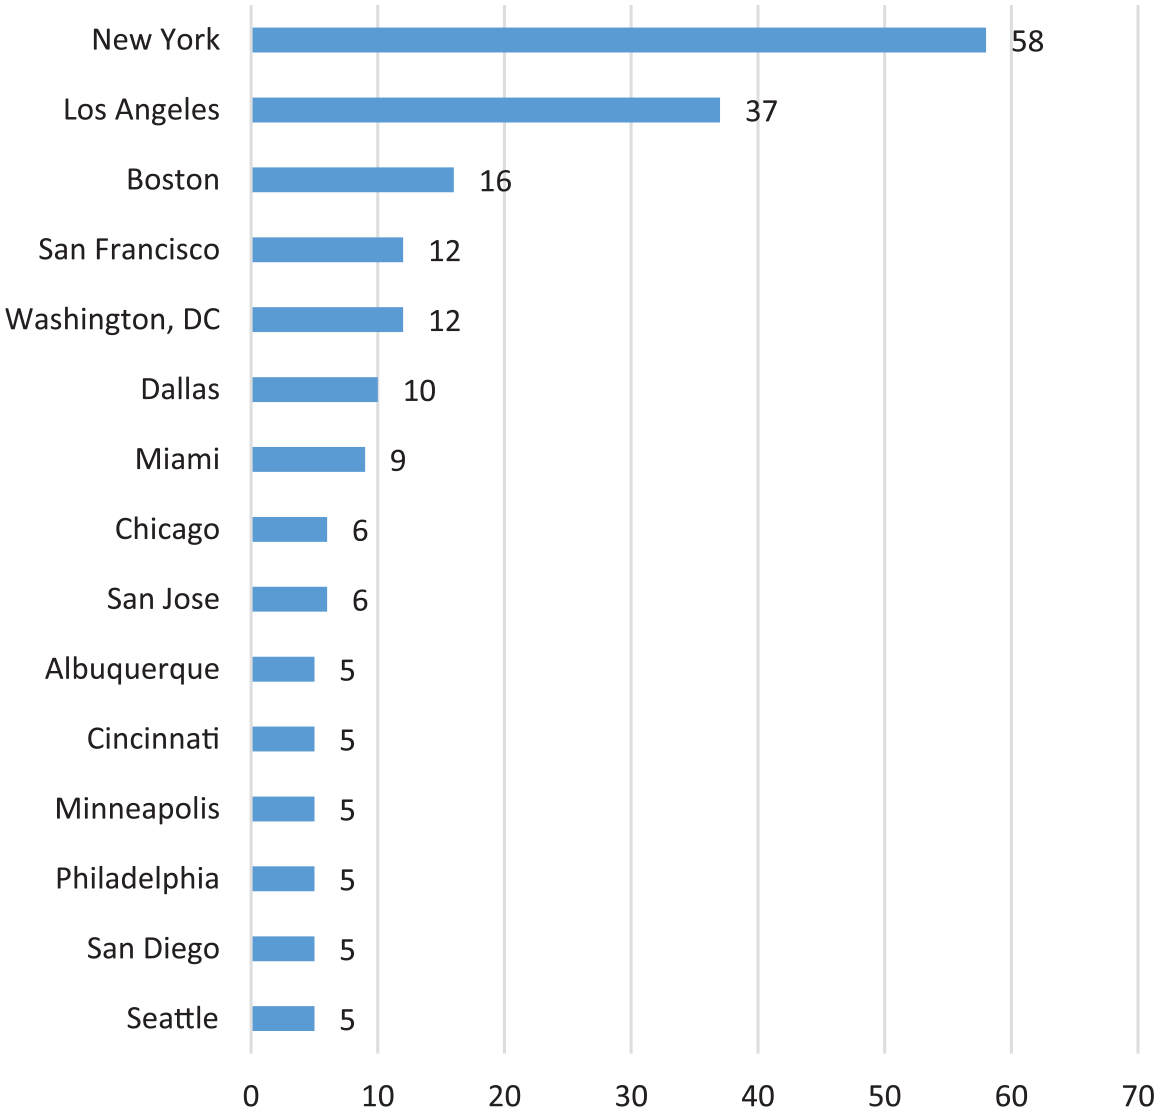
Top fifteen metros by number of iconic projects.
In addition, there are 227 zip codes across the United States that have at least one piece of iconic architecture. Interestingly, the most iconic buildings are found within America’s most iconic zip code: 90210. Here, we find two Richard Meier-designed museums, an office building, also designed by Meier, and retail stores by Rem Koolhaas and Thom Mayne. As seen in Table 2, six of the top fifteen zip codes were located in the lower half of Manhattan, and four more correspond roughly to university campuses. These zip codes point to a larger observation: The two main places where iconic buildings tend to be located are on university campuses and in city centers.
Zip Codes with Three or More Iconic Structures.

Note. SOMA = South of Market; MIT = Massachusetts Institute of Technology.
Measuring Neo-bohemia as a “Scene”
Because neo-bohemia refers to a particular “ethos,” it is a tricky concept to quantify. To accomplish this task, we turn to the “scenes” approach developed by Silver and Clark (2016), which conceptualizes the “scene” or “ethos” of a particular neighborhood according to three major dimensions: (1) legitimacy, referring to a sense of moral order operating within the neighborhood; (2) theatricality, the dominant forms of performance and self-display; and (3) authenticity, the sense of identity that is affirmed. These dimensions are further divided into fifteen subdimensions (see Table 3). Silver and Clark argue that these dimensions are embodied in the types of consumer amenities located in particular places. A list of amenities was accessed by downloading the 2007 online Yellow Pages and scoring each amenity along the fifteen scenes subdimensions. For example, tattoo parlors were scored high on transgression and low on formality. Opera houses were scored the opposite way. Meanwhile, fast-food restaurants are scored high on both corporate (due to their emphasis on branding) and utilitarianism (because of the assembly line–like manor in which food is delivered) (pp. 100-101).
Ideal-Typical Bohemian Scene.

Source. Adapted from Table 2.3 in Silver and Clark (2016, p. 63).
In tallying the scores along each subdimension for all of the amenities within a given zip code, Silver and Clark created aggregate scores that represent the type of “scene” present within a neighborhood. See Silver and Clark (2016) for more details on the creation of these data and approach.
Within this approach, Silver and Clark (2016) developed a “bliss point” measurement of bohemianism (p. 35). This method begins by assigning scores to an ideal-typical bohemian scene (see Table 3). In this ideal-typical scene, self-expression and transgression are dominant (scores of 5), while utilitarianism and corporatism are absent (scores of 1). The bohemian “bliss score” is then calculated as the reciprocal value of the sum total of differences between a zip code’s actual score and the ideal-typical bohemian score across all fifteen subdimensions. Thus, the higher the score, the more bohemian the zip code. In this article, we use a standardized bohemian score, because we are more interested in how zip codes compare with each other rather than the ideal-typical score. The specific amenities that correlate most strongly with the bohemian score include cafés, nightclubs, used bookstores, tattoo parlors, and art galleries. Thus, a high bohemian score indicates a zip code that contains many of these amenities.
Because it is based on clusters of individual amenities, this approach is particularly appropriate for a “bottom-up” conception of bohemia. In other words, we are measuring bohemia as the emergent effect of multiple firms clustering within a particular neighborhood, as opposed to “top-down” classifications of “cultural districts” that are imposed by governments or other authorities (e.g., Breznitz and Noonan 2014).
The zip code with the highest bohemian score is 95064, which corresponds to the campus of University of California (UC), Santa Cruz and happens to contain one of the iconic buildings in our dataset. 3 Among major cities (approximated here as counties with populations more than 500,000), the highest bohemian scores are observed in Manhattan (2.21), San Francisco (1.90), Philadelphia (1.89), Honolulu (1.85), and Los Angeles (1.71)—suggesting a clear city-level affinity between neo-bohemia and iconic architecture (see Figure 1). Finally, the amenities that correlate highest with bohemia at the national level include nightclubs (0.174), book dealers (0.166), bakeries (0.161), coffeehouses (0.156), and tattoo parlors (0.156), though these correlations vary between cities.
Additional Urban Variables
As mentioned above, the existing literature suggest that iconic architecture and neo-bohemias differ in terms of culture, transportation, economy, and demography. To test the relationship between both forms of culture-led development, we test them independently against measures of these four dimensions of the urban landscape. We operationalize culture using the scenes dimensions discussed above. Doing so allows us to compare scene scores for zip codes containing iconic architecture with the ideal-typical bohemian scene. If zip codes with iconic architecture differ from neo-bohemias, the scene dimensions will allow us to understand how they differ culturally (along which subdimensions). In addition to scenes, we are also interested in how these two culture-led developments relate to cultural industries specifically. Therefore, we add two variables that capture the extent to which cultural industries are present in the zip code: (1) total number of arts establishments (a combination of thirty-seven arts-related business categories from the U.S. Business Patterns Survey), and (2) the percentage of residents whose occupations are classified as “arts, design, entertainment, sports, and media” using the 2011 U.S. Census.
As mentioned, alternative transportation has been shown to relate to bohemianism (Jeong 2019). By contrast, iconic architecture has been criticized for being physically disconnected from its surroundings and as a result, creating streetscapes that are alienating and unfriendly to pedestrians (Speck 2012). By incorporating transportation into our analysis, we are able to investigate these potential differences and more generally, uncover how inhabitants move through and interact with the urban landscape within neo-bohemias and around iconic architecture. We operationalize transportation as the proportion of residents within a zip code who (1) walk to work, (2) cycle to work, and (3) take transit to work. As well, because commuting choices may not necessarily reflect the walkability of the neighborhood itself, we also include (4) “Walk Scores” from the website Walkscore.com. These scores are based on local factors such as block size and the number and diversity of destinations within walking distance.
Our economic indicators include (1) median household income, (2) median rent, (3) employment rate, and (4) retail density. Finally, we include demographic indicators that include (1) population, (2) the percentage of residents who are not White, 4 and (3) the proportion of residents with a bachelor’s degree or higher. Our data come from the 2008–2012 American Community Survey (ACS) with the exception of arts amenities and retail density, which come from the 2008–2012 Business Patterns Survey.
Method of Analysis
To understand the relationship between iconic architecture, neo-bohemias, and the larger urban landscape, we adopt a combination of qualitative and quantitative methods. Our initial findings suggest that neo-bohemias and iconic architecture tend to be located in the same metro areas. Thus, we begin with a comparative case study of Chicago and Minneapolis, two Midwestern cities that contain both forms of culture-led urbanization. Through this case study, we present a descriptive, holistic picture of how iconic architecture and neo-bohemias relate to each other and the urban landscape as a whole in these cities. As will be seen, while the two cities have many differences, they both conform to the correlation hypothesis.
To test the generalizability of the Chicago and Minneapolis cases, we then expand our analysis to the national level using two regression models that test the relationships of iconic architecture and neo-bohemia, respectively, to the urban variables discussed above.
Case Study #1: Millennium Park and Wicker Park, Chicago
Chicago and Minneapolis share important features and have significant differences. First, both cities are home to several pieces of iconic architecture and neo-bohemias. Unlike New York and Los Angeles, which are saturated with dozens of iconic buildings, Chicago and Minneapolis have distinct clusters that make them easier to identify and distinguish from other types of neighborhoods. For each city, we examine two neighborhoods: one characterized by iconic architecture (Millennium Park and University), and another that constitutes a neo-bohemia (Wicker Park and Uptown).
In terms of their differences, Chicago is a global city with millions of residents and a major center for cultural industries. It also has a long history of iconic buildings designed by famous architects. Minneapolis, by contrast, is a midsized city. While it has a thriving cultural sector, it does not have the global profile of Chicago or the architectural renown. The two cities are also distinguished by the types of iconic architecture they contain. Chicago’s Millennium Park attracts millions of tourists annually and is centrally located in the downtown core. The University district in Minneapolis, by contrast, is a more insular college campus located on the edges of the core that caters to students and academics. By comparing different kinds of iconic districts, we are able to bring the characteristics that distinguish them from neo-bohemian neighborhoods into starker relief.
Using a combination of direct field observations and statistical data, we analyze these neighborhoods in terms of their urban form and through the dimensions of culture, transportation, economy, and demography. As a point of reference, Table 4 provides basic statistical information for Chicago, Minneapolis, the zip codes that most closely approximate the four neighborhoods in our case study, and the average U.S. zip code.
Descriptive Statistics for the Zip Codes Best Approximating Millennium Park, Wicker Park, University, and Uptown.

Note. ACS = American Community Survey.
Due to insufficient 2010 ACS data, University’s demographic data come from the 2000 U.S. Census.
Chicago data excluded O’Hare Airport (zip code 60666) and Midway Airport (zip code 60638).
Represents the average walk score for all scored zip codes in the United States.
We turn first to Chicago, the third most populous city in the United States with more than 2.7 million residents. Chicago also has a long and well-established reputation as a cultural city, particularly as the cradle of several influential aesthetic movements from music (including blues, jazz, house, and alternative rock) to architecture. In addition, the city’s large museums, thriving theater district, architectural landmarks, and commercial high streets make it a significant tourist destination. In 2016, Chicago attracted a record fifty-four million domestic and international visitors (Samples 2017).
Illustrating the cultural geography of the city, Figure 2 maps all of Chicago’s zip codes 5 by their bohemian score and indicates the location of each of the iconic projects in our dataset. The most bohemian neighborhoods, including Wicker Park, tend to cluster in the northern half of the city, and (mostly) along the lakefront. Iconic architecture, by contrast, is located in three distinct clusters in the southern half of the city where bohemian scores tend to be lower: the “Loop” (i.e., Chicago’s downtown core), and the campuses of the Illinois Institute of Technology and University of Chicago. As the economic center of Chicago, the Loop contains both iconic architecture (in the northern half) and high bohemian scores (in the southern half). The Art Institute of Chicago is the only piece of iconic architecture that is in a zip code with a bohemian score above 0.067. Thus, iconic architecture and bohemia tend to be relatively distinct. For a better understanding of why that is, we turn now to our analysis of Millennium Park.

Standardized bohemian scores for Chicago zip codes with the locations of iconic architecture.
Millennium Park
Millennium Park is located in the northeast corner of the Loop and, with 4.75 million annual visitors, is one of the biggest tourist attractions in Chicago (Kamin 2014). Built over a railyard and opened to the public in 2004, it is also the newest and most prominent section of the older and larger “Grant Park” (Gilfoyle 2006). One of the most distinct features of Millennium Park is its collection of iconic buildings and sculptures, including those that house flagship cultural venues such as the Jay Pritzker Pavilion and the Art Institute of Chicago.
Designed by Frank Gehry and completed in 2004, The Jay Pritzker Pavilion (Figure 3) is a highly distinctive sculptural bandstand that serves as a centerpiece for the park. It is clad in undulating stainless-steel panels and features a structure of crisscrossing steel pipes that stretch out over the pavilion’s seating areas. In addition to its architectural form, the pavilion is notable for its role as an outdoor concert venue that hosts a variety of free musical and cultural events including the Grant Park Symphony Orchestra, the Grant Park Music Festival, and film screenings.

Pritzker Pavilion and Great Lawn and BP Bridge
Next to the pavilion is another Gehry-designed structure (Figure 3). The BP Bridge is a 960-foot-long pedestrian overpass with a distinct snaking form that is clad in stainless steel shingles that match the pavilion. Elevated over Columbus Drive, the bridge connects the pavilion with Maggie Daley Park and the lakefront to the east.
To the immediate south, we find the Art Institute of Chicago (Figure 4). Originally built in 1892, the institute was expanded in 2009 by the Italian starchitect Renzo Piano. Piano’s “Modern Wing” added 25,000 square meters to the institute, making it the second largest museum in the United States. His design includes a raised canopy roof (nicknamed the “flying carpet”) and is oriented toward Millennium Park both internally and externally. Internally, the windows provide a direct view of the park, which becomes a dramatic backdrop for many of the galleries, and an innovative lighting system adjusts the internal electric lights to the external natural light, ensuring a clear view to the outside while saving energy.

The Modern Wing at the Art Institute of Chicago.
Externally, the transparent, lightweight materials used in the façade mimic the skyscrapers that surround the park. Meanwhile, a new north entrance and elevated pedestrian bridge create seamless movement between the museum and the park. The “Nicols Bridgeway” is a 620-meter-long bridge that connects the upper floor of the museum to the south end of the Pritzker Pavilion (Figure 4). The bridge functions as a public observatory that provides views of the park and its surroundings.
As evidenced by the reorientation of the institute, Millennium Park has shifted the social and economic center of gravity in the Loop. This reorientation can also be seen in how the Loop has developed over the last decade with a boom in residential and hotel development and an increase in tourist-focused amenities. An economic impact study commissioned by the City of Chicago found that buildings located in proximity to the park generated more than $10 million more in annual taxes and $24 million more in sales taxes after the park opened (Goodman Williams Group and URS Corporation 2005).
Changes to the area are also evident along Michigan Avenue (Figure 5), which forms the western border of Millennium Park and is considered Chicago’s premier commercial street. In this section of Michigan Avenue, one of its oldest, we find a collection of nineteenth- and twentieth-century skyscrapers housing residential and commercial uses and major cultural institutions such as the Chicago Cultural Center and the Auditorium Theater. At street level, however, brand-name franchises such as Starbucks and Walgreens dominate. While catering to the many tourists, many view the chains as a threat to the vibrancy of the park. Indeed, the Millennium Park Foundation, a nonprofit organization that runs the park in partnership with the city, is currently seeking to create more diverse, nonchain food options for visitors (Kamin 2014).

Michigan Avenue, architecture and retail.
Just as Millennium Park has influenced its surroundings, so, too, is it influenced by the “scene” within which it is situated. To get a better sense of this scene, Figure 6 plots several cultural and bohemian amenities in the area, including art galleries, performing art venues, art schools, and cafés. Note that, despite Millennium Park’s dominance as a tourist destination, other cultural amenities are scattered throughout the Loop rather than specifically around the park. As a result, while the Loop is home to many cultural and bohemian amenities, they are diffused among other types of amenities (including many chains). Thus, the Loop is not experienced as a bohemian “scene” on a subjective level. To understand the significance of this layout, we turn now to a neighborhood that is well known for its bohemian scene: Wicker Park.

Select amenities in Millennium Park area.
Wicker Park
Wicker Park is home to about 26,000 residents and emerged in the 1980s as an enclave for artists and a destination for entertainment and food (Lloyd 2006). Located to the northwest of the Loop, the neighborhood is centered on the intersection of North, Damen, and Milwaukee Avenues. At the center of this intersection is Damen station (Figure 8), a stop on the “Blue Line” in Chicago’s “L” (as in elevated) train system. As Figure 7 illustrates, bohemian amenities such as cafés are concentrated around Damen station, giving the area a distinct bohemian feel that contrasts with the more diffused amenities in the Loop. Many of these amenities cater to the daily needs of the community rather than tourists (Talen and Jeong 2019).

Select amenities in Wicker Park.
The location of Wicker Park along the Blue line is key to its growth as an artistic enclave as this line connects the neighborhood directly to the School of the Art Institute and Columbia College in the South Loop (Lloyd 2006). Students from these schools were instrumental in the early formation of Wicker Park’s art scene. In addition, artists were attracted by the area’s low rent and proximity to several abandoned factories. Thus, Wicker Park allowed artists to maximize locational merit in terms of time and budget, accessing important amenities without paying the associated rents. Today, even as rents have increased, access to public transit continues to be a defining characteristic of the neighborhood, and it has among the highest transit use in the city.
Wicker Park also has high rates of cycling (7.1%), supported by several bike-friendly cafés, bars, and restaurants that cater to cyclists (Figure 8), but rates of pedestrian commuting are much lower than the city average (6.4% vs. 12.2%). Given the high rates of transit use and cycling, and the pedestrian-friendly environment (with Walk Score of 95), the low rate of pedestrian commuting suggests that most people in Wicker Park work outside the neighborhood. By contrast, Millennium Park has extremely high rates of walking (almost 50%), but lower rates of transit use and cycling. These differences likely reflect Millennium Park’s location within the Loop, a major employment center.

Damen Blue line station and cycling on Milwaukee Avenue, Wicker Park.
While not an employment center, Wicker Park is a consumer destination. Beginning in the 1990s, visitors from around the city have been attracted to the area’s bars, shops, and galleries, which are characterized by an eclectic and edgy aesthetic, featuring murals on exterior walls and vintage, unpolished interiors (Figure 9). Reflecting Jacobs’s statement about new ideas in old buildings, these establishments became incubators for local musicians, poets, and artists who often resided in the apartments and lofts above. The mix of artistic production and consumption, and residential and commercial uses produced a unique scene that became incredibly important to the growing cultural economy of Chicago (Lloyd 2006). Even as the neighborhood has gentrified and the artists themselves have migrated to surrounding neighborhoods (Douglas 2012), Wicker Park still preserves its distinct neo-bohemian character, which combines art and business.

Cafés and shops in Wicker Park.
Comparing Millennium Park and Wicker Park reveals important similarities and differences. Both neighborhoods are characterized by dense urban living, alternative modes of transportation, and a variety of cultural amenities. In Millennium Park, however, these amenities are diffused within the density of the downtown “Loop” and do not act as the center of the neighborhood as they do in Wicker Park. Instead, Millennium Park is centered on large, flagship cultural institutions, which are themselves surrounded by corporate chains and high-end hotels that contrast markedly with the independent and eclectic shops of Wicker Park.
Case Study #2: University and Uptown, Minneapolis
While not as large or dense as Chicago, Minneapolis has a thriving cultural scene dating back to the mid-nineteenth century, particularly in terms of music and the performing arts. Today, the city has one of the highest number of live theaters per capita of major U.S. cities and 2.3% of the city’s labor force are employed as artists, designers, or entertainers (compared with 1.8% in Chicago). The city is also home to several iconic cultural institutions, including the Weisman Art Museum by Gehry, the Walker Art Center by Herzog & de Meuron, and the Guthrie Theater by Jean Nouvel.
Figure 10 reveals some similarities between Minneapolis and Chicago, including an axis of bohemian neighborhoods extending outward from the city center (in this case, to the southwest). Also like Chicago, iconic architecture clusters within the city center and on a university campus (the University of Minnesota). The Walker Art Center (the star to the farthest left in Figure 10) represents a minor exception. It is located within the bohemian axis on the outskirts of the downtown core and not on a university campus. The Walker Art Center is, however, located within a network of parks that includes the Minneapolis Sculpture Garden and Loring Park, the location of a major arts festival. Thus, there are clear similarities between the location of the Walker Art Center and Chicago’s Art Institute in Millennium Park.

Standardized bohemian scores for Minneapolis zip codes with the locations of iconic architecture.
University
University, the neighborhood in Minneapolis with the largest cluster of iconic buildings, contains the “East Bank” campus of the University of Minnesota, the largest in the University of Minnesota network. This neighborhood is located on the Mississippi River across from Minneapolis’s downtown core to which it is connected through the Washington Avenue Bridge and the Metro Light Rail Transit (LRT) “Green Line.” Despite its position on the Green Line, public-transit usage in University is actually below the city average. At 50%, however, walking rates are the highest of our cases, suggesting that most residents of the neighborhood work or attend school in the immediate area. In this sense, University and Millennium Park demonstrate similar commuter trends. However, University’s Walk Score of 74—only slightly above the city average—suggests that the area is not highly walkable for purposes other than getting to school or work.
The low Walk Score is likely a product of the low number of amenities within the area. As seen in Figure 11, there are few cultural or bohemian amenities within University and those that exist are distributed across the entire neighborhood, often located within larger academic buildings. Thus, this is not a cultural cluster or center of consumption like either Wicker Park or Millennium Park.
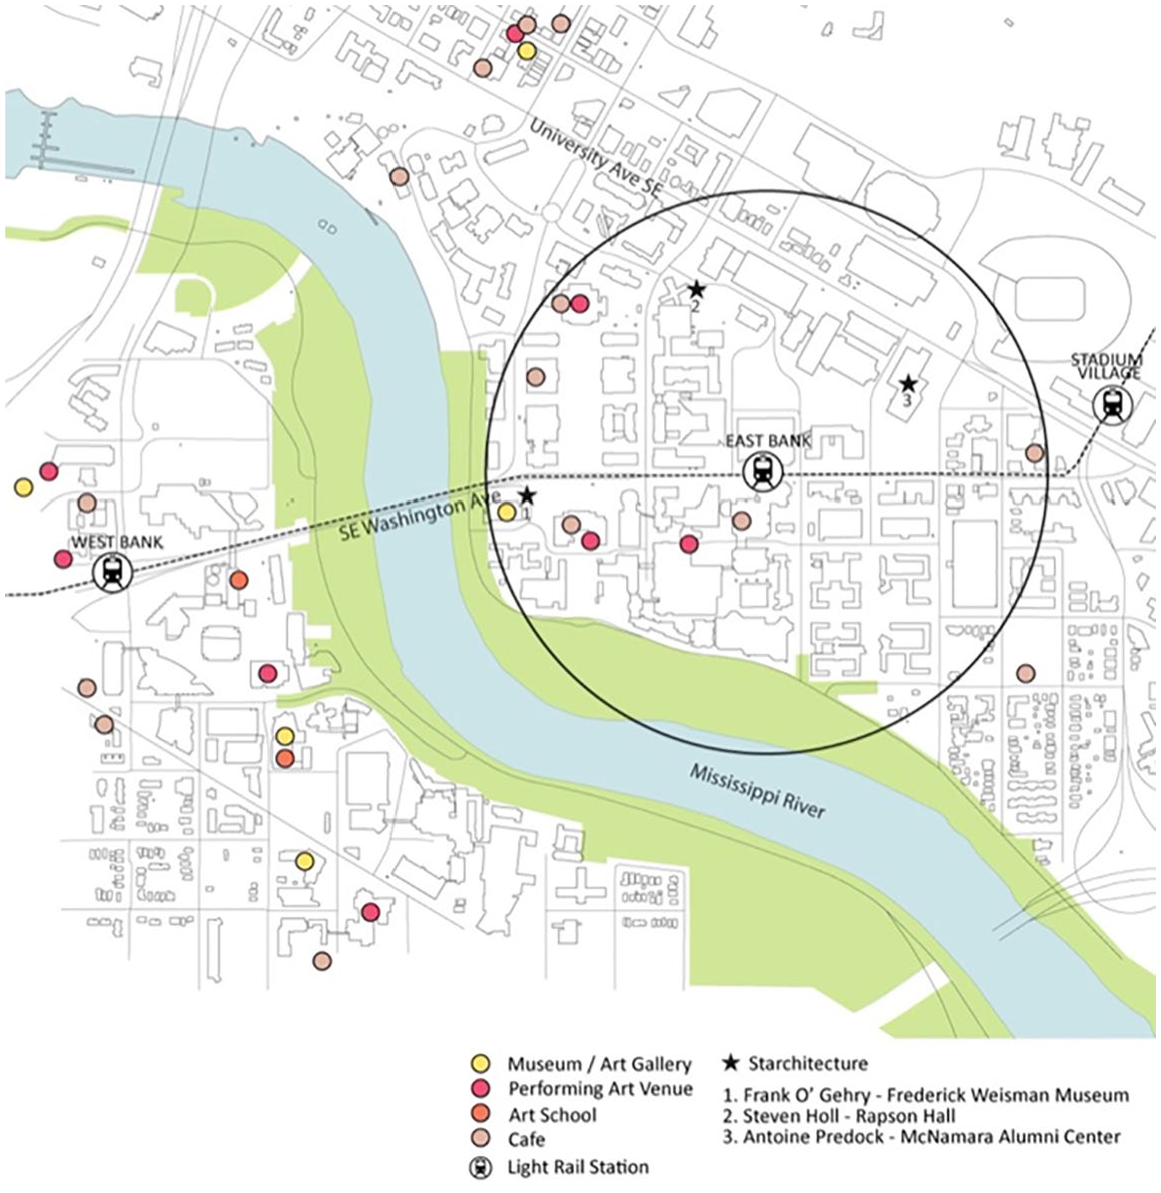
Select amenities in the University area.
University contains three iconic buildings: the aforementioned Weisman Art Museum, Rapson Hall by Steven Holl, and the McNamara Alumni Center by Antoine Predock. We analyze only the first two. Completed in 2011, the Frederick R. Weisman Art Museum (Figure 12) is another Gehry-designed building that sits at the western end of the Washington Avenue Bridge, overlooking the Mississippi River and serving as a landmark gateway to the campus. The building’s western riverside façade features Gehry’s familiar undulating stainless steel panels. On the campus side, however, the building is clad in brick, which corresponds with the rest of the brick and sandstone buildings on campus. Thus, programmatically and architecturally, the museum does integrate closely with its surrounding context.

Frederick R. Weisman Art Museum (left) and Rapson Hall (right).
The other iconic building, Rapson Hall (Figure 12), is a 2002 addition to the School of Architecture. The building is an angular, cruciform shape clad in copper that contrasts from the school’s existing 1950s modernist building. In between Rapson Hall’s separate wings are landscaped courtyards. “U glass” windows provide translucent lighting in the interior workspaces and library. The interior of the building is designed to facilitate a variety of programs and includes a library, an auditorium, office space, seminar rooms, and studio space.
In University, therefore, we see very different uses of iconic architecture and a very different relationship between buildings and their surrounding environment than we did with Millennium Park. The Art Museum and Rapson Hall are intimately related to the dense cluster of buildings around them both spatially and programmatically. While the Art Museum attempts to create a sense of aesthetic continuity, Rapson Hall is designed to emphasize contrast. In both cases, the design engages with the immediate surroundings. This contrasts with the grand scale of the iconic structures in Millennium Park, which, though they interact with each other, stand apart from the skyscrapers and corporate retail on the borders of the park. Like Millennium Park, however, the East Bank campus is centrally controlled by a large institution, distinguishing it from the bottom-up formation of a neo-bohemian neighborhood. To understand how neo-bohemia has developed within Minneapolis, we turn to our final case: Uptown.
Uptown
“It’s all about being free” are the words that Prince used to characterize the neighborhood of Uptown in his eponymously named hit song of 1980. The song is an ode to bohemian open-mindedness toward race, sex, and self-expression. And although the neighborhood has changed and gentrified greatly since the 1980s, the zip code (55408) that contains Uptown has one of the highest bohemian scores of Minneapolis and Chicago combined. It also has among the highest number of arts establishments in Minneapolis and the highest number of residents employed in the arts in absolute (but not proportional) terms.
Uptown is centered at the intersection of Hennepin and Lagoon Avenues in the city’s southwest corner. As seen in Figure 13, arts and bohemian amenities cluster roughly around this intersection (though not to same extent as Wicker Park). Uptown’s scene is also shaped by two local landmark amenities: Uptown Theater and Calhoun Square (Figure 14). Built in 1916 and located at the corner of Hennepin and Lagoon, Uptown Theater is one of the oldest surviving theaters in Minneapolis and known for screening independent and foreign film. Its Streamline Moderne architecture provides a distinct local landmark at the center of the neighborhood.
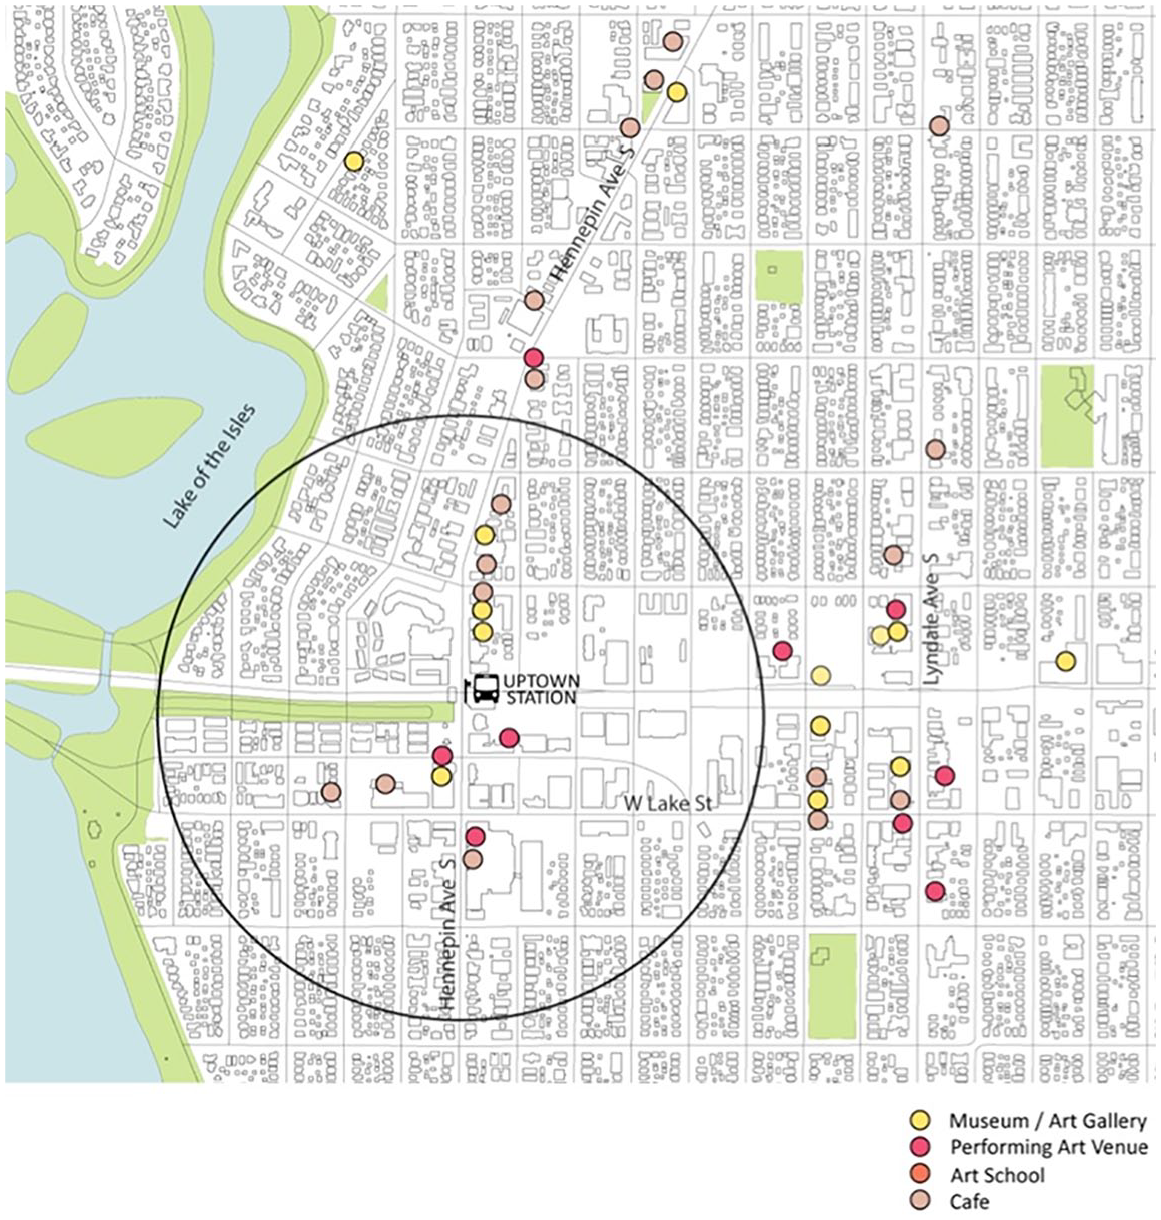
Select amenities in Uptown.
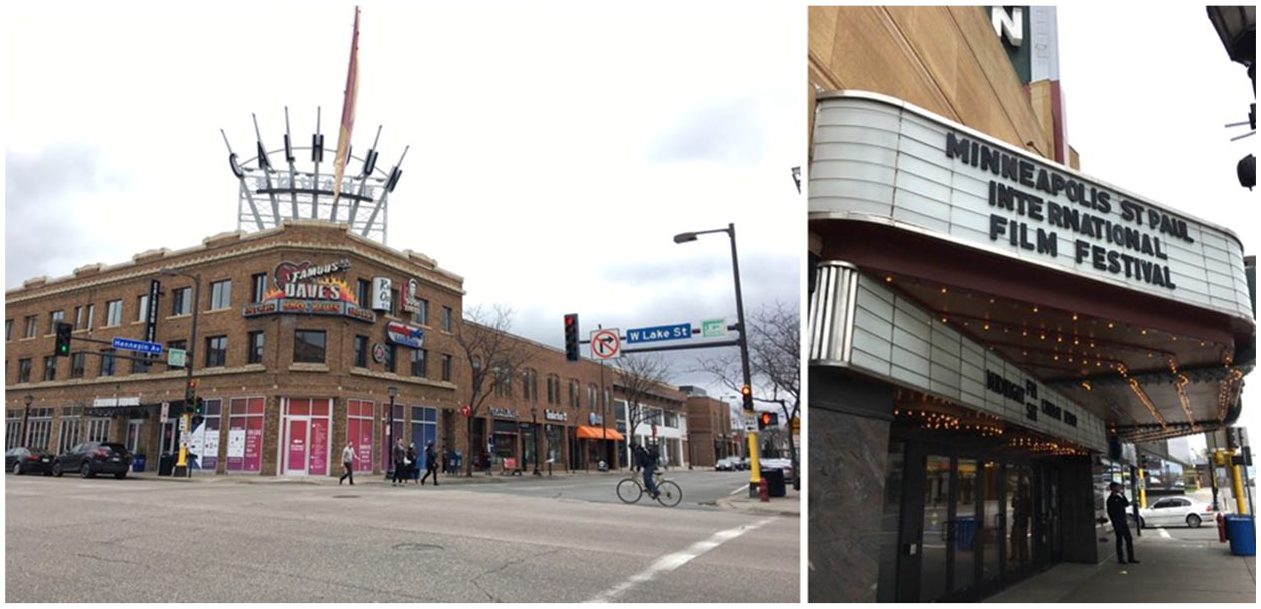
Calhoun Square (left) and Uptown Theater (right).
Located one block south, Calhoun Square is an indoor shopping mall that was completed in 1983 using the façades of existing heritage buildings. More “Fantasy City” (Hannigan 1998) than bohemian in character, the mall’s development was part of the larger gentrification of Uptown. It is now filled with corporate chains and upscale boutiques. Both of these buildings, however, constitute what Ho (2006) calls “community iconic structures”: buildings that establish a meaningful sense of place among local community members even if they are not particularly notable on a global level. In this sense, these are very different types of icons than the starchitect-designed buildings of University.
Today, the Uptown scene is distinctly neo-bohemian, fusing bohemian consumption with the economic capital of young professionals. More than twenty bars and restaurants make it a center for consumption and entertainment and, despite the presence of corporate chains, it is still home to many local businesses (Figure 15). In addition, Uptown is home to several cultural festivals including an art fair and an annual bicycle festival and race.

Shops in Uptown.
In addition to serving as a source of entertainment, this annual bike race also affirms the neighborhood’s strong cycling culture. As with Wicker Park, cycling is an important mode of transportation for Uptown: 7.8% of residents commute by bicycle. Adding to the appeal of cycling is a bike sharing station on Hennepin Avenue and the Midtown Greenway bike path, a former rail line that connects Uptown to the citywide network of bike routes. In terms of public transportation, Uptown is not located on the LRT, but it does have a centrally located bus station and a rate of public transit use that is slightly above the city average. Finally, also like Wicker Park, Uptown is itself a highly walkable neighbourhood with a Walk Score of 93, but has below-average rates of pedestrian commuting at only 3.3%.
To review, while Chicago and Minneapolis have very different types of iconic districts—a busy tourist destination in the downtown core and a more insular college campus—they both fit into their respective urban landscapes in surprisingly similar ways, particularly with relationship to bohemian neighborhoods. Both iconic districts are major employment centers on mass transit lines. While they differ in their levels of walkability, they both have extremely high rates of pedestrian commuting, but lower rates of transit use than their city averages. Meanwhile, the neo-bohemian neighborhoods, Wicker Park and Uptown, are located within a bohemian “axis” that extends out from the central core. They are also within cycling, but not walking, distance of the core itself. Thus, while both highly walkable, they have low rates of pedestrian commuting. These neighborhoods serve both as residential commuter neighborhoods with high numbers of cultural workers 6 and as consumption destinations for those seeking smaller-scale, local shops, cafés, and restaurants. Thus, both cities appear to fit the correlation hypothesis better than conformity or contradiction.
National-Level Analysis
To determine whether these observations hold beyond Chicago and Minneapolis, we turn to national-level quantitative analysis. First, it should be noted that iconic architecture positively correlated with our bohemian score across U.S. zip codes. Zip codes with at least one iconic building have an average bohemian score of 0.617 standard deviations above the national mean. The relationship is stronger at the level of county (roughly approximating cities) with a significant Pearson’s r of .11 (compared with .05 at the zip code level). Such correlations affirm an observation that can be made from our case studies: Iconic architecture and neo-bohemias tend to be located in the same cities. Within those cities, however, iconic buildings are located in neighborhoods that are more bohemian but not typically the most bohemian.
Scene Analysis
As mentioned in the introduction, one of the fundamental characteristics of culture-led developments is that their relationship to the urban environment is mediated by the kinds of meanings they convey. Using scenes dimensions, we are able to assess these meanings at a macro-level by looking at the types of amenities that cluster around iconic architectural developments. Table 5 presents the standardized scores for each of the fifteen scenes’ subdimensions averaged across all zip codes with iconic architecture. These scores indicate how zip codes with iconic architecture differ, on average, from U.S. zip codes in general. They are not shown but t tests indicate that these differences are all significant except for “Charismatic” and “Local.” The ideal-typical bohemian scores are included as a point of reference and are centered at zero.
Mean Standardized Scene Scores for Zip Codes with at Least One Iconic Architectural Project and Ideal-Typical Bohemian Scores.

As can be seen from Table 5, the average iconic zip code closely reflects the bohemian ideal with a few important distinctions. In terms of legitimacy, self-expression is the main source of moral authority as opposed to egalitarianism and tradition. In this case, starchitects and bohemians share much in common; their modus operandi is to break with tradition and stand out from the crowd through unique expressions of individuality. Where iconic architecture differs with bohemia is in utilitarianism. This may seem surprising, given a common critique that starchitects put “form” ahead of “function.” However, the kinds of places where you find iconic buildings are also places that serve a utilitarian function: central business districts and university campuses. In these locations, we find many of the amenities that score highest on utilitarianism, according to Silver and Clark (2016, p. 101). These include business consulting services, tutoring centers, hospitals, and fast-food restaurants—all places common to central business districts and university campuses, but not traditional bohemias.
We see a similar fusion of bohemian and non-bohemian elements with theatricality. In this case, zip codes with starchitecture tend, like bohemia, to be transgressive and not neighborly, but also glamorous and exhibitionistic. Meanwhile, in terms of authenticity, which refers to the types of identities that are affirmed within a scene, both iconic architecture and bohemia score high on ethnicity (likely reflecting their location in large cities where ethnic restaurants and organizations are ubiquitous). However, unlike bohemia, iconic buildings are also associated with the top-down identities of corporations and the state, and technocratic identities tied to rationality. As with utilitarianism, these scores reflect the influence of fast-food restaurants, government buildings, universities, hospitals, and other major players that tend not to locate within fringy bohemian neighborhoods. 7
Thus, if we interpret the overall meanings associated with iconic architectural development through the scenes within which they are located, we can observe the blending of a bohemian ethos of transgressive self-expression into scenes associated with powerful institutions: corporations, the state, and major universities. From this finding, we can draw larger conclusions about iconic architecture. In the mid-twentieth century, modern architects such as Mies van der Rohe created an aesthetic that represented the ethos of William H. Whyte’s (1956) “Organizational Man,” emphasizing utilitarianism and formality while suppressing transgression and self-expression (Guillén 2006). This was the aesthetic and the ethos that dominated major institutions in the postwar era and was anathema to the bohemian countercultural movements that opposed those institutions. Today, however, it appears that starchitects have produced an aesthetic to fit the era in which large institutions have passed into the hands of the “bobos” or “creative class”: utilitarian and expressive, aligned with powerful institutions while also being aesthetically transgressive.
Regression Analysis
In our final analysis, we return to the four dimensions of the urban environment, comparing iconic architecture and neo-bohemia through multivariate regression models. Because only a tiny proportion of zip codes actually have any iconic architecture, we treat this as a dichotomous variable and use logistic regression to examine the effect of our explanatory variables on the odds that a zip code will have any iconic architecture. For modeling the bohemia score, we use ordinary least squares regression. Both models are run at the level of zip code, and for both, we run the model three times, testing different modes of commuting (walking, transit, and cycling). 8 Because Walk Scores correlate highly with transit and raise issues of multicollinearity, they are excluded from the transit model (model #2).
The results of these models are presented in Table 6 (iconic architecture) and Table 7 (neo-bohemia). The coefficients presented in these tables have been standardized to enable us to compare their relative influence over the dependent variables. For the logistic regression, we present the multiplier effect on the odds that a zip code contains iconic architecture. Thus, values > 1 are positively associated with icons, while values < 1 are negative.
Logistic Regression on Odds that a Zip Code Has at Least One Piece of Starchitecture.

Note. All independent variables are standardized. This table presents the odd ratio, Exp (B). BA = bachelor’s degree.
p < .05. **p < .01. ***p < .001.
OLS Regression on the Standardized Bohemian Score.

Note. The table presents standardized coefficients. OLS = ordinary least squares; BA = bachelor’s degree.
p < .05. **p < .01. ***p < .001.
As seen in these two tables, most of the dimensions we have discussed in this article are significant and similarly related for both iconic architecture and neo-bohemia. Both manifestations of the cultural city tend to locate in urban areas with high populations and high proportions of racialized minorities. Rents and educations are high, but incomes are low, which is consistent with the idea that the cultural city is associated with highly educated but poorly paid workers (Lloyd 2006). Furthermore, the proportion of residents actually employed as artists, designers, and entertainers is positively associated with both, as is the number of arts establishments. These associations suggest that iconic architecture and neo-bohemias tend to locate within artistic scenes or clusters. Thus, culturally, economically, and demographically, zip codes with iconic architecture and neo-bohemias look very similar.
When we turn to transportation, however, we see a key difference that fits with the observations made in our case studies. Both iconic architecture and neo-bohemia are positively associated with Walk Scores and commuting via public transit and bicycle. When it comes to pedestrian commuting, however, their relationship is the opposite: positive for iconic architecture, negative for neo-bohemia. This finding is even more interesting because walking is the strongest transportation predictor in both cases, despite having opposite effects. These effects lend further evidence to the conclusions of our case studies. Iconic architecture locates within major employment centers such as central business districts and universities, where residents live and work in the same places. Neo-bohemias, however, tend to serve as both highly walkable consumption centers as well as commuter residential zones too far from employment spaces for walking, but close enough for cycling and transit use.
Thus, we find more evidence for the correlation hypothesis: Whereas neighborhoods with iconic buildings and neo-bohemias share many characteristics, they are likely found in different places within the city and serve different social-ecological functions. 9
Conclusion: An Ecology of the Cultural City
In interpreting the findings from this article, it is important to keep in mind two enduring insights from the human ecology of the Chicago School (Park, Burgess, and McKenzie 1925). First, social phenomena are constituted in part by the places in which they occur. Understanding why a phenomenon occurs requires us to identify the various factors that intersect at a particular place (and time) that bring that phenomenon into existence (Abbott 1997). Second, places themselves are shaped by their position within larger ecological structures—that is, within larger spatial and functional structures (Haines 1985, p. 66). This means that to understand why a set of factors intersects at a particular place, we need to situate that place in relation to other places spatially (in terms of proximity, ease of movement, etc.) and functionally (in terms of how practices in one place are related to practices in another place).
Our findings underscore the importance of these principles in the study of the cultural city. We began with a recognition that cultural spaces are defined, in part, by the types of meanings that they convey and that these meanings potentially affect how different cultural spaces relate to each other and the urban landscape in general. We then chose two types of cultural spaces that represented extreme ends on a spectrum: “top-down” iconic architecture, and “bottom-up” neo-bohemia. By measuring how these cultural spaces related to a variety of other urban factors (cultural, transportation, economic, and demographic), we were able not only to determine how they relate to their immediate surroundings, but also how they fit into a larger ecological structure. In this case, neo-bohemias provide residential and consumption spaces occupied by creative workers with higher educations and lower incomes, and are characterized by public transit, cycling, and small-scale, independent retailers. Iconic architecture, in contrast, tends to occupy central employment spaces dominated by major public and private institutions: the state, corporations, and universities.
Our findings also help extend, clarify, and dispute existing understandings of iconic architecture and neo-bohemia. We provide further evidence in support of previous claims that iconic architecture represents the identities and interests of powerful elites (e.g., Sklair 2017). However, we extend this claim using scenes analysis, demonstrating how starchitects create a synthesis between state and corporate identity with bohemian transgression and self-expression. Despite these seeming contradictions between the top-down nature of starchitecture and bottom-up nature of neo-bohemia, and the fact that they tend not to be found in the same neighborhoods, the two forms of culture are linked by distinct, yet complementary, ecological functions within cities and metro regions (employment vs. residential and consumption). Furthermore, we demonstrate that both forms of culture are associated with thriving cultural industries measured as arts establishments and proportion of residents employed as artists/designers/entertainers.
Furthermore, our findings contradict existing scholarship on the question of physical integration with the surrounding streetscape. Statistically, iconic architecture is strongly and positively associated with walking, public transit, and cycling. Qualitatively, our case studies demonstrate how these projects tend to relate in complex ways with their surroundings physically, programmatically, and economically. By contrast, we show that neo-bohemian neighborhoods, typically thought of as beacons of Jacobsian walkability, actually have lower levels of pedestrian commuting. We explain this unexpected result by theorizing that, while they may be walkable for consumption purposes, neo-bohemias tend to serve as commuting zones that offer other alternative modes of transportation (transit and cycling).
Limitations and Future Research
Our findings also raise several questions for future research. First, while we briefly explored the relationship between starchitecture and bohemia at the metro level, we did not fully pursue the question of how metro-level characteristics might influence the relationship and structure of the cultural city. With regard to this question, hierarchical modeling with crossover interaction terms could prove very insightful. Second, this article only addresses two manifestations of the cultural city. There are many other ways to classify cultural development and cultural industries (e.g., Mommaas 2004), and understanding how they interrelate on an ecological level could greatly advance our understanding of cultural cities more generally.
Finally, and most important, while our case studies and cross-sectional national-level models point to a clear correlation between starchitecture and neo-bohemia and with several elements of the urban environment, more direct and longitudinal data are needed to further specify the nature of this correlation, including the unraveling of the tricky issue of causality. An obvious next step would be survey research of cultural workers that can more directly map out the interrelations between specific cultural occupations, employers, residential and work locations, and commuting methods and routes. Also important would be research into the role that zoning plays in shaping the cultural city by setting up regulatory distinctions that encourage more top-down development in some places and bottom-up development in others.
Ecological Correlation and Sociopolitical Tension
While this article has demonstrated correlation at the ecological level, it is important to note that this does not necessarily imply harmony between top-down and bottom-up forms of culture at a sociopolitical level. Indeed, there is evidence that different types of cultural developments can create social and political tensions, particularly when they materialize in a close spatial proximity (e.g., Patterson 2016). Deener (2012), for example, documents these tensions in his ethnography of Venice, Los Angeles, a neighborhood that is home to both a thriving bohemian scene and iconic architecture such as the Gehry-designed Chiat/Day building (now serving as the Los Angeles headquarters of Google). Beyond this cultural diversity is economic diversity that includes marginalized minority populations, homelessness, as well as upscale shopping streets and wealthy residential enclaves. Deener documents how this level of cultural and economic diversity creates constant tension between more bottom-up public cultures characterized by ambiguity and diversity, and more top-down cultures imposed by elites characterized by formality and exclusivity.
Deener’s ethnographic findings point to a further new direction for the ecological perspective adopted in this article in examining when and where conflicts between more bottom-up and top-down cultural development occur. Although the classic “stage theory” of gentrification depicts smaller bottom-up artistic communities being exploited and eventually displaced by larger top-down firms (Ley 2003; Zukin 2010), other research has found that the relationship between the arts and gentrification is more complex and multifaceted, and differs by city and by type of culture (Grodach, Foster, and Murdoch 2018; Moss 2017; Patterson and Silver 2015).
The cross-sectional analysis presented here cannot be used to evaluate temporal processes such as gentrification and displacement, but it does point a way forward in this literature. An ecological approach leads us to ask not only which types of culture are more or less likely to be associated with gentrification and/or displacement, but also where in the city this relationship holds. We require longitudinal data to better understand how starchitecture and bohemia relate to each other over time and the long-term impact of starchitecture on local cultural workers and bohemian culture. Better understanding these relationships will be enormously important for ensuring that cultural planning is equitable and inclusive.
Footnotes
Declaration of Conflicting Interests
The author(s) declared no potential conflicts of interest with respect to the research, authorship, and/or publication of this article.
Funding
The author(s) received no financial support for the research, authorship, and/or publication of this article.
