



Abstract
Do school characteristics predict the likelihood of turning out to vote on tax referendums for school funding or predict passage of tax referendums for school funding? I rely on publicly available Florida Voter Registration files and connect voters to their closest elementary school. I then aggregate individual data to the precinct level to test what characteristics predict the passage of tax referendums. Pairing the individual level turnout data with the precinct level data, I find that there are differences in the composition of voters across election types and these voters are responding to different characteristics of schools. While we might expect school characteristics to matter more for special elections, this is not the case. School characteristics matter less in special elections because who is turning out to vote is different in those elections. General elections are the only time in which school performance is statistically related to the percent of yes vote.
Introduction
Local elections can have a great impact on our lives, particularly when it comes to public education. However, work on local elections is understudied compared to state and national elections (Marschall, Shah, and Ruhil 2011). Local elections are difficult for a number of reasons—they vary in timing of elections, positions being elected, and are often nonpartisan (Marschall, Shah, and Ruhil 2011). Research suggests that local elections turnout different people to vote than national elections. Voters tend to be homeowners who have a stake in protecting their investments. This might come in the form of voting down property tax increases to have less of a bill to pay. However, public education itself is an investment. Declining school quality can also mean declining home values. Research has shown that political behavior is spatially dependent. Does being near a school that is performing well increase your likelihood of turning out to vote? Is it conditioned on being a property owner or the racial composition of the school? I explore who turns out to vote and passage rates of a referendum on the tax increase. I focus on two questions: (1) Do school characteristics predict the likelihood of turning out to vote on tax referendums for school funding? (2) Do school characteristics predict the passage of tax referendums for school funding? While school characteristics can include many different attributes, I focus on student race and ethnicity, the percentage of students with free and reduced lunch, the percentage of students that passed third-grade math tests, and the percent of children attending public school.
When deciding whether to vote or how to vote on tax referendums for public schools, individuals are likely to think of the school closest to them and the students in that school. I test whether certain characteristics matter more than others in driving voter turnout. The timing of the election is also likely to play a key role in whether school characteristics matter. When tax referendum votes occur at the same time as a primary or general election, the school tax referendum vote is likely to play only one part in what drives someone to turn out to vote. However, when the tax referendum vote is the only issue on the ballot, it will be the main driver in turning out someone to vote. Therefore, I test if the effect of school characteristics on the likelihood to vote and passage are conditional on when the election is occurring.
To understand what prompts turnout at the individual level for voting on school tax referendums, I rely on individual voter records from Florida. Florida Voter Registration files are publicly available and contain demographic information, such as race and gender; which elections the voter turned out to vote; and addresses of voters. This allows me to connect voter files to school attendance zones and identify characteristics of the elementary school closest to the voter. I have collected information on individual registered voters from 2008 to 2018. Florida has sixty seven public school districts, which are geographically defined by county boundaries. School districts, therefore, cover large and often very diverse areas. Within each school district, school attendance zones define which schools children attend. While voters within a school district all vote on the same tax referendum, the public schools that the voters are zoned in can be quite diverse. In addition, Florida has a constitutionally protected levy limit and requires voters to approve any tax increases above ten mills. When the mill rate is increased, this translates into increased property taxes. Over the ten-year time period, school districts asked voters to approve higher millage rates 125 times. The majority of school districts were successful, with voters approving millage measures ninety five times and rejected increases thirty times. This allows me to test whether the characteristics of students who attend public schools matter in turning out to vote. I then aggregate the individual level data to the precinct level to identify what predicts the passage rate of tax referendum within a precinct.
I rely on several additional data sources. I use tract level data from the U.S. Census Bureau to approximate a voter's likelihood of home ownership, median household income, median housing values, and likely exposure to other racial and ethnic groups. I use school level data from the Florida State Department of Education to identify the demographic composition of elementary schools. Using mapping software and school attendance zones, I link voters with the elementary school that is in their zone. I use school-level test scores as a measure of school quality. It is important to note that these models are based on registered voters and what turns out registered voters and do not focus on individuals who are not registered to vote.
While individual characteristics are strong predictors of turnout (i.e., age and partisanship), school and neighborhood characteristics matter too in elections with a tax referendum vote and vary by election timing. Voters in school attendance zones with a higher percentage of students on free or reduced lunch were less likely to turnout to vote. Similarly, a higher percentage of White students are also associated with a lower likelihood of turnout. Test scores were only found to be predictive of turnout in primary elections. I then ran the same models on elections without a tax referendum vote on the ballot to test to see if the same school characteristics mattered. The percent of White students in a school is not predictive, unlike elections with a tax referendum on the ballot. Perhaps more interesting is that the percent of students in public schools is negative and statistically significant for these models. That is, when there is no tax referendum on the ballot, individuals that live in areas with a higher percentage of students in private schools are more likely to turnout. This suggests that having a tax referendum on the ballot increases turnout in areas with a higher percentage of students in public schools. Lastly, the percent of students on free and reduced lunch is predictive of turning out to vote for general elections without a tax referendum ballot. This suggests that this association is not being driven by a tax referendum on the ballot.
At the precinct level, again school characteristics matter in predicting the percentage of yes votes within a precinct. While the % White of students is not related to the % yes vote, the percent of students on Free Lunch and percent of students passing third-grade math are predictive. Higher test scores are associated with higher passage for tax referendum votes in the general election, but not for special or primary elections were the effect of test scores is conditional on other factors. The percent of students on free lunch is negatively associated with passage for primary elections only. Again, characteristics like home ownership, which is negatively associated with the passage of tax referendum votes, matters for primary and general elections but not special elections. Pairing these findings with the individual level turnout data, there are differences in the composition of voters across election types and these voters are responding to different characteristics of schools. While we might expect school characteristics to matter more for special elections, this is not the case. School characteristics matter less in special elections because who is turning out to vote is different in those elections.
What Influences How We Vote
A long line of literature has focused on what individual factors influence a person to vote (i.e., Campbell et al. 1980; Rosenstone and Hansen 1993; Verba, Schlozman, and Brady 1995). Past voting habit is a good predictor of future voting patterns (Plutzer 2002). There is a socioeconomic tilt in voter turnout, with wealthier individuals voting at higher rates (Bartels 2009). This is even more pronounced in lower turnout elections, which tend to have voters who are whiter, wealthier, older, and better educated than the jurisdiction as a whole (Hajnal 2009; Wirt and Kirst 1997). Whether the person owns or rents property can influence decisions to support tax increases. While renters are indifferent to the type of tax increase, property or sales, homeowners strongly oppose a property tax increase relative to a sales tax increase (Brunner, Ross, and Simonsen 2015). Furthermore, income or relative tax burden does not change homeowners’ opposition to property taxes. The very act of buying a house motivates individuals to participate more in elections (Hall and Yoder 2021).
But beyond these individual factors, the space and people within a given district play a role in how we vote. As Enos (2017) finds, the distribution of different racial and ethnic groups has a direct effect on the relations between groups, and that this has political consequences. He calls it socio-geographic space, and it is affected by segregation, size, and proximity of groups. It does not require direct contact with individuals; the interactions are institutional. It creates a psychological space between groups which affects the behaviors of groups. As Enos (2017) shows, even in the absence of extended interpersonal contact between groups, geographic space does affect behavior. Schools are public institutions that are well known in local communities.
This complex relationship between an individual and the space around them plays a role in how local governments function. This is especially true for public schools. How we think about a public school and whether we are willing to support it through tax increases is likely to depend on what we think about who is using that public good. Previous literature has found diverse communities see fewer bond elections, but that the bonds that are proposed are larger and pass at higher rates (Rugh and Trounstine 2011). The passage of a bond can be an indicator of support for investments in public. As Rugh and Trounstine (2011) note, if diversity decreased the utility of public goods, it would make no sense for voters to approve debt or fund public projects. However, in a segregated environment, this statement might not hold up. Local governments, through policies such as zoning and land use, have institutionalized segregation to protect public goods and property values of White homeowners (Trounstine 2018). Zoning allows school districts to establish which neighborhoods will go to which school within a school district. Elected officials can use this to create homogeneous public schools through school attendance zones. Richards (2014) finds that school districts gerrymander attendance zones that reproduce or even amplify underlying residential segregation. These racially segregated communities invest more in public education than integrated ones (Kitchens 2020).
Another component that might matter in how people decide to vote is the performance of schools. Housing values and test scores have been shown to be positively correlated (Nguyen-Hoang and Yinger 2011). If a person's local school is not performing well, people might be less supportive of increased taxes. Interestingly, the passage of tax referenda results can result in better student outcomes. In districts that passed tax referenda, students had higher test scores and graduation rates in the years immediately after the election (Abott et al. 2020). Although Dougherty et al. (2009) find that while test scores are positively and significantly associated with single-family housing prices, test scores became less correlated over time. Instead, home buyers were willing to pay more for a reduction in school minority composition. Similarly, Rowe and Lubienski (2017) find when selecting public schools, most people are not equipped with proper information to determine school effectiveness and instead rely on socio-demographic characteristics of schools. Race and racism play an unquestionable role in local politics. Hajnal and Trounstine (2014) find that while ideology, partisanship, class, religion, and morality play a role in urban politics, race is the clear dominant factor.
Holbein (2016) finds that citizens react to school failure; there is an increase in local school board elections and an increase in the competitiveness of the races. Furthermore, citizens leave the schools. However, the effect is primarily seen among districts that are White, affluent, and those more likely to vote. Others have found less support for school performance in voting for school board members. Kogan, Lavertu, and Peskowitz (2016) find that the performance of a school district has little impact on the vote share of sitting school board members, school board turnover rates, or superintendent tenure. Kogan, Lavertu, and Peskowitz (2018) offer a possible explanation for the different findings: the timing of the elections. As Kogan, Lavertu, and Peskowitz (2018) find, the timing of elections influences voter composition in terms of partisanship, ideology, and age. In special elections, the share of the elderly is approximately 20–40% greater than in presidential elections. Older voters might evaluate school performance differently than the larger electorate.
In an anecdotal example of two school districts who had different outcomes on a referendum vote during the same year and are geographically close, the timing of the vote might have played a role. Charlotte County schools held their vote in September while Sarasota County held theirs in March. The September election was “recommended to the district as statistics show that snowbirds don't seem to support local education as much as Florida's year-round residents” according to Superintendent Dave of Charlotte schools Gayler (Staiks 2010). Ultimately, the Charlotte tax referendum vote was unsuccessful while Sarasota was, in contrast to what the advisors to the school district speculated.
The idea that the composition of schools matters in how people vote builds on previous research that has found a linkage between a person's neighborhood and political participation. Using data from local elections in an Italian municipality, Bellettini, Ceroni, and Monfardini (2016) find that neighborhood heterogeneity and political participation are linked. Income inequality and the proportion of foreign immigrants who are not entitled to vote are negatively associated with the aggregate turnout. Using geocoded voter registration files, Barber and Imai (2014) find that an increase in the out-group neighborhood proportion leads to a decrease in the probability of turnout. For example, a Democrat who lives in a Republican neighborhood is less likely to vote than if they were to live in a Democratic neighborhood. Similarly, Gimpel, Dyck, and Shaw (2004) find that neighborhoods influence the voting by interacting with partisan affiliation to dampen turnout among voters we otherwise might expect to vote. They note that where citizens live at least partly contributes to what they learn and know about elections; “political participation has a geography, as well as a psychology” (Gimpel, Dyck, and Shaw 2004, 345). Neighborhoods that are ethnically more heterogeneous are associated with lower individual level electoral turnout (Forster 2018).
Neighborhood contexts are highly variable and can both mobilize and demobilize voters (Tam Cho, Gimpel, and Dyck 2006). This effect is different than individual-level demographic influences on voting. Tam Cho, Gimpel, and Dyck (2006) theorize that the neighborhood matters because of information flow, which can be affected by neighborhood composition. The idea of geographic space effecting turnout is observed in other areas as well. In an analysis of Medicaid enrollment and local participation, as the proportion of residents enrolled in Medicaid increases, civic and political membership associations declines and aggregate voting rates decrease (Michener 2017). Use of the public good is also important. As more people choose to participate in school choice within a school district, voter turnout declines in school bond elections (Casalaspi 2019).
Building on this idea of space, I am interested in understanding if the characteristics of schools also impact voters in both turning out to vote and in how they vote. This includes the race/ethnicity of students in the school, the percent of students on free lunch, test performance, and the percent of students in public schools. Table 1 briefly summarizes the hypotheses. In predicting the likelihood to vote, I focus on individual level behavior. I hypothesize that higher test scores, more students in public school, and a higher percentage of students who are White will be associated with a higher likelihood of voting at the individual level. In contrast, I hypothesize that a higher percentage of students on free and reduced lunch will result in a lower likelihood of voting. The characteristics of the schools themselves matter in how a voter thinks about the public good and how likely they are to support that good.
School Characteristic Hypotheses.

In addition to turnout, I also analyze the passage rates of the tax referendums. I focus on the precinct level and the percent of yes votes that the tax referendum received. There are several reasons why a person might vote against a tax increase for school bonds. If they have no children in the school system or taxes were just recently increased, they might be less likely to vote in favor of new taxes. But the race/ethnicity of students attending the school might also matter, especially if it is different from their own. In an analysis of school bond approvals, Bowers and Lee (2013) find that what the bond would fund, the location of the request on the ballot, and the demographics of the citizens all mattered in the passage of school bonds. Hopkins (2009) finds that increased homogeneity within a town increased the likelihood of placing a tax limitation override on the ballot. In an analysis of school bond tax referendums in Florida, Button (1993) finds that Black residents voted at lower rates than White residents but that higher Black populations within a precinct were more supportive of tax increases than White populations. For passage of the tax referendum, I hypothesize that higher test scores, more students in public school, and a higher percentage of students who are White will be associated with a higher percentage of yes votes. I hypothesize that a higher percentage of students on free and reduced lunch will result in a lower percentage of yes votes.
As Morel and Nuamah (2020) highlight, who is in power matters in how people perceive the quality of public goods. They find that shifts in power between racial groups influenced how citizens evaluated schools. School boards determine if and when to hold a vote on tax increases. The race of the school board members themselves is likely to play a role in whether or not citizens support a tax increase. I consider the percent of the board that is White as a factor in analyzing passage rates.
Because elections can be held at any time of the year, I do consider the timing of the election to be important. Dunne, Robert Reed, and Wilbanks (1997) show that the decision to vote is in part related to the implied net benefit of voting. As the cost of voting increases, those that have less to gain are less likely to vote. Furthermore, politicians can influence voter turnout in bond elections by holding the vote during a special election that is separate from the general election. Off-cycle elections favor organized interests, like teachers’ unions (Anzia 2011). Passage of tax referenda might be more likely in these off-cycle elections because of this.
It is also important to account for the percentage of the elderly population within a jurisdiction. Figlio and Fletcher (2012) find that the percentage of elderly adults in a school district is negatively related to the level of support for public schooling, and as the school-aged population becomes less White, support further decreases. The size of the jurisdiction matters as well. Eric Oliver (2000) finds that people in larger cities are much less likely to contact officials, attend community or organizational meetings, or vote in local elections. Vallbé and Magre Ferran (2017) build upon this by finding that smaller communities are more favorable for political participation for both residents that have lived there a long time, as well as residents that have recently moved to the area. Although not included in the analysis of this paper, institutional choices can alter the turn-out environment, such as deadlines for registration (Rosenstone and Wolfinger 1978), providing information including sample ballots, polling locations, and ID requirements (Citrin, Green, and Levy 2014; Wolfinger, Highton, and Mullin 2005). In the next section, I discuss the specifics of tax referendums in Florida. Florida is chosen because of the public availability of voter registration files, inclusion of race/ethnicity of registered voters, and has a manageable number of school districts to investigate.
Constructing the Data
To test these hypotheses, I rely on data from the state of Florida. Florida was chosen for several reasons. Florida has publicly available voter registration files that include detailed voter information, such as race/ethnicity, gender, birth date, and address. In addition, the school districts in Florida are independent school districts. Therefore, they have taxing authority. This is consistent with the majority of public schools in the United States which are independent school districts. 1 Florida is also a swing state that often has competitive elections at the state and federal levels. These competitive elections are likely to play a large role in turning out to vote, making it a tough case for school characteristics to be related to turnout.
Property taxes and sales taxes are the main revenue source for local governments to fund public schools. However, there are rules about when an increase to these taxes can be made. The Florida Constitution places a limit on the millage rate that school districts are allowed to tax for property. The millage rate determines the tax rate passed on the taxable value of the property. The rate is limited to ten mills. 2 If school districts want to raise the millage rate on property above this rate, then an election is required and a simple majority must vote in favor of the proposed rate. The new millage rate cannot be extended for more than four years. If the school district wants additional funds beyond the four years, a new election must occur to renew the rate. 3
Figure 1 shows the number of tax referenda votes by year and passage from 2008 to 2018. There were 125 school board tax referenda held across the sixty seven school districts. Of these 125 elections, ninety five of them passed and thirty failed. Only four of the sixty seven school districts did not hold a tax referendum vote during this time frame. While the overall passage rate is high, there were still many communities that were operating on significantly reduced budgets that did not pass a tax increase. The 2010 school year is the year that had the largest percentage of failures, with 47% of the votes failing to pass. The majority of districts hold the election at the same time as the general election in November (seventy four elections) or during the August primary (twenty six elections) for other local and state elections. But school districts can hold them at any time during the year, and twenty five elections occurred during special elections. In hopes of gaining support from older voters, some referendums did include provisions to provide tax relief to those over sixty five (Morrison 2012).
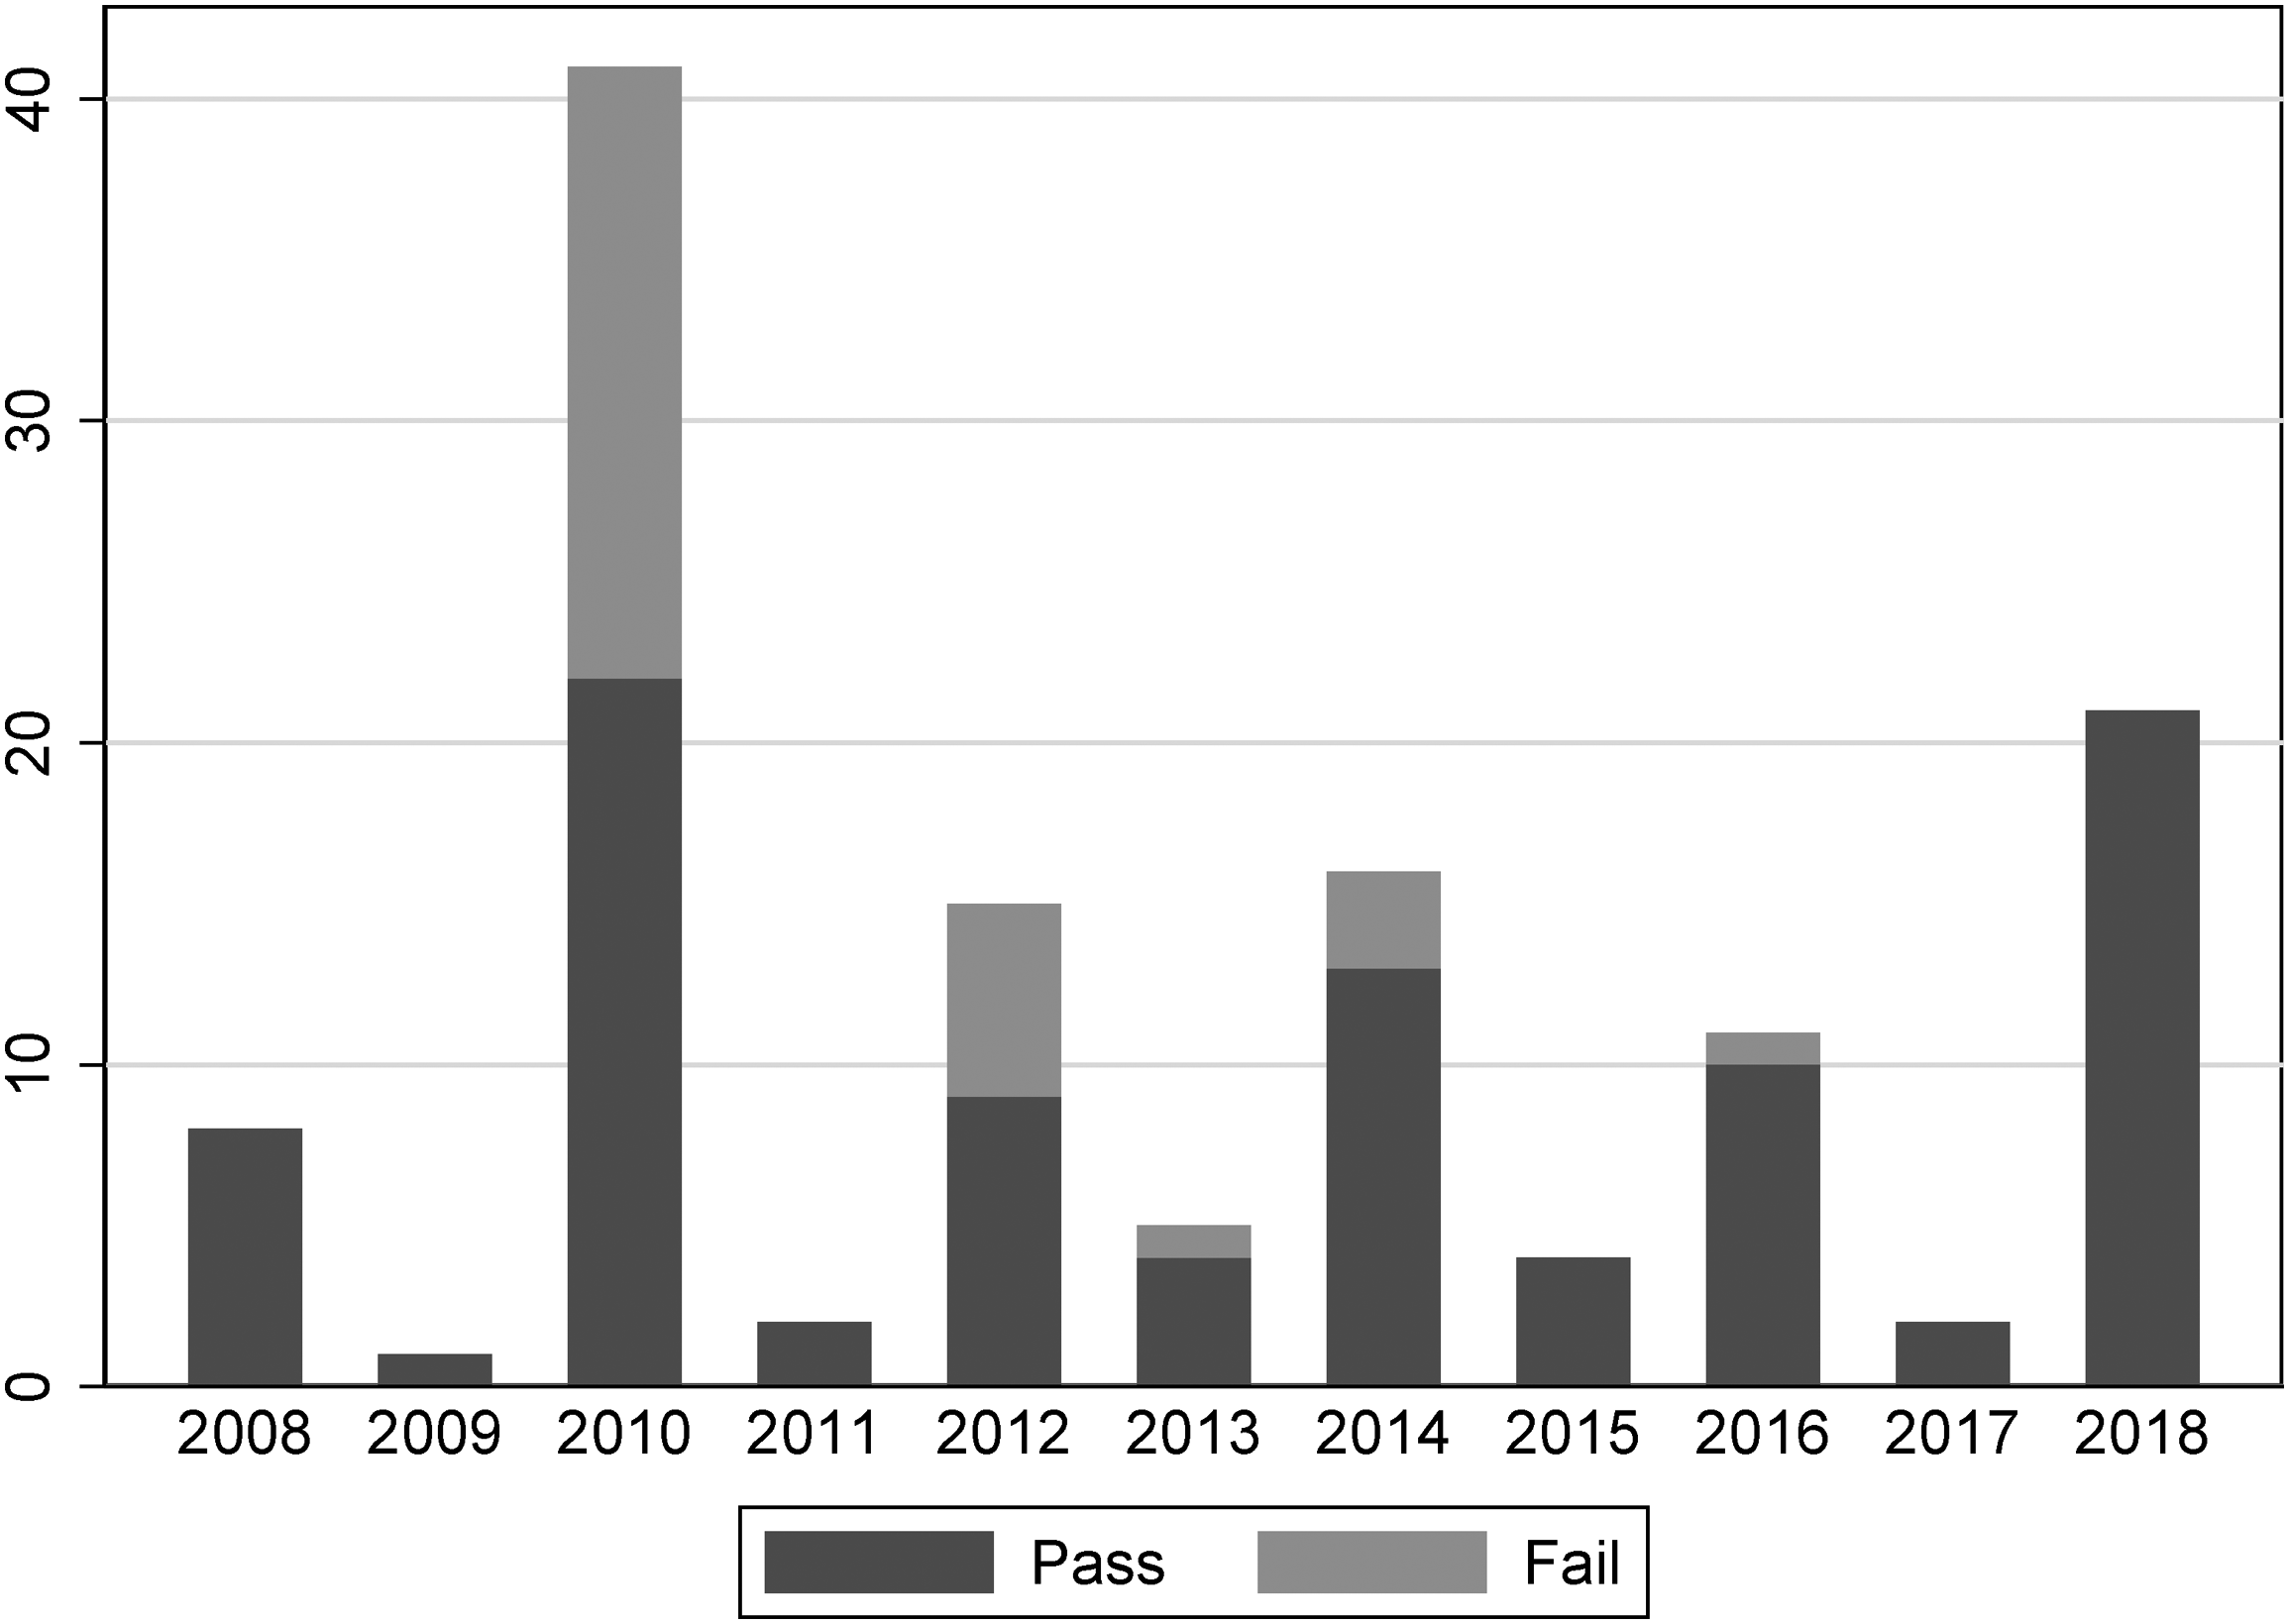
Number of referendum elections by year and passage.
In order to understand what factors influence voter turnout, I first focus on individual level characteristics. Individual voter registration files can improve inference on voter turnout and vote choice (Imai and Khanna 2016). The voter registration files made available through Department of Elections are the primary source for this data. 4 Florida voter registration files contain both voter registration information and past history of voting. Voter information includes race/ethnicity, gender, birth date, registered party, and address. I include dummy variables for the race. I include dummy variables for a party, with independent voters as the base category: Democrat and Republican. 5 I turn the birth date into the age that the voter was in January of the election year (Age) and include the age squared (Age2). If a person self-identifies as female, I create a dummy variable that is coded as 1 for female and 0 as not identifying as female.
Using the 2014 Address Range Feature shapefiles created by the U.S. Census Bureau and ArcMap, I was able to geocode registered voters based on their address in the voter registration files. Addresses were transformed into latitude and longitude coordinates. These coordinates were used to join voters to different levels of data, including which Census Block Group and which school attendance zone they lived in. Figure 2 shows the registered voters geocoded into school attendance zones and census BGs for one school district, Marion County School District. Each dot represents a registered voter. The Appendix includes more details about the process and success rate of geocoding.
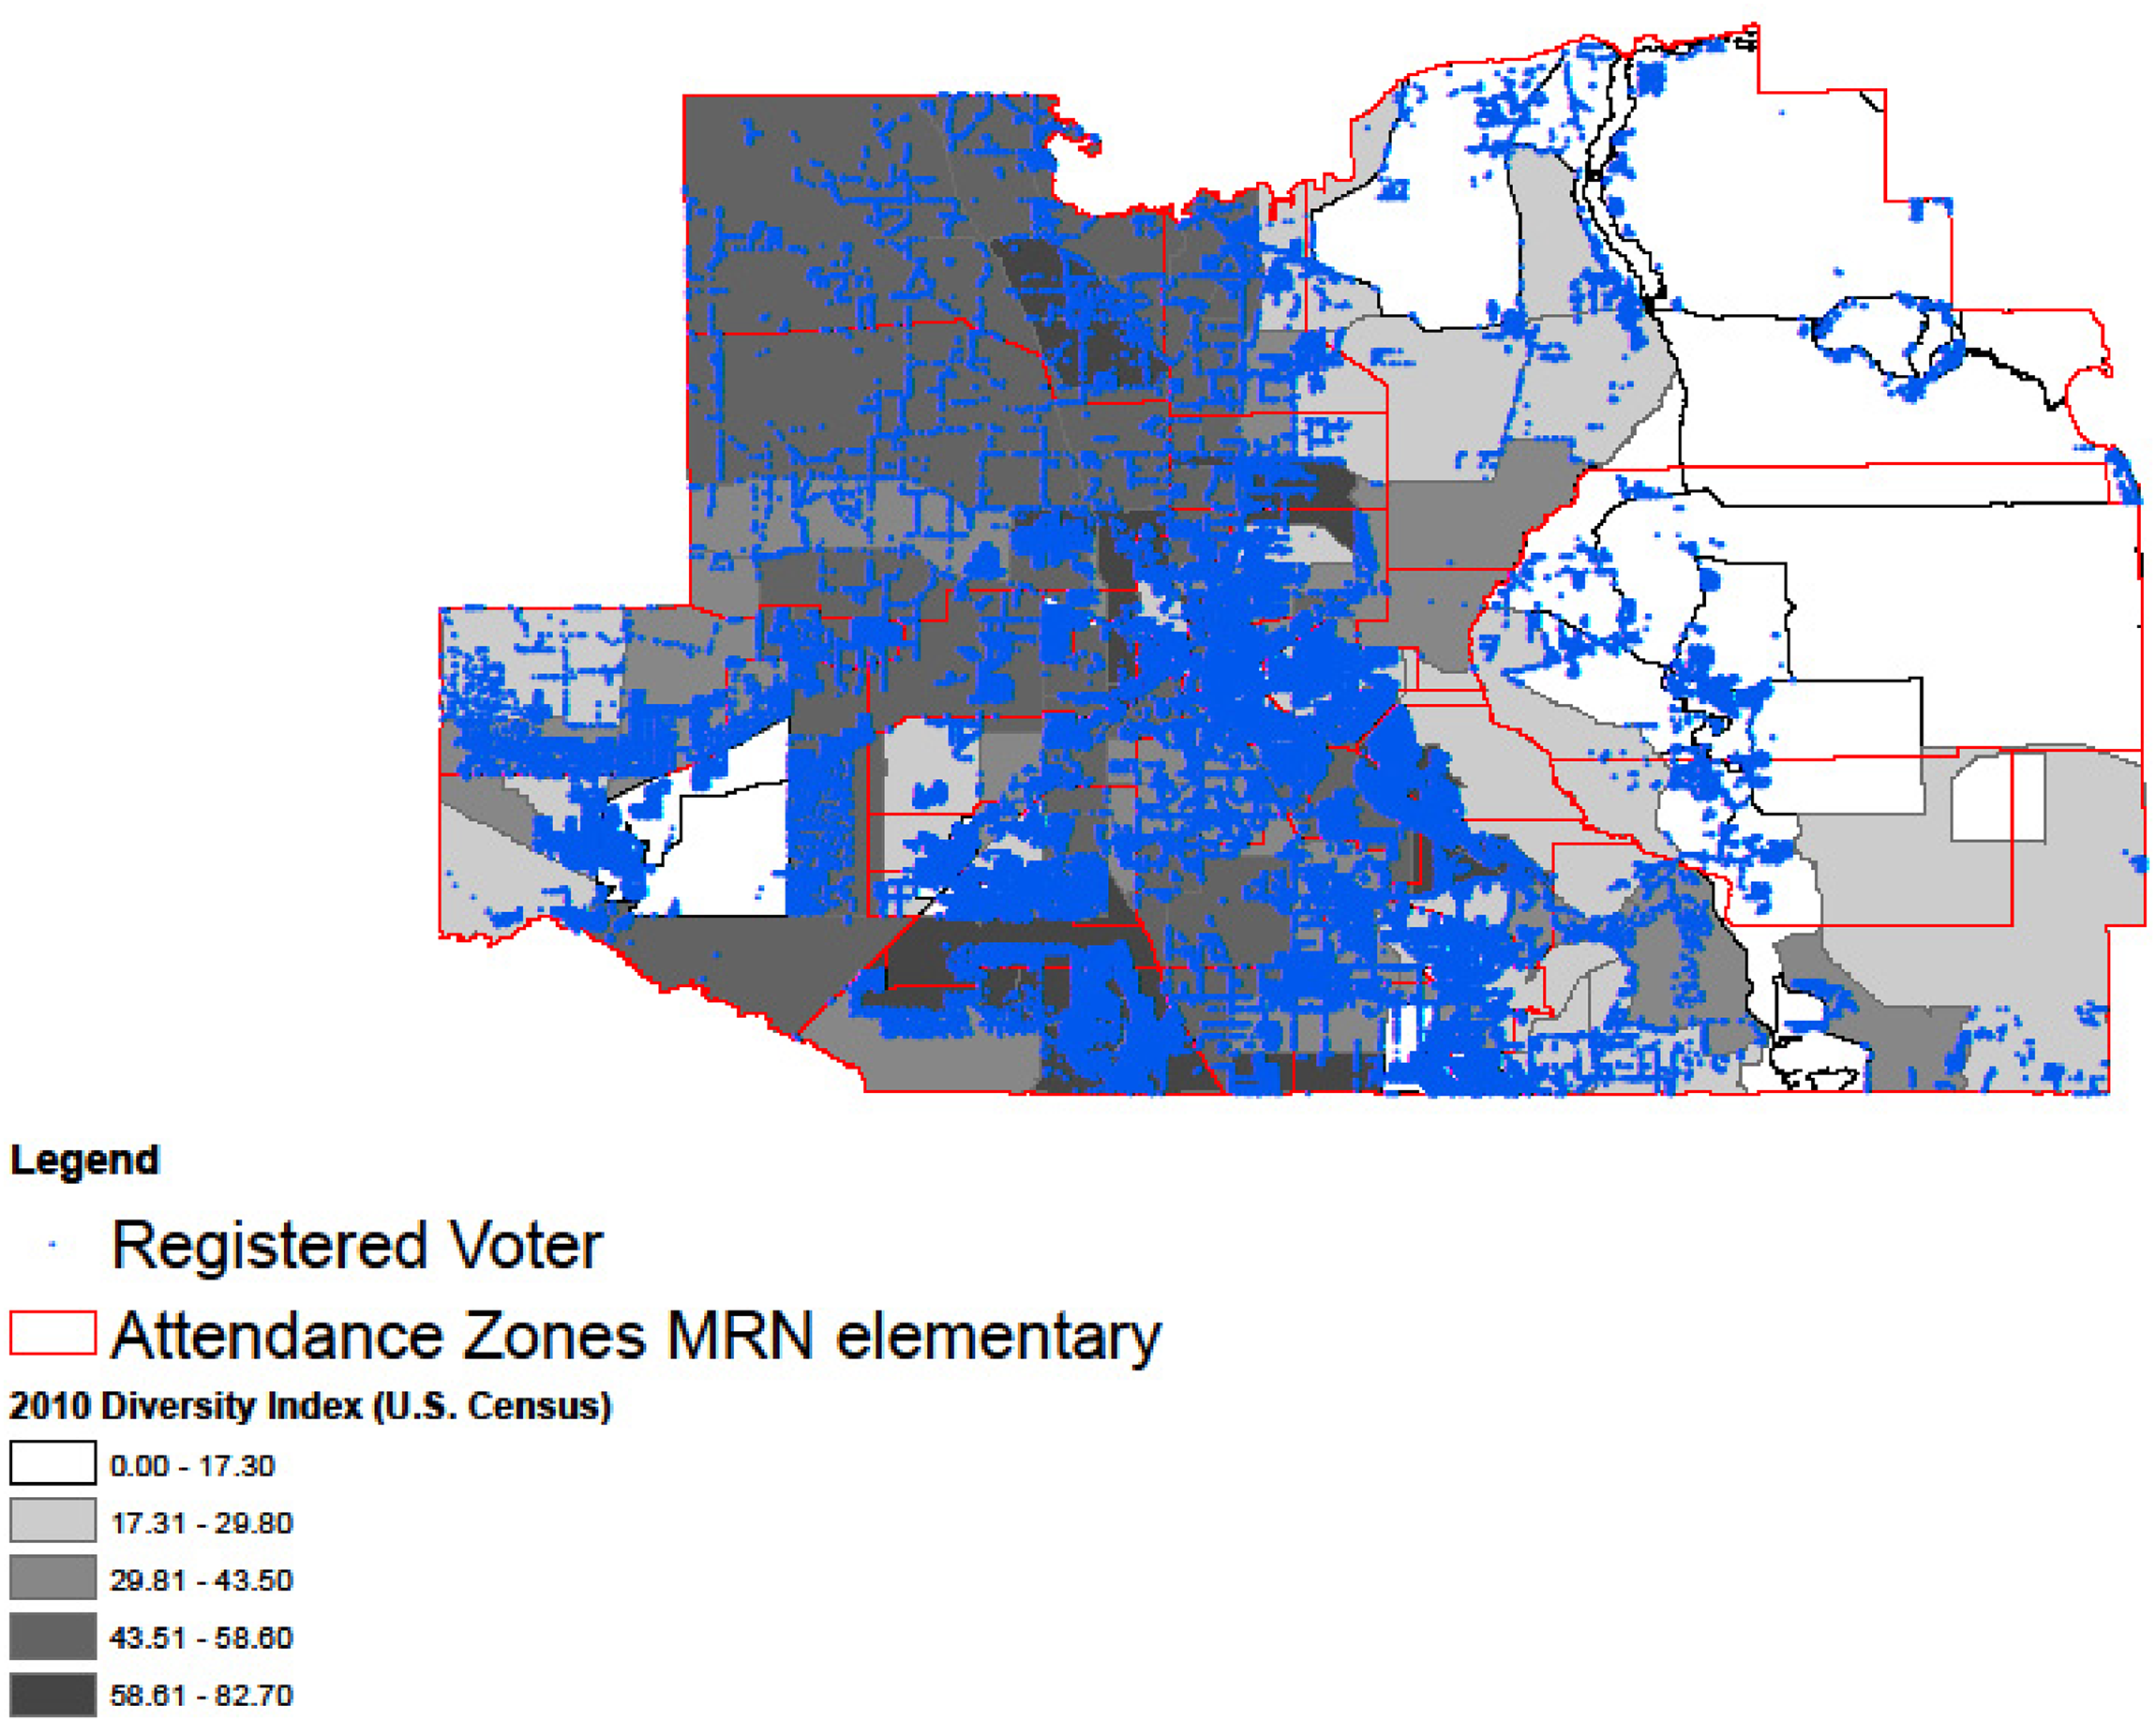
Registered voters mapped on to block group and school attendance zones.
While the Florida Voter Registration files do contain important information about a person, they do not contain other factors that are likely to influence a person's propensity to vote. Therefore, I obtained census tract data to supplement the individual level file. This approach is similar to Gimpel, Dyck, and Shaw (2004), who used census tracts and Barber and Imai (2014), who used census block data. Using the geocoded registered voters, I spatially joined each voter in the 2010 Census tract group that they resided in. 6
Tract information is used to describe the neighborhood in which a voter resides and allows me to test whether neighborhood characteristics effect the propensity to vote. Diversity can be measured in different ways. I include % White as well as the Diversity Index calculated by the Census for a tract. The index ranges from 0 to 1, where 0 indicates no diversity and 1 indicates very diverse. The map of Marion County on the left in Figure 3 plots the diversity index. There is significant variation within the county. I also include tract level information about the percent that own their home, the median household income, and median housing value.
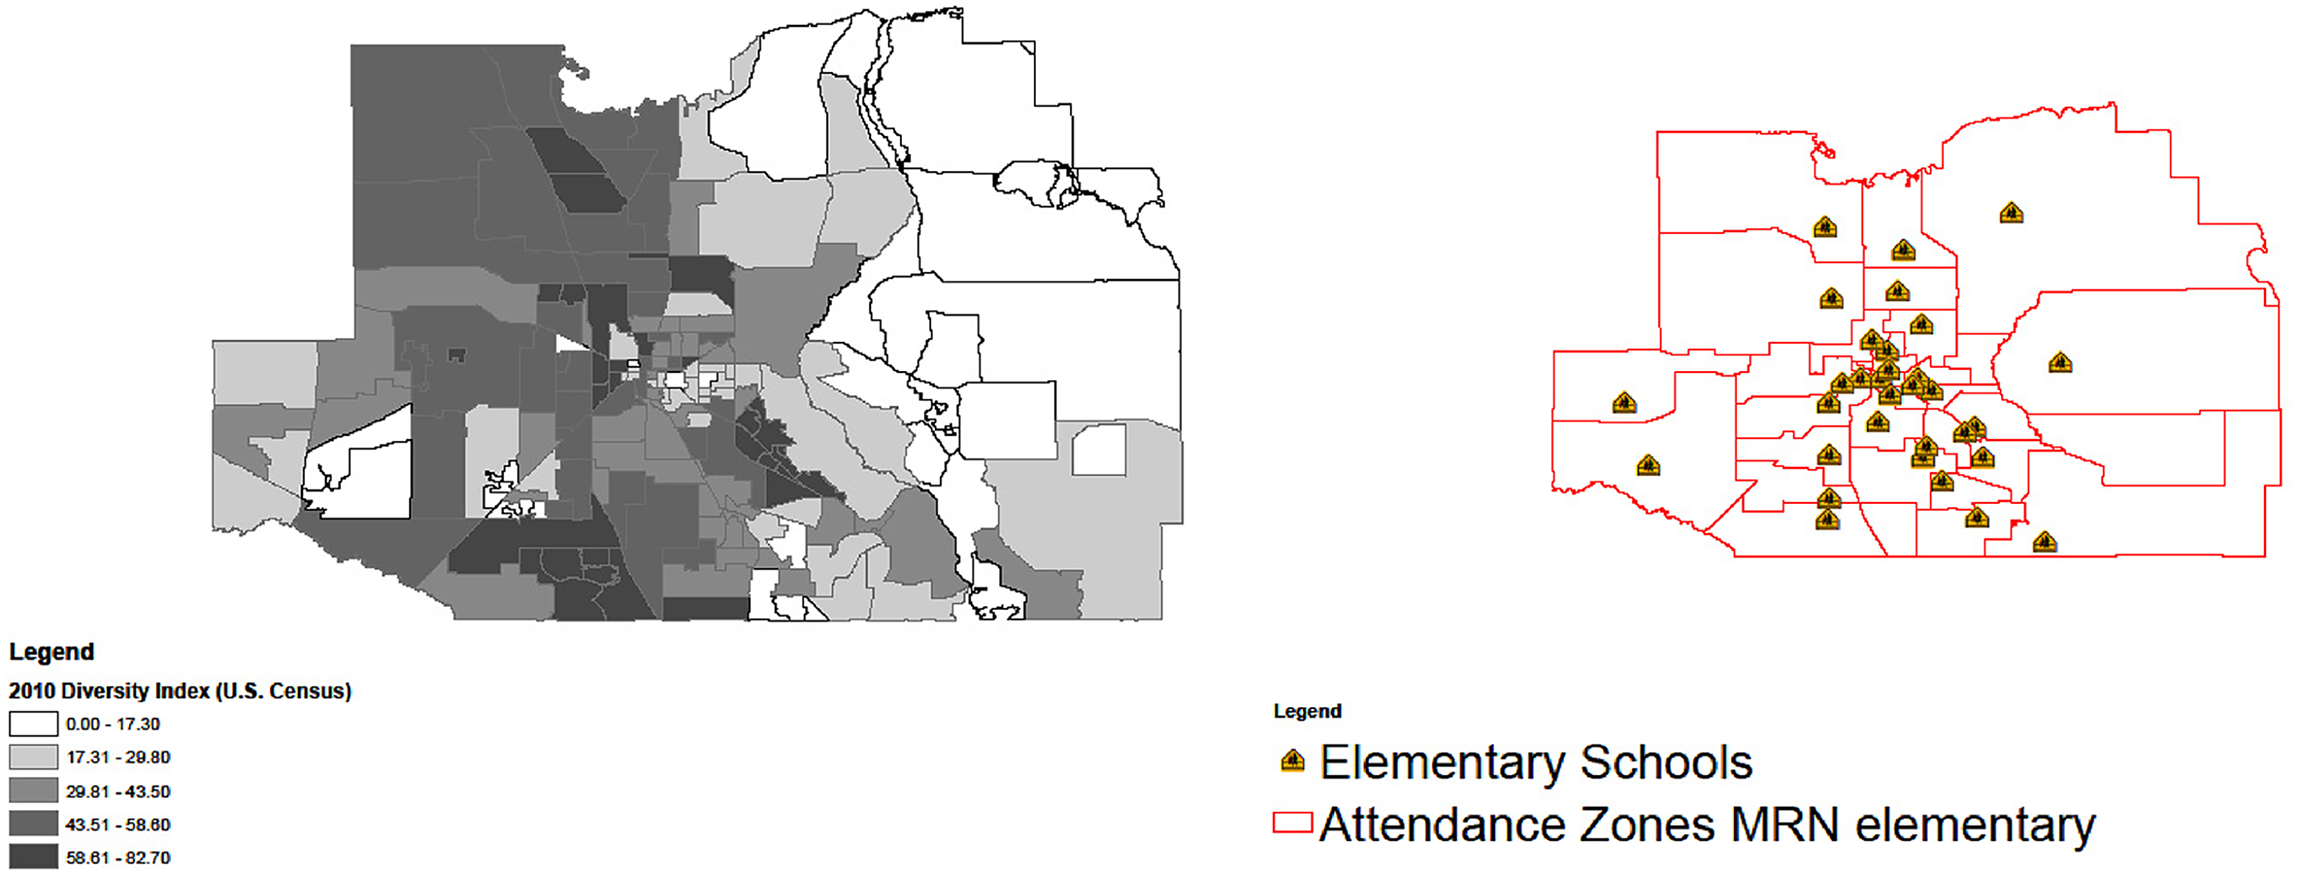
Marion county school district block group and school attendance boundaries.
Beyond just the community, characteristics of schools themselves might matter for turnout. I used data from the National Center for Education Statistics to spatially join voters in 2015 school attendance zones. 7 School attendance zones determine which school a child would attend, given the family's address. Therefore, each voter is assigned to their census tract and elementary school attendance zone. 8 Using data from the Florida State Department of Education, I am then able to see if gains in test scores or student demographics of their neighborhood school matter in turnout or passage of property tax increases. To capture these, I include the percent of students who passed the third grade math test, the % of students on free lunch within each school, the % of Black students, the % of Hispanic students, and the % of Asian students. The map of Marion County School District, which is on the right in Figure 3, shows school attendance zones and the location of the elementary school within each of those zones. It is information about each of those schools that is joined by a voter.
Model Specifications
Understanding what matters in an individual's propensity turnout is determined by my different factors at different levels. Individual, neighborhood, school, and school district characteristics are all likely to matter. To predict turnout, I use a linear probability model with the school district and year fixed effects. Linear probability models have several advantages over logit or probit models. They are easier to interpret and work better with fixed effects and interactions than logit models (Gomila 2020). 9 Robust standard errors are included in all models. Therefore, I am focused on what factors within a particular school district's election predict whether a person turns out to vote or not. As a reminder, most districts have multiple elementary schools within a district. Therefore, while all voters are voting on the same tax referendum, voters could experience very different school level factors.
Because the timing of an election within a year matters in who turns out to vote (Kogan, Lavertu, and Peskowitz 2018), I run separate models based on election timing. I focus on three subgroups: special elections, primary elections, and general elections. Special elections occur when the tax referendum vote does not coincide with state or federal primary or general elections. The tax referendum is often the only item on the ballot. I hypothesize that this is when school demographics are most likely to matter. I then run models when the tax referendum vote occurs while state and/or federal primary elections are occurring. Tax referenda are not the only item on the ballot. Similarly, I run models when the tax referendum vote occurs at the same time as state and/or federal general elections are occurring. In a final set of models, I aggregate the data to the precinct level to predict the percent of yes votes for the tax referendum. All of the elections that I include have a vote on a tax referendum. I do not include elections that do not have a tax referendum vote in the main text but do in the Appendix.
Predicting Who Turns Out to Vote
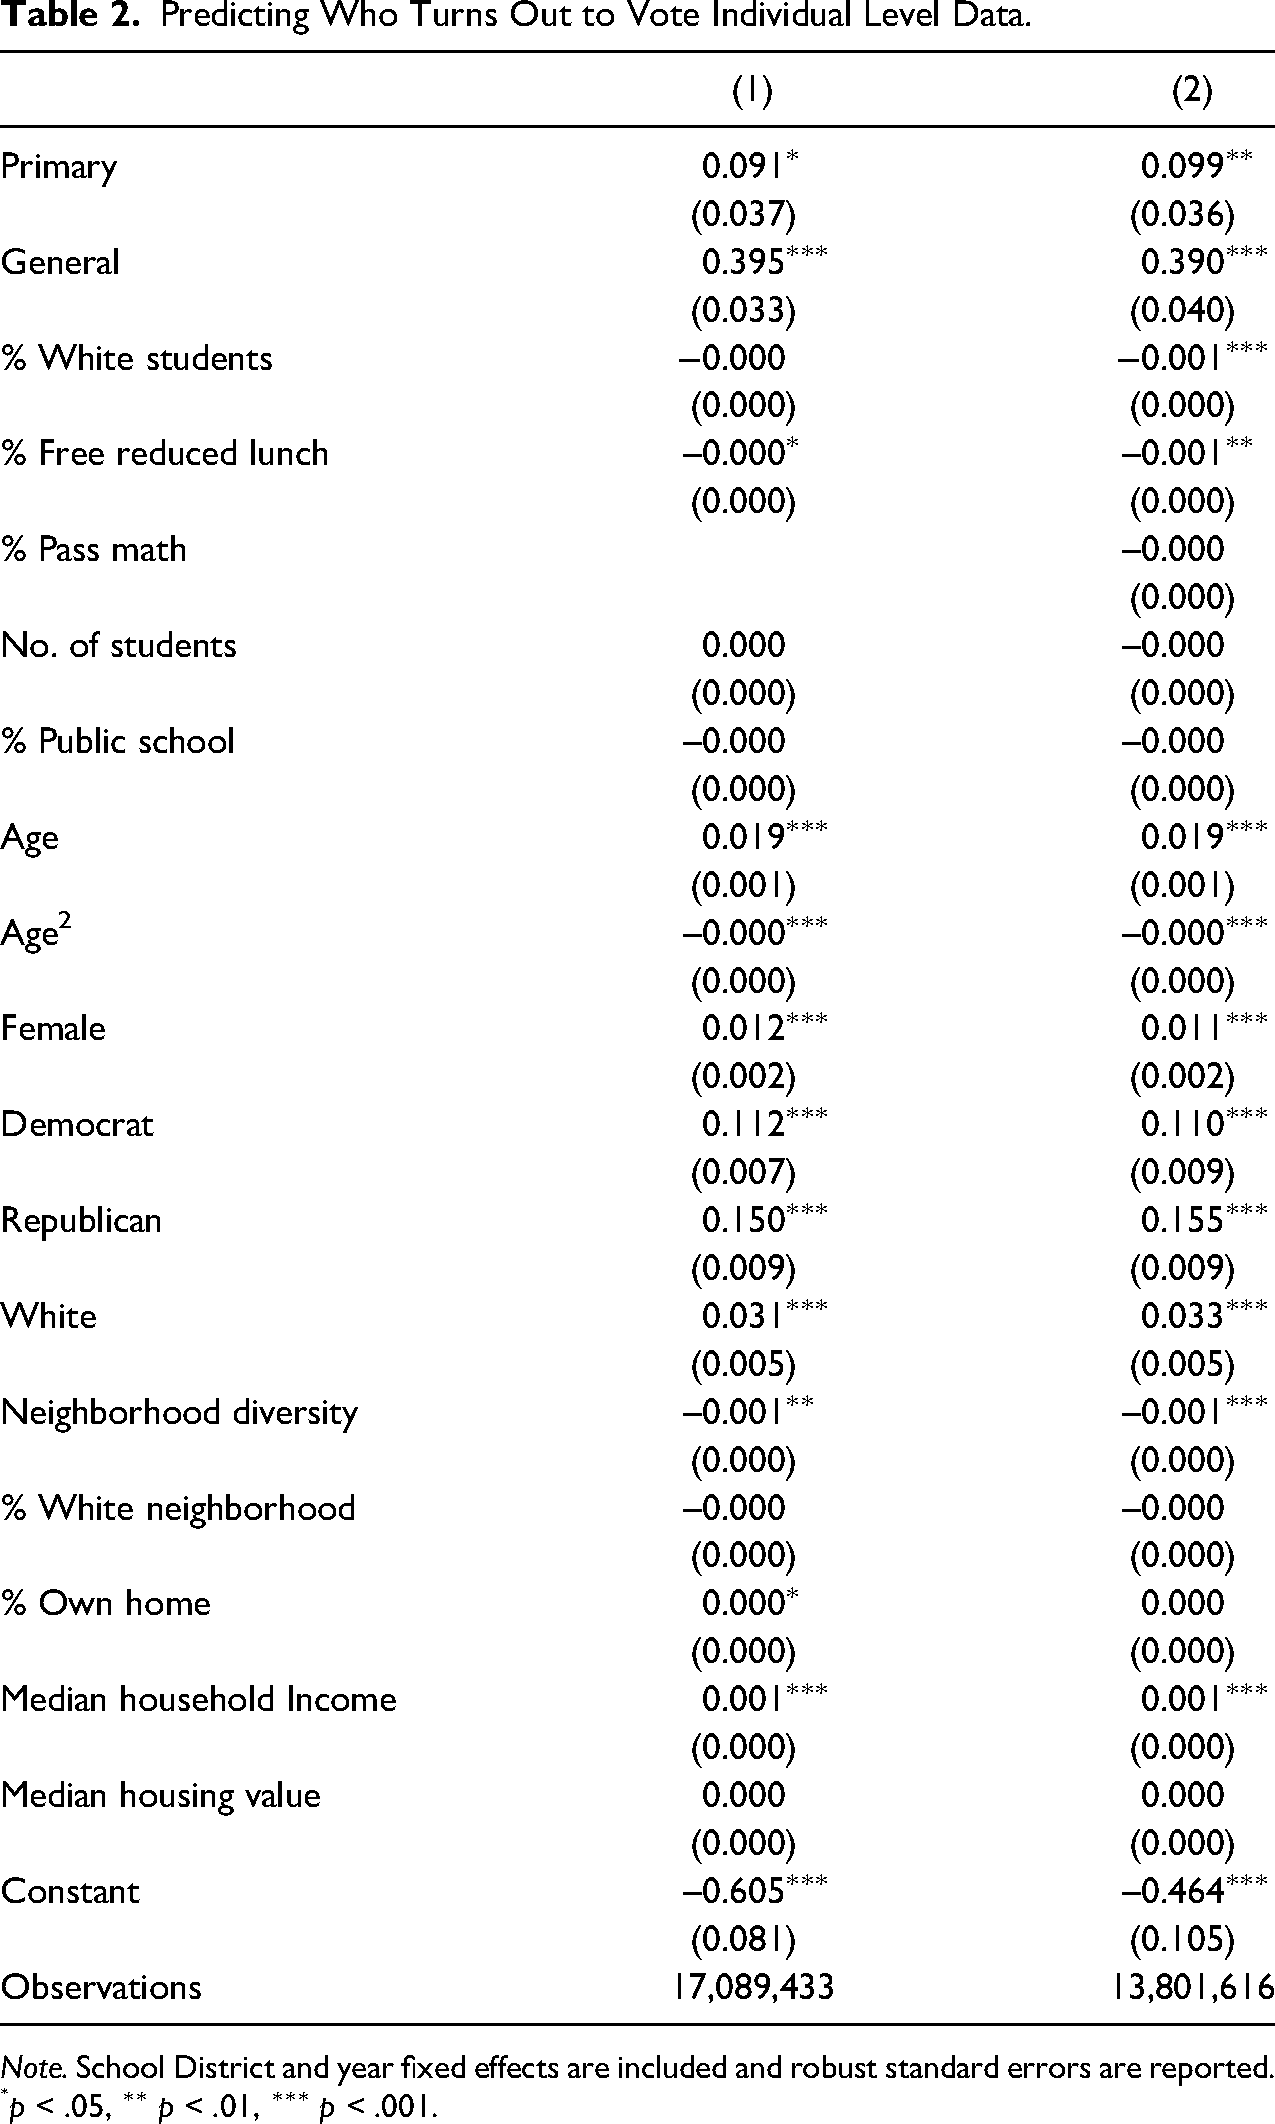
How one vote determines the outcome of tax referendums, but another important question is who is turning out to vote. I focus on predicting turnout in an election using a linear probability model with the school district and year fixed effects and robust standard errors. 10 The dependent variable is coded 1 if a person turned out to vote and 0 otherwise. The universe is all registered voters. Table 2 contains the results for all elections that had a school referendum vote. Because of missing data with test scores, column 1 excludes test scores as a predictor and column 2 includes test scores. Coefficients are consistent between the two models. Dummy variables are included for primary and general elections, with special elections being the control group. Primary elections increase the likelihood of turnout by 9 percentage points while general elections increase the likelihood of turnout by 39 percentage points over special elections. Focusing individual level characteristics, I find that older registered voters, those that identify as female, those that identify as Democrat or Republican (as opposed to independent or not affiliated with a party), and those that identify as White are more likely to vote in an election, conditional on being registered to vote. This is consistent with the literature.
Predicting Who Turns Out to Vote Individual Level Data.
Note. School District and year fixed effects are included and robust standard errors are reported.
p < .05, ∗∗ p < .01, ∗∗∗ p < .001.
When looking at school characteristics, the percent of students on free and reduced lunch within a voter's school attendance zone is related to the likelihood to vote. There is a negative correlation between the two: the more students on free or reduced lunch in a voter's local school, the lower likelihood of voting. Number of students in a school, percent of students in public school, and test scores are not associated with the likelihood of voting. Percent of students who are White in a school is also negatively correlated with turnout when test scores are included in the model. Neighborhood characteristics are also associated with turnout. Voters in areas with higher median household income are more likely to turnout to vote, while voters in areas with higher diversity are less likely to vote, holding all else constant.
In the next set of models, I run models by election type to see if different characteristics matter based on the type of election held. Table 3 contains the results for these models. These models include the percent of students who pass third-grade math. Table A1 in Appendix A is the same but excludes tests from the models. Results are consistent between the two. These models allow me to test whether characteristics matter differently depending on the type of election. Individual and neighborhood characteristics are consistent with the full model. However, there are some differences in magnitude for coefficients. For example, the coefficients for Democrats or Republicans are the largest for primary elections. This is logical since primary elections are about electing candidates for a party’s general election, and we would expect partisan voters to participate at higher rates than independent voters. The coefficient on age is triple the size for general elections than special elections, and gender is not significant in primary elections. Age, gender, and partisanship are likely to affect how people vote on a school referendum vote.
Predicting Who Turns out to Vote Individual Level Data.
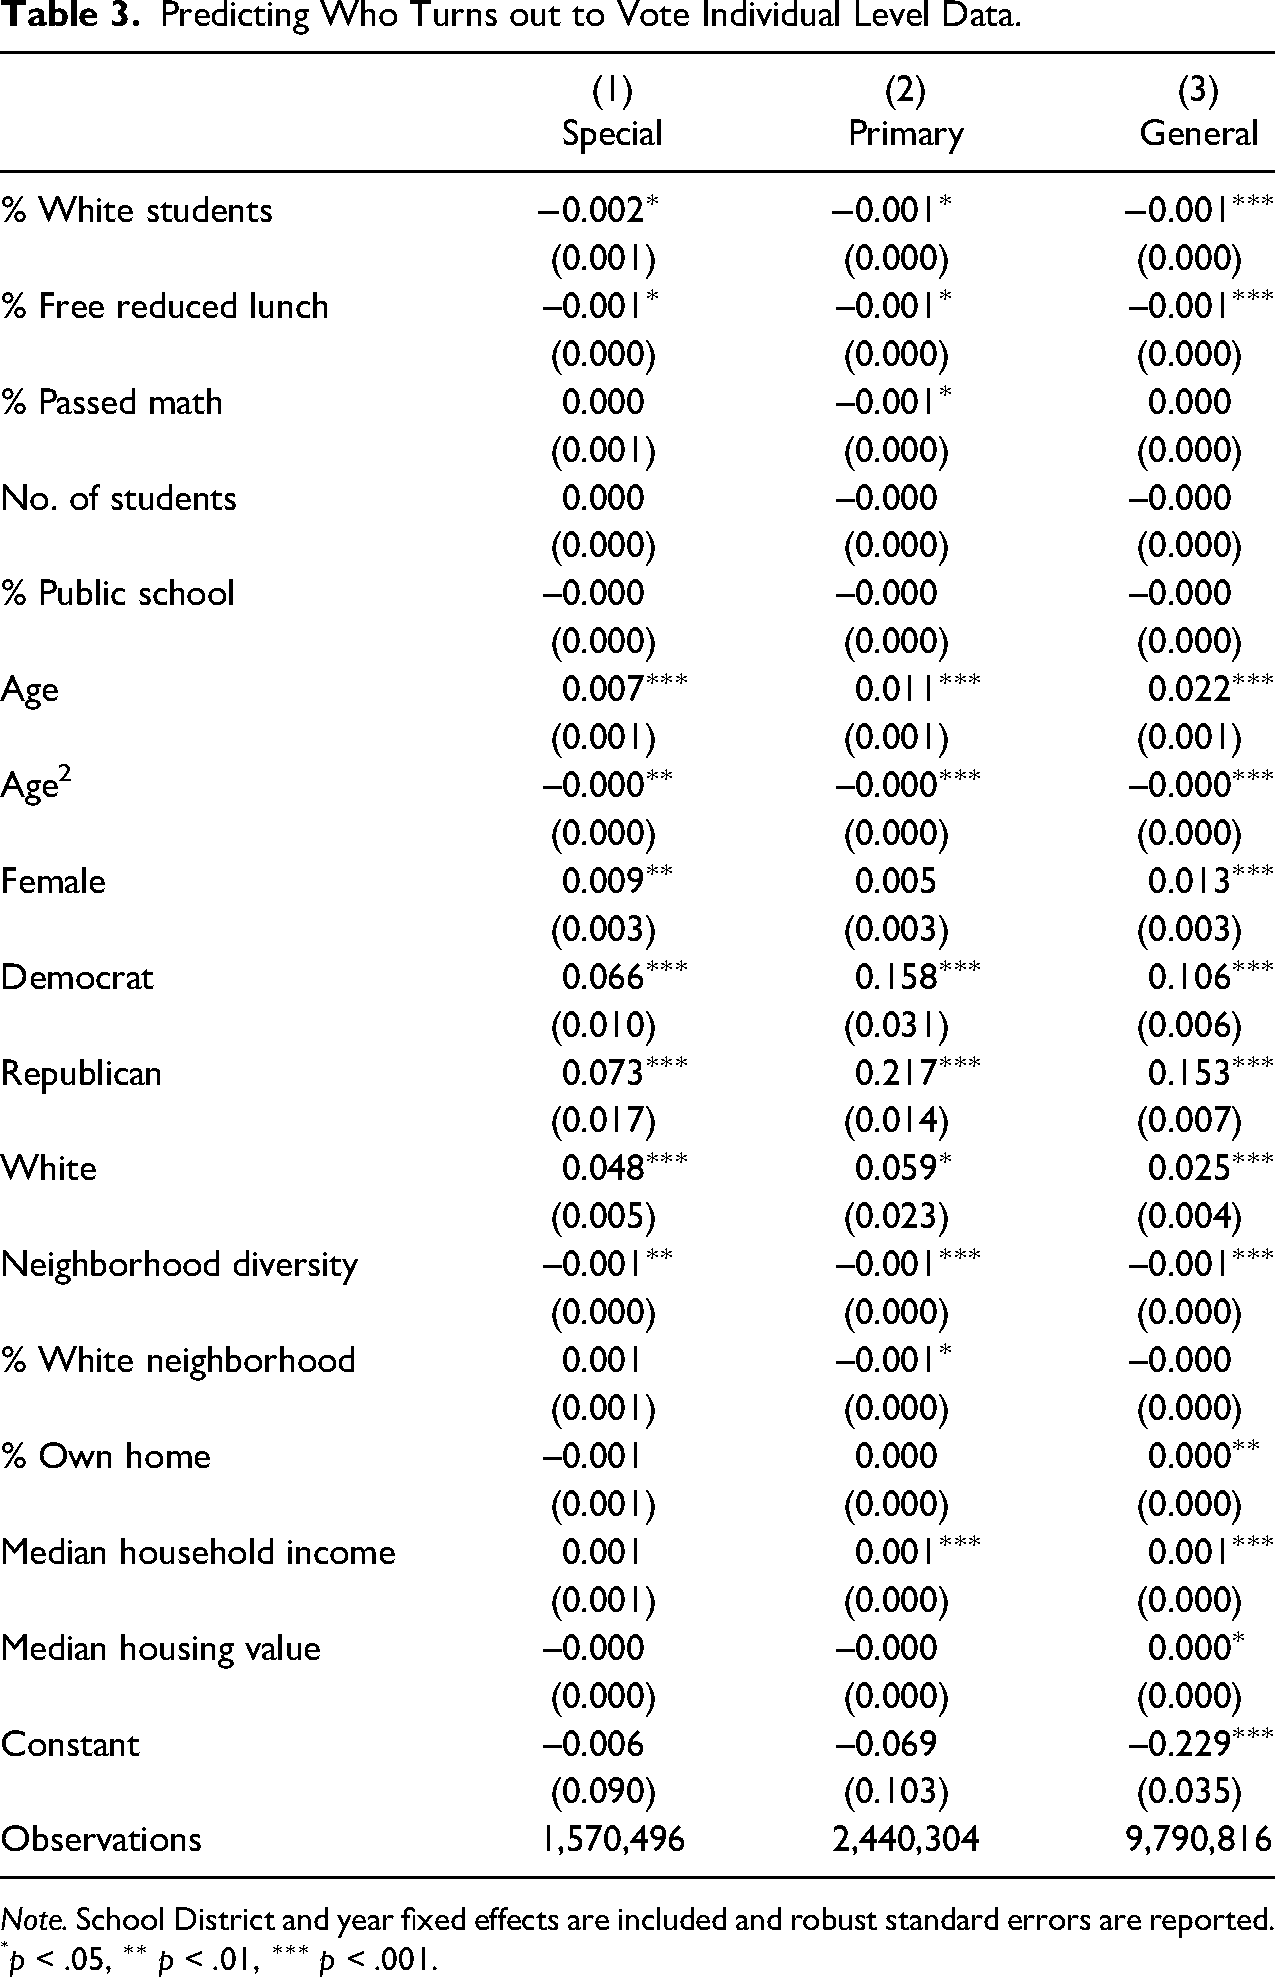
Note. School District and year fixed effects are included and robust standard errors are reported.
p < .05, ∗∗ p < .01, ∗∗∗ p < .001.
In terms of school characteristics, direction and magnitude are consistent across election types. Figure 4 plots the likelihood to vote based on the percent of free and reduced lunch students by type of election from each of the models in Table 3. While the overall likelihood to vote depends greatly on the type of election, the relationship between percent of students on free and reduced lunch and voting is consistent and negative. Interestingly, test scores are only significant for primary elections. The percent of students who are White is negatively associated with the likelihood to vote. Direction and magnitude are the same across election types.
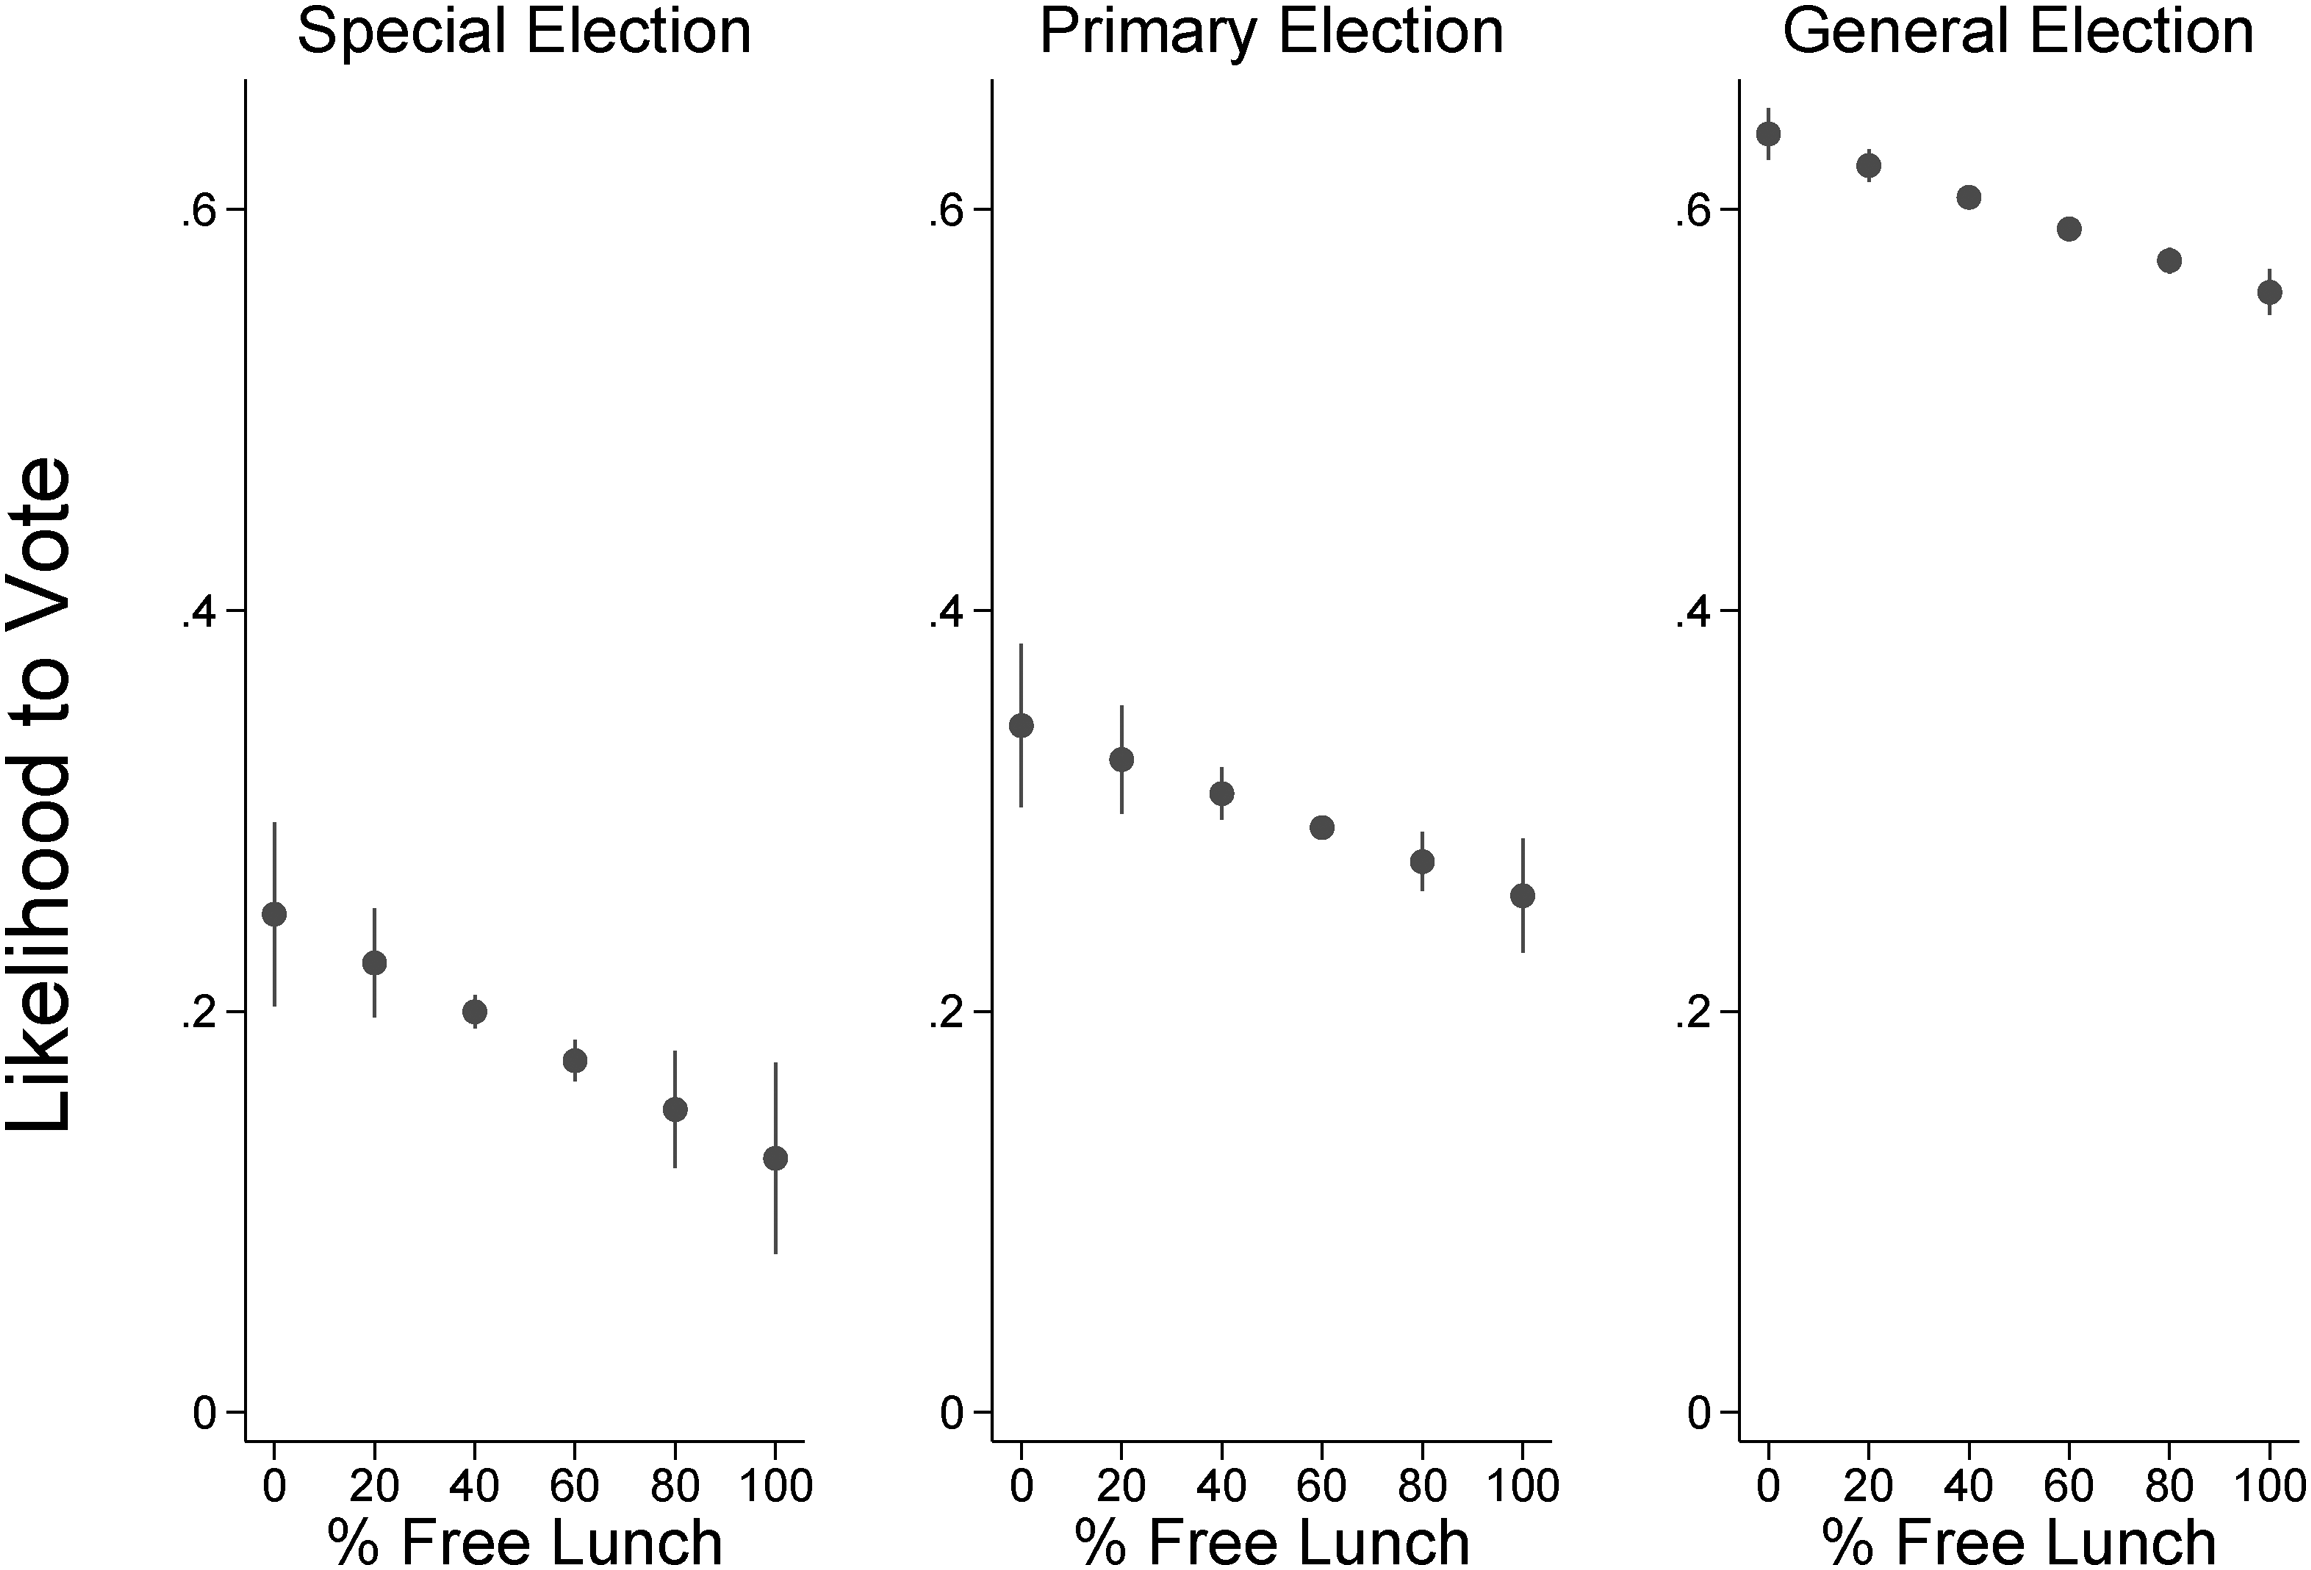
Predicting turnout in school district referendums. Predicting the likelihood of voting based on % of free lunch students in school attendance zone by election type.
Another way to test how school tax referendum votes might affect voting behavior is to see if school characteristics are predictive of turnout when there is
Predicting who turns out for General Election with no school referendum.
In terms of schools, there are some similarities but also some important differences. Interestingly, the % of students in public school is statistically significant and in a negative direction for both primary and general elections with
Predicting Passage of Referendum
Because voting is done via secret ballot, I do not know how individuals voted. I, therefore, obtained precinct level information to predict the percent of people who voted yes for either operational or capital expenses within each precinct. I aggregate individual level data to precinct data. This only includes those who voted in a particular election and used the aggregate characteristics of those voters to predict the % yes within a district. I employ school district and year fixed effects. 12
Many places redrew precinct boundaries after the 2010 census. I was unable to properly match 2010 data to the other election years in several counties. Therefore, 2010 is excluded from this analysis and the results focus on the 2012–2018 elections. As a check on the data, I compared the number of people I had that voted in a precinct to the total number of votes in a specific election. The correlation between the number of people and votes cast was 0.987. The very small differences can be attributed to ballot roll-off, people being removed from the files due to a move, and the occasional precinct file that grouped absentee voters all together instead of by individual precinct. In total, I was able to find precinct-level voting information for 7,969 precincts from 2012 to 2018. This includes 309 precincts with special elections, 1,195 precincts with primary elections, and 6,465 general elections. When percent math is included in the model, the number of precincts is 6,712. Results are consistent between the two. Models that have the full data and do not include test scores can be found in the Appendix.
Figure 6 shows the distribution of % yes vote by precinct. While the majority of precincts did vote in favor of passage, there is significant variation at the precinct level. To illustrate how much variation there is between precinct voter characteristics and school level characteristics, Figure 7 shows the distribution of the percent of Black students by precinct where White voters make up less than 50% of the precincts (left) and for precincts where White voters make up more than 50% of the precinct (right). When a precinct has less than 50% White voters, there is significant variation in the percentage of Black students in the nearest school. However, in precincts where the majority of voters are White, the distribution of Black students is skewed toward having a smaller percentage of Black students in schools. While school and neighborhood characteristics are correlated, they are not highly correlated. The percent of Black students in a school and the percent of the neighborhood that is Black is correlated at 0.48. The percent of students on free and reduced lunch is negatively correlated with median household income (−0.42), median housing value (−0.31), and percent of home ownership (−0.27). I also then address how they can be separated. This does illustrate that school characteristics and neighborhood characteristics are not the same.

Percent yes vote by precinct.
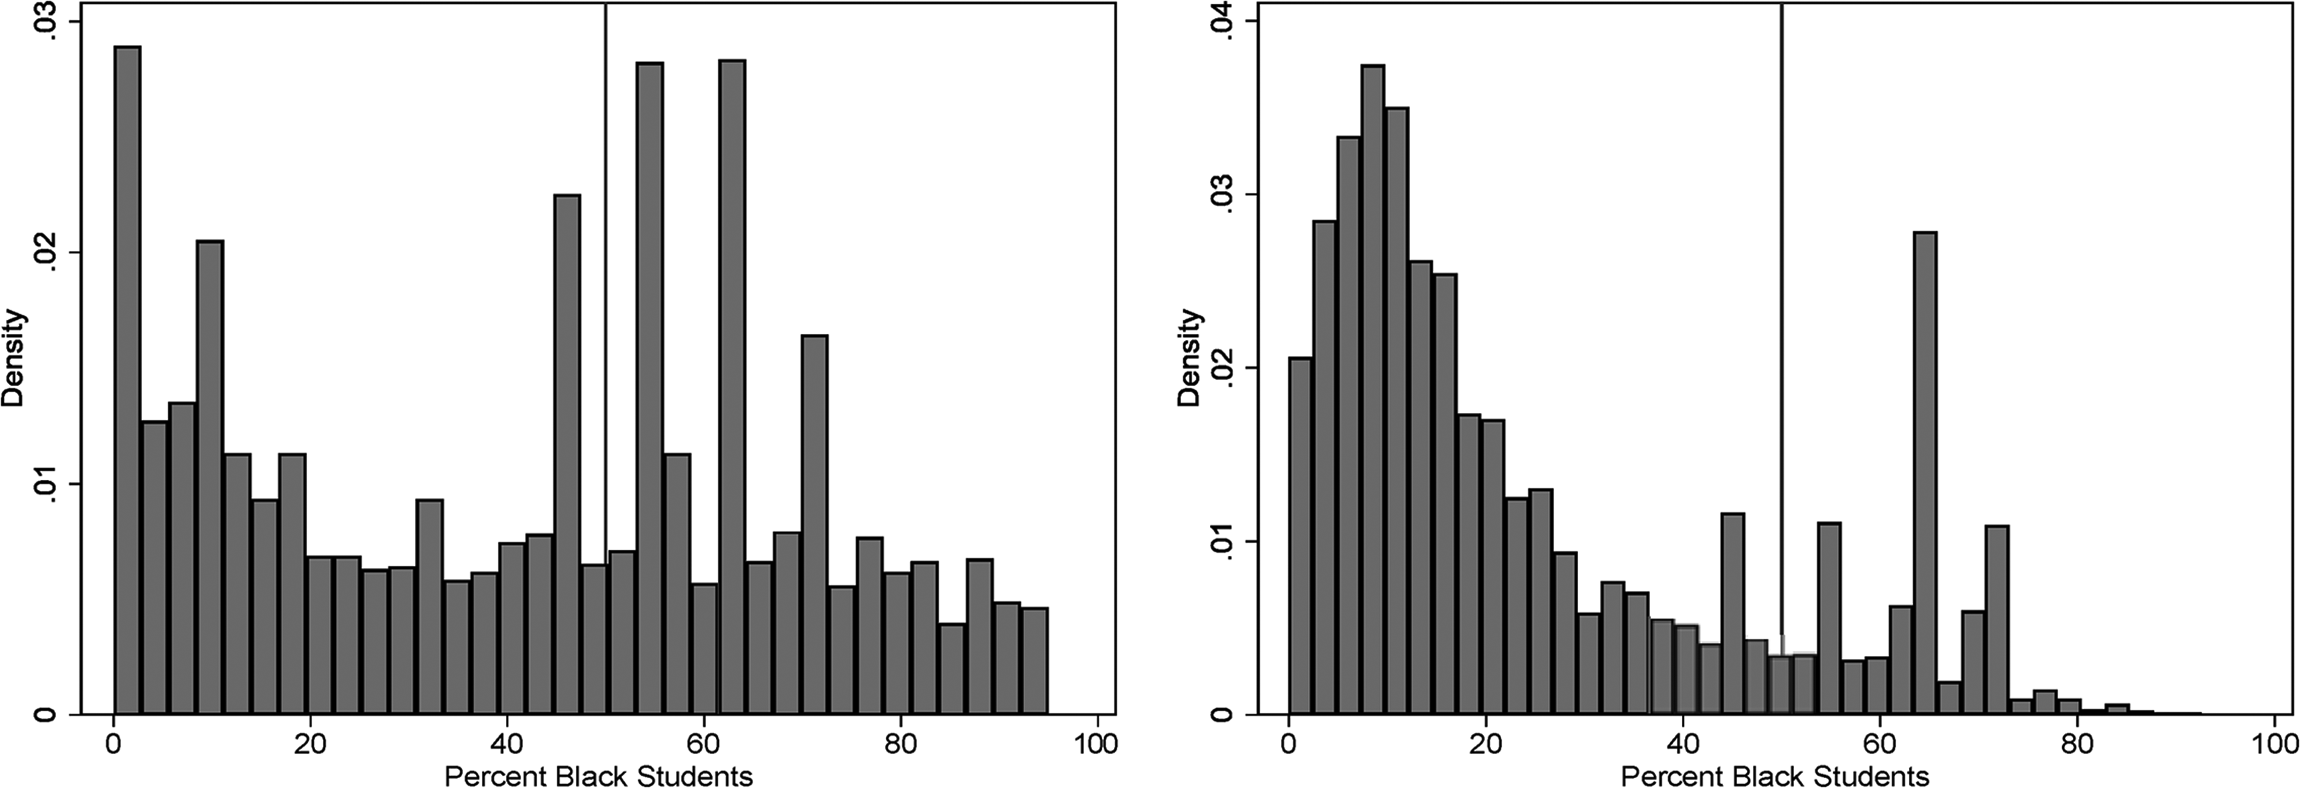
Percent Black students by % White voters in a precinct.
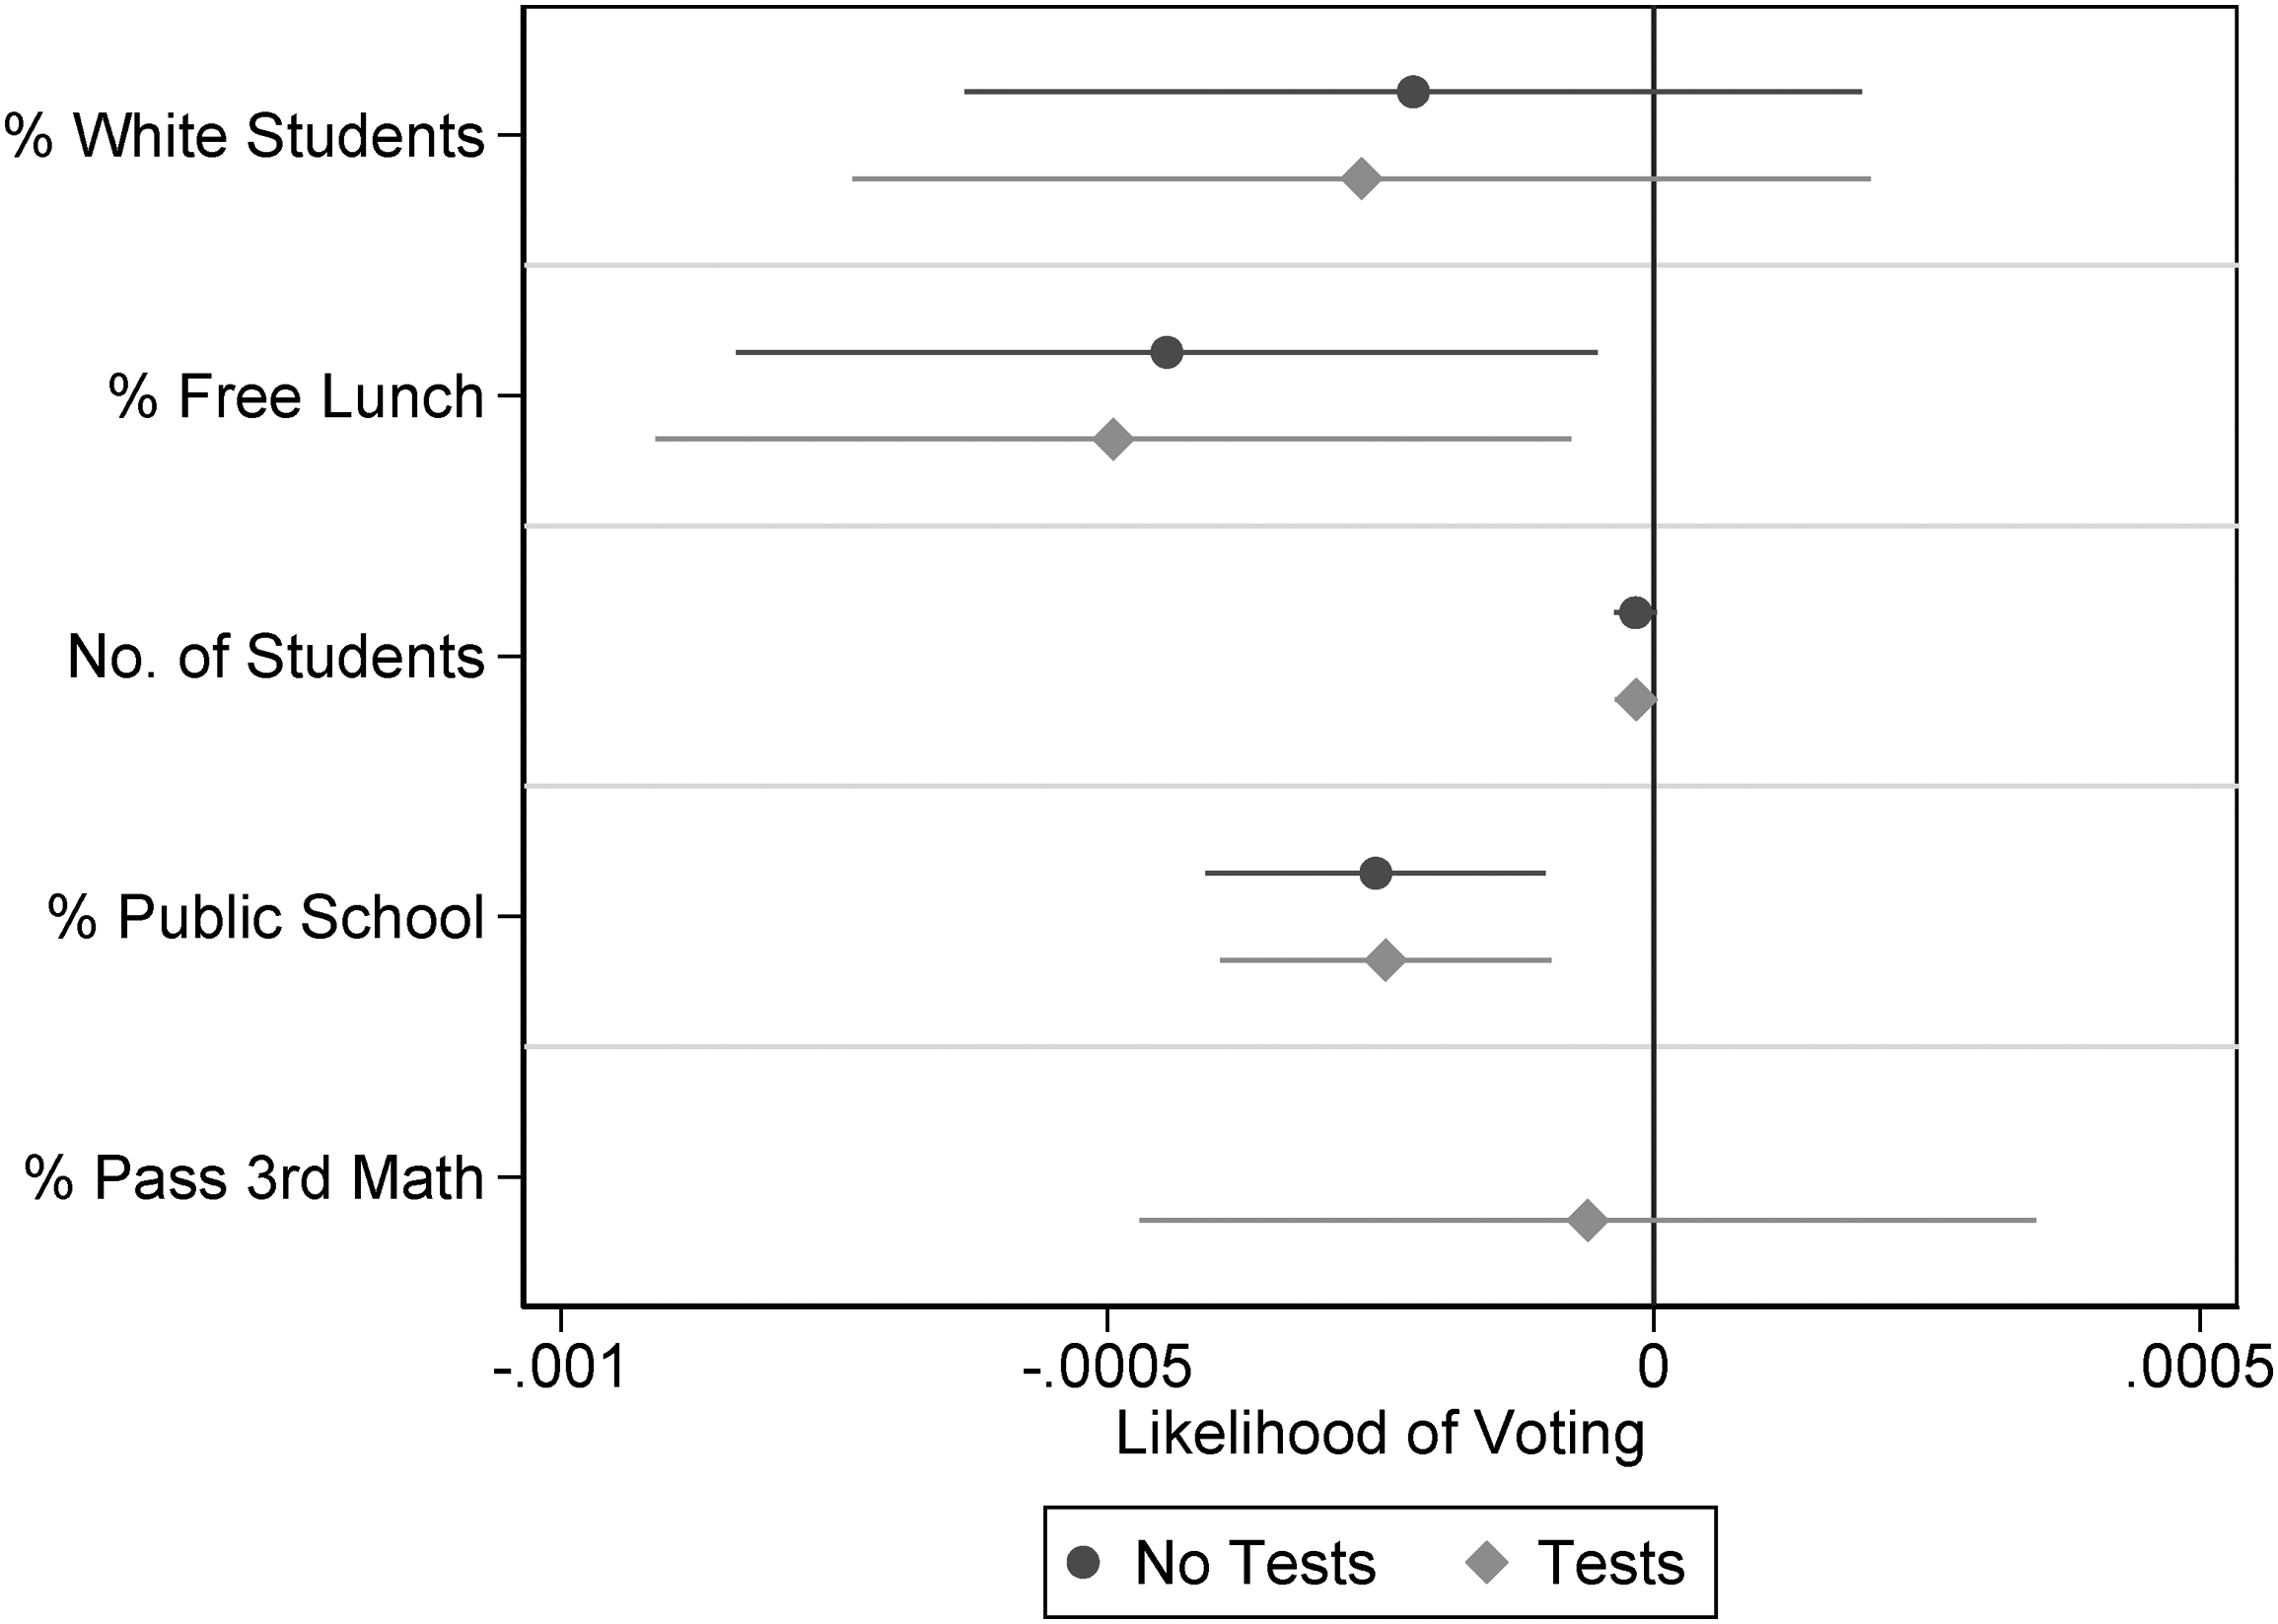
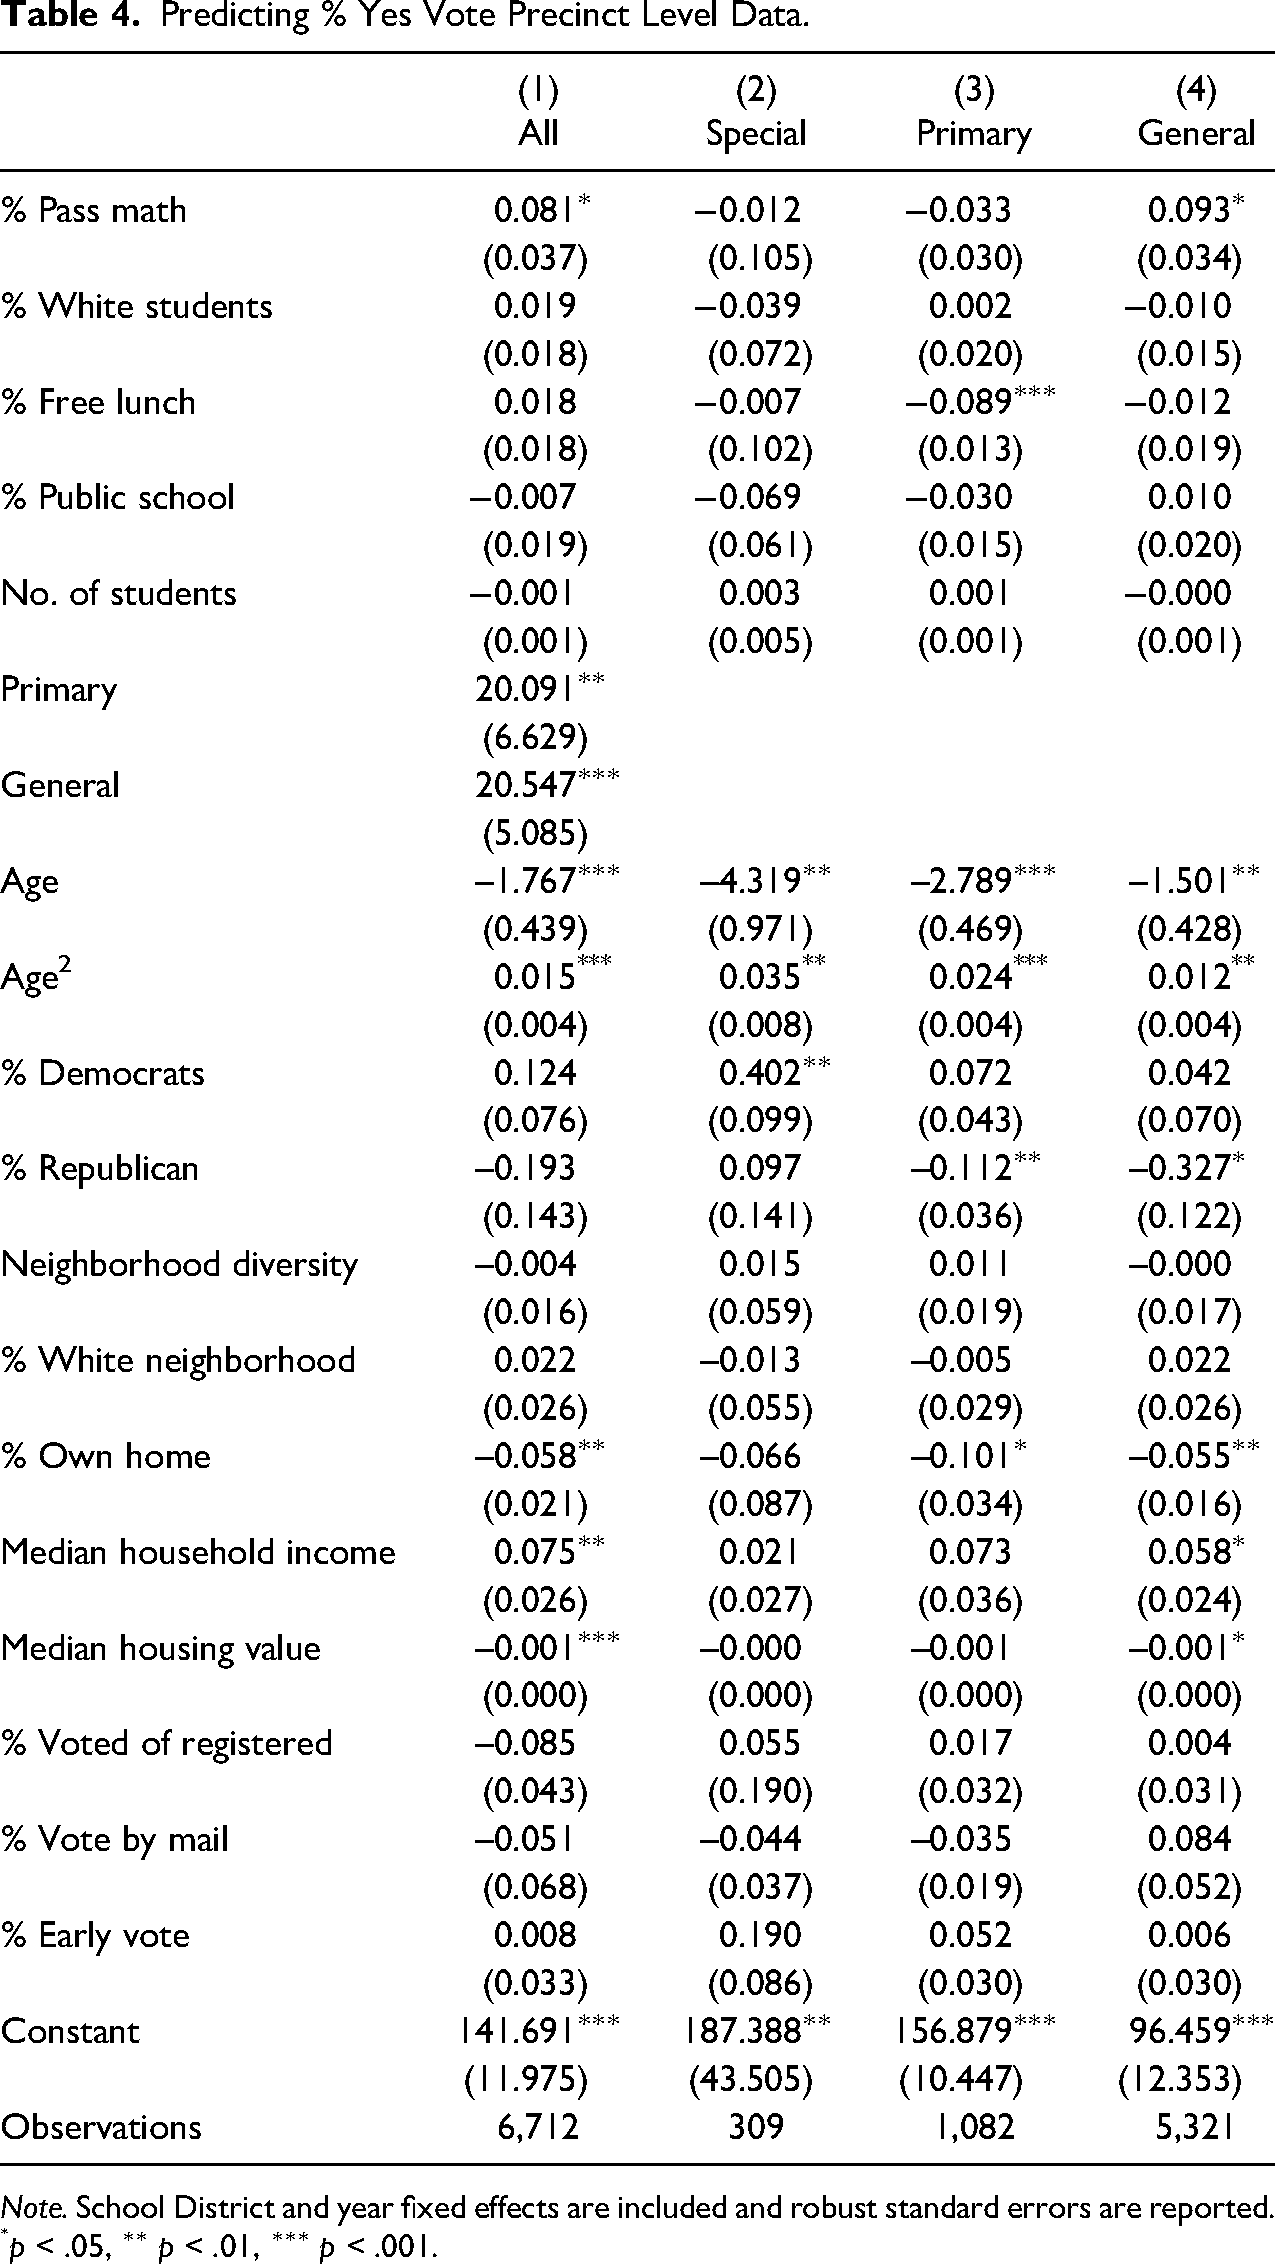
Table 4 contains the results from four models: all elections, special elections, primary elections, and general elections. Figure 8 plots the 95% confidence intervals for the school characteristic variables across the four models. Table A4 in Appendix A reruns the models without testing data. These models include school district fixed effects. Therefore, interpretation of coefficients is within a school district. Column 1 includes results from all elections with a tax referendum vote and dummy variables for a primary or general election. Columns 2–4 break out the data by election timing. In addition to the variables included in the previous models, I add three variables about the method of voting. I include the percent of the vote that is by mail, the percent of the vote that was early voting, and the percent of registered voters that voted to see if the method of voting or turnout affected the overall percent of yes vote.

95% confidence intervals on school characteristic coefficients for % yes vote.
Predicting % Yes Vote Precinct Level Data.
Note. School District and year fixed effects are included and robust standard errors are reported.
p < .05, ∗∗ p < .01, ∗∗∗ p < .001.
In the overall model with all election types, the percent of students who pass third-grade math in a precinct is associated with higher passage rates, but no other school characteristics are. That is, for each additional percentage increase in passing third-grade math in a school, we would expect the vote for passage to increase by 0.081 percentage points. When breaking down the data by election timing, test scores matter most when it is a general election but not for special or primary elections. For special elections, no school characteristics are associated with a % yes vote. For primary elections, the percent of students on free and reduced lunch is negatively associated with % yes vote.
In terms of voter and neighborhood characteristics, they are consistent with expectations. Age is highly significantly related to the percent yes vote, with areas that have higher mean ages voting at lower percentages for tax referendums. Higher home ownership is associated with decreased support for tax referendum as is higher median housing values. Because the majority of tax referendum votes are for property tax increases, this shows that the people that are most likely to be affected by the tax increase are less likely to support it. However, the higher household median income is associated with an increase in the % yes vote. As previous research has shown, the composition of voters tends to be different in terms of partisanship, ideology, and age for different election types. Special elections tend to have a larger share of older voters and primary elections tend to have a larger share of partisan voters. Models 2 through 4 provide further evidence that the composition of voters is different across election types. While most coefficients are consistent in a direction across the three, the magnitude is different. For example, the percentage of Democrats is only statistically significantly related to the % yes vote in special elections. Special elections have much lower turnouts, but those who have higher interests are likely to come out to vote, such as teachers’ unions. Primary elections tend to have more partisan voters (as opposed to independents). This model finds that precincts with more Republican voters are likely to vote yes at lower rates in primary and general elections. Age is always negatively associated with % yes vote, but the coefficient in the special election model is almost three times as large as the general election model.
Conclusion and Limitations
While individual characteristics do matter, people do respond to the space around them in both turning out to vote and how they vote for tax referendums for schools. Pairing the individual level turnout data with the precinct level data, I find that there are differences in the composition of voters across election types and these voters are responding to different characteristics of schools. General elections, which have the largest turnout, are the only time in which school performance is statistically related to the percent of yes vote for tax referendum. The % yes vote in special elections, which have a much lower turnout, are not related to any school characteristic. This is likely because low turnout elections favor special interest groups, like teachers’ unions, who are likely to be in support of the tax referendum. Perhaps more interesting is that the percent of students in public schools is negative and statistically significant for elections that do not have a tax referendum on the ballot. When there is no tax referendum on the ballot, individuals that live in areas with a higher percentage of students in private schools are more likely to turnout. This suggests that having a tax referendum on the ballot increases turnout in areas with a higher percentage of students in public schools.
The percent of students on free and reduced lunch is related to the likelihood of turnout regardless of a tax referendum on the ballot. This suggests that something else is driving this relationship. One possibility is information flows similarly to what Tam Cho, Gimpel, and Dyck (2006) find. Schools are often a source of information for a community and are also often a polling place in elections. The way in which a student receives free or reduced lunch is based on parental income. Therefore, schools with a higher percentage of students on free and reduced lunch are likely to have higher poverty rates. 13 These schools could have less resource to share information. It is also possible that if these schools are also polling places that could also affect how people vote. While neighborhood and school characteristics are correlated, they are not perfectly correlated. In areas that have educational exit options, such as private schools or charter schools that do not rely on neighborhood attendance zones, public schools are less reflective of their surrounding community (Bischoff and Tach 2018). Demographic shifts in race and ethnicity are more concentrated in the school-age population than in older populations. This can further drive differences between school and neighborhood characteristics.
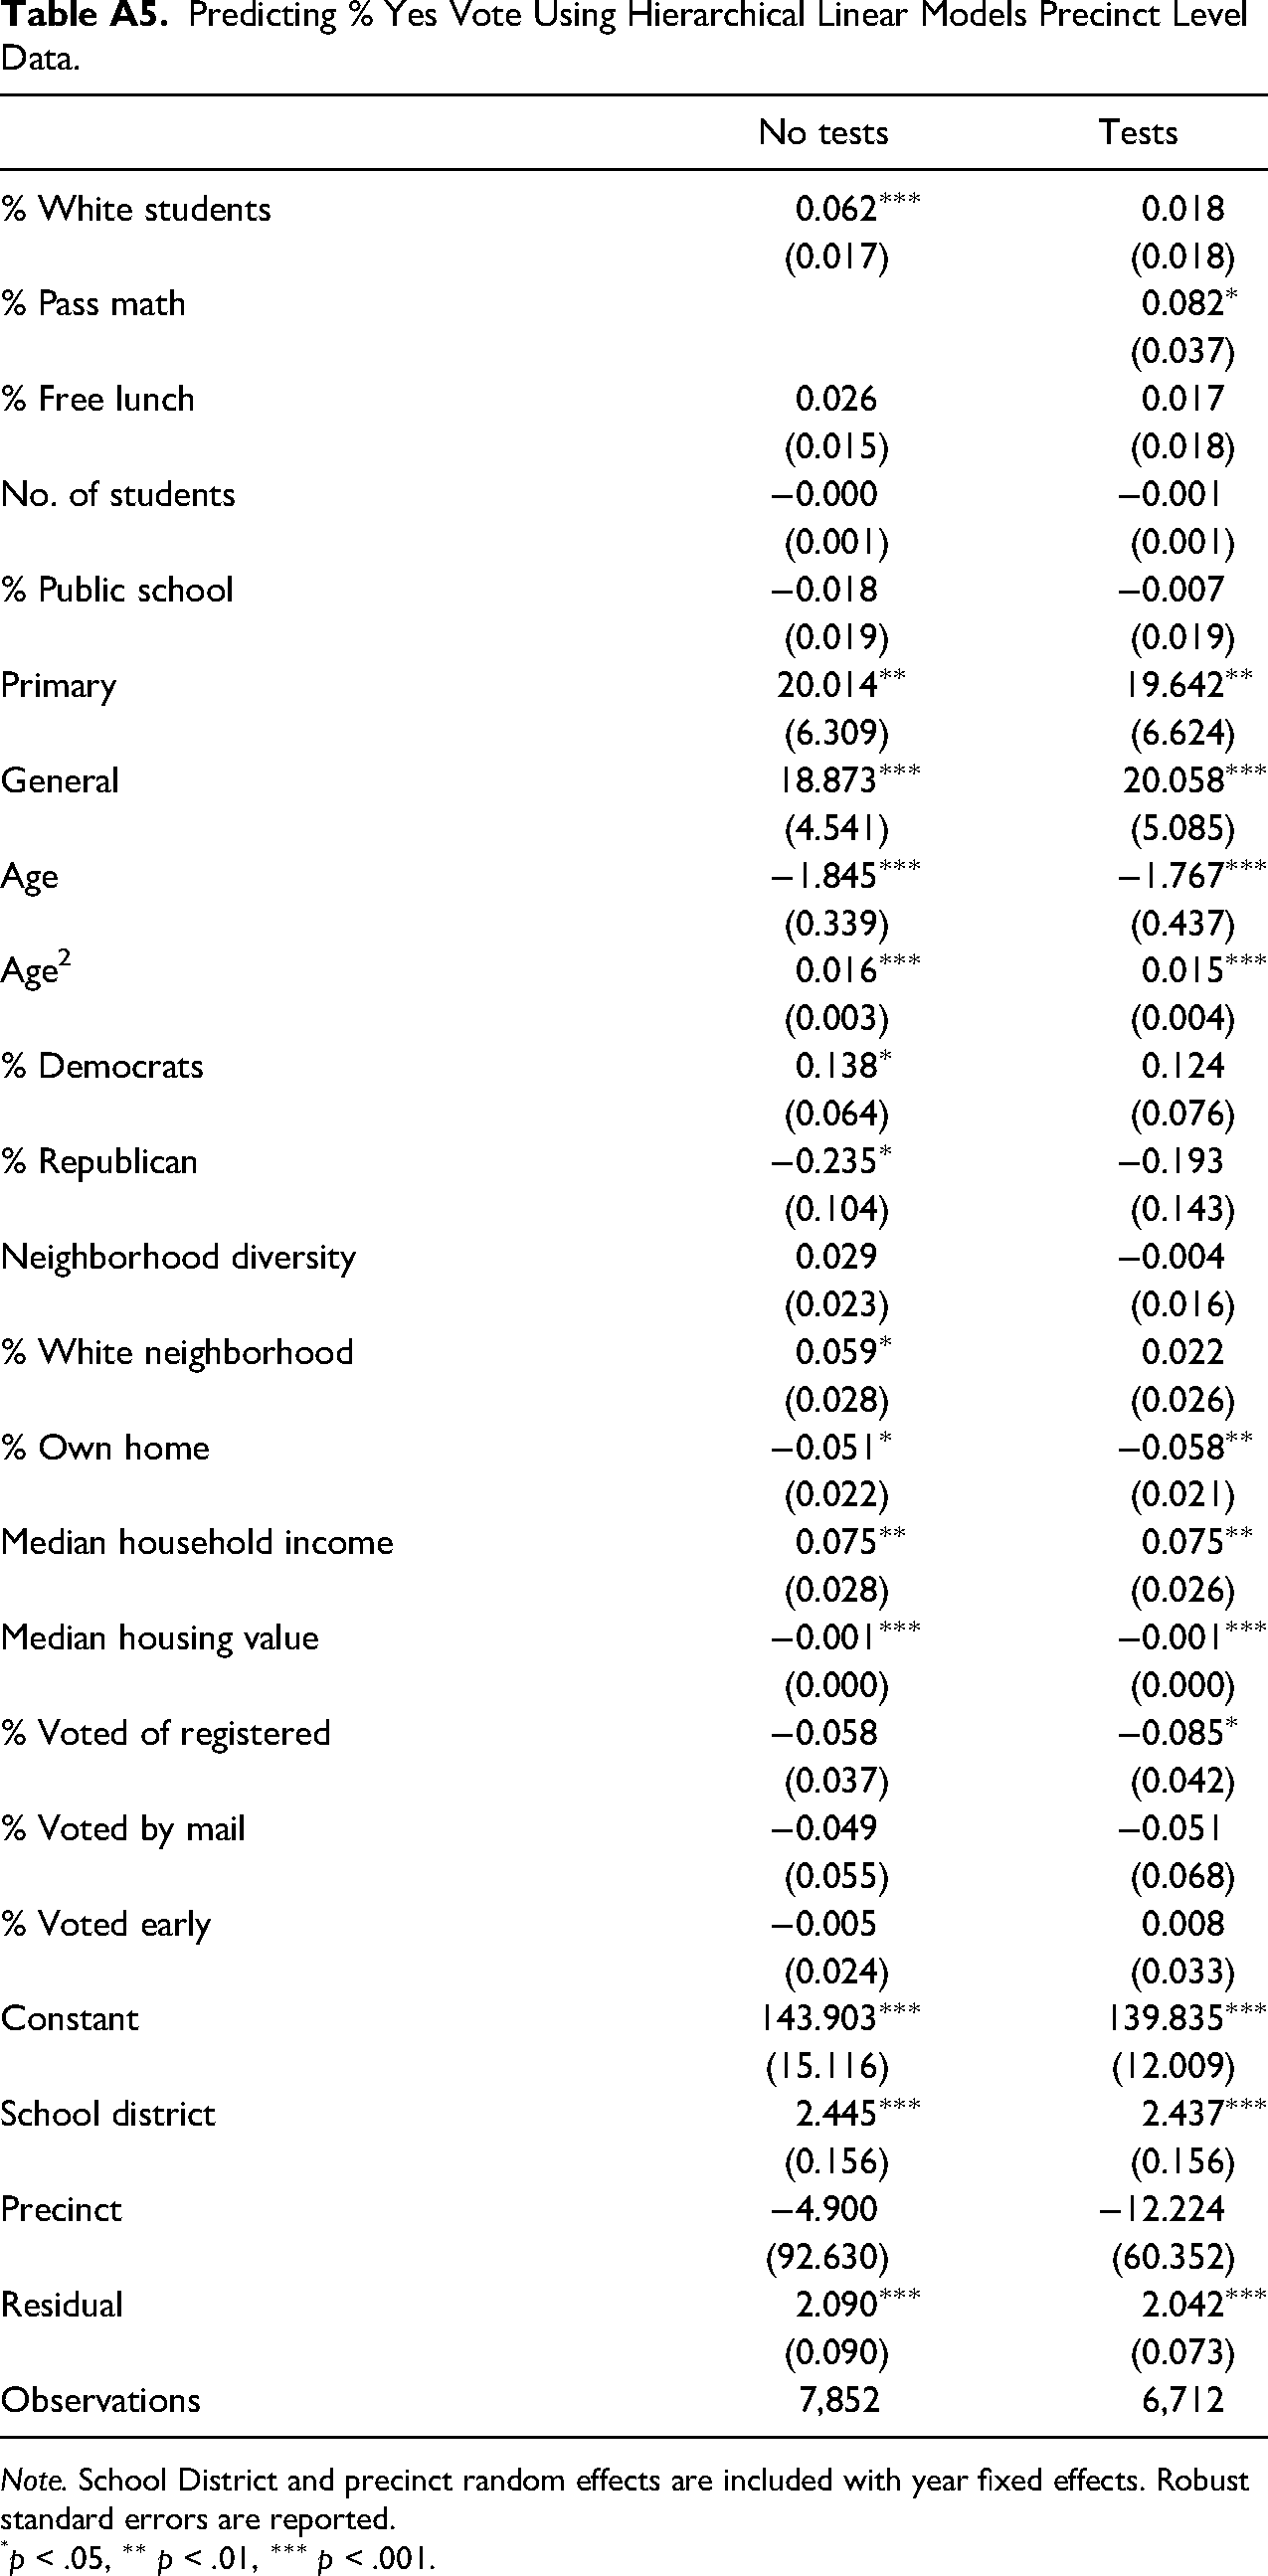
It is important to point out that when testing data is not included in the models, as shown in Table A4 in Appendix A, the percent of the students that are White is statistically significant and positive with a similar magnitude to the math test coefficients. While test scores are often used to measure performance, they often measure other factors as well. Demographics are often highly correlated with test scores. This is often related to educational resources, with schools that have a higher percentage of White students having more resources available to them. In this data, the percent of students that passed third-grade math test and percent of students that are White have a correlation coefficient of 0.45, and the percent of students that passed third-grade math test and percent of students on free lunch has a correlation coefficient of −0.62. Test scores should be thought of more as a bundle of characteristics of a school, including socio-economic factors. Future research should explore this relationship more and test other measures of school performance besides test scores. 14
When thinking about generalizing these findings, Florida is unique in a few ways. Florida is only one of a handful of states that has a constitutionally protected levy limit. This means that these school districts are likely to have more frequent tax referenda votes because of this requirement than other places. In addition, Florida has large, independent school districts which are based on county boundaries. In many states, school districts are much smaller and school district boundaries coincide with racial cleavages. For example, New Jersey has over 500 school districts compared to the sixty seven independent school districts in Florida. This paper does not focus on the ways in which boundaries shape the diversity of the unit being studied. However, boundaries are clearly very important in determining who gets what and have historically been used as a way to exclude groups of people. Florida is a good example of how within school district characteristics shape elections, but it is also important to understand how between school district characteristics contribute to differences in elections, funding, and outcomes.
Footnotes
Appendix A: Additional Tables
Predicting % Yes Vote Using Hierarchical Linear Models Precinct Level Data.
| No tests | Tests | ||
|---|---|---|---|
| % White students | 0.062∗∗∗ | 0.018 | |
| (0.017) | (0.018) | ||
| % Pass math | 0.082∗ | ||
| (0.037) | |||
| % Free lunch | 0.026 | 0.017 | |
| (0.015) | (0.018) | ||
| No. of students | −0.000 | −0.001 | |
| (0.001) | (0.001) | ||
| % Public school | −0.018 | −0.007 | |
| (0.019) | (0.019) | ||
| Primary | 20.014∗∗ | 19.642∗∗ | |
| (6.309) | (6.624) | ||
| General | 18.873∗∗∗ | 20.058∗∗∗ | |
| (4.541) | (5.085) | ||
| Age | −1.845∗∗∗ | −1.767∗∗∗ | |
| (0.339) | (0.437) | ||
| Age2 | 0.016∗∗∗ | 0.015∗∗∗ | |
| (0.003) | (0.004) | ||
| % Democrats | 0.138∗ | 0.124 | |
| (0.064) | (0.076) | ||
| % Republican | −0.235∗ | −0.193 | |
| (0.104) | (0.143) | ||
| Neighborhood diversity | 0.029 | −0.004 | |
| (0.023) | (0.016) | ||
| % White neighborhood | 0.059∗ | 0.022 | |
| (0.028) | (0.026) | ||
| % Own home | −0.051∗ | −0.058∗∗ | |
| (0.022) | (0.021) | ||
| Median household income | 0.075∗∗ | 0.075∗∗ | |
| (0.028) | (0.026) | ||
| Median housing value | −0.001∗∗∗ | −0.001∗∗∗ | |
| (0.000) | (0.000) | ||
| % Voted of registered | −0.058 | −0.085∗ | |
| (0.037) | (0.042) | ||
| % Voted by mail | −0.049 | −0.051 | |
| (0.055) | (0.068) | ||
| % Voted early | −0.005 | 0.008 | |
| (0.024) | (0.033) | ||
| Constant | 143.903∗∗∗ | 139.835∗∗∗ | |
| (15.116) | (12.009) | ||
| School district | 2.445∗∗∗ | 2.437∗∗∗ | |
| (0.156) | (0.156) | ||
| Precinct | −4.900 | −12.224 | |
| (92.630) | (60.352) | ||
| Residual | 2.090∗∗∗ | 2.042∗∗∗ | |
| (0.090) | (0.073) | ||
| Observations | 7,852 | 6,712 | |
Note. School District and precinct random effects are included with year fixed effects. Robust standard errors are reported.
p < .05, ∗∗ p < .01, ∗∗∗ p < .001.
Appendix B: Details on Geocoding
To illustrate the geocoding process, I use Alachua County (which shares the same borders as Alachua School District.) Tables for each school district can be made available, but are very similar to the ones below. Table B6 shows the official election totals for Alachua County from 2008 to the 2018 for primary and general elections. The table includes both the count of those that voted and the count of those that were registered at the time. Table B7 shows the results from the geocoding process. I used voter registration files from two time points in 2014 and 2018. Therefore, the 2008 elections differ the most in total counts. Overall, the official reported election results and the data set I created match closely in both who voted and who was registered. In terms of who was geocoded, Table B7 has two lines for each election. The first is the count for those who were not geocoded and the second is for those that were. For each election, the vast majority of voters were successfully geocoded. In the majority of elections, I was able to geocode over 90 percent of voters and as Table B7 shows, voters that I could not geocode vote at similar rates to ones that I could.
Declaration of Conflicting Interests
The author(s) declared no potential conflicts of interest with respect to the research, authorship, and/or publication of this article.
Funding
The author(s) received no financial support for the research, authorship, and/or publication of this article.
