
Abstract
In response to the socioeconomic harms caused by hyperincarceration and public demands for reforms, efforts have emerged to reduce the number of people who are incarcerated in the United States. Criminal justice reforms are complex, requiring coordination across multiple levels of government and thousands of public and private actors. This paper investigates whether and how the design of such reforms generates feedback effects across governments by exploring how local policymakers in California responded to Public Safety Realignment. The study documents that cities with higher shares of arrestees increased their social policy expenditures post-Realignment, suggesting the policy's design may have contributed to substantive feedback effects between the state and local governments. The findings contribute to the broader discourse on the political status of justice-involved populations and the diffusion of policy priorities, indicating a potential shift toward a more holistic approach that considers the root causes of criminality.
Introduction
In the latter half of the twentieth century, American political leaders mobilized the criminal justice system to exert new and more powerful forms of social control over the populace (Middlemass 2017). The combination of more punitive legal penalties and policing tactics specifically targeting urban communities of color led to an exponential rise in the number of people behind bars (Balko 2013; Gottlieb 2017; Nellis 2024; Thompson 2010). Over the last few decades, research detailing the rippling socioeconomic impacts of hyperincarceration 1 and increasing public demands for accountability in the criminal justice system has led to the expansion of policy efforts aimed at reducing incarceration and recidivism.
Given these trends, important questions emerge in relation to the viability and content of criminal justice reforms. This paper asks: In the wake of a potential large-scale reduction in incarcerated populations, how do local policymakers respond? Do they respond with heightened policing or increased investment in social policy? Specifically, this paper examines whether city governments in California altered spending on law enforcement and social policies after a sweeping state-level reform, Public Safety Realignment (Realignment). Explained further in the second section, although the immediate goal of Realignment was to reduce California's prison population only, it resulted in a substantial decrease in the total number of incarcerated people in the state (Bird, Nguyen, and Grattet 2022; Lofstrom and Raphael 2016, 197, 201–2; Mauer and Ghandnoosh n.d., 7). This makes Realignment particularly useful for my research question, which asks how this decrease impacted city policy-making, given that the policy itself did not directly impact city governments.
Using spending data from the Census’ Government Finance database combined with data from the Federal Bureau of Investigation's Uniform Crime Reporting (UCR) database, I use a difference-in-differences analysis to explore the impact of Realignment on these expenditures, using city-level heterogeneity in the number of arrests per capita prior to Realignment as the main source of variation in “treatment.” I couch my analysis in policy feedback theory (PFT), which identifies resource and interpretive effects as the primary mechanisms through which feedback occurs. Explained further in the third section, I argue that the design of Realignment, specifically its targeting of people convicted of nonviolent, nonsexual, nonserious crimes and the lack of additional resources for implementation provided to city governments, critically impacted the likelihood of adoption and compliant implementation (Boushey 2010; Michener 2019; Schneider and Ingram 1993). The base assumption of this analysis is that policymakers are aware of their local criminal justice environment and respond to Realignment based on its anticipated impact, operationalized as the share of people arrested within a city who would now be supervised in a county jail and/or via probation, rather than in a state prison, or who would be diverted from supervision altogether. I supplement my empirical analysis with a more descriptive element, using transcripts from city council meetings to further explore the salience of Realignment, and whether council members actually expressed preferences for increasing law enforcement or social welfare spending based on the design, resources, and implementation structures of Realignment.
In exploring these questions, this paper addresses a critical gap in the literature on criminal justice policy feedback and effects. While existing literature is focused on criminal justice reforms’ impacts on individuals’ carceral outcomes, state-level policy diffusion, and mass feedback effects, there is comparatively little work on the ways local policymakers respond to high-level criminal justice reforms (Boushey 2016; Karch 2006; Michener 2019; Pierson 1993; Soss and Schram 2007). Exploring these effects is critical to investigations into the passage and implementation of justice reforms, as law enforcement is a diffuse, localized policy area, and judicial and carceral politics and policies are therefore characterized by substantial complexities in the relationships between local, state, and federal government activity. This paper contributes to the feedback literature, which typically focuses on national-to-state, state-to-state, and government-to-public interactions, by exploring whether the design elements of state-level criminal justice reforms create feedback effects in local governments (Boushey 2010, 2012; Karch 2006; Meredith 2013; Pierson 1993; Soss and Schram 2007; Temple University Center for Public Health Law Research 2025). I bring together two streams of research, exploring both how policies “reshape political agendas and the definition of policy problems,” and how they “affect the form of governance for a particular issue or set of issues” (SoRelle and Michener 2022, 80). By probing the relationship between state and local governments, this study offers both an expansion of the feedback literature and attempts to distinguish between policy feedback processes and policy preemption or mandates.
I take social policy and law enforcement expenditures as outcomes in this context to test whether local officials respond to sudden reductions in the state's prison population by allocating more resources to one or the other area. I use expenditures to operationalize policy prioritization by government officials (Jones and Baumgartner 2005, 112). In doing so, I ground my analysis in Mettler and SoRelle's (2018) theory of policy feedback, where public policies, “through their design, resources, and implementation…shape the attitudes and behaviors of political elites” (p. 104). Changes in local expenditures are an important indicator of local officials’ calculated responses to the design, the resources allocated for implementation, and the loci of control over implementation of state-level reforms.
The rest of this paper proceeds as follows: the second section provides a more detailed summary of Public Safety Realignment and the existing work on its impacts. The third section lays out the theoretical basis and proposed mechanisms through which criminal justice reforms would impact spending. The fourth section describes my data, and the fifth section describes my methods, with particular attention to the ways I define my variables of interest in relation to relevant policy-making inputs and outputs. The section “LocalView Analysis” presents a content analysis of city council meeting minutes to more thoroughly describe whether and how local officials were discussing/making policy around Realignment. The section “Difference-in-Differences Results” contains the results of my empirical analysis. I conclude with a discussion of the implications of my findings in the last section.
Institutional Details
Public Safety Realignment
In 2011, the state of California was ordered by the U.S. Supreme Court to reduce its prison population quickly and substantially because of the intense health risks posed to incarcerated people by severe overcrowding and inhumane conditions (Bird and Grattet 2014; Valenzuela 2012). This order resulted in Public Safety Realignment, a package of legislation that sought to stymie the inflow of people to state prisons by diverting those convicted of nonviolent, nonsexual, nonserious (or non–non–non) offenses to county jails and expanding probationary/split sentencing for these crimes (Bird, Nguyen, and Grattet 2022; Latessa, Johnson, and Koetzle 2020; Lofstrom and Raphael 2016). Functionally, Realignment resulted in a large decrease in the number of people incarcerated in California's prisons and a smaller (and more variant) decrease in the overall number of incarcerated people at the state level (27,000 prisoners, ∼17,000 incarcerated people total from 2011 to 2012; Bird, Nguyen, and Grattet 2022; Lofstrom and Raphael 2016, 201–2; Mauer and Ghandnoosh n.d., 7). Table 1 summarizes the specific legislation included in the package. 2
California's Public Safety Realignment Package.
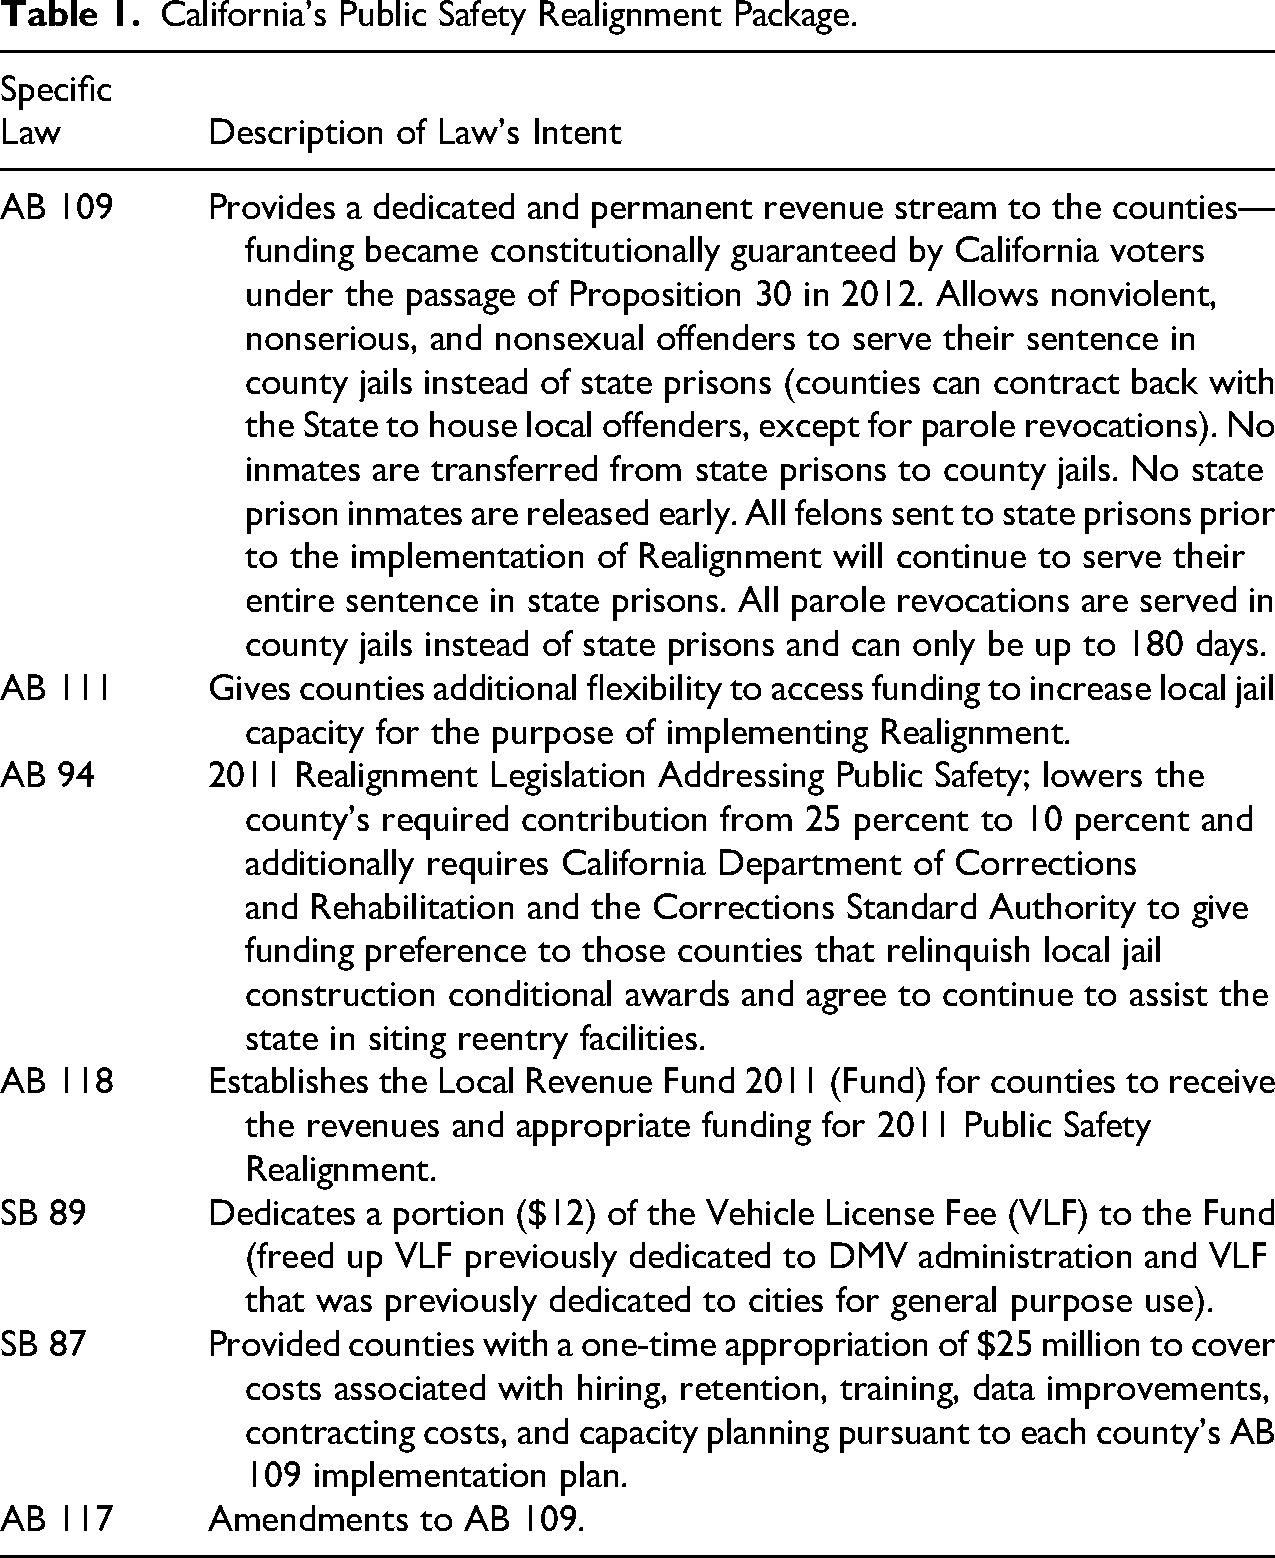
I describe the criminal landscape in California to illustrate both the salience of criminal justice as a policy priority in that state and the reasons Public Safety Realignment came about. California is much like the rest of the United States in its crime and incarceration landscape; the crime “surge” of the 1960s–1980s was followed by an incarceration surge in the late 1980s and 1990s (Harris and Cremin 2024; Lofstrom and Martin 2025). Data show that the constellation of new and more punitive sentencing laws resulted in a large drop in the number of people in California incarcerated in jail (from about 425 per 100,000 people to about 200 per 100,000 people in the early 1990s), while the number of people incarcerated in prisons remained high (Harris and Cremin 2024). As in the rest of the country, the overall crime rate in California has decreased substantially since its peak in the 1990s. 3 The public health risks that overcrowding in prisons creates are not unique to California either. In the last twenty-five years, 26 states have been subjected to court orders mandating improvements in the healthcare and living conditions inside prisons (Nam-Sonenstein 2015). Although California is the only state to have been ordered by the court to reduce its prison populations, many states and the federal government have passed several policies where decarceration is the primary goal (Kimble and Grawert 2019; Mauer and Ghandnoosh n.d.; Schrantz and DeBor 2018). The implications of this study are, therefore, wide-reaching.
Broader Institutional Background
To make the full scope of the Realignment changes clearer, I offer a brief description of the relevant institutions and intergovernmental relationships here. First, it is important to specify the differences between prisons and jails in the United States. Prisons are long-term facilities holding only people who have been convicted of criminal offenses. Long-term, in this case, refers to the length of time a person spends incarcerated: Most people in a prison are serving sentences longer than a year. Each prison is run by the Federal Bureau of Prisons, a state's department of corrections, or a private company (usually contracted to the state). Jails are short-term facilities where people are held both before and after conviction. People are typically incarcerated in a jail for a year or less, and jails are typically locally operated (by a sheriff, police chief, or other administrator), although some are privately owned and some are operated by two or more independent jurisdictions (Bureau of Justice Statistics 4 ). The state of California has 31 state-run prisons, 12 federal prisons, and over 60 jails. For more information on the political history of California's prisons, I refer the reader to Ruth Wilson Gilmore's Golden Gulag (2007).
Second, understanding the constellation of local government types in the United States is essential for this study. The U.S. Census designates two broad categories of local governments: general purpose (those governing counties, municipalities, and townships) and special purpose governments (school districts, special districts, and regions). This study's inquiry is focused on municipal (city) and county governments, so I will describe these further here. Counties are typically established by the state for “performing state-mandated duties” (National League of Cities 5 ). The scope of county governments’ responsibilities and power has grown as the U.S. population has become more urbanized; this led almost all counties (98 percent) to establish their own, independent charters over the last several decades, but the scope of these is still constrained by state governments. City governments are hugely variant in their structure and size, but all have similar powers and functions. Power-sharing between cities and counties differs hugely across the United States and is largely determined by population size and delineated in formal power-sharing agreements (Lubell, Henry, and McCoy 2010). 6
Finally, I offer a brief description of the mechanics of the U.S. criminal–legal system, beginning with arrest and ending with incarceration. 7 It is critical to acknowledge that there are many additional steps and complexities I do not attend to here for the sake of clarity, that moving through the criminal–legal system is a reflection of the actions of many people, especially legal officials, and that the following description is focused on people who are eventually convicted of a crime (National Academies of Sciences, Engineering, and Medicine 2022). When an adult has been arrested, they are typically incarcerated in a jail, where they are held until charges are filed or they are released. If charges are filed, the person can either be diverted to a support program or will move through a prosecution process in a court (Johnson and Ali-Smith 2022). If the person is charged with a felony (a more serious crime) and is convicted, they are typically sentenced to probation (supervision outside a prison) or to incarceration in a prison. If the person is charged with a misdemeanor (less serious crime), they are typically sentenced to probation or to incarceration in jail. Once incarcerated, a person has almost no control over where they are held or whether they are transferred to another facility during their sentence.
Utility in the Current Study
Public Safety Realignment substantially altered the carceral landscape in California. Of most relevance to this study is the fact that the state, using its institutional power over the counties, shifted responsibility over people convicted of all but the most serious crimes to county administrators and jails (Bird and Grattet 2014; Lofstrom and Raphael 2016). The policy package also included legislation that reclassified certain crimes to become newly eligible for split-sentencing, or a combination of a shorter period of incarceration with a subsequent period of probation (Mauer and Ghandnoosh n.d.). While Realignment's mandate was from the state to the counties, the reduced number of incarcerated people (whether diverted from supervision entirely or through increased noncarceral sentencing) was a highly salient outcome to city officials, as it necessarily translated to an increased number of people with criminal histories on streets. This is evident in the council meeting transcripts I analyze in the section “LocalView Analysis,” where local officials express concerns about undue “burden on local police departments,” describe transitioning to “alternatives to custody,” and argue that they can’t “arrest our way out of our crime statistics.”
This paper's research question is: How do city policymakers alter their spending behavior after state-initiated criminal justice reforms? Realignment has already provided a fruitful opportunity for exploring the impact of criminal justice reforms on outcomes such as crime rates (Lofstrom and Raphael 2016), recidivism (Bird and Grattet 2014; Bird, Nguyen, and Grattet 2022; Lofstrom, Raphael, and Grattet 2014), and judicial behavior (Ball and Weisberg 2014; Weisberg and Quan 2014). However, a critical question that has gone largely unaddressed in existing research is how city policymakers responded to this state-mandated increase in control over the Realignment population and the resultant drop in the number of incarcerated people in general. Answering this question is essential because a key tenet of Realignment was that “managing lower-level offenders in locally run, community-based programs using evidence-based practices” is more effective than incarceration in improving individual-level outcomes (Bird and Grattet 2014; Latessa, Johnson, and Koetzle 2020; Petersilia et al. 2014, 2). Did the design, resources, and implementation structures of Realignment create feedback effects that reflected this tenet? This paper explores this by empirically testing whether and how city spending changed in response to these elements.
Theoretical Framework
This paper uses PFT to explain why cities would change their spending behavior after a state-level criminal justice reform. PFT developed from decades of scholarship aimed at disentangling policies as the outcome of politics versus policies as influencers in politics. In their defining chapter in Theories of the Policy Process (2018), Suzanne Mettler and Mallory SoRelle describe the theory's utility as bringing “political considerations to bear on policy analysis” and “assessing how policies affect crucial aspects of governance” (pp. 104). Put more simply, policy feedback offers a framework for scholars to explore the political dimensions of the policy process and the ways policy subsequently impacts these political dimensions. These effects are mediated by the features of the specific policy/political context under study (p. 112).
The guiding question for studies of policy feedback is: How does “policy, once enacted, restructure subsequent political processes?” (Skocpol, quoted in Mettler and SoRelle 2018, 104). Mettler and SoRelle propose two mechanisms through which this occurs: resource effects and interpretive effects (Mettler and SoRelle 2018, 118). Resource effects concern changes in the availability of material resources brought about by a policy change, while interpretive effects concern the ways policies shape norms and efficacy among affected individuals/groups (SoRelle and Michener 2022, 82). Using this framework, this study's guiding question is: Why would a criminal justice reform (especially a state-level reform) lead to political and/or policy changes at the city level? According to SoRelle and Michener (2022, 85), this would occur in cases where state-level reform “trigger[ed] a corresponding change in resources…and/or alter[ed] ideational schemas” at the city level. This paper uses a difference-in-differences analysis to empirically test for resource effects and uses a descriptive analysis of city council meeting minutes to identify interpretive effects.
The study intersects two of the four major streams of inquiry related to policy feedback: governance and problem definition/agenda setting (Mettler and SoRelle 2018, 107). I ask:
How did local officials change their spending behavior after Realignment? How did Realignment affect the policy agendas of local governments in California? How did Realignment affect local officials’ perceptions of crime as a policy problem in their cities? What contextual features of local governments mediate these effects?
I focus on spending behavior as an indicator of policy prioritization; the more a city spends in a certain area, the higher the priority (Jones and Baumgartner 2005, 112). In the case of Realignment, I argue that the lack of new/additional resources from the state to cities after Realignment lowered the utility of expanding law enforcement and increased the utility of spending on social welfare services, specifically because it changed the nature of California's correctional landscape. As one city councilor perceived it, Realignment made California jails “like a revolving door,” necessitating a shift in focus toward figuring out “how we keep [people] from entering into [the correctional] system” (Barari and Simko 2023). There is a large body of research exploring whether and how more access to social policy benefits eases reentry and reduces recidivism for people returning from incarceration. Scholars have found some evidence (varying in strength) that social policy expansion improves justice-related outcomes by lowering barriers for formerly incarcerated people to access healthcare, employment, housing, and other necessities (Aiken and Alford 1970; Bushway, Stoll, and Weiman 2007; Jacobs and Gottlieb 2020; Yang 2017a, 2017b). Access to social policy benefits for justice-involved people has been highly contentious in the past, but recent research has documented that the public may be becoming less punitive (at least toward certain types of offenders), and recent policies have used language signaling support for a shift to a more holistic approach to reentry (Boushey 2016; Bureau of Justice Statistics, n.d.; Department of Justice 2016; Gelb, Gramlich, and Stevenson 2017; Gottlieb 2017; Lofstrom and Raphael 2016). The fact that financial support for the implementation of Realignment flowed from the state to counties (rather than to cities) would also have made increasing spending on social policies rather than law enforcement more pragmatic—since cities had little to no control over the design and impacts of Realignment, the “revolving door” problem would have been much more serious given the lack of additional resources from the state. Stymying the flow of people into incarceration and easing reentry through expanded social welfare may have been seen as a better investment in this context.
Turning to interpretive effects, city officials may have changed social policy spending after Realignment because of the framing of the target population. As mentioned above, Realignment specifically targeted people who had only been convicted of nonviolent, nonsexual, or nonserious crimes. The targeting of this group is notable because other researchers have identified “increased admissions for non-violent offenses” as a primary driver of mass incarceration in the United States since the 1960s and 1970s (Gottlieb 2017, 637). Additionally, frames about the outsized punitiveness of the criminal justice system have been shown to shift opinion in support of criminal justice reforms eliminating incarceration for nonviolent offenses (Boushey 2016; Gelb, Gramlich, and Stevenson 2017; Gottlieb 2017, 648; Middlemass 2017, 37). Limiting the target population to only non–non–non offenses may have impacted local policymakers’ decisions about whether to respond to the drop in incarceration brought on by Realignment by increasing law enforcement expenditures. This is doubly likely due to precedent set in other policies; people convicted of these offenses were already excluded from provisions like California's habitual offender laws, which apply only to those convicted of violent, sex, or serious felonies (Penal Code 667 PC). Thus, the construction of a target population viewed as less dangerous or as victims of circumstance may be another mechanism through which Realignment influenced city spending.
I focus on features of cities’ crime environments and city officials’ ideological alignment with state government as two main contextual factors that mediate these resource and interpretive effects. First, I expect Realignment is more likely to affect the policy agendas of cities where crime is already a more salient policy problem (H1). I use the average number of arrests per capita in the five years prior to Realignment's passage (2006–2010) as my indicator for a city's crime environment because it is a source of variation that has direct policy implications for Realignment. If city officials viewed a potential outcome of Realignment as increasing the number of people moving in and out of local jails, cities with higher shares of arrests would be more impacted by a decrease in the overall incarcerated population than places with lower shares. Second, previous studies have shown that officials’ own ideologies and those of their constituents impact local spending patterns (Connolly and Mason 2016; Wlezien 2022). I include Tausanovitch and Warshaw's (2013) measure of city ideology in one of my empirical models to test whether local governments’ ideological alignment with the state impacts their spending behavior after Realignment.
This study contributes to the policy feedback literature through its focus on feedback effects between cities and states because the mechanics of the power relations between cities and states encompasses features of both the government-to-government feedback literature and the mass politics feedback literature. I have already discussed the former above: State policy influences city policy-making through decisions about resource allocation and the construction of target populations. Moving to the latter, in “A Public Transformed,” Soss and Schram (2007) point out that policies have differential effects on mass politics because “the degree of visibility and the proximity to citizens of each policy is likely to determine whether they are likely to have a meaningful impact on public attitudes over time” (Beland and Schlager 2019, 192). I argue the same is true for state policies’ effects on city politics, but in an agenda-setting context: the more salient a policy area already is to city officials, the more likely it is that they will respond to higher-level changes in that policy area. Similarly, in alignment with Pacheco (2013), I argue that “the duration of exposure” of cities to a particular policy problem will influence feedback effects when state policies are passed in that policy area (Beland and Schlager 2019, 192). The intent behind using the number of arrests per capita in the five years preceding Realignment as my treatment in this paper's difference-in-differences analysis is to capture both duration and salience.
Critiques of PFT tend to focus on its reliance on a policy process or cycle that has distinguishable stages at which a researcher can point to the beginning and ending of a feedback process, and/or the idea that policy areas have distinguishable boundaries (Fischer, Miller, and Sidney 2017). Using a difference-in-differences design to explore feedback effects is directly connected to this problem because it also assumes a sharp, pre–post distinction that allows for causal inference. In this case, I argue Realignment differs from other policies because it was a state-level response to a court mandate, not the result of a usual policy development process. Realignment has clearer time and stage boundaries than many other policies, so applying a difference-in-differences analysis is appropriate in this case. SoRelle and Michener (2022, 87) address two additional points of concern related to causal inference in policy feedback studies. The first is endogeneity due to selection effects—that “recipients” of a policy will self-select into these benefits. I argue that these concerns are limited in this study because Realignment was a state-level, rapid response to a court-mandated change in California's criminal justice environment that conferred no direct resource benefits to cities. Thus, it is unlikely that city officials would have planned for Realignment before its passage, nor that the constellation of city law enforcement organizations would have changed their arrest behavior in anticipation of additional resources from the state. However, once Realignment had been passed, it is highly likely that city officials would have been aware of roughly how many arrests were made in their cities in the time prior to Realignment and would have used this as a heuristic in anticipating the potential impact of this policy on their cities. The second challenge in identifying causal effects in a feedback framework is accurately measuring policy exposure. This concern is less prevalent in this study because all cities in California were equally “exposed” to Realignment because it was a state-level policy that, again, had no explicit resource allocations for cities. Thus, all cities were equally exposed in time, but, I argue, were differentially exposed due to variation in their local crime environments, which could not have been manipulated in such a way as to select into treatment under Realignment. Thus, using average arrests per capita prior to Realignment's passage to measure this variation helps avoid endogeneity problems, and Realignment itself provides a clearer cutoff point than most other policies, given the nature of its passage.
Finally, it is important to address the potential concern that any observed effects at the city level may be the result of state preemption, which can heavily limit the power of local governments to pursue policy initiatives that are in opposition to state priorities. While California does preempt local governments in certain policy areas (including firearms regulation, certain rent control measures, and tax regulations), it does not preempt local police budgets and has fewer preemption laws overall than most other states (Temple University Center for Public Health Law Research 2025). Considering this, I argue that the post-Realignment changes in spending are more reflective of feedback effects because municipal governments had full discretion in whether and how to respond to these reforms (as no specific mandates were passed down directly from the state). However, I remove cities in states with the strongest preemption laws from my sample as a robustness check given in the Supplemental Appendix.
Data
The data for this study come from three sources: Kaplan's accumulated Uniform Crime Reports (UCR), 8 Pierson's Government Finance Database (GFD), 9 and the LocalView Public Meetings database. 10 I describe the variables taken from each below. In each dataset, I remove cities with populations below 10,000 to address imprecise data concerns for smaller cities in the UCR and GFD.
Uniform Crime Reports
I expect spending behavior at the city level to vary based on how high their average arrests per capita were in the five years leading up to Realignment. This is the treatment variable for my difference-in-differences analysis. I use the UCRs for this variable because they include the number of arrests by precinct and crime type, allowing me to identify the number of arrests by city. Figure A.1 in the Supplemental Appendix shows the distribution of average arrests per capita across my sample. While most of the cities in my dataset have an average arrests per capita value between 0 and 0.2, there are some outliers. Thus, I use a binary “high-arrests” variable as the primary treatment in my difference-in-differences regressions to ensure these cities do not skew the results, and include an alternative specification using continuous arrests in Supplemental Appendix Table A.8.
I include all types of arrests in my measure because I expect cities’ overall crime rates to be most salient to local officials. However, I also include an analysis in Supplemental Appendix A using only qualifying (nonviolent, nonsexual, nonserious) crimes per capita as the independent variable to test whether the results persist under this specification (Supplemental Table A.9). The most liberal version includes all nonviolent, nonsexual, nonserious crimes. The medium definition excludes the sale and possession of opiates and synthetic drugs. The conservative definition includes only nonviolent property crimes; drug crimes related to marijuana and other nonopiate, nonsynthetic drugs; crimes related to liquor, drunkenness/disorderly conduct, and vagrancy; and crimes listed as “other.” The drug-only definition includes only nonopiate, nonsynthetic drug crimes, to try to capture only low-level drug offenses. While these classifications are based solely on the most serious crime type associated with the arrest and do not capture the actual severity of the crime itself (i.e. type of felony), arrests are still commonly used as the measurement for city crime rates, given that people are not always incarcerated in the place where they were arrested.
Again, the base assumption is that policymakers will be aware of how many people under their jurisdiction are arrested, and that those with proportionately higher shares of arrestees (those that are more “treated”) will respond differently to reduced incarceration than those with lower shares (those that are less “treated”).
Spending
The outcomes of interest for the difference-in-differences analysis are local spending on social policy and criminal justice. I use spending data from 2000 to 2016 from the Census’ Government Finance Database. My primary analysis is focused on total social policy spending per capita, but given the evidence that local policymakers exercise more control over certain policy areas, I explore heterogeneity across four social policy categories (health and welfare, economy and employment, housing and land use, and education) in Supplemental Appendix Table A.4. Supplemental Appendix Table A.1 contains detailed descriptions of the specific expenditure line-items included in the social policy expenditure variables, separated into four subcategories defined in table Supplemental Appendix Table A.4. For example, health and welfare includes the distribution of cash benefits to individuals and vendors for public assistance programs like Medicaid (health insurance for people with limited income) and Supplemental Security Income (a means-tested cash assistance program for people with disabilities and senior citizens), additional public health expenditures, and expenditures for hospitals. I chose to include these specific line items in the broader health and welfare category because they incorporate expenditures that are both directly redistributive in nature and expenditures that generally target public welfare/well-being. Including both types of expenditures across my four major categories was important because this paper's primary inquiry is whether the design of Realignment's policy provisions impacted local government spending behavior, specifically by making nonenforcement responses seem more pragmatic.
Since most expenditures for redistributive programs and policies come from the federal or state level and are often allocated directly to service providers, rather than to individuals themselves, it was important to incorporate expenditure categories in my overall measure that corresponded to areas over which local governments have more control. This also motivates my inclusion of the law enforcement expenditures dependent variable—87 percent of law enforcement expenditures come from local governments (Urban Institute 2021a). My law enforcement expenditures variable includes all expenditures for corrections, judicial expenditures, and expenditures for police protection, although I also include a specification in which each of these subcategories and all nonjudicial expenditures are dependent variables in separate regressions (Supplemental Table A.5). Including criminal justice spending as an outcome also allows for a more thorough exploration of the ways Realignment's design shaped cities’ responses to reduced incarceration; spending may increase in neither, either, or both policy areas.
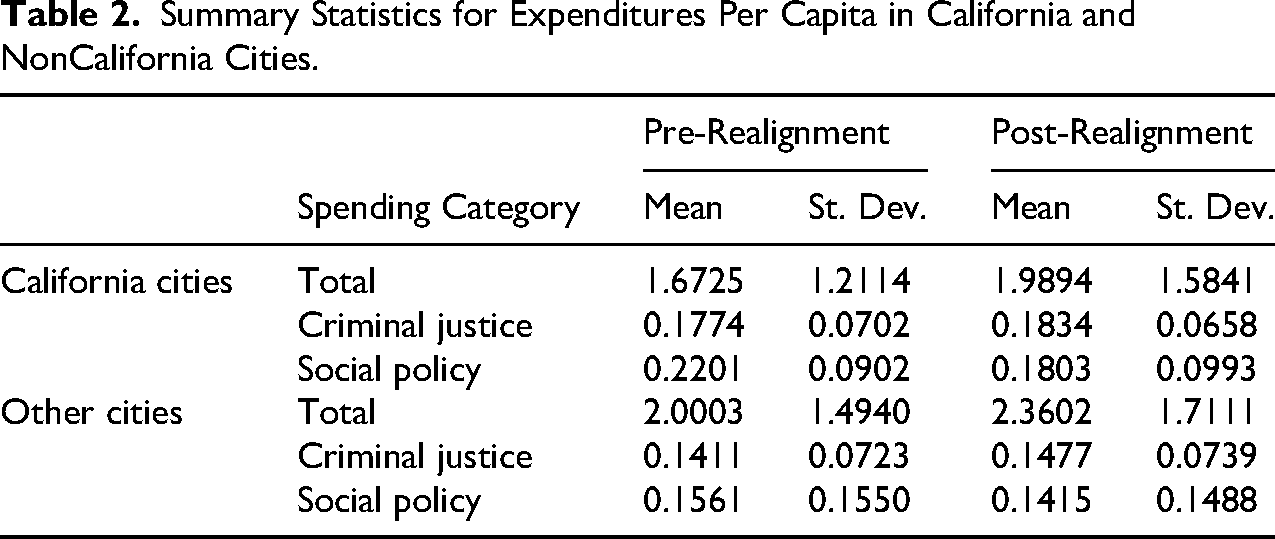
To create a proportionate measure of expenditures, I calculate cities’ total expenditures per capita, social policy expenditures per capita, and criminal justice expenditures per capita. All cities reporting zero (indicating no expenditures) or with missing values for total expenditures were dropped. Any cities that reported total expenditures and reported zeros or missing for the relevant expenditure categories remained coded as zero or missing respectively. Table 2 provides summary statistics for the aggregated spending variables. It shows that California cities generally spend less per capita on average than other cities on social policy and criminal justice in both the pre- and post-Realignment periods. This may be due in part to California's expansion of Medicaid coverage under the Affordable Care Act in 2010 and affirms the need for the exploration of variation within California cities and the inclusion of the expenditure to revenue ratio alternative dependent variables in my empirical analysis (Golberstein et al. 2015).
Summary Statistics for Expenditures Per Capita in California and NonCalifornia Cities.
I use the share of total expenditures allocated to social policy and criminal justice as alternative dependent variables in Supplemental Appendix Table A.6, to ensure that any effects I observe for social policy and criminal justice expenditures are specifically related to Realignment, rather than just an overall increase or decrease in total spending. Finally, because the expenditure data cannot be disaggregated into its source funds, I use ratios of social policy and criminal justice expenditures to total revenues as alternative dependent variables in Supplemental Appendix Table A.7 to ensure my results are not driven by increases in revenues during this period.
Political Ideology
As discussed in the third section, I expect that diffusion of Realignment's priorities is more likely in cities that are more ideologically aligned with the state. At the time of Realignment's passage, the Democratic Party held over 60 percent majorities in California's state Senate and Assembly, and the governor changed from Republican to Democrat in 2011 (Arnold Schwarzenegger to Edmund Brown Jr.). Therefore, I characterize ideological alignment with the state as being more liberal. I include data on political ideology in my analysis, expecting more conservative cities to spend less on social policy to begin with and policymakers in more conservative cities to be less likely to respond to Realignment by increasing their social policy spending (H2). To test this, I use data from Tausanovitch and Warshaw's (2022) measure of city-level ideology, in which scores greater than zero indicate more conservative areas, and scores less than zero indicate more liberal areas (Tausanovitch and Warshaw 2013, 333). Specifically, I use the ideology scores from their 2004–2011 survey to capture cities’ political environment in the period around the passage of Realignment. The final sample contains over 30,000 observations for almost 3,000 cities across 1,100 counties in the United States, with 55 of California's 58 counties represented in the data.
LocalView
The basic premise of this paper is that local government officials were aware of Realignment and the potential impact a reduction in incarceration would have on their cities and took some action in response to this anticipated impact. I use data from the LocalView Public Meetings database, which contains transcripts from hundreds of public meetings from across the United States, to provide a descriptive analysis of whether and how local governments were responding to Realignment. I combined the 2010–2014 LocalView datasets and identified all city council meetings where any one of 10 key words/phrases 11 appeared in the meeting transcript. From this, I created two datasets: First, a dataset containing the number of meetings by place by year, which includes the total number of meetings, the number and share of meetings in which at least two key words/phrases were mentioned, and the number of meetings where each of the 10 key words/phrases was mentioned. Second, I created a dataset containing the details of each meeting where at least two key words were mentioned, isolating the parts of the meetings in which the key words were discussed to conduct a more thorough content analysis. I did this because, for example, of the cities where the string “109” was mentioned in conjunction with another key word, only California cities in the post-Realignment period were actually discussing AB 109.
In total, there were 57 California cities or counties represented in the data, which had a total of 464 meetings where any of the 10 key words/phrases appeared in the transcript. On average, at least two key words were mentioned in 26 percent of the meetings in California per year. All the cities and counties in the LocalView data were represented in my primary dataset, although two cities were excluded from my regression analyses due to population size (under 10,000 people). These areas were also a mix of high-and low-arrest places as defined in my primary dataset. Again, while these 57 cities are a small portion of the over 400 cities in California, the transcripts from these meetings and comparative shares in topics indicate that Realignment was a salient policy change to local officials. The full analysis is presented in the section “LocalView Analysis.”
Empirical Strategy and Hypotheses
The overarching research question this paper seeks to answer is: How do city policymakers respond to reductions in incarceration brought on by higher-level reforms? I explore whether and how policymakers at the city level in California changed their social policy and law enforcement spending in response to the anticipated impact of Realignment. Informed by existing literature and theory, I test two hypotheses: First, that cities in California with a higher share of arrests per capita in the five years prior to Realignment's passage increased their spending on social policy (H1) and, second, that ideological alignment between cities and the state impacted cities’ responses to Realignment—more conservative cities did not increase their spending on social policies (H2). I limit my analysis to only cities with populations greater than 10,000, given the documented challenges with drawing inferences about spending in smaller cities.
As mentioned in the previous section, I operationalize “anticipated impact of Realignment,” my treatment variable, as the average number of arrests per capita in a city in the five years prior to Realignment (2006–2010)
I use a difference-in-differences approach to test the impact of Realignment on social policy and criminal justice expenditures. My basic specification is equation (1), which I adapt for each of my three spending variables (total, criminal justice, and social policy expenditures). The dependent variable, 
To examine political ideology, I add an additional dummy variable,
Results
LocalView Analysis
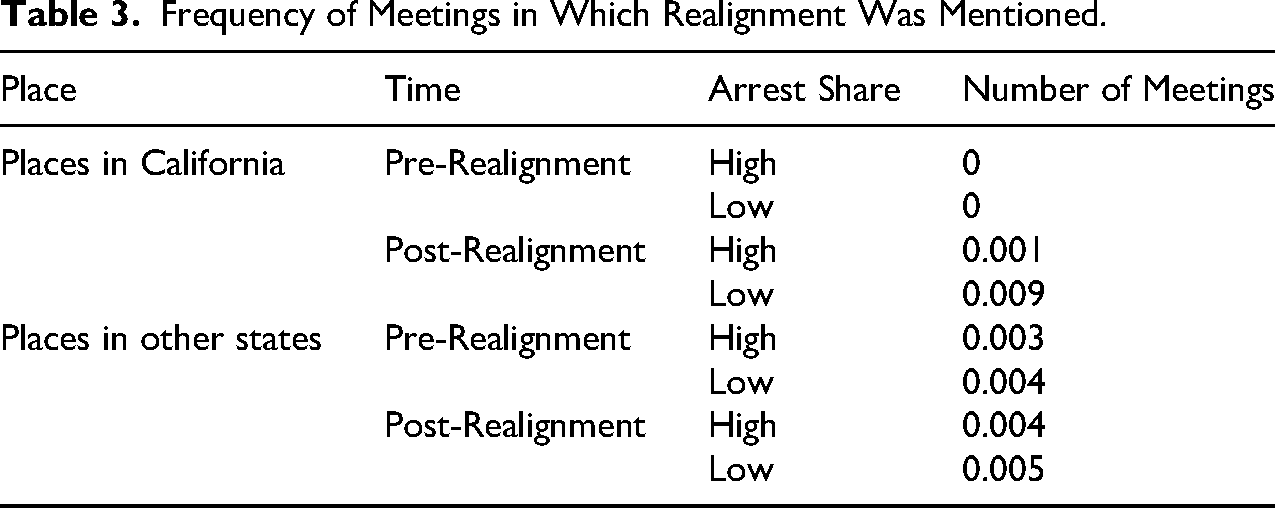
At the most basic level, Table 3 shows the share of meetings during which the word “realignment” was mentioned, split by places in and outside of California, the pre- and post-Realignment periods, and high- and low-arrest places. As expected, there is an uptick in California places and differences across both high- and low-arrest places—no meetings had the word “realignment” prior to the passage of Realignment (2010 and 2011 meetings), while 45 meetings (1.4 percent of all meetings) mentioned it in some capacity from 2012 to 2014. In total, 0.1 percent (39) of these meetings took place in cities with a high share of arrests in the five years prior to Realignment. Interestingly, cities with low shares of arrestees mentioned Realignment in a higher share of meetings than cities with high shares of arrestees. As for cities outside California, there was also an increase in the number of meetings where the word Realignment appeared in the transcript after the passage of Realignment in both high- and low-arrest places. While most of these mentions had to do with structural or budgetary realignments, some cities were aware of what was happening in California. For example, a council member in Sioux Falls, SD (a low-arrest city) brought up the policy as a point of interest in a 2013 municipal council meeting: California has enacted [these] numbers simply by setting people free…It has…sent a lot of nonserious offenders to county jails instead of state prisons in a policy called Realignment…They were operating at over 200% capacity of their state penitentiaries, now they’re down to a mere 135%…it also says that crime has gone up in the places where they’re being released.
Frequency of Meetings in Which Realignment Was Mentioned.
Of more importance to this paper is whether there is evidence of policy feedback. That is, do local officials actually cite the design, resource effects, or interpretive effects of Realignment as impacting their policy choices when responding to Realignment? The meeting transcripts in the LocalView data do contain some descriptive evidence in support of feedback effects. For example, in a 2012 municipal council meeting, the mayor of West Covina, CA, said: …our community will be changed forever by this is state law…we’re releasing all the prisoners, that's the new realignment, and no one realizes the impacts when they say crime's going up…You arrest them, you put them in jail, they [state officials] release them…That's why over the next five years you’re going to see crime skyrocket with Realignment and what the state government is doing to reduce their budget by releasing all the prisoners. They have no one to watch over the ones they’re releasing. They’re supposed to be managed but they don’t have anyone hired to actually supervise them, and they’re putting it all on the burden on local police departments. That's going to crush our Police Department….
This official is clearly pointing to the design of Realignment's component policies as putting undue pressure on localities, with the lack of resources as a key problem in cities’ ability to respond effectively to the reduction in incarceration. However, while the concerns about a reduction in incarceration were echoed in many of the other meeting transcripts from cities in California, not all officials were strictly focused on the implications for law enforcement. Supporting the empirical results of this paper, some officials saw the design of Realignment as specifically creating a need to move away from a primarily enforcement-based response to the policy. For example, in a meeting of the Stockton Planning/Zoning Commission in March of 2012, one official said: …the reality is if we think we can just arrest our way out of our crime statistics we’re fooling ourselves because four years ago…it was like a revolving door at the jail because we were…overcapacity and now with Realignment that's going to happen even faster, so we can’t take the position that we’re going to keep on bringing as many officers in as we can…[and] arrest [criminals] into submission…that isn’t going to work…we have to have these other community partners there to figure out what programs are working and how do we keep them from entering into this system…. With the first realignment, we’re using alternatives to custody more now than ever. We have an arrangement where we put two ankle monitors with GPS tracking on the lowest level offenders to try and get them to serve their sentence [under] their own power.
In addition to evidence that the design of the policy and its resource effects directly influenced local officials’ responses to Realignment, the local view transcripts also evidence interpretive effects—that the type of criminal targeted by Realignment impacted officials’ responses to the policy. An official in Susanville, CA, said in a meeting in April of 2014: …there are some bad people [who do] bad things and they need to be in prison. There are other people are basically good folks and make mistakes and you need to deal with in a different way. Putting them in jail is not always effective; it's expensive and it doesn’t work…punishment doesn’t work, so what we are trying to do with our Realignment is to come up with some programs…[for example] we’re setting out to pay a portion of our probationers to come in and work on high school diplomas and such…More than half of our probationers don’t even have a high school [diploma].
Several other cities mentioned community partnerships they had developed since the passage of Realignment to improve the monitoring and transition of people who were convicted of crimes that qualified for noncarceral sentencing. These partnerships may have been a target for the increased social policy expenditures observed in the main results of this paper. Additionally, Realignment was occasionally brought up in conjunction with meetings around California ordinances relating to housing, especially restrictions on new builds relating to affordability and the number of households that would be served (i.e. multifamily vs. single-family units). This is interesting considering the finding in Supplemental Appendix A that much of the change in social policy spending observed after Realignment was driven by increases in spending on housing and land use policies. In part, the transcripts from LocalView indicate that this may have been as much a function of cities focusing on “where to put” newly nonincarcerated people, indicating the salience of a transition away from incarceration brought on by Realignment. Overall, these data provide support for both mechanisms proposed in the third section; the design of Realignment's component policies, specifically its resource and interpretive effects, led policymakers in California, especially those in high-arrest cities, to interpret Realignment as requiring a response more focused on prevention and reentry support than on enforcement and social control. The qualities of the target population also appear to have played a role in this interpretation.
Difference-in-Differences Results
Figure 1 contains the results for my primary specification, in which cities’ expenditures per capita is the dependent variable and the primary independent variable of interest is the interaction between being in the post period (after 2011), being in California, and a high average arrests per capita from 2006 to 2010. The top (red) coefficient is the result for all expenditures per capita, the middle (blue) is the result for criminal justice expenditures per capita, and the bottom (gray) is the result for social policy expenditures per capita. The results indicate that cities in California with a high share of arrests per capita spent significantly more on social policy and overall than those with lower-arrest shares. Interestingly, these increases in spending were not accompanied by a significant change in spending on criminal justice, corroborating the descriptive evidence in the previous section that policymakers in California cities may have felt that increasing spending on law enforcement would not be a pragmatic response to Realignment.
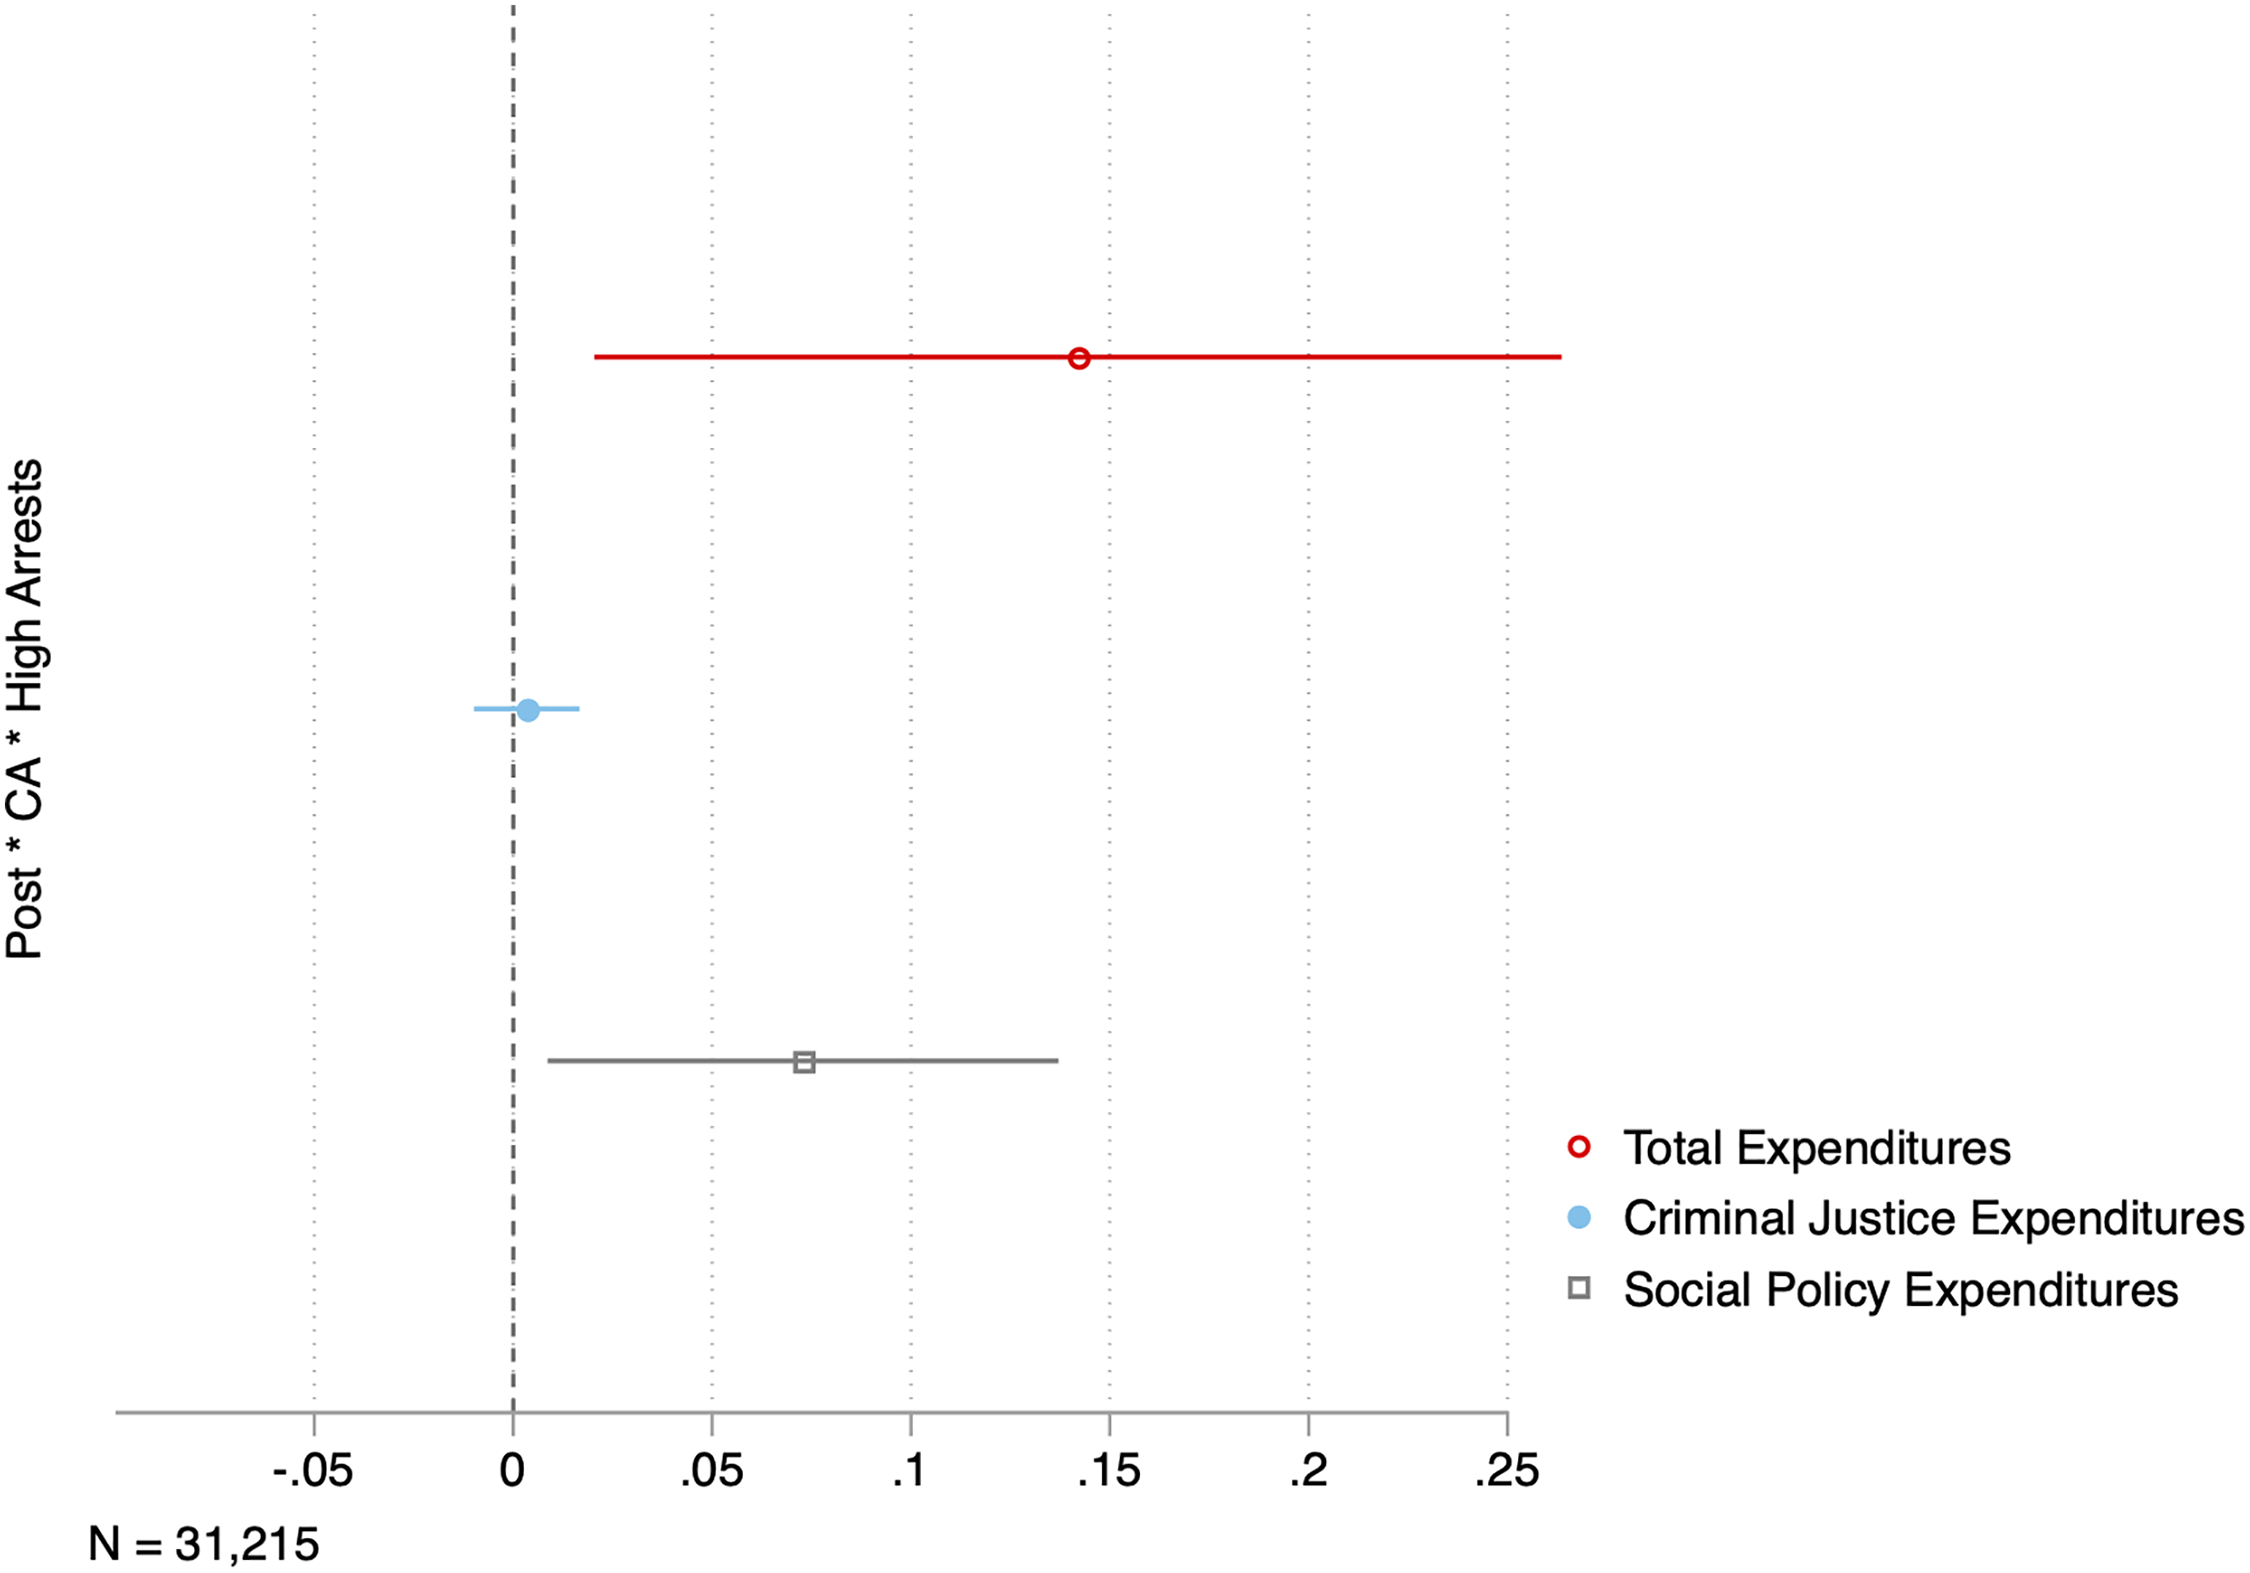
The impact of realignment on per capita spending at the city level.
Delving more deeply into this result, Figure 2 contains a plot of the three coefficients in Figure 1, as well as coefficients for three additional spending categories: operational expenditures for infrastructure, capital outlays for infrastructure, and all other spending. Descriptions of the specific expenditures included in these categories are listed in Supplemental Appendix Table A.2. For example, operational expenditures for infrastructure include spending for regular highways, local fire protection, general public buildings, natural resources, sewerage, solid waste management, sea and inland port facilities, water supply, electric power, and gas supply. As the plot shows, the increase in California cities’ total expenditures after Realignment does appear to be driven primarily by an increase in spending on social policies—the coefficients for criminal justice expenditures, infrastructure, and any remaining expenditures are all small and insignificant on their own.
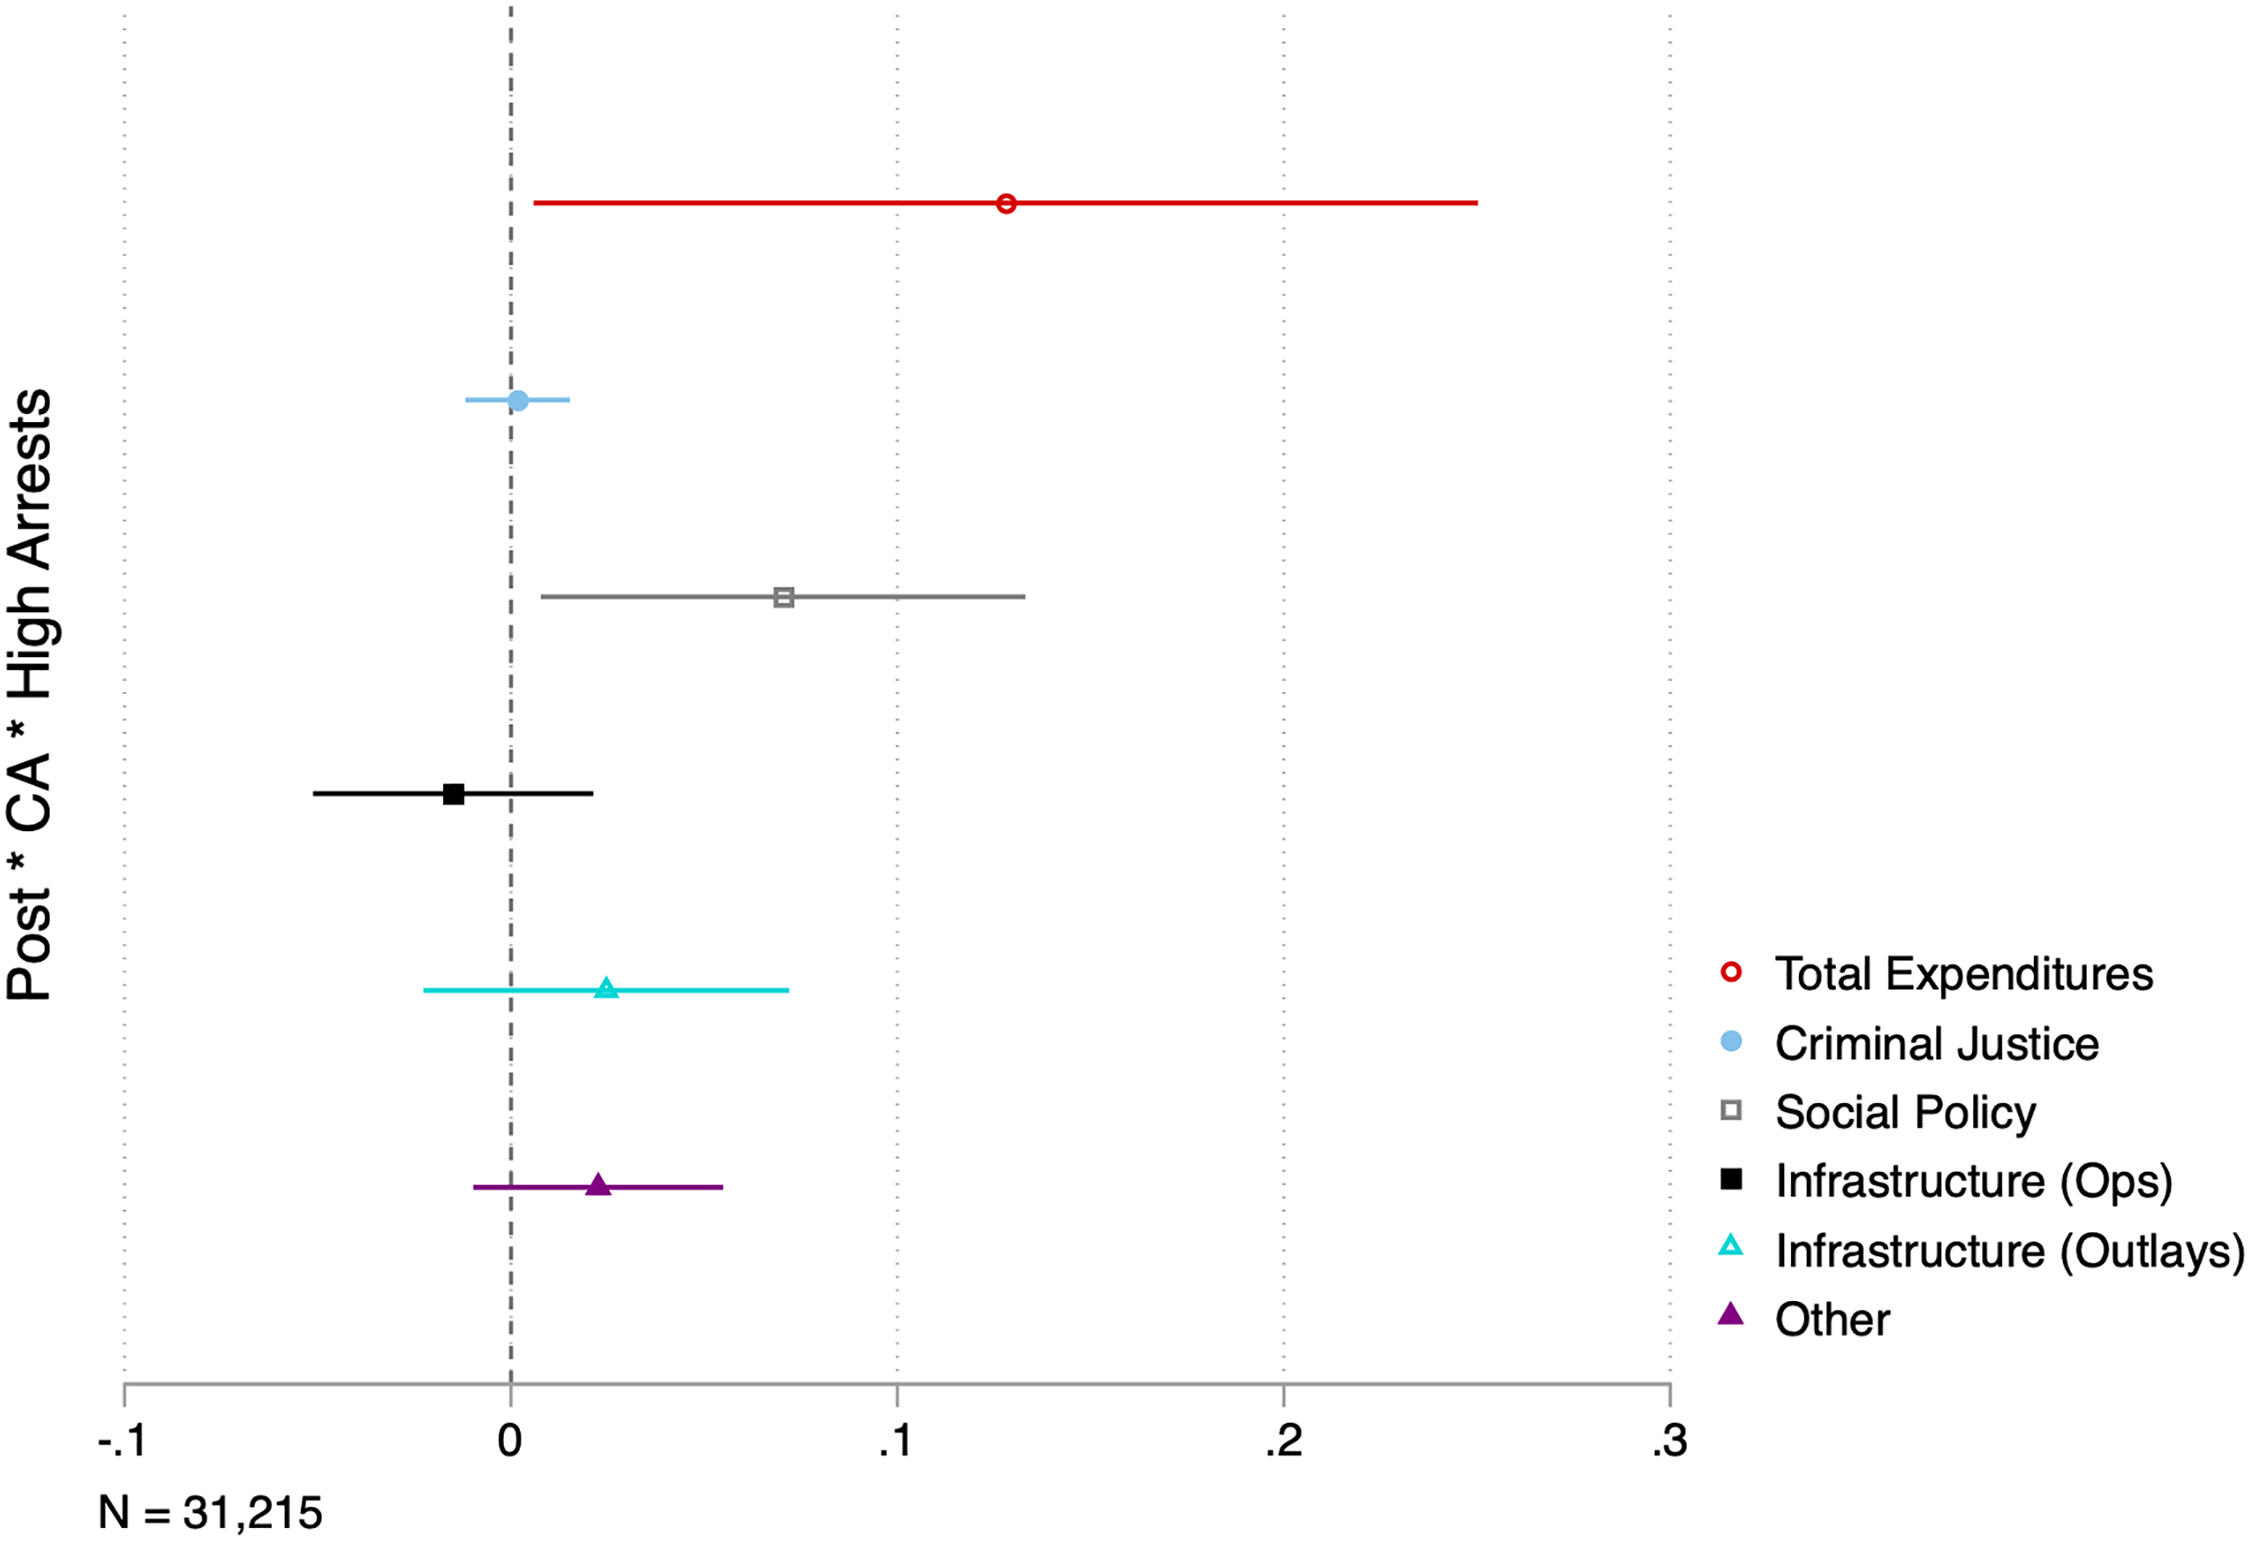
The impact of realignment on per capita spending at the city level—expanded.
One may be concerned that these results are due to an increase (or decrease) in funds, especially intergovernmental revenue (IGR), which incorporates grant funding for municipalities from federal, state, and other local governments. To ensure the results in Figure 1 are due specifically to the interaction between Realignment and treatment, I rerun the specification shown in equation (1), but with local, state, and federal IGRs as separate dependent variables. The results, listed in Supplemental Appendix Table A.3, show that Realignment, in conjunction with the high-arrest treatment, did not have a significant effect on IGRs, increasing the certainty that the observed increase in social policy expenditures in Figure 1 was due to a change in local policymakers’ prioritization after Realignment based on its anticipated impact.
In alignment with hypothesis 2, political ideology does appear to mitigate the relationship between Realignment and city spending. The results in Table 3 include both the results for the main outcome of interest (
The Impact of Realignment on Per Capita Spending With Ideological Interaction.
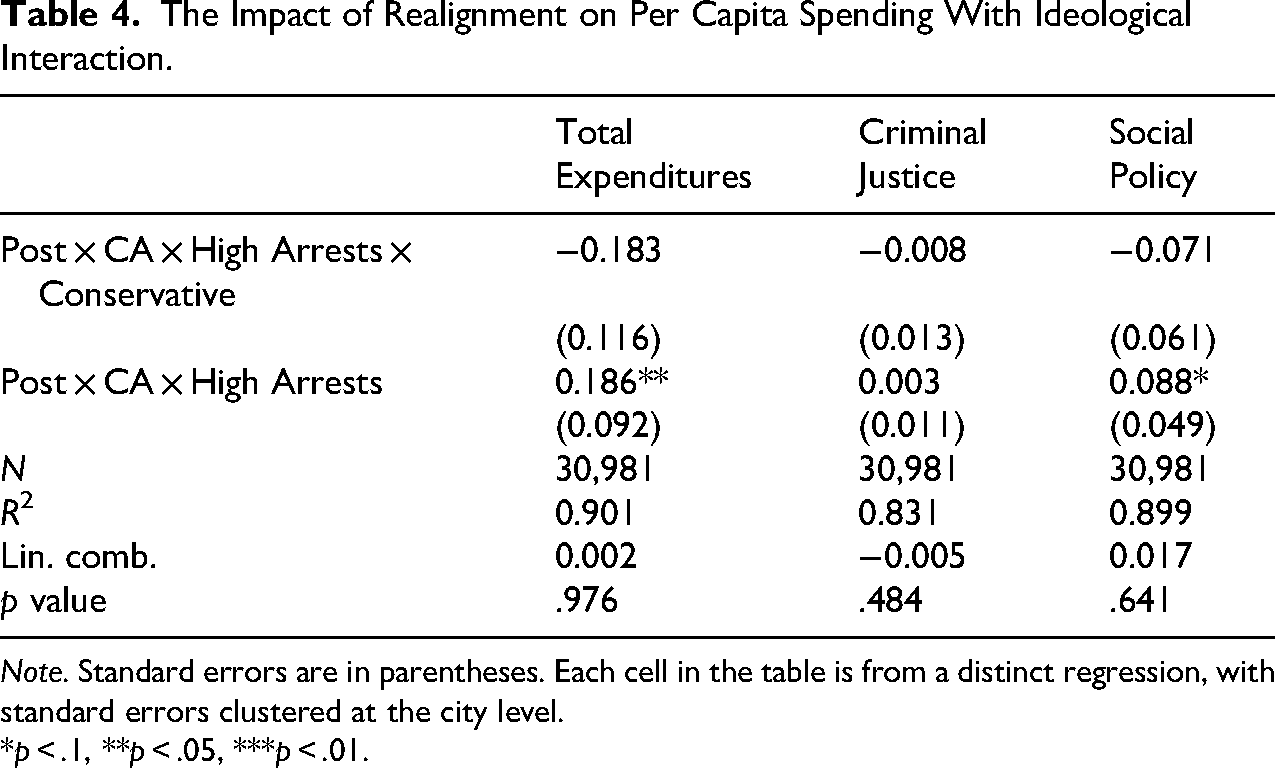
Note. Standard errors are in parentheses. Each cell in the table is from a distinct regression, with standard errors clustered at the city level.
*p < .1, **p < .05, ***p < .01.
The event studies in Figure 3a–c further illuminate my results. While the years pre- and post-Realignment are grouped in increments of two in these figures, I also include one-year event studies in Supplemental Appendix Figure A.2a – A.2c. There is no evidence of a relationship between arrests and spending in California cities prior to Realignment, satisfying the parallel trends assumption for difference-in-differences. Interestingly, while the results in Figure 3a–c align with those in Figure 1, there is heterogeneity in the significance of the results across years, suggesting the effects of Realignment on cities’ expenditures may have been short-lived. For example, the results in Figure 1 showed that Realignment led to an increase in social policy expenditures when interacted with a city's share of arrests. The coefficients shown in Figure 3a are in alignment with these results in sign, but lose their significance when disaggregated by year. However, the results in Figure 3b show significant decreases in criminal justice expenditures zero–one and two–three years after Realignment, while the results in Figure 1 are not statistically different from zero. Taken together, these results provide additional support for the hypothesis that cities in California actively responded to Realignment by decreasing their spending on law enforcement in the short term and increasing their spending for social policies on average (H1).
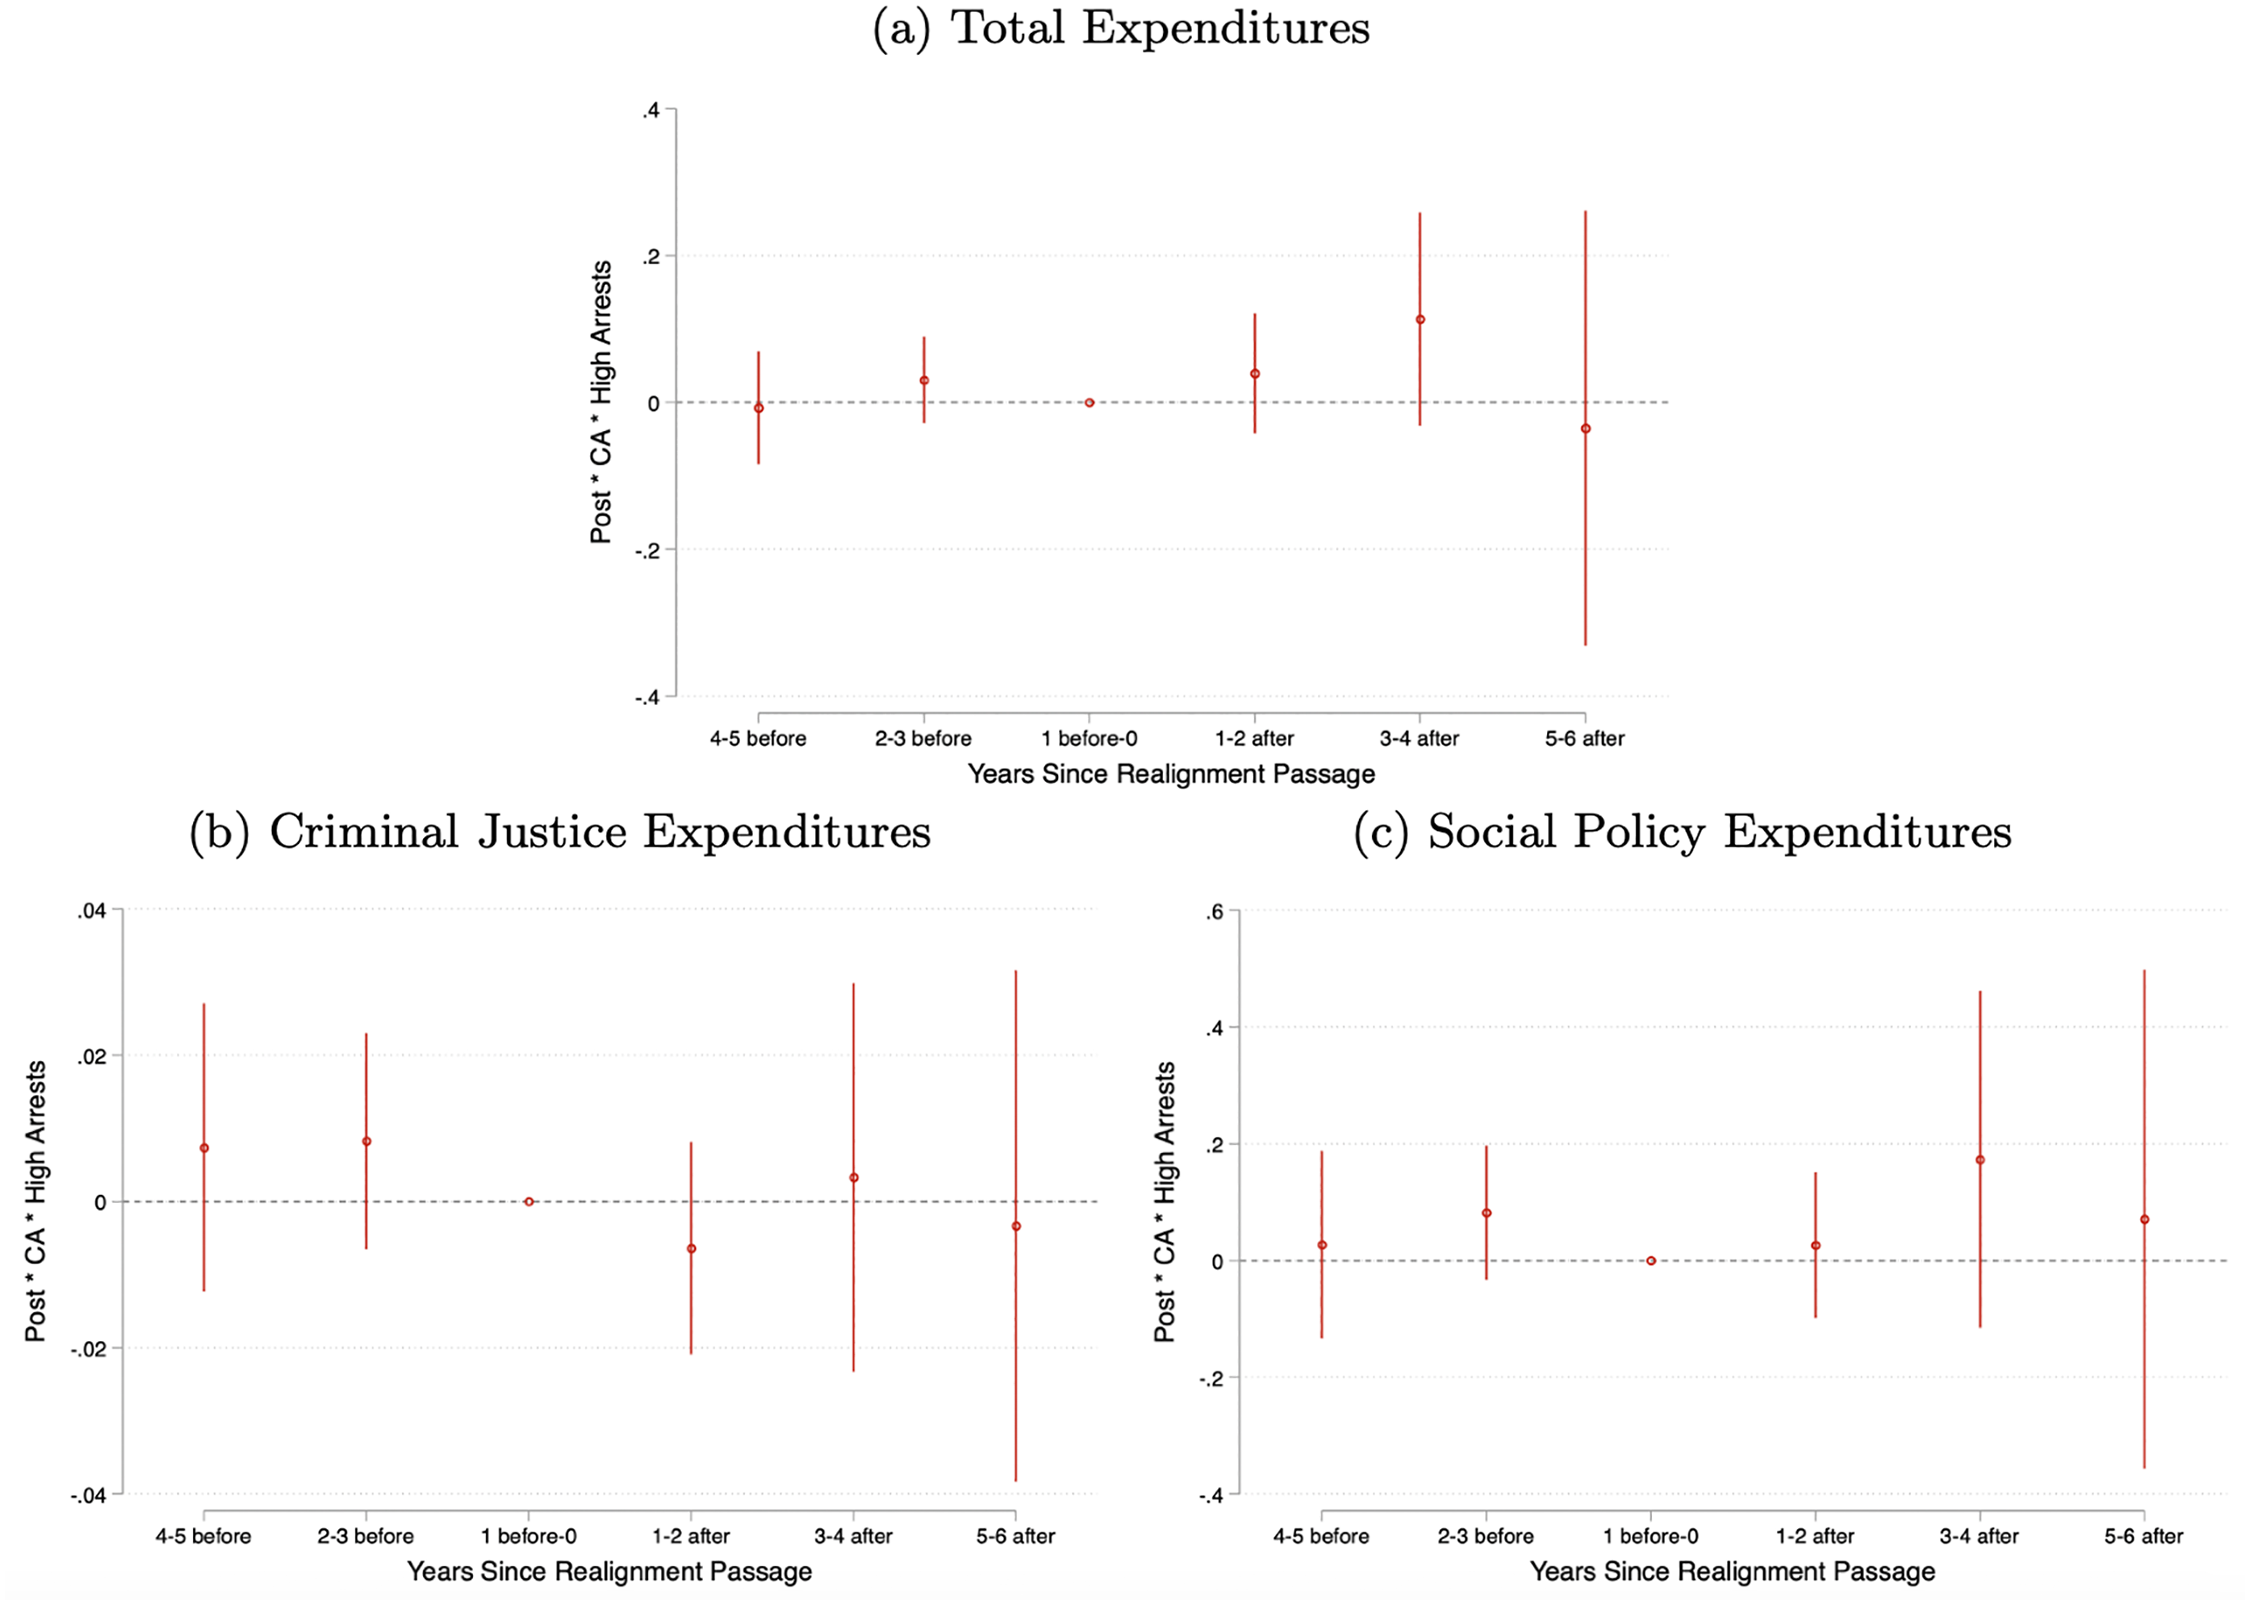
Two-year event studies: the impact of realignment on per capita spending at the city level. (a) Total expenditures. (b) Criminal justice expenditures. (c) Social policy expenditures.
As discussed in the third section, I substitute alternative measures for spending and arrests in Supplemental Appendix A to corroborate my results. Supplemental Tables A.6 and A.7 contain the results for my alternative specifications of expenditures: as shares of total expenditures and as a ratio of expenditures to total revenue, respectively. These results provide further evidence that cities in California generally did not respond to Realignment through increased law enforcement; the significant increase in social policy expenditures persists in the specification using expenditure shares as the dependent variable, and there is a significant decrease in criminal justice expenditures in the ratio specification. Supplemental Table A.4 contains the results for each social policy category and suggests that the effects observed in Figure 1 may be driven by increases in spending toward specifically housing and land use policies. Supplemental Table A.5 contains the results for each criminal justice expenditure category and suggests that while there appears to have been a significant reduction in judicial expenditures for high-arrest cities in California, the null results on corrections and policing expenditures drove the overall null result observed in Figure 1. While drawing strong conclusions about these subcategorical results is difficult given the small size of expenditures per capita in certain categories, these results do align with existing research on local policy-making that suggests policymakers focus their energy on areas over which they have most control, including housing and land use policies, and affirm the main result that expenditures did not change significantly in the more enforcement-related categories. Again, taking spending as an indicator of priority, the significant increase in housing and land use policies we observe in Supplemental Table A.4 may indicate this area was prioritized by local policymakers.
Supplemental Tables A.8 and A.9 contain the regression results for my alternative specifications of arrests. The results in Supplemental Table A.8, where I use a continuous measure of average arrests per capita rather than the binary high-arrest variable in my primary specification, have similar results to Figure 1, although the coefficient on social policy expenditures loses its significance. Given the distribution of the arrests variable in Supplemental Figure A.1, this suggests that Realignment did impact cities’ spending behavior, but only in cities that were more “treated,” a finding in alignment with H1. Finally, I empirically test whether the specific targeting of people who committed non–non–non offenses mattered for city policymakers’ responses. Supplemental Table A.9 shows the regression results for four increasingly conservative alternative definitions of qualifying arrests. The only significant coefficient is on the conservatively defined qualifying arrests variable, which corroborates the descriptive evidence in the third section that there were feedback effects due to the construction of the target population.
I also repeat my primary analysis using several subsamples that capture more similar cities on multiple dimensions to ensure that my results are not driven by the wide heterogeneity across U.S. cities and states. First, I limit my sample to only cities in Western states (as defined by the U.S. Census). The results in Supplemental Table A.10 are similar to those in Figure 1 but are not statistically significant. However, in Supplemental Table A.11, I incorporate propensity score weighting into my model based on race, political ideology, and income. The results from these regressions are similar in magnitude and significance to those in Figure 1, indicating that those results are not driven by heterogeneity in my sample of cities. This is further corroborated in Supplemental Table A.12, where I remove cities in states with the strongest preemption laws to create a sample of cities with more similar legal environments. The results in this table are also similar in magnitude and significance to those in Figure 1—spending on social policy remains significantly higher post-Realignment for California cities with a high number of arrests per capita in relation to other places.
Discussion and Conclusions
Taken together, my empirical results and robustness checks support my two hypotheses: Places with a high share of arrestees prior to Realignment did significantly increase their spending on social policy and did not change their spending behavior on criminal justice. Ideology appears to mitigate this relationship—the significant results in Figure 1 appear to be driven by more liberal cities. My primary theoretical claim is that this occurred because of policy feedback effects. The design of Realignment generated both resource and feedback effects that shaped the way local policymakers responded to the policy. Specifically, the policy was designed to (and did) reduce the number of people incarcerated in state prisons and jails. This functionally meant that there would be a higher number of justice-involved people “on the street,” an outcome that would have substantially impacted cities, especially in places with more criminal activity. However, Realignment did not include any provisions that directly impacted city resources (as evidenced in Supplemental Table A.3). Thus, cities were left to choose how to respond to reduced incarceration: by increasing law enforcement or by investing in social policy benefits. The descriptive evidence from the LocalView transcripts corroborates the empirical evidence that it was the design of Realignment that led local policymakers to choose the latter strategy. Local policymakers felt that increased law enforcement would lead to redundancy, exacerbating the “revolving door” problem in their local jails. Trying to reduce incarceration and recidivism was a more pragmatic strategy. This paper provides evidence that increased investment in social policy was a part of this strategy, along with specific programs targeting reentry.
In addition to resource effects, this paper also provides descriptive evidence that interpretive effects led policymakers not to pursue increased law enforcement in response to Realignment. The specific targeting of people who had been incarcerated for nonviolent, nonsexual, nonserious crimes impacted policymakers’ attitudes toward Realignment as a whole and may have made focusing on reducing incarceration and recidivism a more politically viable option. The combination of resource and interpretive effects led to policy feedback, in which cities (particularly those ideologically aligned with the state) responded to Realignment by increasing spending on social policy, indicating the prioritization of easing reentry and reducing reincarceration, goals in alignment with the overall purpose of Realignment (which was to reduce the number of incarcerated people in state prisons).
This study contributes to the feedback literature by providing evidence that the mechanisms for feedback effects between cities and states combine those traditionally associated with government-to-government effects (resource and interpretive) and those associated with mass feedback effects (problem salience and duration of exposure). I have also shown that the relationship between social policy and criminal justice policy that has been observed in existing empirical literature may be the consequence of feedback effects, in which federal and/or state-level reforms to either criminal justice or social policy impact subsequent policy-making in the other area. A question that is left unanswered, however, is who benefits from the increases in social policy spending observed in this study, and from social policy expansions more broadly? This question directly connects to the empirical literature cited above, which documents an individual-level connection between social welfare benefit access and criminal justice outcomes. The feedback effects documented in this study reflect the individual-level mechanisms that have been proposed in research on the relationship between social welfare benefit access and recidivism, which essentially argue that the resource effects associated with social policy expansions lead to reduced recidivism. A primary avenue of interest for future research, then, is a deeper exploration of the individual-level impacts of increased access to social policy benefits beyond but including incarceration and recidivism, especially in conjunction with criminal justice policy reforms aimed at reducing the size of incarcerated populations, to see whether these reforms result in improved outcomes for these populations, not only in their carceral contact, but in their material well-being along multiple dimensions.
Supplemental Material
sj-docx-1-uar-10.1177_10780874261449664 - Supplemental material for Decarceration and…? Local Policy Responses to State-Level Criminal Justice Reform
Supplemental material, sj-docx-1-uar-10.1177_10780874261449664 for Decarceration and…? Local Policy Responses to State-Level Criminal Justice Reform by Michaela I. Cushing-Daniels in Urban Affairs Review
Footnotes
Funding
The author received no financial support for the research, authorship, and/or publication of this article.
Declaration of Conflicting Interests
The author declared no potential conflicts of interest with respect to the research, authorship, and/or publication of this article.
Supplemental Material
Supplemental material for this article is available online.
Notes
Author Biography
References
Supplementary Material
Please find the following supplemental material available below.
For Open Access articles published under a Creative Commons License, all supplemental material carries the same license as the article it is associated with.
For non-Open Access articles published, all supplemental material carries a non-exclusive license, and permission requests for re-use of supplemental material or any part of supplemental material shall be sent directly to the copyright owner as specified in the copyright notice associated with the article.