
Abstract
The Sex Offender Treatment Intervention and Progress Scale (SOTIPS) is a 16-item rating scale designed to assess dynamic risk among adult male sex offenders and degree of change at 6-month intervals during treatment. The purpose of the present study was to examine the psychometric properties of the SOTIPS in a construction sample of 759 adult male sex offenders who were under correctional supervision and enrolled in cognitive-behavioral community treatment in Vermont between 2001 and 2007. The scale showed acceptable interrater reliability. SOTIPS scores at 1, 7, and 13 months after participants began treatment predicted sexual, violent, and any recidivism, and return to prison at fixed 1- and 3-year follow-up periods (AUCs = .60 to .85). Combined SOTIPS and Static-99R scores predicted all recidivism types (AUCs = .67 to .89) and outperformed either instrument alone when both instruments had similar predictive power. Participants who demonstrated treatment progress, as reflected by reductions in SOTIPS scores, showed lower rates of recidivism than those who did not.
Keywords
Risk assessment is a critical task in the effective management of sex offenders. Risk assessments inform decisions on sentencing, community registration and notification, treatment, supervision, release from detention, and discharge from services. Consequently, risk assessments can have a profound impact on community safety, offenders’ liberty, and wise allocation of public resources.
The effectiveness of risk-assessment methods has improved dramatically over the past two decades, though room for improvement still exists. Advances in risk assessment can be marked in four major phases (Bonta & Wormith, 2008). First-generation risk-assessment approaches rest on unstructured professional judgment. Criticisms of this approach are that it is subjective, inconsistent, biased, and not as reliable or as accurate as structured, empirically based risk-assessment methods (Grove, Zald, Lebow, Snitz, & Nelson, 2000; Hanson & Morton-Bourgon, 2009).
In the sex offender treatment field, second-generation risk-assessment instruments began emerging in the late 1990s. These structured actuarial measures are composed primarily of static risk factors, that is, unchangeable aspects of an individual’s past, such as criminal history and victim characteristics. Static actuarial instruments include the Rapid Risk Assessment for Sex Offense Recidivism (RRASOR; Hanson, 1997), Risk Matrix 2000 Sexual (RM2000/S; Thornton et al., 2003), Static-99 (Hanson & Thornton, 2000), Static-99R (Helmus, Thornton, Hanson, & Babchishin, 2011), Static-2002 (Hanson, Helmus, & Thornton, 2009), and Static-2002R (Helmus et al., 2011). Some second-generation actuarial risk instruments also include a small number of dynamic risk factors, sometimes called criminogenic needs. These elements are changeable risk factors such as pro-offending attitudes and offense-related sexual interests. Examples of instruments that include mostly static but some dynamic risk factors are the Minnesota Sex Offender Screening Tool–Revised (MnSOST-R; Epperson et al., 1998), Sexual Violence Risk–20 (SVR-20; Boer, Hart, Kropp, & Webster, 1997) and Vermont Assessment of Sex Offender Risk (VASOR; McGrath & Hoke, 2001). They are arguably second-generation instruments because they do not include a sufficient number of dynamic risk factors to inform rehabilitation services decisions in a comprehensive manner.
Contemporary research has increasingly focused on developing third-generation instruments which combine static and relatively inclusive collections of dynamic risk predictors in a single risk-needs instrument or “set” of instruments. Adding multiple dynamic factors in the risk-assessment equation leads to more comprehensive evaluations and has the potential to incrementally increase the long-term predictive accuracy of static instruments. As, by definition, dynamic risk factors are potentially changeable, risk-needs instruments also offer direction to providers about how to identify and target offenders’ criminogenic needs to reduce their risk to reoffend. Risk-needs instruments that fully integrate assessments with ongoing case planning are called fourth-generation risk-assessment tools (Bonta & Wormith, 2008).
Individual dynamic risk factors have been reviewed in a series of meta-analyses (Hanson & Morton-Bourgon, 2004, 2005; Mann, Hanson, & Thornton, 2010). Approaches to identifying dynamic risk factors have included offender self-report psychometric batteries (Allan, Grace, Rutherford, & Hudson, 2007; Beech, Friendship, Erikson, & Hanson, 2002), clinician-administered scales (Anderson, Gibeau, & D’Amora, 1995; Looman, Abracen, Serin, & Marquis, 2005), and goal-attainment scaling (Barrett, Wilson, & Long, 2003; Hogue, 1994).
Third-generation sex offender risk-needs models that have relatively inclusive collections of dynamic risk factors and have undergone empirical examination are few in number. The Violence Risk Scale–Sexual Offender Version (VRS-SO; Olver, Wong, Nicholaichuk, & Gordon, 2007) consists of 7 static and 17 dynamic risk items. In a sample of 321 incarcerated mixed-type sex offenders followed up for an average of 10 years postrelease, the scale predicted sexual and nonsexual violent recidivism with moderate accuracy (Olver et al., 2007). The total dynamic scale score made a significant incremental contribution to predicting sexual recidivism after controlling for static risk. More recently, Olver and Wong (2011), using the Static-99 as a static risk measure and the VRS-SO dynamic scale as the dynamic measure, found that high-risk/low-change offenders recidivated at significantly higher rates than high-risk offenders who demonstrated greater treatment change. Studies using the VRS-SO in New Zealand replicated some of these findings in a sample of 218 relatively low-risk child molesters who participated in a prison treatment program. In these studies, the VRS-SO showed good predictive validity (Beggs & Grace, 2010) and an association between treatment gain and reduced recidivism at an average 12-year follow-up (Beggs & Grace, 2011).
The structured risk assessment model (SRA; Thornton, 2002) integrates static risk measures with those of four dynamic risk domains: sexual interests, distorted attitudes, socioaffective functioning, and self-management. In a sample of 117 adult male sex offenders who served prison sentences in the United Kingdom, Static-99 and SRA dynamic scores (absent sexual interest scores which were unavailable) predicted sexual reconviction better than either the static or the dynamic measure alone at a mean time-at-risk of about 3 years (Thornton, 2002). More recently, the SRA model has predicted sexual recidivism with moderate accuracy in a sample of 513 high-risk civilly committed adult male sex offenders at 5- and 10-year follow-up periods (Knight & Thornton, 2007), and among a sample of 119 child molesters drawn from one prison and several community sites in the United Kingdom (Craig, Thornton, Beech, & Browne, 2007).
Hanson and his associates have developed and studied an integrated set of static and dynamic instruments (Static-99, Stable-2007, and Acute-2007) in a landmark prospective study involving more than 900 sex offenders from 16 North American sites (Hanson, Harris, Scott, & Helmus, 2007). The Static-99 is composed of 10 static risk factors, the Stable-2007 contains 13 relatively enduring but changeable dynamic risk factors (e.g., poor problem solving) and the Acute-2007 contains 7 rapidly changeable risk factors (e.g., access to victims; Hanson et al., 2007; Hanson & Thornton, 2000). Combined initial scores on these measures were more predictive of sexual recidivism at a median 41-month follow-up period than static scores alone (Hanson et al., 2007). Change scores computed for subsequent administrations of the dynamic measures, however, were not related to recidivism. More recently, in a German-speaking sample of 263 sex offenders, the Stable-2007 added incremental predictive accuracy to the Static-99 for violent and general recidivism but not for sexual recidivism (Eher, Matthes, Schilling, Haubner-MacLean, & Rettenberger, 2011).
Purpose of the Present Study
The purpose of the present study was to examine the psychometric properties of a new dynamic risk rating scale, the Sex Offender Treatment Intervention and Progress Scale (SOTIPS; McGrath, Lasher, & Cumming, 2011). Its predictive accuracy was examined alone and in combination with a commonly used static risk measure, the Static-99R, for sexual, violent, and any criminal reoffending, and return to prison. Participants were 759 adult male sex offenders enrolled in community treatment in Vermont. The SOTIPS contains 16 items extracted from the 22-item Sex Offender Treatment Needs and Progress Scale (SOTNPS; McGrath & Cumming, 2001, 2003).
Method
Setting
The sample was drawn from adult male sex offenders enrolled in community treatment in Vermont. Vermont is a state of small cities, towns, and rural areas with a population of 625,741 (U.S. Census Bureau, 2010). The Vermont Treatment Program for Sexual Abusers (VTPSA) is the state’s integrated network of 3 prison and 13 outpatient programs operated by the Vermont Department of Corrections (DOC). There are no state or county jails in Vermont. The DOC contracts with private agencies and treatment providers to deliver treatment services. The program uses a primarily cognitive-behavioral group treatment model and is designed to have treatment providers and supervision officers work in collaborative teams (McGrath, Cumming, Livingston, & Hoke, 2003; McGrath, Hoke, & Vojtisek, 1998).
Program
In 2001, the VTPSA began requiring contracted community treatment providers to complete risk and needs assessments on all program admissions. The initial assessment included the Static-99 (Hanson & Thornton, 2000), Vermont Assessment of Sex Offender Risk (VASOR; McGrath & Hoke, 2001) and Sex Offender Treatment Needs and Progress Scale (SOTNPS; McGrath & Cumming, 2001, 2003). Per contract, providers were directed to readminister the SOTNPS needs assessment to clients in January and July of each year. Staff completed 1-day trainings and follow-up supervision on how to administer, score, and interpret these measures. The goal was for treatment providers to use assessment results for treatment planning, provide copies to probation and parole officers to inform supervision services, and forward copies to VTPSA directors for quality assurance and research purposes.
Participants
Participants were 759 adult male sex offenders under correctional supervision in Vermont who met four criteria. First, they were convicted of at least one sexual offense against an identifiable child or nonconsenting adult victim (Category “A” sexual offense as defined in the Static-99 coding manual; Harris, Phenix, Hanson, & Thornton, 2003). Using this definition, individuals whose sexual crimes were limited to offenses such as prostitution, statutory rape, or child pornography possession were excluded from the study. Second, participants entered a VTPSA-sponsored community sex offender treatment program between 2001 and 2007. Third, the time period from when they began VTPSA-sponsored treatment to the end date of the study follow-up period on December 31, 2010 was at least 3 years. Fourth, their treatment provider evaluated them using the SOTNPS at least once during the study period and submitted the results to the researchers. Based on analyses of DOC databases, an estimated additional 357 sex offenders were placed on community supervision in Vermont between 2001 and 2007 did not meet study criteria because they did not attend treatment or, if they did, their therapists did not submit assessments. Table 1 shows additional characteristics of the sample. Offender types were based on definitions established by the Association for the Treatment of Sexual Abusers (Gordon et al., 1998).
Descriptive Statistics (N = 759)

Measures
SOTIPS
The SOTIPS is a provider-administered rating scale composed of 16 dynamic risk items (shown later in Table 3). It is designed to aid clinicians and probation and parole officers in identifying and monitoring the supervision and treatment needs of adult male sex offenders.
The SOTIPS was constructed by extracting 16 items from the 22-item Sex Offender Treatment Needs and Progress Scale (SOTNPS; McGrath & Cumming, 2001, 2003). The original SOTNPS items were selected based on a literature review and consensus of an expert panel (McGrath & Cumming, 2001, 2003). About one fifth of community sex offender programs in the United States report using the SOTNPS (McGrath, Cumming, Burchard, Zeoli, & Ellerby, 2010) but it has undergone minimal empirical study (McGrath, Cumming, & Livingston, 2005).
The 16 items that comprised the SOTIPS were selected because they showed a statistically significant relationship to sexual recidivism based on AUC analyses in the current sample (McGrath, Lasher, & Cumming, 2011). Item definitions and scoring instructions for the retained 16 SOTIPS items remained unchanged. Scoring instructions direct SOTIPS users to score clients at intake and thereafter every 6 months on a 4-point scale; minimal to no need for improvement, some need for improvement, considerable need for improvement, and very considerable need for improvement. SOTIPS total scores range from 0 to 48 and are organized into three risk/need groups: low (0 to 10), moderate (11 to 20) and high (21 to 48).
Static-99R
The Static-99R is a 10-item actuarial instrument designed to assess the recidivism risk of adult males known to have committed at least one sexual offense (Helmus et al., 2011). Items are identical to the Static-99 (Hanson & Thornton, 2000; Harris et al., 2003), with the exception of updated age weights. The 10 items pertain to sexual and nonsexual offense history, victim characteristics, and offender demographics. Total scores range from −3 to 12 points and are organized into four risk groups; low (–3 to 1), moderate-low (2 to 3), moderate-high (4 to 5), and high (6 to 12). A recent meta-analysis of 63 studies found a moderate relationship between Static-99 and sexual recidivism (Hanson & Morton-Bourgon, 2009). The authors of the Static-99/R now recommend that evaluators use the revised version of the scale (Helmus et al., 2011).
Outcome Measures
Recidivism data were coded for each study participant for all new charges for sexual, violent (sexual or nonsexual violence), and any criminal offenses, and returns to prison. The definition of a new sexual offense included a charge for a violation of supervision conditions if the incident could have been charged as a criminal sexual offense. Charges were counted based on criminal record checks in the states where each participant was known to have resided during the study period. The Vermont DOC computer database was used to identify violation of supervision charges and returns to prison.
Procedure and Data Analyses
A trained and experienced master’s-level research assistant used DOC case files and databases to code demographic and offense characteristic information on each participant. The research assistant also scored participants on the Static-99R based on their status as of the date of community placement and, when scores already existed, ensured their accuracy. A second rater, the first or third author of this study, independently scored the Static-99R on approximately every tenth case to assess interrater reliability. To assess interrater reliability of the SOTIPS, pairs of 17 experienced treatment providers and 24 probation and parole officers independently rated 320 active cases.
Analyses examined the SOTIPS factor structure and compared scores of sexual recidivists to nonrecidivists. The area under the curve of the receiver operating characteristic (AUC) statistic was used to examine predictive accuracy of the SOTIPS and Static-99R, individually and in combination, for sexual, violent, and any recidivism, and return to prison for six assessment waves. The six assessments waves were 1- and 3-year follow-up periods following participants’ SOTIPS scores at three assessment times, referred to as Times 1, 2, and 3. Time 1 SOTIPS scores were those that providers completed during the first 3 months that a participant was in treatment, Time 2 scores between 4 and 9 months, and Time 3 scores between 10 and 15 months. Table 2 shows sample sizes, mean scores, sexual recidivism rates, and other descriptive statistics for Times 1 to 10 SOTIPS scores. Times 4 to 10 SOTIPS scores did not show predictive accuracy and are not described further.
SOTIPS Mean Scores and Sexual Recidivism Rates by Score Times

Note: Follow-up periods for Times 6 to 10 were less than 3 years and for Time 10 was less than 1 year.
Sample sizes for the six assessment waves varied due to participants recidivating, dropping out of treatment, not having enough time in the community to be included in the 3-year assessment waves, and having records that were missing data. Most missing data concerned providers not completing SOTIPS score sheets in a timely manner. For example, almost all of the 153 (20.2%) missing Time 1 SOTIPS score sheets were missing because providers did not score these participants until they entered the Time 2 assessment waves.
For AUC analyses comparing and combining SOTIPS and Static-99R scores, we used categorized scores for both instruments (SOTIPS scores of low, moderate, and high; Static-99R scores of low, moderate-low, moderate-high, and high). This method was implemented to reduce the number of between-instrument interactions and increase the likelihood of yielding statistically and clinically useful results that could be described in simple multiaxial tables. The AUC statistic is a recommended index of predictive accuracy for relatively low base-rate phenomena such as sexual reoffending (Rice & Harris, 1995). It represents the probability that a randomly selected recidivist will have a higher score on a risk measure than will a randomly selected nonrecidivist. AUC values range from 0 to 1, with .5 representing chance-level prediction and 1 representing perfect prediction.
Recidivism was coded as a binary variable (yes or no recidivism, coded 1 or 0). Analyses were limited to testing for first-time recidivism for each type of event (sexual, violent, and any recidivism, and return to prison). Participants who recidivated following a SOTIPS Time 1, 2, or 3 score were removed from the sample for further analyses concerning that type of recidivism. Sexual recidivists were removed from the sample as of the date of their first new sexual charge.
Recidivism events occurring before the beginning each of the six assessment wave periods (i.e., before a participant was scored on the SOTIPS), obviously, were not considered in AUC analyses for those waves. During the time frame between the dates participants were placed in the community and began treatment (M = 88 days; Mdn = 54 days; SD = 143 days) and between beginning treatment and their first SOTIPS score (M = 31 days; Mdn = 14, SD = 49 days), 7 (0.9%) individuals were charged with a new nonsexual offense and 39 (5.1%) were reincarcerated for new offenses or for technical violations.
Logistic regression analyses were used to develop models for predicting recidivism using combined SOTIPS and Static-99R total scores. Best possible models for predicting all four recidivism types during each of the three time periods were developed by testing for the best goodness-of-fit deviance χ2 between the cumulative logistic coefficients of the main effects in a multiple logistic regression model and the Static-99R × SOTIPS interaction in a simple logistic regression model. To calculate reoffense probabilities and 95% confidence intervals from logistic coefficients, we followed Sofroniou and Hutcheson’s (2002) recommended formulas. As the purpose of the SOTIPS is to provide repeated information on the same subject over time, we used the generalized estimating equations (GEE) approach (Liang & Zeger, 1986) to conduct repeated-measures logistic regression analyses for combined Static-99R + SOTIPS risk groups across the six assessment waves. The strength of GEE is that it accounts for the correlations within subjects for repeated measures when conducting regression analyses and provides more simplified information for practical use and comparison over time.
To create an overall predictive model, GEE analyses were conducted using a binary logistic regression model. As these GEE analyses were an extension of the individual logistic regression analyses, model comparisons were again tested for the best combination model between the cumulative logistic coefficients in a multiple logistic regression model and the Static-99R × SOTIPS interaction in a simple logistic regression model. We tested for the lowest possible Quasi Likelihood Under Independence Model Criterion (QIC) or Corrected Quasi Likelihood Under Independence Model Criterion (QICC), an adaptation of Akaike Information Criteria (AIC) for repeated measures in GEE, and testing for acceptable goodness-of-fit deviance χ2. Sofroniou and Hutcheson’s (2002) recommendations were used for calculating reoffense probabilities and confidence intervals for logistic coefficients generated by GEE analyses.
Finally, we categorized GEE reoffense probabilities into four risk bands (low, low-moderate, moderate-high, and high) and entered them into a second set of GEE regression analyses using an interval-censored survival model (Finkelstein, 1986) to conduct repeated-measures survival analyses. The parameter estimates generated by these regression analyses were used to plot survival curves for the four recidivism types. Likelihood Ratio tests were used to test for overall significant differences between survival rates between risk groups, and Mantel-Cox Log Rank tests (Collett, 2003; Mantel, 1966) were conducted to test for overall significant differences between survival curves for each of the four types of recidivism.
The final categorized combined model scores were compared with Static-99R categorized scores using net reclassification improvement (NRI; Pencina, D’Agostino, D’Agostino, & Vasan, 2007). The NRI statistic indicates the degree of improvement in an AUC when comparing two different predictors with similar classification schemes.
All statistical analyses were conducted with SPSS (version 17.0), except for recidivism probability and confidence interval calculations for logistic regression and binary logistic GEE analyses (Sofroniou & Hutcheson, 2002), Mantel-Cox Log Rank tests (Collett, 2003, p. 43) used for the interval censored survival GEE analyses and NRIs (Pencina et al., 2007), which were calculated using Microsoft Excel 2003 macros written for this study.
Results
Descriptive Statistics and Interrater Reliability
The overall recidivism rates for the entire sample of 759 participants at a fixed 3-year follow-up period from the date of placement in the community were as follows: sexual, 4.6% (35); any violent, including sexual, 8.6% (65); any criminal recidivism, 23.1% (175); and return to prison, 40.6% (308). Subtracting days participants were in prison during the 3-year fixed follow-up period, time-at-risk in the community was an average of 33.6 months.
As shown in Table 1, the mean participant Static-99R scores were in the moderate-low risk range (M = 2.48; SD = 2.09) and the interrater reliability for the 109 cases scored by two raters was quite good with a single-measure interclass correlation coefficient (ICC) of .89.
As shown in Table 2, mean participant SOTIPS scores at Times 1, 2, and 3 were all in the moderate range (11 to 20) whereas Time 4 to 10 scores were all in the low range (0 to 10). Total SOTIPS scores showed acceptable interrater reliability based on two independent ratings of 320 pooled cases scored by pairs of 17 experienced treatment providers and 24 probation and parole officers (McGrath et al., 2005). The total SOTIPS score single-measure ICC was .77, and the average measure was .87. For each of the three SOTIPS factors (see Factor Analyses section), scores also showed acceptable single- and average-measure ICCs; for Sexual Deviance they were .68 and .81, respectively; for Criminality, .76 and .86, respectively; and for Social Stability and Supports, .69 and .82, respectively. Individual-item ICCs were typically lower and had a wide range for both single-measure ICCs (.39-.71) and average-measure ICCs (.56-.83). All ICCs were significant at p < .001. The 95% confidence intervals for all item, factor and total scores overlapped, indicating no significant differences between these scores or between the two samples. The standard error of measurement (SEM) using the pooled total score single and average measure ICCs were 3.45 and 2.59, respectively, both at the 68% confidence level.
Factor Analyses
Table 3 shows the factor loadings for the 16 SOTIPS items following exploratory principle components analyses with Varimax rotation for scores at Time 2. Three factors were identified; Sexual Deviance, Criminality, and Social Stability and Supports. Analyses were also conducted on Times 1 and 3 scores, but only the results for Time 2 are shown. Time 1 scores were typically poor predictors of recidivism relative to Time 2 and 3 scores, which loaded similarly within a three-factor solution. This conclusion was based on extracting components with eigenvalues greater than 1. Total variance accounted for by these three components was slightly greater at Time 2 (58.66%) than at Time 3 (57.82%). Factor structures for child-victim-only and adult-victim-only offenders were similar to the full sample factor structure for Sexual Deviance and Criminality items, but some Social Stability and Supports items loaded on other factors within each subgroup. For these items, there were only small differences in the factor loadings between the full-sample primary loaded factor (as seen in Table 3) and the subgroup-primary loaded factor.
Factor Loadings for Exploratory Factor Analysis With Varimax Rotation of SOTIPS Items

Note: Factor loadings are based on Time 2 SOTIPS scores at 4 to 9 months after client started treatment.
Highest factor loading for each item.
Comparisons of Sexual Recidivists and Nonrecidivists
Multiple ANOVAs using the Bonferonni correction found significant between-subjects effects when comparing sexual recidivists and nonrecidivists at Time 1, F(48, 552) = 1.68, corrected p < .05, Time 2, F(49, 584) = 3.00, corrected p < .001, and Time 3, F(49, 499) = 1.90, corrected p < .01. As shown in Table 4, multiple repeated measure analyses of variance (RMANOVA) using the Bonferonni correction compared item and total SOTIPS scores for within-subjects effects for 18 sexual recidivists and 434 nonrecidivists. Recidivists showed no significant changes in scores across time with F scores ranging from 0 to 2.87 (df = 2, 902). Nonrecidivists showed no significant reductions for Criminal Behavior or Cooperation with Supervision and Employment, but there were significant (corrected p < .05 or better) reductions on all other items with F scores ranging from 5.81 to 123.23 (df = 2, 902) as well as the total score, F(2, 902) = 82.56, corrected p < .001.
Repeated-Measures ANOVAs of SOTIPS Items and Total Scores for Sexual Nonrecidivists and Recidivists
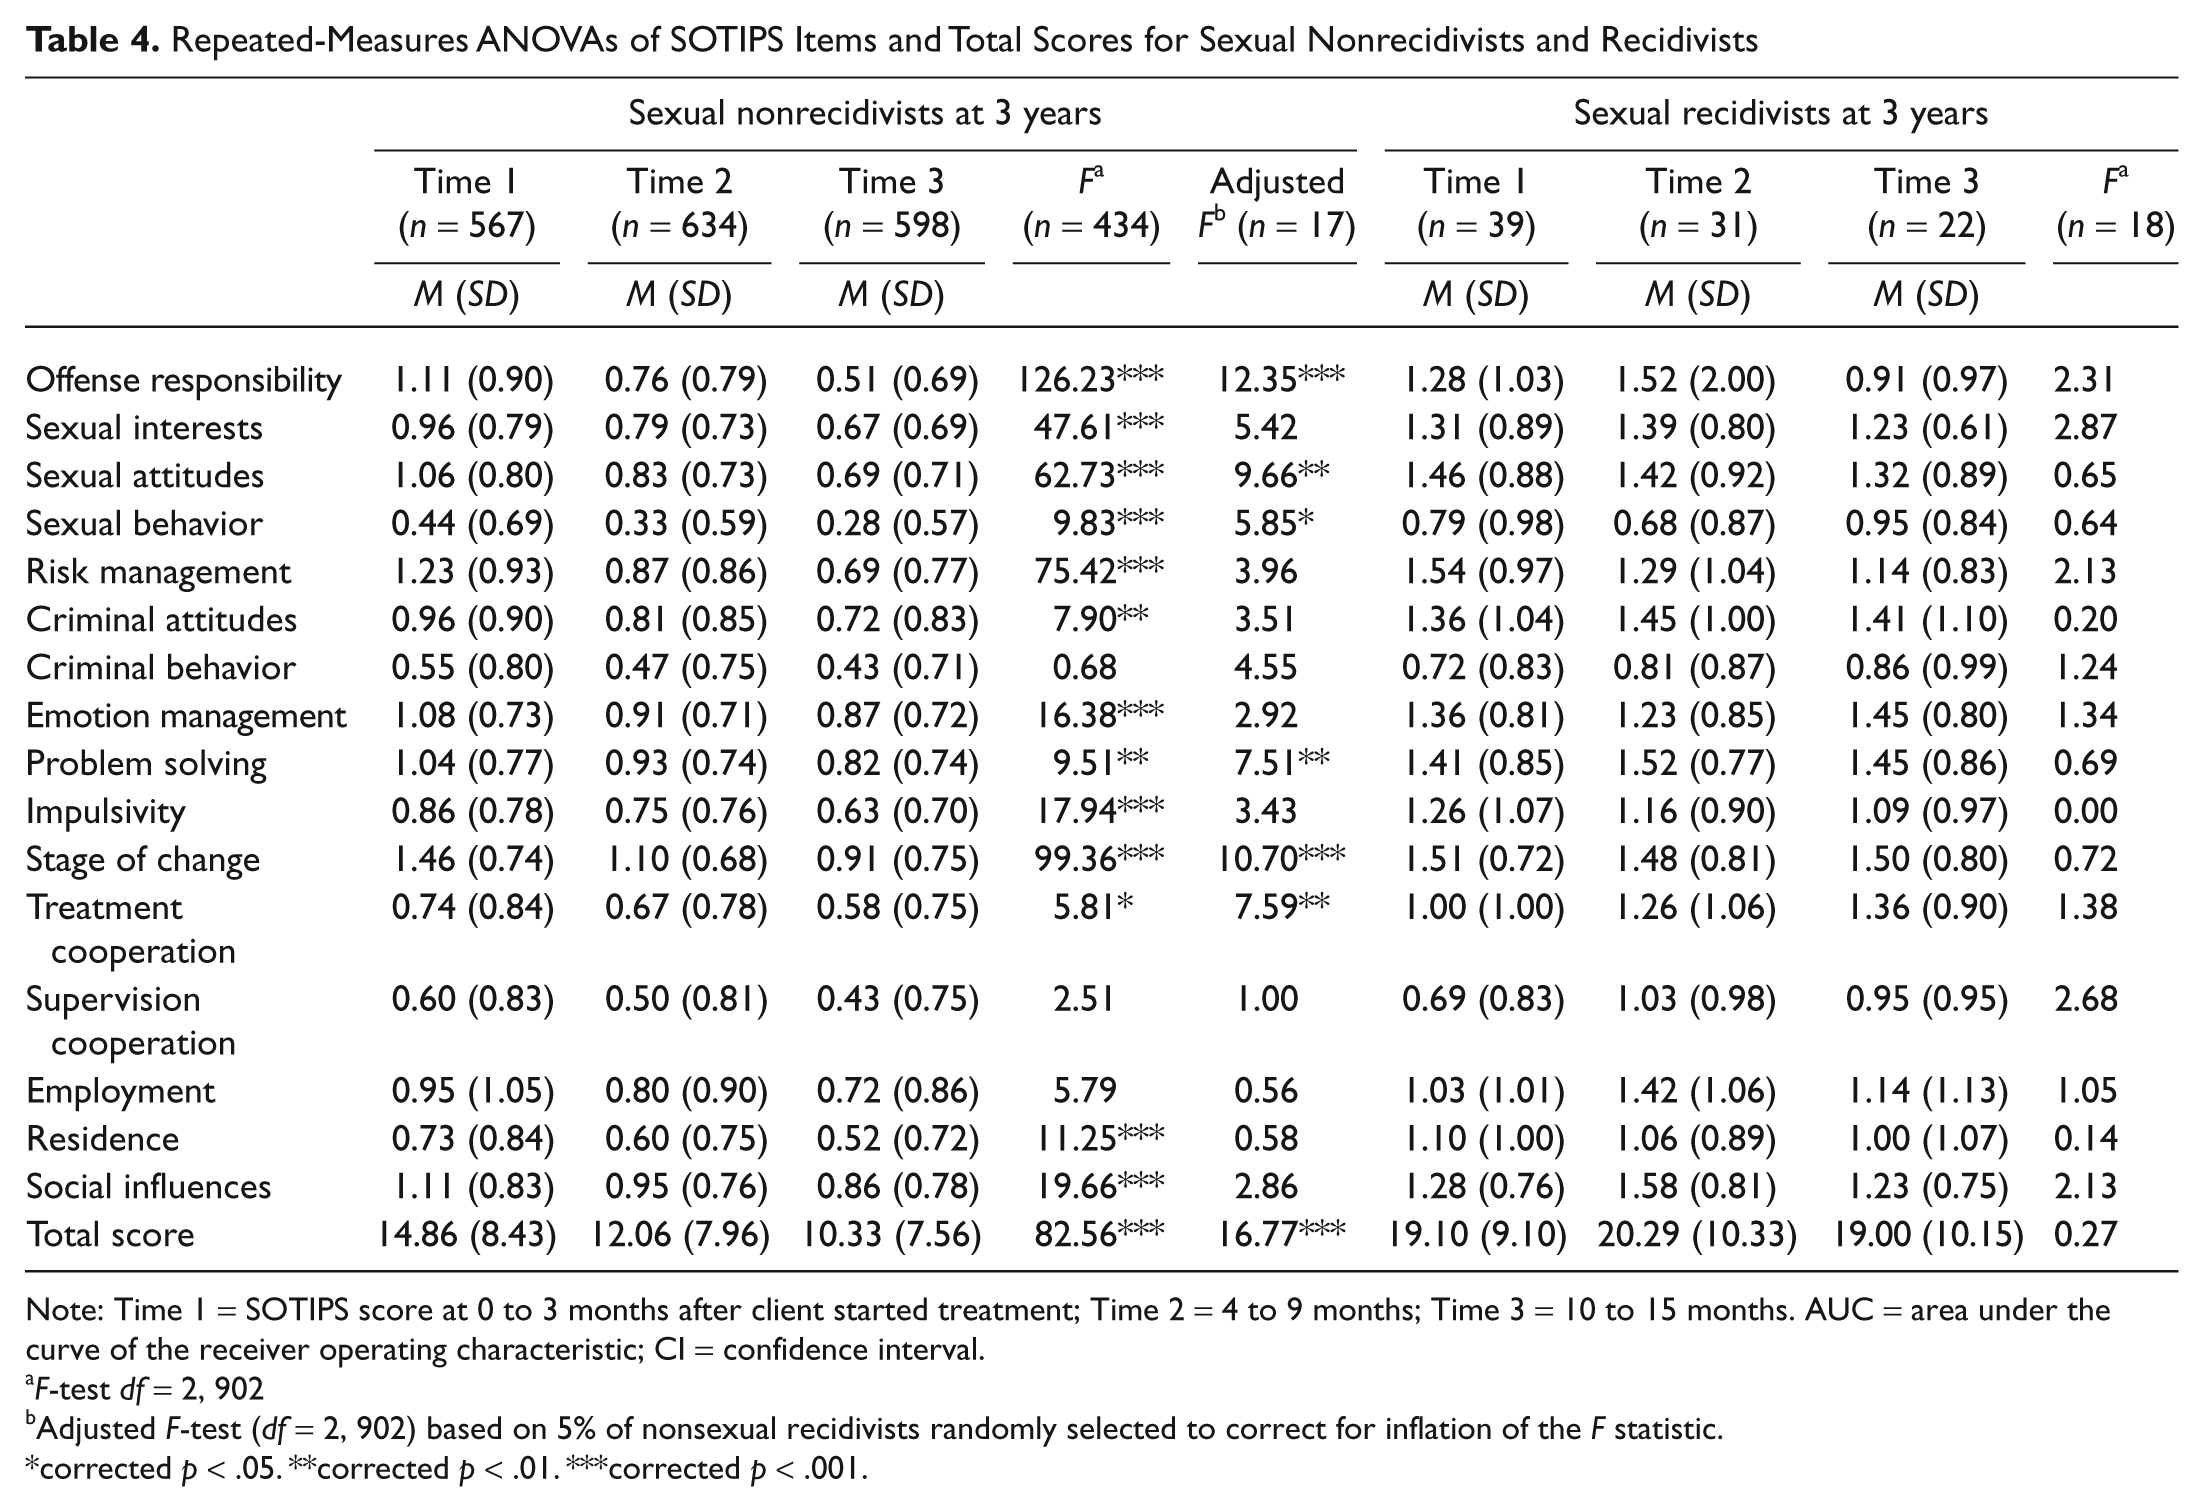
Note: Time 1 = SOTIPS score at 0 to 3 months after client started treatment; Time 2 = 4 to 9 months; Time 3 = 10 to 15 months. AUC = area under the curve of the receiver operating characteristic; CI = confidence interval.
F-test df = 2, 902
Adjusted F-test (df = 2, 902) based on 5% of nonsexual recidivists randomly selected to correct for inflation of the F statistic.
corrected p < .05. **corrected p < .01. ***corrected p < .001.
As only about 5% of participants were charged with new sexual offenses, 5% of nonrecidivists were randomly selected and the RMANOVA analyses were reconducted with 17 nonrecidivists to adjust for inflation of Type I error. Significant changes were found for seven items and the total SOTIPS score (see Table 4). Of course, use of an adjusted sample size and the Bonferroni correction likely inflated the possibility of Type II error. Analyses using uncorrected p values showed additional significant changes for Sexual Interests, Sexual Risk Management, Criminal Attitudes, Criminal Behavior, and Impulsivity.
Predictive Validity
Table 5 shows sexual recidivism rates and AUCs for each SOTIPS risk category (low, moderate, and high) and total score for the six assessment waves. Whereas Time 1 SOTIPS scores did not perform well, Time 2 and 3 scores predicted sexual recidivism with moderate accuracy. Overall, differences in absolute recidivism rates between the low- and moderate-risk categories were small compared with the differences between these two levels and the high-risk tier. Differences in absolute recidivism rates among the three SOTIPS risk levels for violent, any criminal, and return to prison events were more marked and linear (tables available upon request).
Sexual Recidivism by SOTIPS Risk Category

Note: Time 1 = SOTIPS score at 0 to 3 months after client started treatment; Time 2 = 4 to 9 months; Time 3 = 10 to 15 months. AUC = area under the curve of the receiver operating characteristic; CI = confidence interval.
p < .05. **p < .01. ***p < .001.
Analyses also examined the predictive validity of adult-victim-only (20.4%) and child-victim-only (75.8%) offenders’ scores separately across the six assessment waves. Scores for child-victim-only offenders predicted all four recidivism types at both 1- and 3-year follow-up periods based on significant AUCs. Adult-victim-only offenders’ scores were significant predictors of returns to prison but not for other recidivism types, with the exception of Time 2 scores, which predicted violent and any recidivism.
Table 6 shows recidivism rates as well as AUCs for Static-99R, SOTIPS, SOTIPS factor, and combined scores for the six assessment waves. Overall, the instruments show a relatively consistent ability to predict each type of recidivism. The results show a pattern of the static measure predicting better than the dynamic measure at Time 1, both predicting about the same at Time 2 and the dynamic measure predicting better than the static measure at Time 3. AUCs for factor scores showed inconsistent results for Time 1 assessment waves but were statistically significant at p < .05 for all conditions at Times 2 and 3 (AUCs = .61 to .82).
Predictive Accuracy of Static-99R, SOTIPS Total and Factor Scores, and Combined Scores
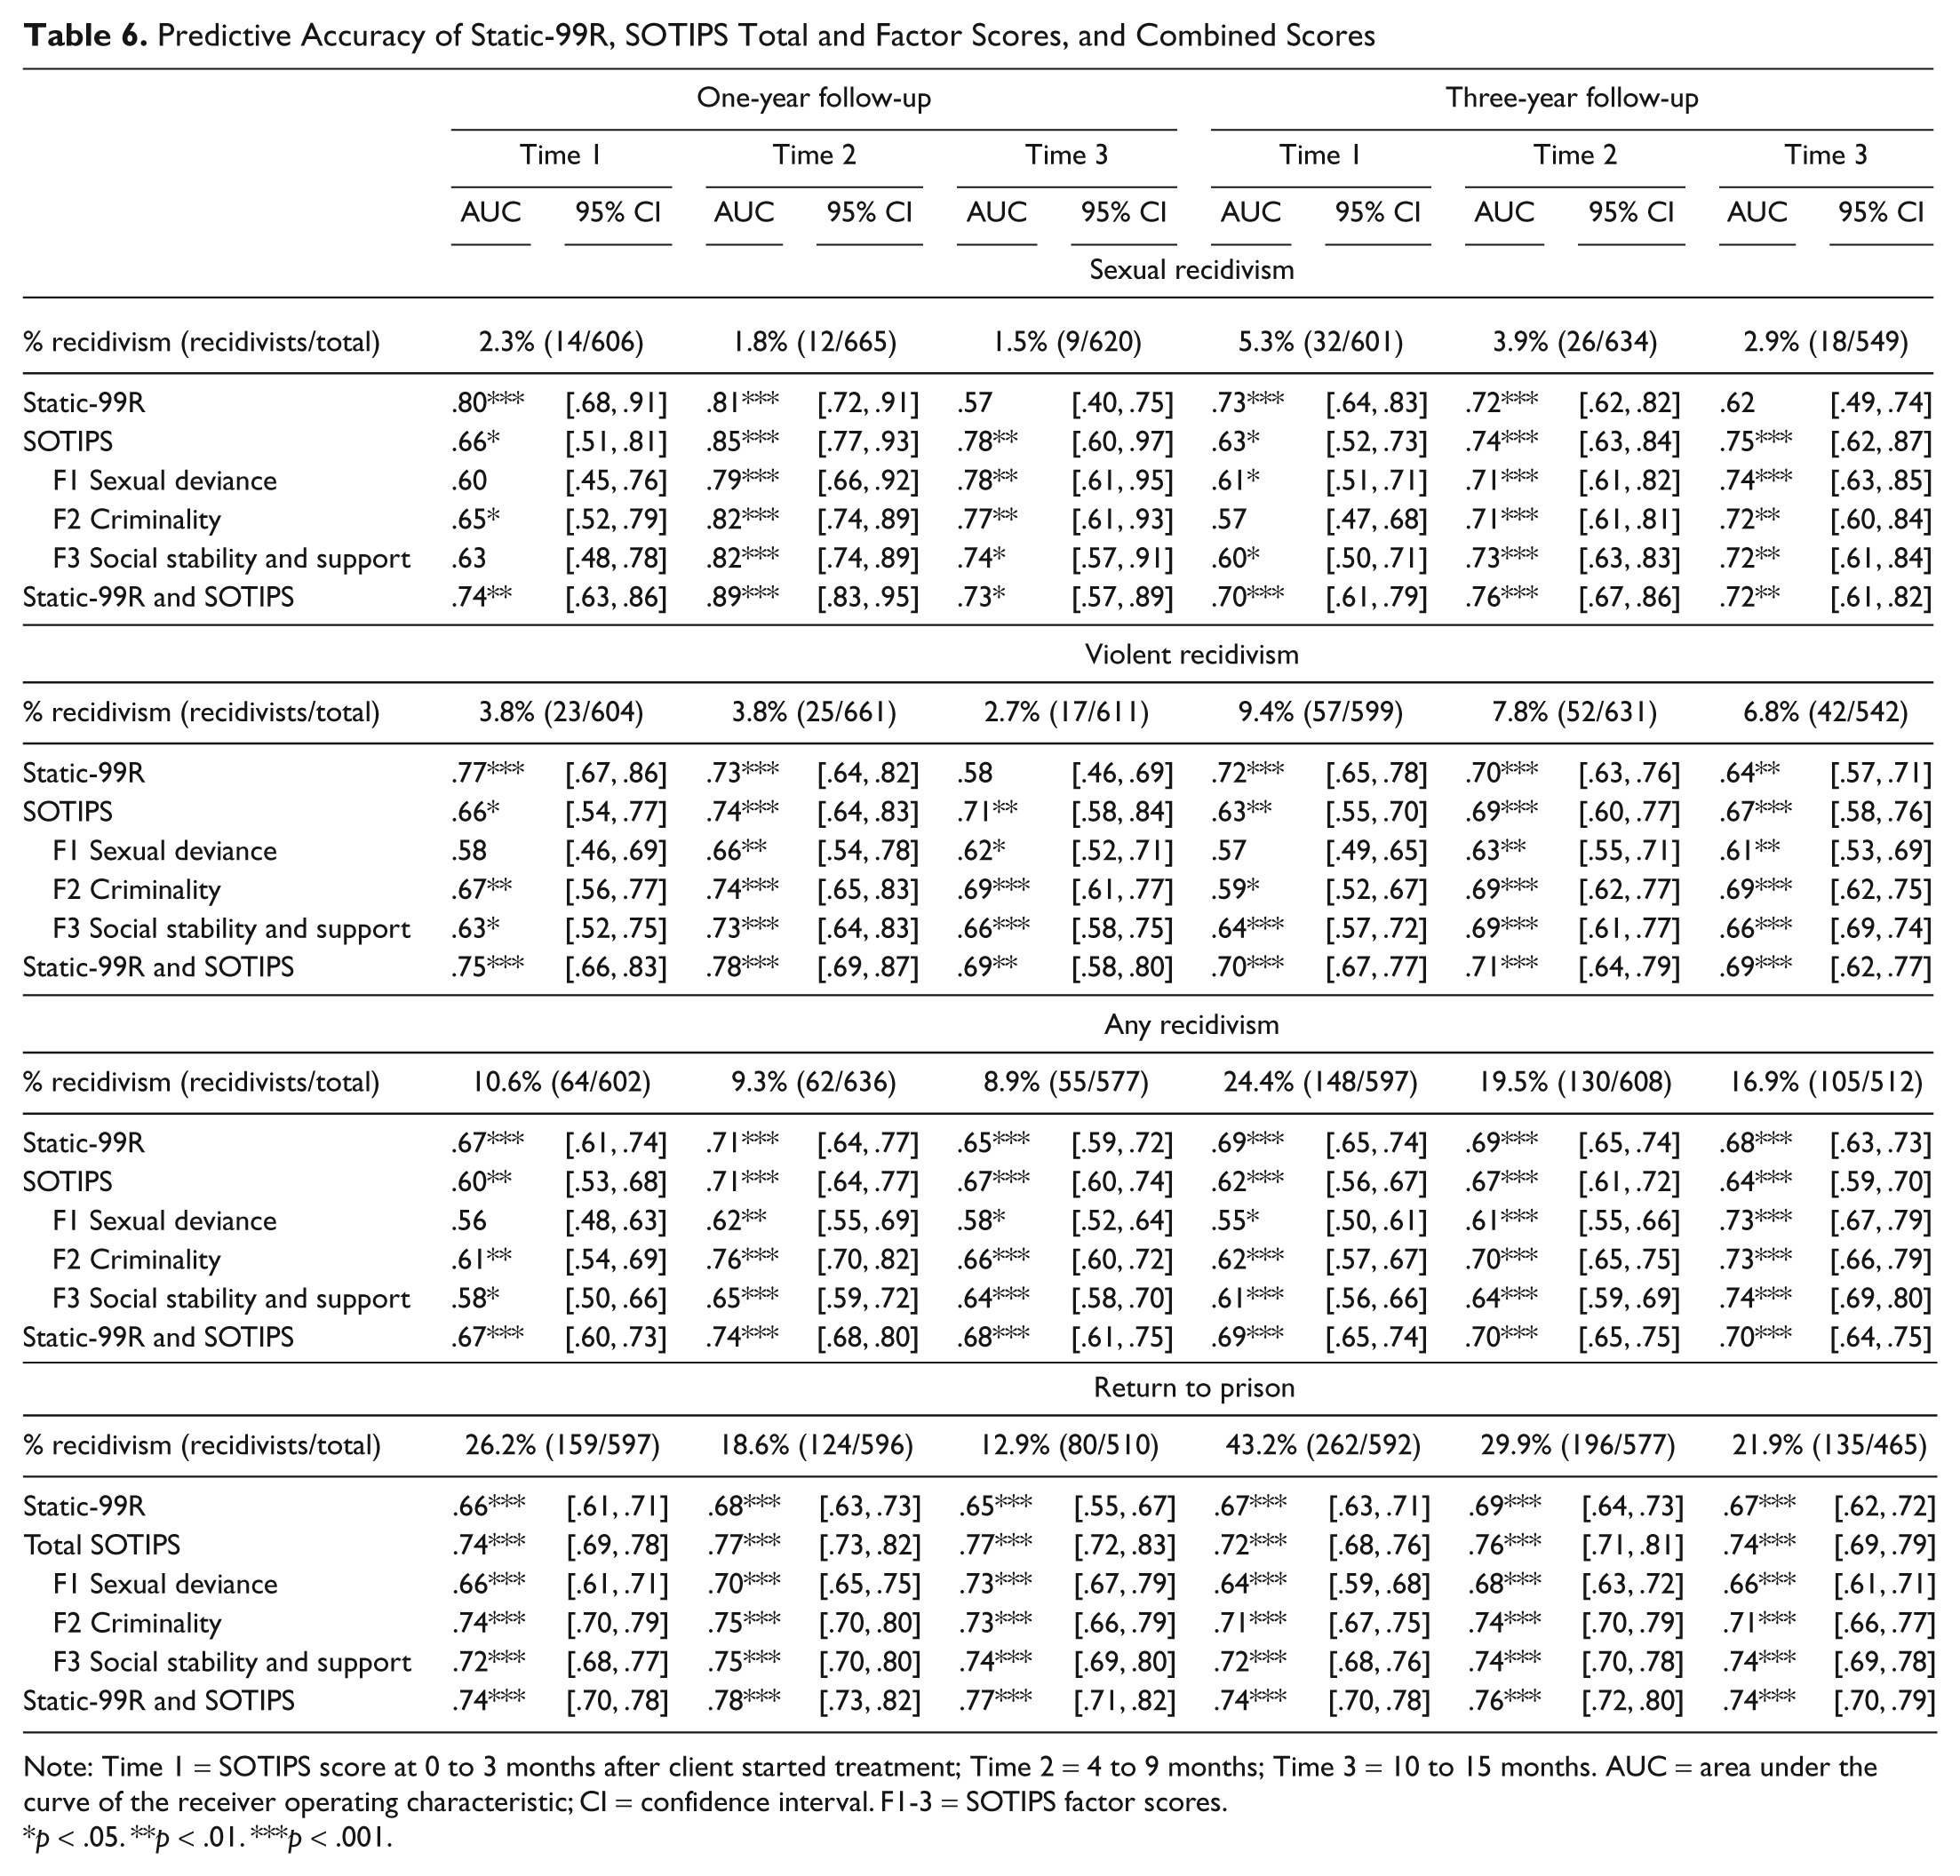
Note: Time 1 = SOTIPS score at 0 to 3 months after client started treatment; Time 2 = 4 to 9 months; Time 3 = 10 to 15 months. AUC = area under the curve of the receiver operating characteristic; CI = confidence interval. F1-3 = SOTIPS factor scores.
p < .05. **p < .01. ***p < .001.
Although a few individual AUC analyses for SOTIPS and Static-99R categories were not statistically significant, combination scores proved significant across all six assessment waves. Combination models were tested by comparing the best goodness-of-fit deviance χ2, and the combination of the SOTIPS and Static-99R fit the observed data better when combining the logistic coefficients of the two measures’ main effects in a multiple logistic regression model than when modeling a simple logistic equation based on a Static-99R × SOTIPS interaction.
As with the individual logistic regression analyses, GEE model testing was conducted to determine which combination of multiple SOTIPS scores with the Static-99R yielded a stronger model. Both models provided predicted reoffense probabilities which adequately fit the observed data based on goodness-of-fit deviance χ2, but the combination of multiple SOTIPS scores with the Static-99R proved best by combining the coefficients in a multiple logistic regression analysis, as this model resulted in the lower QIC or QICC for the multiple conditions. Table 7 shows the specific model effect and parameter estimate information of the binary logistic GEE analyses for sexual recidivism. Tables for the other recidivism events are available upon request.
GEE Model Effects and Parameter Estimates for Sexual Recidivism
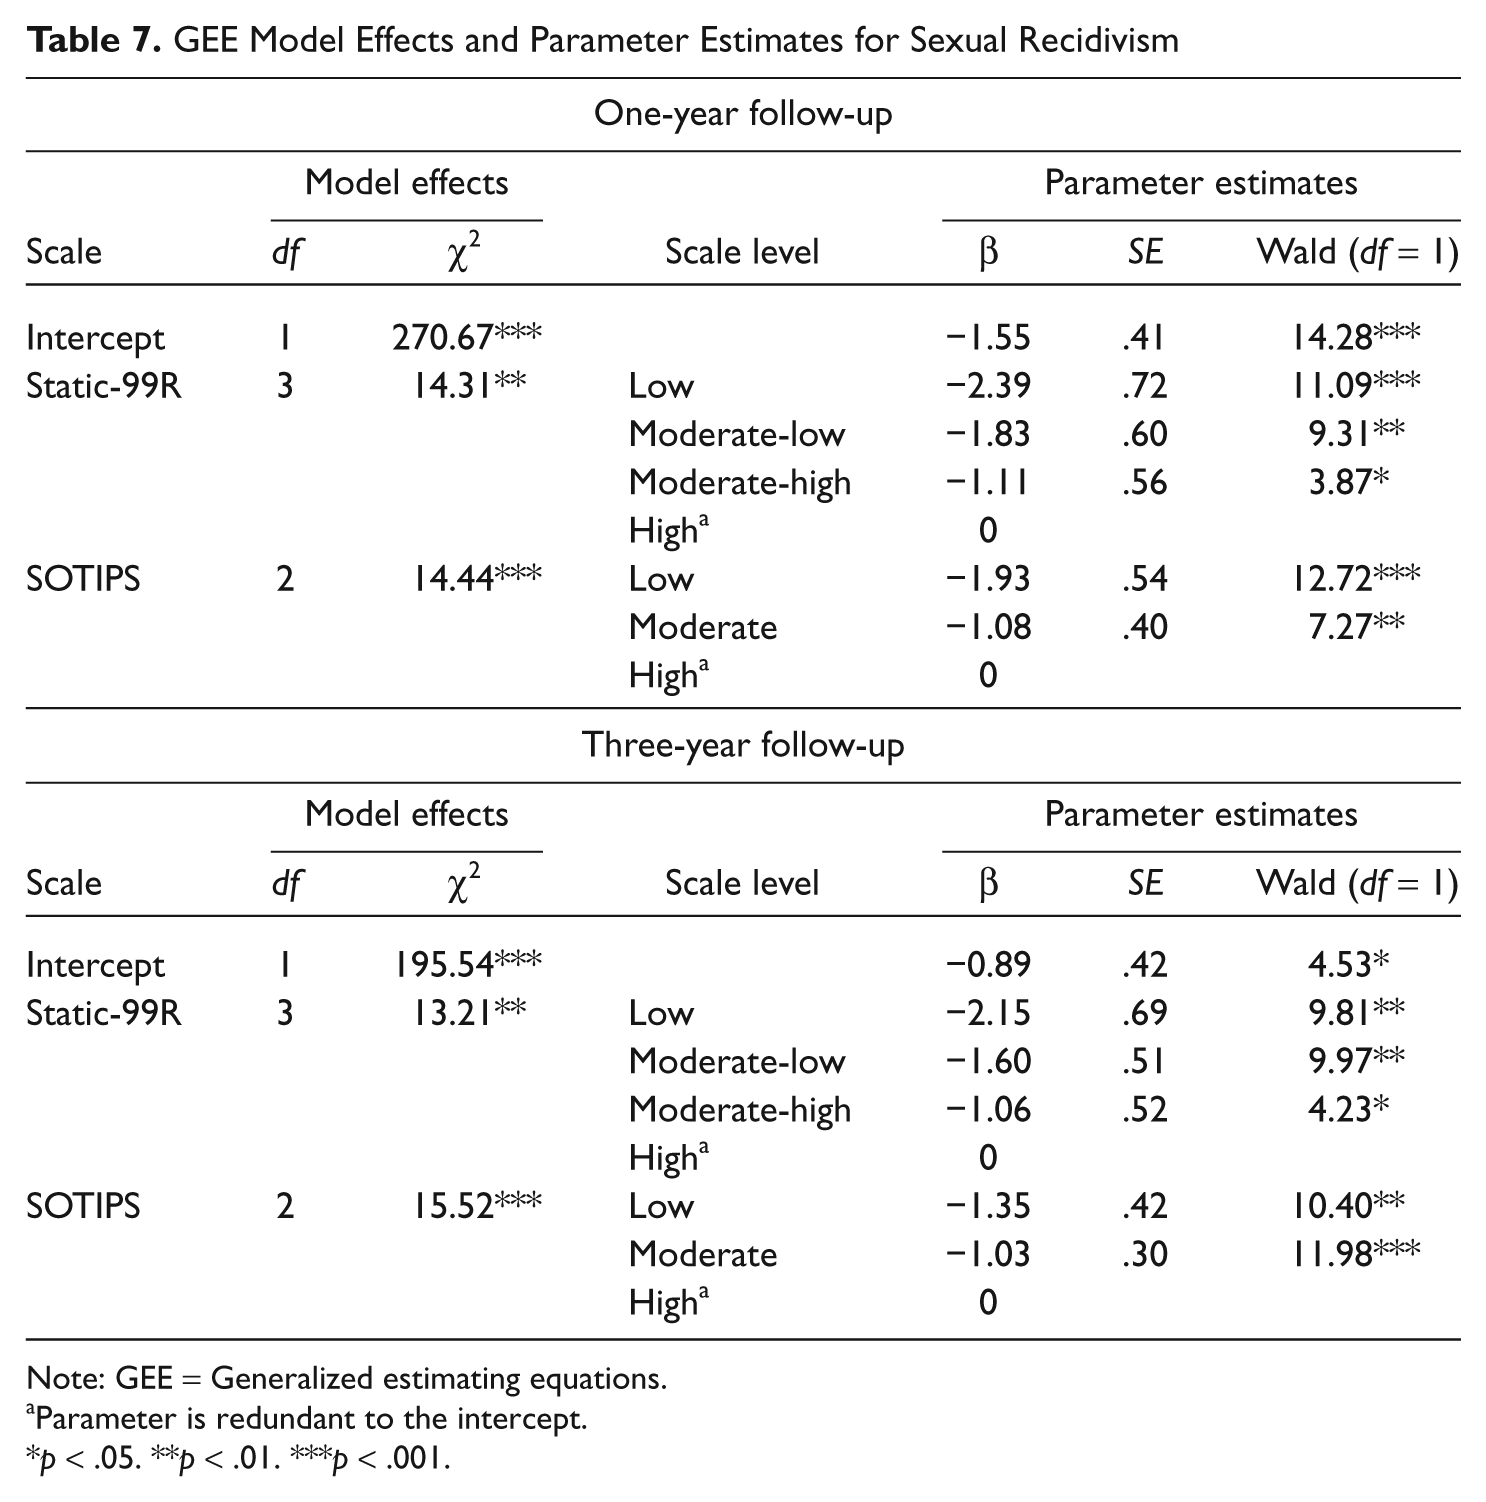
Note: GEE = Generalized estimating equations.
Parameter is redundant to the intercept.
p < .05. **p < .01. ***p < .001.
Table 8 shows the observed and predicted sexual recidivism rates based on the combination of the Static-99R and SOTIPS for each individual logistic regression analysis and the predicted recidivism rates generated by the GEE analyses. Issues of poor nomological validity within some logistic regression analyses were evident (e.g., a moderate-high risk offenders’ predicted reoffense rate that was lower than the low-moderate offenders’ predicted reoffense rate in one analysis), but these were resolved in the predictive models developed by the GEE analyses. Tables for the other recidivism types are available upon request.
Observed and Predicted Sexual Recidivism Rates for Combined SOTIPS and Static-99R Risk Levels
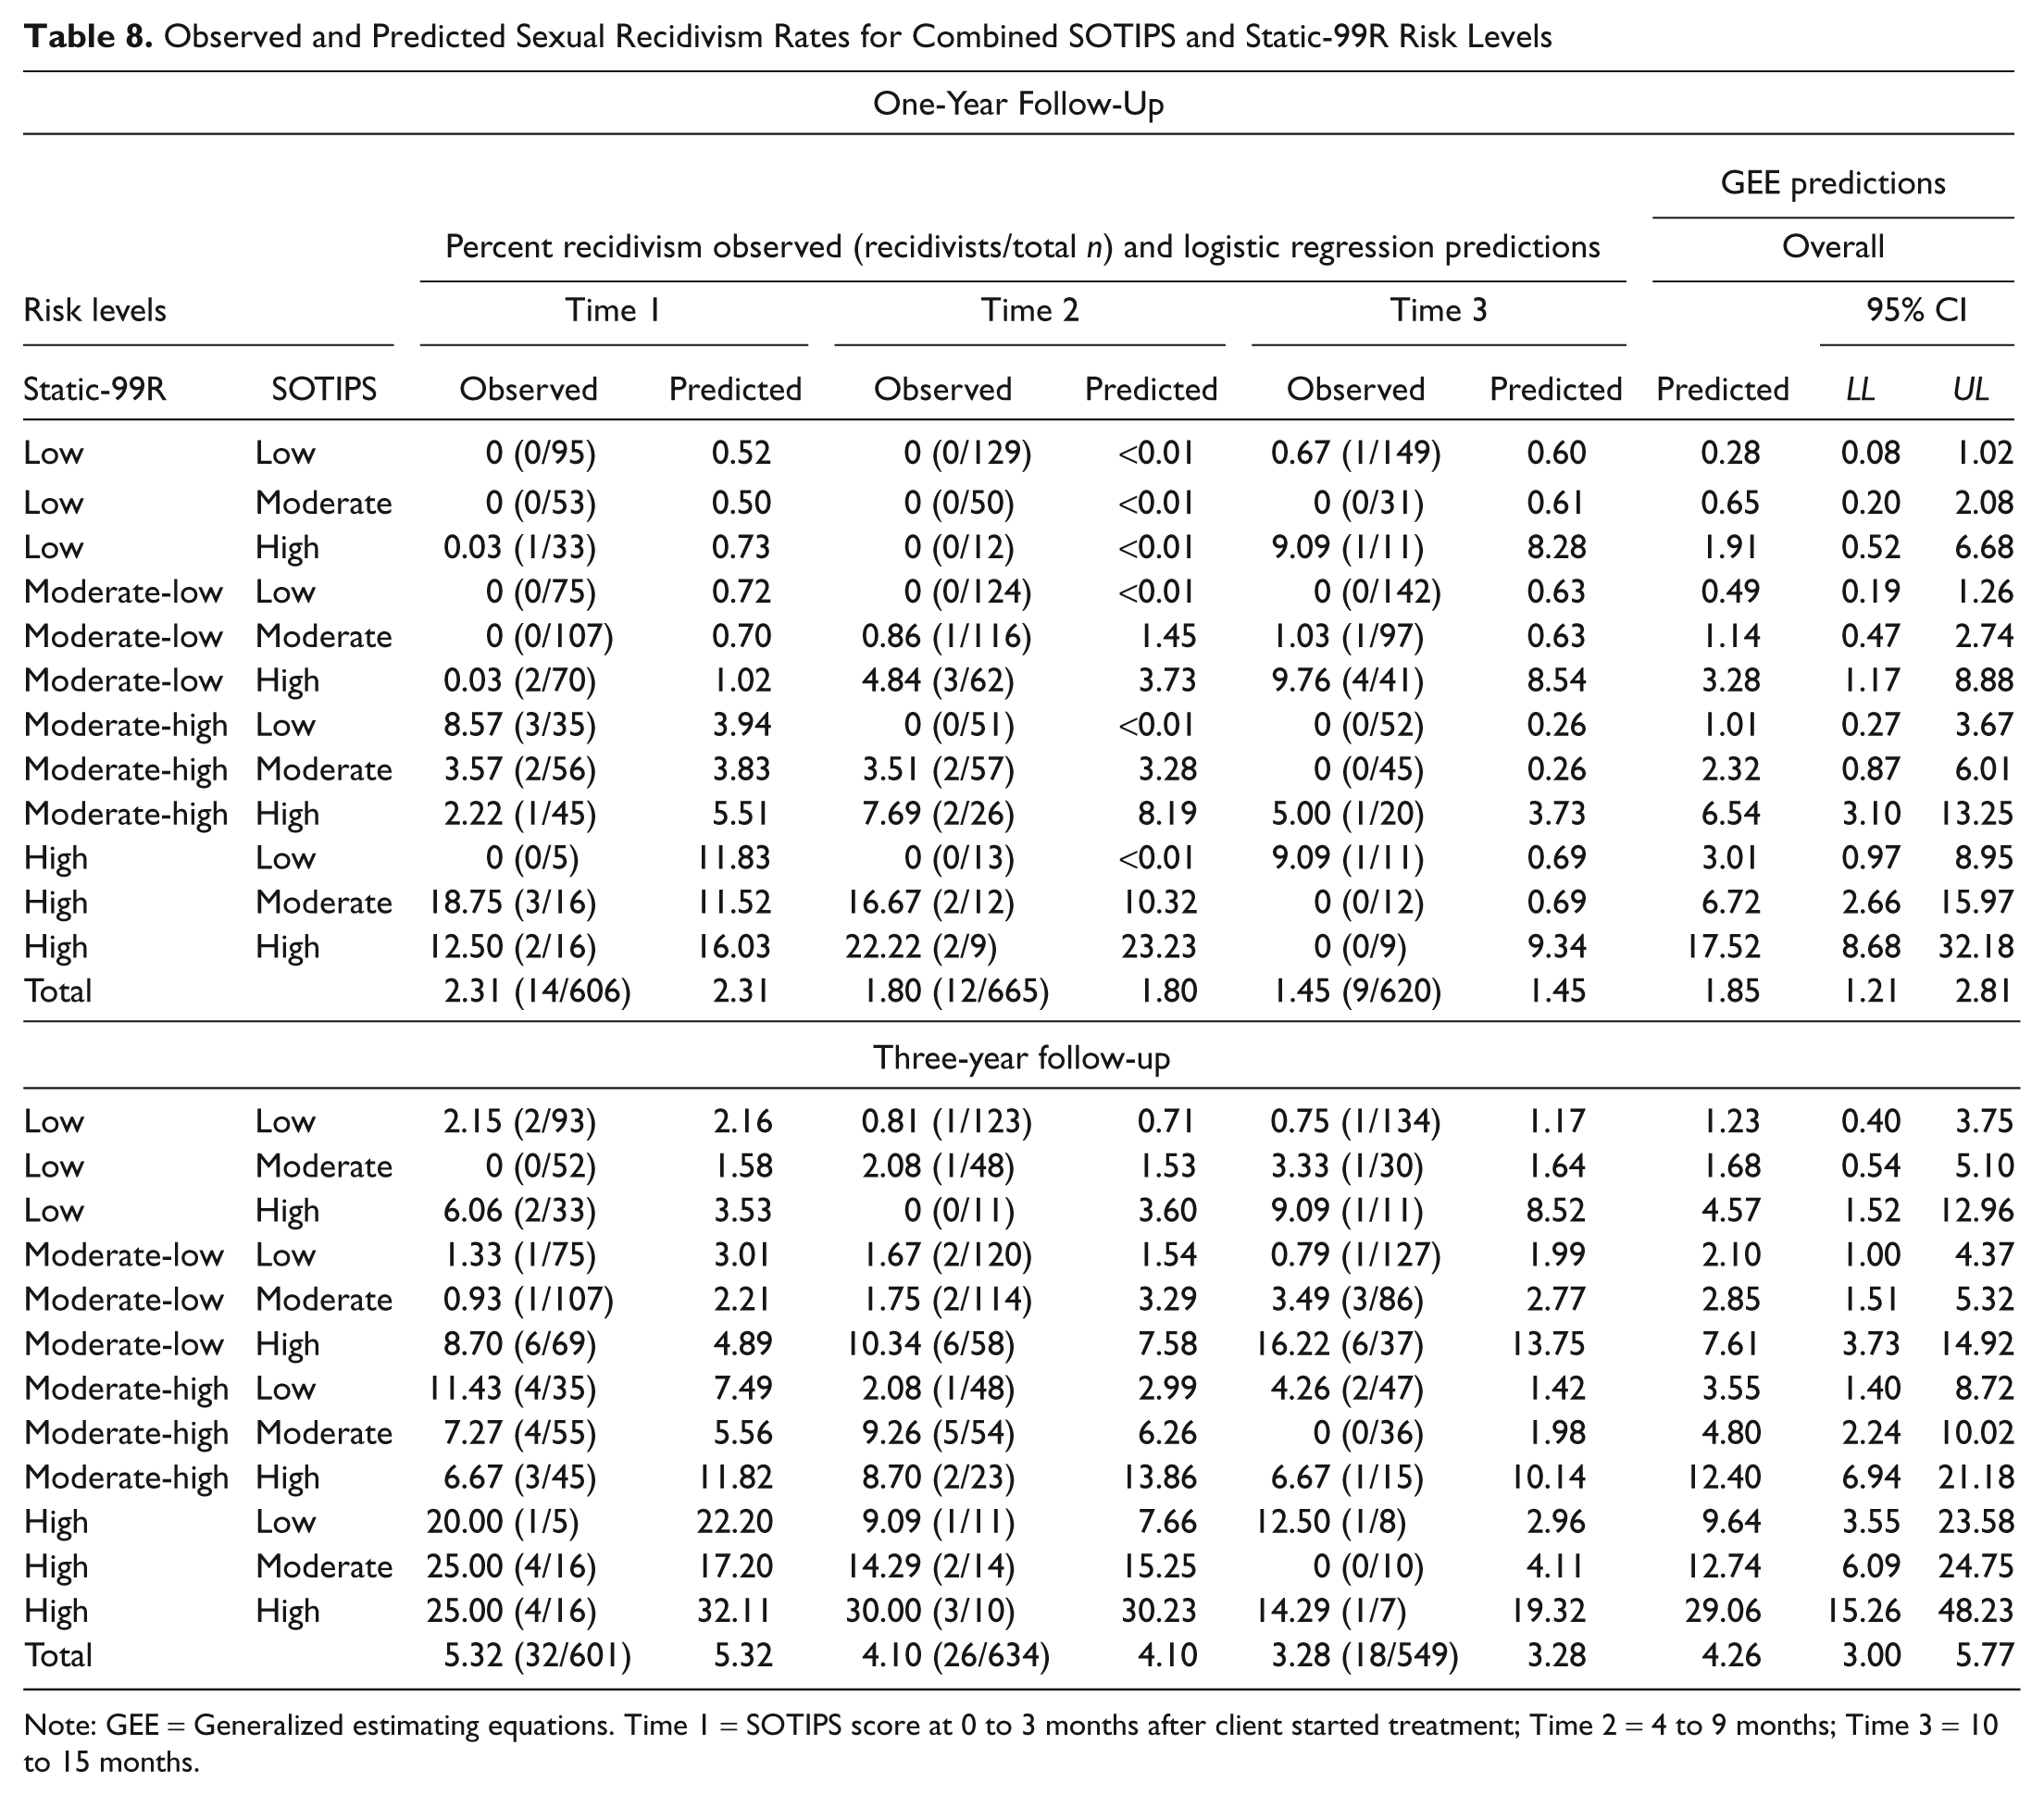
Note: GEE = Generalized estimating equations. Time 1 = SOTIPS score at 0 to 3 months after client started treatment; Time 2 = 4 to 9 months; Time 3 = 10 to 15 months.
Figure 1 shows four risk band categories for combined Static-99R and SOTIPS scores assigned logically based on the predicted 3-year sexual reoffense rates generated by the binomial logistic GEE analyses. The 3-year sexual recidivism rate for the approximately 45% of offenders categorized in the low risk band was 1.2%; for the 27% in the moderate-low risk band was 3.3%; for the 19% in the moderate-high risk band was 8.7%; and for the 9% in the high risk band was 12.7%.

Sexual recidivism rates at 3 years by SOTIPS and Static-99R combined GEE risk level
As shown in Figure 1, risk band levels for combined Static-99R and SOTIPS scores were the same as the Static-99R risk levels when SOTIPS scores showed a moderate treatment need (i.e., moderate risk level). For SOTIPS scores reflecting a high treatment need, the combined Static-99R and SOTIPS scores went up one risk band level from the Static-99R risk levels and down one risk band level for SOTIPS scores reflecting a low treatment need. Multiaxial tables for all recidivism types are available upon request.
Using these four risk bands, we calculated survival curves based on interval-censored survival GEE analyses for sexual, violent, and any recidivism and return to prison (see Figure 2). Likelihood Ratio tests and Mantel-Cox Log Rank tests were conducted to test for significant differences between survival rates and survival curves, respectively, within each of the four recidivism types. While the likelihood ratio tests showed significant differences between survival rates for the four risk groups among all four recidivism types—sexual χ2(4, n = 1,784) = 1,921.68, p < .001; violent χ2(4, n = 1,772) = 342.31, p < .001; any χ2(4, n = 1,717) = 292.21, p < .001; and return to prison χ2(4, n = 1,636) = 187.59, p < .001—the only significant difference between survival curves, that is, the proportional hazard rate among the four risk groups, was for sexual reoffending, χ2(3, n = 1,784) = 24.26, p < .001. Based on the Mantel-Cox Log Rank tests, we cannot confirm there were significant differences between survival curves for violent reoffense, χ2(3, n = 1,772) = 9 × 10⁻¹⁵, any reoffense, χ2(3, n = 1,717) = 3 × 10⁻¹⁴, and return to prison, χ2(3, n = 1,636) = 2 × 10⁻¹⁴.
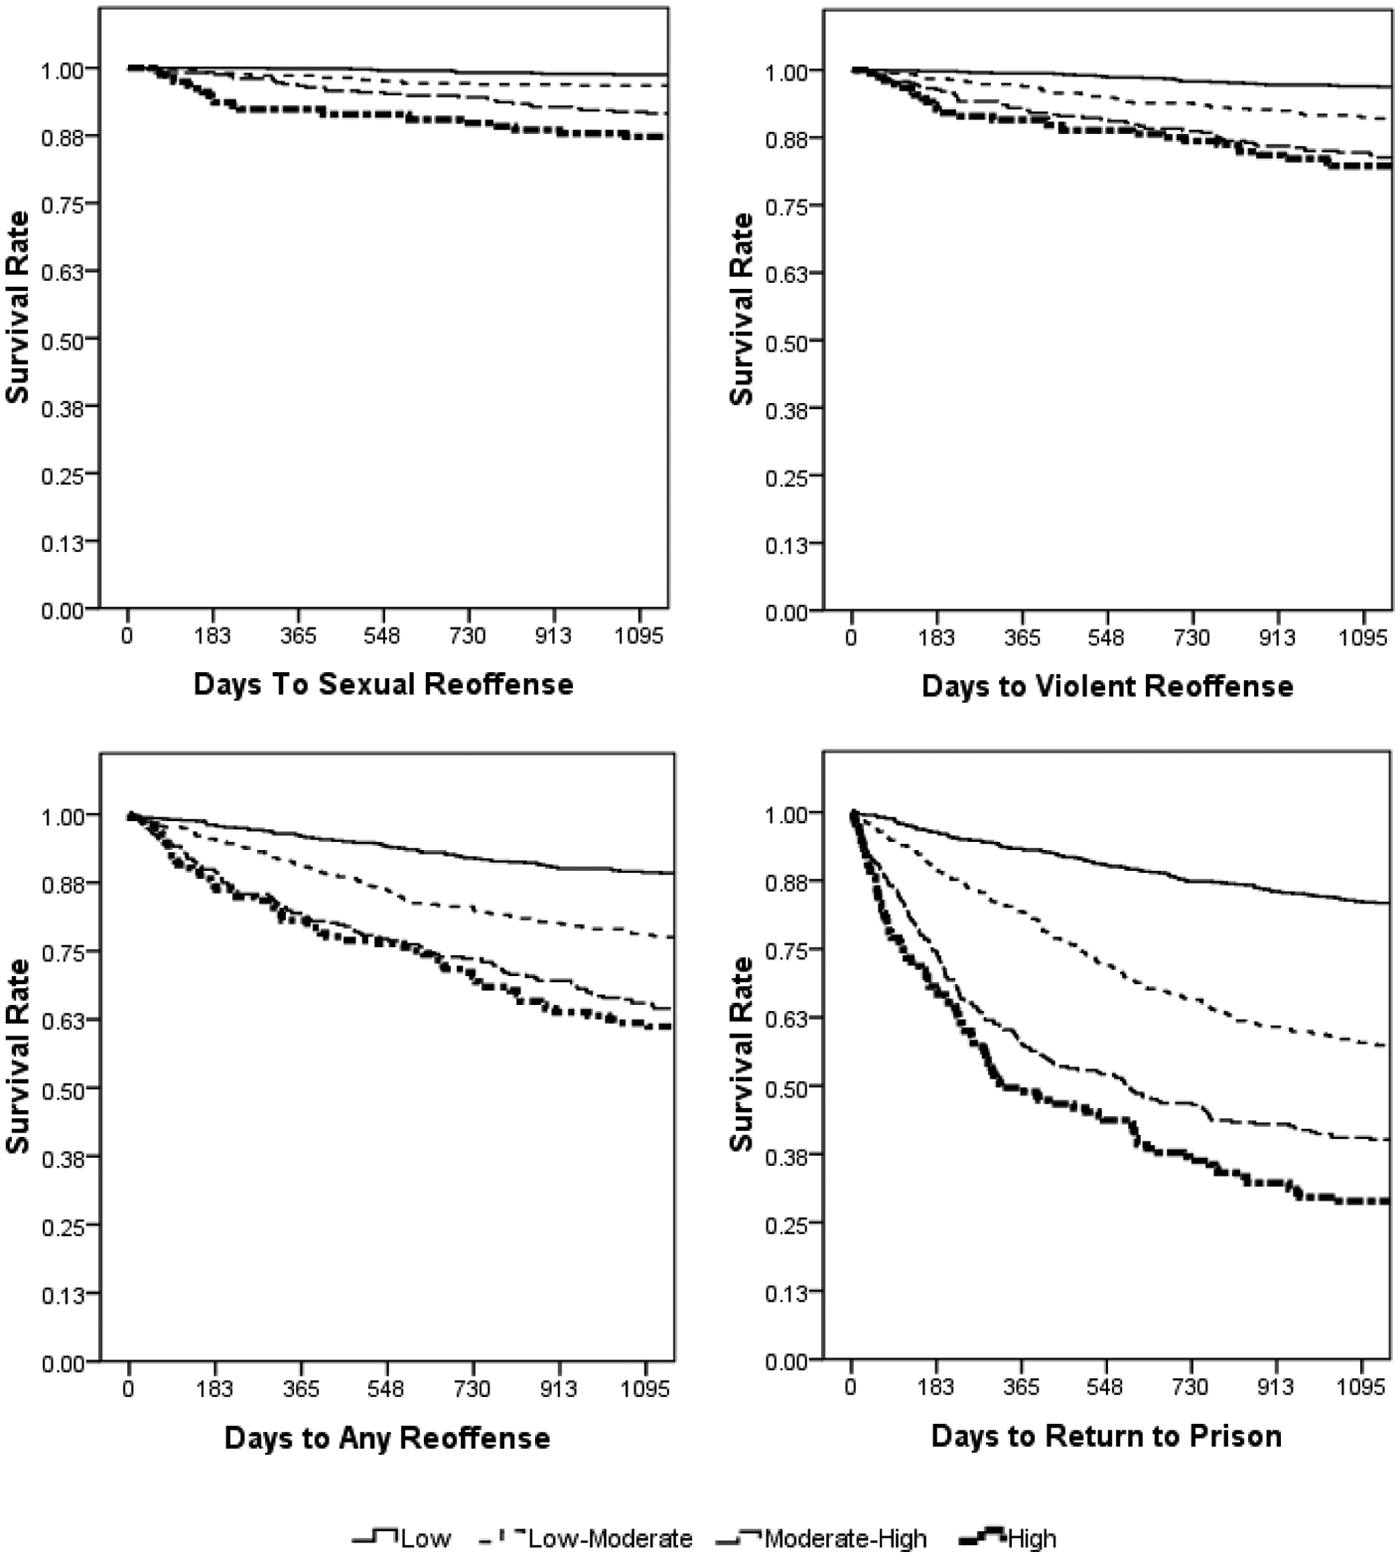
Interval-censored survival curves based on GEE analyses
Net Reclassification Improvements (NRI; Pencina et al., 2007) show that AUCs for the SOTIPS + Static-99R final model were significantly greater than AUCs for the Static-99R alone for 1-year follow-ups of sexual (NRI = .423, p < .001), violent (NRI = .299, p < .01), and any criminal recidivism (NRI = .202, p < .001), and return to prison (NRI = .426, p < .001), as well as for 3-year follow-ups of sexual (NRI = .279, p < .001), violent (NRI = .162, p < .01), and any criminal recidivism (NRI = .104, p < .05), and return to prison (NRI = .301, p < .001).
Discussion
The present study found that the SOTIPS, a new dynamic risk scale, predicted sexual, violent, and any criminal recidivism, as well as returns to prison, across multiple assessment waves. Combined SOTIPS and Static-99R scores predicted all recidivism types and outperformed either instrument alone when both instruments had similar predictive power. Participants who demonstrated treatment progress, as reflected by reductions in SOTIPS scores over time, showed lower rates of recidivism than those who did not.
The present results are consistent with previous sex offender studies in which dynamic risk factors have added incremental predictive validity to static risk factor schemes (Beggs & Grace, 2010; Hanson et al., 2007; Knight & Thornton, 2007; Olver et al, 2007; Thornton, 2002), as well as studies in which an association was found between positive treatment progress and reductions in recidivism (Beggs & Grace, 2011; Olver & Wong, 2011).
The fact that the present study used a repeated-measures model and found main effects across three SOTIPS score periods is particularly noteworthy in light of previous research in the field. Other studies of sex offenders typically have employed less frequent assessments, such as a single dynamic assessment (Eher et al., 2011; Thornton, 2002) or a paradigm of one pre- and one posttreatment assessment (Beggs & Grace, 2011; Olver & Wong, 2011). In the case of another repeated-measures sex offender study of which we are aware, changes in scores on dynamic risk factors were not associated with changes in recidivism (Hanson et al., 2007).
Employing repeated-measures paradigms yields large amounts of data, which can make it complicated to organize findings in a simple and useful manner. Our solution to this problem was to use generalized estimating equations (GEE; Liang & Zeger, 1986) to show the combinations of the Static-99R and SOTIPS risk levels across three time periods in one overall risk scheme. For most applied purposes, such as allocating supervision and treatment services, GEE scores that categorize offenders into broad relative risk and need groups (e.g., low, moderate-low, moderate-high, and high) are valid and sufficient.
It is noteworthy that the SOTIPS + Static-99R combination risk categories showed significant improvements in predictive power over Static-99R risk categories alone for both the 1- and 3-year follow-up periods. NRI (Pencina et al., 2007) for 1-year follow-up predictions showed improvements between 20% and 43% and for 3-year follow-ups between 10% and 30%.
Comparing Static-99R, SOTIPS and combined AUCs showed some interesting trends, although these comparisons should be interpreted cautiously as the 95% CI for all the comparisons overlap (see Table 5). The Static-99R seemed to predict sexual recidivism better than the SOTIPS at Time 1, both predicted about the same at Time 2 and the SOTIPS predicted better than the Static-99R at Time 3. The present and similar findings (Olver & Wong, 2011; Studer & Reddon, 1998) suggest the limitations of relying solely on static measures to predict risk. As well, the relative salience of static versus dynamic risk factors may change over time in important ways. In the present case, providers’ SOTIPS assessments may have been more accurate at Time 2 versus Time 1 because they knew the offenders better, but this potential influence needs to be studied further. However, the predictive value of offenders’ static risk factors simply may have become less important the more they successfully addressed their criminogenic needs.
It is likely that the failure to find significant effects for Time 4 SOTIPS scores and beyond was due to decreasing base rates and sample attrition (see Table 2), but other possible explanations exist. Whereas mean SOTIPS Time 1 to 3 scores were in the moderate range, Time 4 to 10 mean SOTIPS scores were in the low range, suggesting that participants may have reached a treatment-gain ceiling in about 18 months and that further treatment conferred no significant additional benefit. It is also possible that the SOTIPS was insensitive to participant change after a certain benefit threshold was met. Of course, participants who were returned to prison had higher mean SOTIPS scores, thereby leaving lower scoring SOTIPS participants in the sample. Regardless, although considerable data exist about the frequency, intensity, and duration of treatment services delivered in sex offender programs, little is known about optimal treatment dosages (McGrath et al., 2010).
Two of the three broad criminogenic risk factors extracted during factor analyses, namely, Sexual Deviance and Criminality, have consistently predicted sexual recidivism in other studies as well (Hanson & Morton-Bourgon, 2004, 2005; Mann et al., 2010). The third factor, which we labeled Social Stability and Supports, contains items that also have been found to be markers for an antisocial orientation. These factors are unemployment, negative social influences, and poor problem solving (Hanson & Morton-Bourgon, 2004). AUCs for factor scores were statistically significant for all Time 2 and 3 assessment waves.
The current study has several limitations. Of the 22 SOTNPS dynamic risk factors examined within the present sample, only the 16 that showed a positive relationship with sexual recidivism were selected to construct the SOTIPS. As is common in construction samples, this process may have exaggerated the relationship between the SOTIPS and recidivism. Clearly, further research is needed to evaluate the scale’s psychometric properties in replication samples. This research should include offender populations more diverse than the present one.
Ideally, participants’ treatment needs would have been evaluated immediately on placement in the community, but there was an average lag time of a few months before providers scored participants on the SOTIPS. Some participants reoffended during this lag time, and a small but unknown number who would have met eligibility criteria for the study were incarcerated before being referred to treatment and evaluated.
Another caution in interpreting the present study results concerns the low recidivism base rates in the sample. Sexual recidivism rates ranged from a high of 5.3% for the Time 1, 3-year follow-up period to a low of 1.6% for the Time 3, 1-year follow-up period. On one hand, it is noteworthy that significant effects were detected given such low base rates. On the other hand, the findings would have been much more robust had the sample size and base rates been larger.
Although SOTIPS predicted sexual and other types of recidivism among the child-victim-only offenders who made up three quarters of the sample, it did not predict sexual reoffending among the one fifth of participants who were adult-victim-only offenders. This difference may be due to a low number of sexual reoffenders resulting in insufficient statistical power within tests of adult-victim-only offenders and further study is needed.
Barbaree (1997) has noted that low base rates are an ongoing challenge in sex offender research. Studies focused on long follow-up times (i.e., 5 to 20 years) result in higher base rates, but long time frames are not particularly informative to service providers who must decide how to allocate supervision and treatment services over much shorter time periods. This administrative reality is why we examined relatively short follow-up periods in the present study. Even using a follow-up time frame of 1 year, differences in predicted sexual recidivism rates among offenders between some risk levels still exceeded 5%, arguably a difference of practical significance. Of course, studies with longer follow-up times will be needed to examine whether SOTIPS scores over the short term will predict reoffending over the long term.
A challenge to accurately assessing dynamic risk factors is that they are typically more subjective and difficult to score than static risk factors. For example, the degree to which an individual endorses antisocial attitudes is a more challenging assessment matter than whether an individual has a criminal record of a prior sexual offense. The interrater reliability coefficients for the SOTIPS certainly were lower than for the Static-99R. As dynamic risk measures are more subjective, provider scoring bias is also likely more of a problem than with static risk measures.
Although treatment providers and supervision officers in the current study were asked to score offenders on the SOTIPS independently, in practice, scoring cases jointly should lead to better assessments as service providers often have different information about the individuals they supervise and treat. In addition, involving clients in scoring the SOTIPS at regular intervals can provide them education about their strengths and criminogenic treatment needs. Evidence exists that collaborative approaches in which providers and offenders discuss and set treatment goals together are more successful than noncollaborative ones (Shingler & Mann, 2006). Periodic reassessments may help treatment providers, supervision officers, and clients recalibrate treatment/case-management plans, a step that may lead to the delivery of more effective services.
The present study contributes to a growing body of research supporting empirically based risk and need assessment schemes for sexual offenders. Integrated risk and need instruments may help providers and jurisdictions better allocate supervision and treatment resources in a rational manner. As this is the first major study to examine the SOTIPS, future replication studies are needed to evaluate its usefulness in other settings.
Footnotes
Acknowledgements
The authors thank Tammy Smith, Kristy Hetzel, and David Farre for their assistance with data collection and entry, Brian Gilbar for data coding, and Karl Hanson, Naomi Freeman, Jeffery Sandler, and Timothy Stickle for their helpful comments at various stages of the research.
Declaration of Conflicting Interests
The author(s) declared no potential conflicts of interest with respect to the research, authorship, and/or publication of this article.
Funding
The author(s) disclosed receipt of the following financial support for the research, authorship, and/or publication of this article: This research was supported by National Institute of Justice grant 2008-DD-BX-0013 to the Vermont Department of Corrections. The views expressed in the article do not necessarily represent those of the Vermont Department of Corrections.