



Abstract
Child sexual abuse is a preventable public health problem that is addressed primarily via reactive criminal justice efforts. In this report, we focus on the cost of incarcerating adults convicted of sex crimes against children in the United States. Specifically, we summarize publicly available information on U.S. state and federal prison and sex offender civil commitment costs. Wherever possible, we used government data sources to inform cost estimates. Results indicate the annual cost to incarcerate adults convicted of sex crimes against children in the United States approaches $5.4 billion. This estimate does not include any costs incurred prior to incarceration (e.g., related to detection and prosecution) or post-release (e.g., related to supervision or registration). Nor does this estimate capture administrative and judicial costs associated with appeals, or administrative costs that cannot be extricated from other budgets, as is the case when costs per-prisoner are shared between prisons and civil commitment facilities. We believe information on the substantial funding dedicated to incarceration will be useful to U.S. federal, state, and local lawmakers and to international policymakers as they consider allocating resources to the development, evaluation and dissemination of effective prevention strategies aimed at keeping children safe from sexual abuse in the first place.
Child sexual abuse substantively contributes to the global burden of disease and disability (Mathers et al., 2009). Advocates have fought for decades to convince policymakers to view child sexual abuse as a public health problem in need of preventive solutions (Letourneau et al., 2014; McMahon & Pruett, 1999; Mercy, 1999). In the United States, this advocacy includes a recent effort to add new funding to the federal budget specifically for child sexual abuse prevention research (“FY20 LHHS-Ed Appropriations for CDC Child Sexual Abuse Prevention Research,” 2019). In support of this effort, the first author met with dozens of congressional offices between 2018 and 2021 to advocate the merit of a federal focus on prevention. A recurring theme across these meetings—whether in the House or Senate, or with Democrats or Republicans—was the lack of money available for prevention efforts. Everyone agreed that preventing child sexual abuse was important and acknowledged the benefits of preventive versus reactive strategies. But everyone also described federal budget caps and deficits as nearly insurmountable barriers to funding child sexual abuse prevention initiatives.
Using the United States as an example, the purpose of this report is to provide a close look at one place where federal and state governments do put substantial resources for addressing child sexual abuse, regardless of budget caps or deficits: incarceration. As we will detail in this report, in 2021, there were about 144,453 people incarcerated in secure facilities for sex crimes against children, the majority of whom will remain incarcerated for eight or more years. Holding adults accountable for harmful and violent behavior, in particular for the sexual abuse of children, is an appropriate and crucial component of a comprehensive national response to child sexual abuse. The problem is not with incarceration per se. The problem is an uncritical presumption that the best possible use of billions of dollars of federal and state funding allocated to prevent child sexual abuse is incarceration. As this paper indicates, incarceration comes at a high cost—and as studies referenced below tell us, incarceration often fails to prevent further abuse, and may actually increase an individual’s likelihood of reoffending. A more comprehensive budgetary approach would support prevention efforts to reduce the number of individuals who require incarceration or commitment, protecting more children while likely saving tax dollars.
Most adults with sex crime convictions (82%) do not reoffend sexually even across 20–25 year follow-up periods (Hanson et al., 2018). Indeed, just five percent of sex crimes are committed by someone with a prior sex crime conviction (Langan et al., 2003). The reasons for desistance are not well known; however, desistance is not due to lengthy imprisonment. Imprisonment is inherently responsive, and not primarily preventive. In addition, particularly harsh prison environments may even be associated with higher recidivism rates, in comparison with noncustodial interventions (Cullen et al., 2011; Petrich et al., 2021; Smith et al., 2002). Moreover, longer sentences do not make imprisonment more effective at preventing violence (Mercy et al., 1993). While prison may be justifiable for punishment or for incapacitation, it is not justifiable as a preventive or deterrent strategy (Petrich et al., 2021).
Nevertheless, lengthy prison terms continue to be justified as necessary for deterrence and remain a common feature of U.S. sex crime sentences, particularly for cases involving child victims (Alper & Durose, 2019; Budd & Desmond, 2014). Moreover, even lengthy prison terms were seen as insufficient responses to child sexual abuse by many Americans. Reacting to rare and horrific acts of sex crime recidivism, the public demanded more from policymakers (Zgoba, 2004). In the 1990s and 2000s, the United States and several other countries enacted a rash of sex crimes laws (Terry, 2015). Among these were laws that permitted the preventive detention of people considered to be high risk to offend sexually, enacted in Australia and the United States (Janus, 2006; Leon, 2011; Terry, 2015). U.S. preventive detention policies are known as sex offender civil commitment (SOCC) policies and have been enacted in 20 states, the District of Columbia, and the federal government. SOCC policies vary across jurisdictions, but share an underlying structure that permits the government to evaluate individuals with sex crime convictions for involuntary commitment of indeterminant duration to secure facilities for containment and treatment (Tolman, 2018). SOCC evaluations are typically conducted in the year prior to release from prison; thus, the time served in a SOCC facility (which often lasts for life; see for example Woolman & Anderson, 2016) occurs after time served in prison (Steptoe & Goldet, 2016; Tolman, 2018).
What is the cost of sex offender incarceration across U.S. prisons and SOCC facilities? To our knowledge, costs specifically associated with sex crime incarceration, including both prison and commitment, have not previously been published. This fundamental question must be addressed with policymakers as we urge them to consider more fully funding prevention efforts. With this report, we sought to estimate the annual per inmate and per program cost of incarcerating people for sex crimes against children as well as the cost of incarcerating the current cohorts of incarcerated persons through release. While focused on U.S. counts and costs, we believe this report also holds value for international policymakers, given near-universal reliance on after-the-fact criminal justice strategies versus preventive action to address child sexual abuse.
Assumptions
Several assumptions influenced our procedures and analyses that merit description at this early point in our paper. First, we assumed that elected U.S. policymakers would view government sources of information as more trustworthy or reliable than non-government sources. We have only anecdotal comments from elected officials to support this assumption. For example, when presented with published estimates of the economic burden of child sexual abuse (Letourneau et al., 2018), one U.S. senator requested the costs specific to the federal government (e.g., pertaining to incarceration) versus costs borne by individuals (e.g., diminished earnings of survivors relative to non-victims). This request was made despite the fact that such fine lines do not really exist. For example, diminished earnings among an entire class of people such as child sexual abuse survivors results in diminished tax revenue for the federal government. Nevertheless, for this paper, we strategically relied upon government sources for cost information wherever possible. We acknowledge that government sources may exclude relevant expenditures, whether systematically (Henrichson & Delaney, 2012) or haphazardly (Gookin, 2007).
Second, we assumed that policymakers and other readers would be most interested in current versus historical costs of incarceration. Yet, cost estimates were often many years old by the time they were reported. We used the U.S. Bureau of Labor Statistics consumer price index (CPI) inflation calculator to update costs through January 2021. The CPI is an imperfect measure of inflation but within the US it remains “our most reliable indicator of changes in inflation” (Steindel, 1997, p. 1) and “has become a well-used standard” (Kovach, 2008, p. 610). Moreover, relying on the Bureau of Labor’s CPI inflation calculator aligned with our first assumption: that policymakers would find government sources of information more trustworthy and/or reliable. The CPI inflation calculator was also remarkably easy to use.
Third, we assumed that 80% of people incarcerated in U.S. prisons or in SOCC facilities for sex crimes had child (or child and adult) victims. As our focus is on the prevention of child sexual abuse, we needed a way to apportion the estimated costs associated with sex crime cases involving child victims. Yet, victim age information was missing from most of our information sources. We did find some relevant research. With respect to prisoners, 84% of the nearly 35,000 felony sex crime convictions in Florida state courts that occurred between 1995–2011 involved cases with child victims (Cochran et al., 2021). Likewise, albeit on a much smaller scale, more than 80% of men released from Delaware state prisons in 2001 following sex crime convictions had child victims (Huenke et al., 2007; Weidlein-Crist & O’Connell, 2008). 1 With respect to SOCC, we identified one published study that addressed victim age. Jumper and colleagues (2012) estimated more than 79% of SOCC inmates 2 had one or more child victims. Likewise, in an unpublished 2018 survey of SOCC administrators representing 16 state programs, just over 80% of SOCC inmates were reported as having committed sex crimes against children (Schneider et al., 2018). Based on these data, we conservatively assumed that 80% of prison and SOCC inmates committed sex crimes against children.
Information Sources and Resulting Calculations
To estimate the cost of confinement associated with sex crimes, we sought information on the number of people incarcerated for sex crimes (counts), the per inmate cost of incarceration, and the duration of incarceration. In this section, we describe the sources of information for inmate counts, costs, and duration of incarceration and provide details on our calculations. We separately discuss counts and costs of state prisons, federal prisons, and SOCC facilities.
State Prisons
Data were often reported separately (or differently) for state versus federal prison inmates. This was especially true for cost data. For consistency, we reported prisoner counts, costs, and duration of incarceration (cohort) separately for state and federal jurisdictions.
State Prison Inmate Counts
The U.S. Bureau of Justice Statistics operates the National Prisoner Statistics (NPS) program, which surveys state and federal prisoner counts. Prisoner typically refers to adults (i.e., 18 and older) convicted of felony offenses and sentenced to serve one or more years in a long-term state or federal facility (U.S. Bureau of Justice Statistics, n.d.). Excluded from the counts of prison populations are children incarcerated in youth prisons, and children and adults confined in short-term facilities (jails) for less than 1 year and/or while awaiting adjudication, sentencing, or transfer. NPS collects data from state departments of corrections and from the Federal Bureau of Prisons to estimate the number of prisoners in custody (i.e., prisoners physically present in a specific facility) and under jurisdiction (i.e., including prisoners physically present at a prison facility and prisoners who are physically located somewhere other than a prison, such as a hospital or prison “farm”) of these correctional authorities.
Relying on the NPS’s most recent report, which presented data from 2015, there were 1,298,159 prisoners for crimes of any kind under the jurisdiction of state correctional authorities with sentences greater than 1 year (Carson, 2018, see Table 4). Of these, approximately 12.5% or 161,900 had sex crime convictions as their most serious offense (Carson, 2018, see Tables 12 & 13).
We then needed to estimate the number of people incarcerated for sex crimes in 2021. According to The Sentencing Project, the number of people incarcerated in the United States peaked in 2009, after which the number declined by approximately 1% each year through 2017, the latest year for which they report data (Ghandnoosh, 2019). However, the number of people incarcerated for violent crimes declined only 2% during this entire 7-year period (2009–2016) (Ghandnoosh, 2019). Moreover, efforts to reduce incarceration, even to address the COVID-19 pandemic, typically excluded people with sex crime convictions (Jones, 2020; Kang-Brown et al., 2021). Assuming an annual reduction that was constant, the estimated violent crimes reduction was 0.29% per year. Therefore, to estimate the number of people incarcerated for sex crimes in 2021 from 2015 (N = 161,900), we assumed constant annual reduction as 0.29% for the 6-year period, which returned an estimated state prison inmate count of 159,103 people incarcerated for sex crimes in for 2021, of whom 127,282 (80%) are estimated to have child victims.
State Prison Inmate Costs
The most recent Bureau of Justice Statistics (BJS) report on state prison costs estimated a mean annual per inmate cost of $28,323 for 2010 (Kyckelhahn, 2012). After adjusting for inflation from January 2010 to January 2021, the cost rose to $34,191. Our confidence in relying on such dated cost information is somewhat bolstered by three additional sources of information. First, a more detailed BJS report estimated a mean annual state prison per inmate cost of $22,650 for 2001 (Stephan, 2004). When adjusted for inflation from January 2001 to January 2021 this returned a per inmate cost of $33,837, quite similar to what we found after adjusting 2010 BJS estimate. Second, the Vera Institute of Justice, a non-governmental organization, issued two reports estimating annual per-prisoner costs of incarceration for state prisons. These estimates included expenditures that informed the BJS reports and additional expenditures related to inmate health services, non-prison administrative staff who support prison operations, and prison employee pensions and retirements (Henrichson & Delaney, 2012; Mai & Subramanian, 2017). Hence, we would expect the Vera-generated costs to be somewhat (but not wildly) higher than the BJS-generated costs, which is what we found. For 2010, Henrichson and Delaney (2012) estimated a mean annual state prison per inmate cost of $31,286, about 10.5% higher than the BJS estimate for 2010 (Kyckelhahn, 2012). In an updated Vera report, Mai and Subramanian (2017) estimated a mean annual per inmate cost of $33,274 for 2015. Adjusted for inflation from January 2015 to January 2021, the estimate rose to $37,243, about 9% higher than the BSJ estimate adjusted for inflation from 2010 to 2021. Given the closeness between the BJS and the two Vera-generated costs, we were comfortable using the 2010 BJS mean annual per inmate cost adjusted for inflation to 2021 of $34,191.
State Prison Inmate Sentence Duration
Bureau of Justice Statistics runs the National Corrections Reporting Program, which requests administrative information from all state prisons on each prisoner. Compliance with this request is voluntary. Data provided by 44 states on 375,739 people released from prison in 2016 (representing 97% of all people released from state prisons that year) was used to estimate the average maximum sentence length and average time served by people sentenced to more than 1 year for new court commitments (i.e., this excludes people returned to prison for violations based on prior convictions; Kaeble, 2018). People convicted of sex crimes who were sentenced to more than 1 year in state prison and who were released in 2016 had an average sentence length of 12.2 years and served an average of 7.6 years, or 61.9% of their maximum sentence (Kaeble, 2018, see Table 3).
State Prison Calculations
In this section, we compiled information on state prison inmate counts and costs. Given available count and cost information and assuming that 80% of inmates with sex crime convictions had child victims, we estimated: 1. An adjusted number of state prison inmates incarcerated for sex crimes of 159,103, derived by discounting 161,900 (number of inmates with sex crimes in 2015) by a constant annual reduction of 0.29% in violent offender prison populations from 2015 to 2021. 2. An annual per inmate cost adjusted for inflation from January 2010 to January 2021 of $34,191. 3. An annual total cost of incarcerating people for sex crimes of $5,439,890,673, derived by multiplying $34,191 (the per inmate cost) by 159,103 (number of inmates with sex crime convictions). 4. An annual total cost of state prison incarceration for inmates with child victims of $4,351,912,538, derived by multiplying $5,439,890,673 (annual total cost of incarcerating people for sex crimes) by .80 (fraction of people incarcerated for sex crimes against child victims). 5. A per cohort cost of $33,074,535,292, derived by multiplying $4,351,912,538 (annual total cost of state prison incarceration for inmates with child victims) by 7.6 (average duration [in years] of incarceration in state prison for sex crimes).
Thus, annually, we spend nearly $4.4 billion to incarcerate about 127,282 people for sex crimes against children in state prisons at an average annual per inmate cost of $34,191. Assuming the duration of state prison incarceration continues to average 7.6 years, the cost of incarcerating the current cohort of inmates with sex crimes against children will exceed $33 billion.
Federal Prisons
Federal Prison Inmate Counts
On its statistics Web site, the U.S. Federal Bureau of Prisons provides inmate data that are updated weekly (see https://www.bop.gov/about/statistics/population_statistics.jsp). On June 22, 2021, this site indicated 153,047 federal prison inmates, of whom 16,062 (11.2%) were incarcerated for sex offenses. We estimated of whom 12,850 (80%) had child victims. These data align reasonably well with published reports. For example, a U.S. Department of Justice performance report indicated 9% of all federal prisoners had sex crime convictions as their most serious offense as of November 2018 (U.S. Department of Justice, n.d.b). Likewise, an analysis of Bureau of Prisons data from 2013 indicated nearly 10% of all federal prisoners had sex crime convictions as their most serious offense (Faust & Motivans, 2015).
Federal Prison Inmate Costs
The Federal Bureau of Prisons reports an annual cost of incarceration fee for federal inmates. This fee is calculated by dividing Bureau of Prisons facilities’ monetary obligations by the number of inmate days for the fiscal year and then multiplying by the number of days in that fiscal year (Hyle, 2018). The most recent estimated cost was $37,449 for fiscal year 2018 (Bureau of Prisons, Justice, 2019). After adjusting for inflation from January 2018 to January 2021, the cost rose to $39,521.
Federal Prison Inmate Sentence Duration
Bureau of Justice Statistics operates the Federal Justice Statistics Program, which presents information on federal criminal cases provided by the Federal Bureau of Prisons and the U.S. Sentencing Commission, among other federal entities. Reports often, but not always, distinguish between information for sex crimes versus other types of violent and nonviolent crimes. The most recent report we identified that distinguished between sexual and nonsexual violent offenses was informed by data from fiscal year 2014 (Motivans, 2017). In his report, Motivans provided the average sentence imposed on people sentenced to federal prison for sex crime convictions in 2014 as well as the average sentenced served by people released from federal prison in 2014. In doing so, he first distinguished between inmates with violent (25%) versus nonviolent (75%) sex crime convictions. People convicted of violent sex crimes in 2014 received an average sentence length of 236.6 months or nearly 20 years while people convicted of nonviolent sex crimes received an average sentence length of 107.3 months or nearly 9 years (Motivans, 2017, see Table 5.2).
People released from federal prisons in 2014 after serving time for violent sex crimes served 88.6% of their sentences while those released after serving time for nonviolent sex crimes served 87.4% of their sentences (Motivans, 2017, see Table 7.11). We can never know precisely how long someone currently imprisoned will remain until they are released (or die). However, if average sentence lengths and time served remain constant, federal inmates with violent sex crime convictions will serve approximately 17.5 years (236.6 months X .886) while federal inmates with nonviolent sex crime convictions will serve nearly 8 years (107.3 months X .874).
Federal Prison Calculations
In this section, we compiled information on federal prison inmate counts and costs. Given available count and cost information and assuming that 80% of federal inmates with sex crime convictions had child victims, we estimated: 1. An annual per inmate cost adjusted for inflation from January 2018 to January 2021 of $39,521. 2. An annual total cost of incarcerating people for sex crimes of $634,786,302 derived from multiplying $39,521 (annual per inmate cost) by 16,062 (number of inmates with sex crime convictions). 3. An annual total cost of federal prison incarceration for inmates with child victims of $507,829,042, derived by multiplying $634,786,302 by .80 (fraction of people incarcerated for sex crimes against child victims). 4. A total per cohort cost of incarcerating inmates for violent and nonviolent sex crimes against children of $5,194,331,468. To estimate the federal prison cohort cost, we first had to determine the number of violent and nonviolent sex crime offenders, discount those counts to 80% for child victims, and then multiply by the estimated duration of sentence served. Thus, we estimated: a. The number of federal inmates with violent sex crime convictions against children of 3212 derived by multiplying 16,062 (inmates with sex crimes) by .25 (fraction of inmates with violent sex crimes) by .80 (faction of inmates with sex crimes against children). b. An average duration of time served by federal inmates with violent crime convictions of 17.47 years, derived by multiplying 19.72 (average imposed sentence for violent sex crimes) by .886 (fraction of time served for violent sex crimes). c. A per cohort cost of incarcerating inmates with violent sex crimes against children of $2,217,812,150, derived by multiplying 3212 (inmates) by $39,521 (per inmate cost) by 17.47 (estimated years served). d. The number of federal inmates with nonviolent sex crime convictions of 9,637, derived by multiplying 16,062 (inmates with sex crimes) by .75 (faction of inmates with nonviolent sex crimes) by .80 (fraction of inmates with child victims). e. An average duration of time served by federal inmates with nonviolent crime convictions of 7.82 years, derived by multiplying 8.94 (average imposed sentence for nonviolent sex crimes) by .874 (fraction of time served for nonviolent sex crimes). f. A per cohort cost of incarcerating inmates with nonviolent sex crimes against children of $2,976,519,318, derived by multiplying 9637 (inmates) by $39,521 (per inmate cost) by 7.82 (time served). g. A total per cohort cost of incarcerating inmates for violent and nonviolent sex crimes against children of $5,194,331,468, derived by summing the sub-cohort costs for inmates with violent ($2,217,812,150) and nonviolent ($2,976,519,318) sex crimes.
Thus, we annually spend nearly $508 million to incarcerate about 12,850 people with child sex crime victims in federal prisons at an annual average per inmate cost of $39,521. Assuming the duration of federal prison incarceration averages approximately 17.5 years for violent sex crimes and nearly 8 years for nonviolent sex crimes, the cost of incarcerating the current cohort of federal prison inmates with child sex crime victims approaches $5.2 billion.
Sex Offender Civil Commitment
Sex offender civil commitment inmate counts and costs related to committed inmates with sex crimes against children.
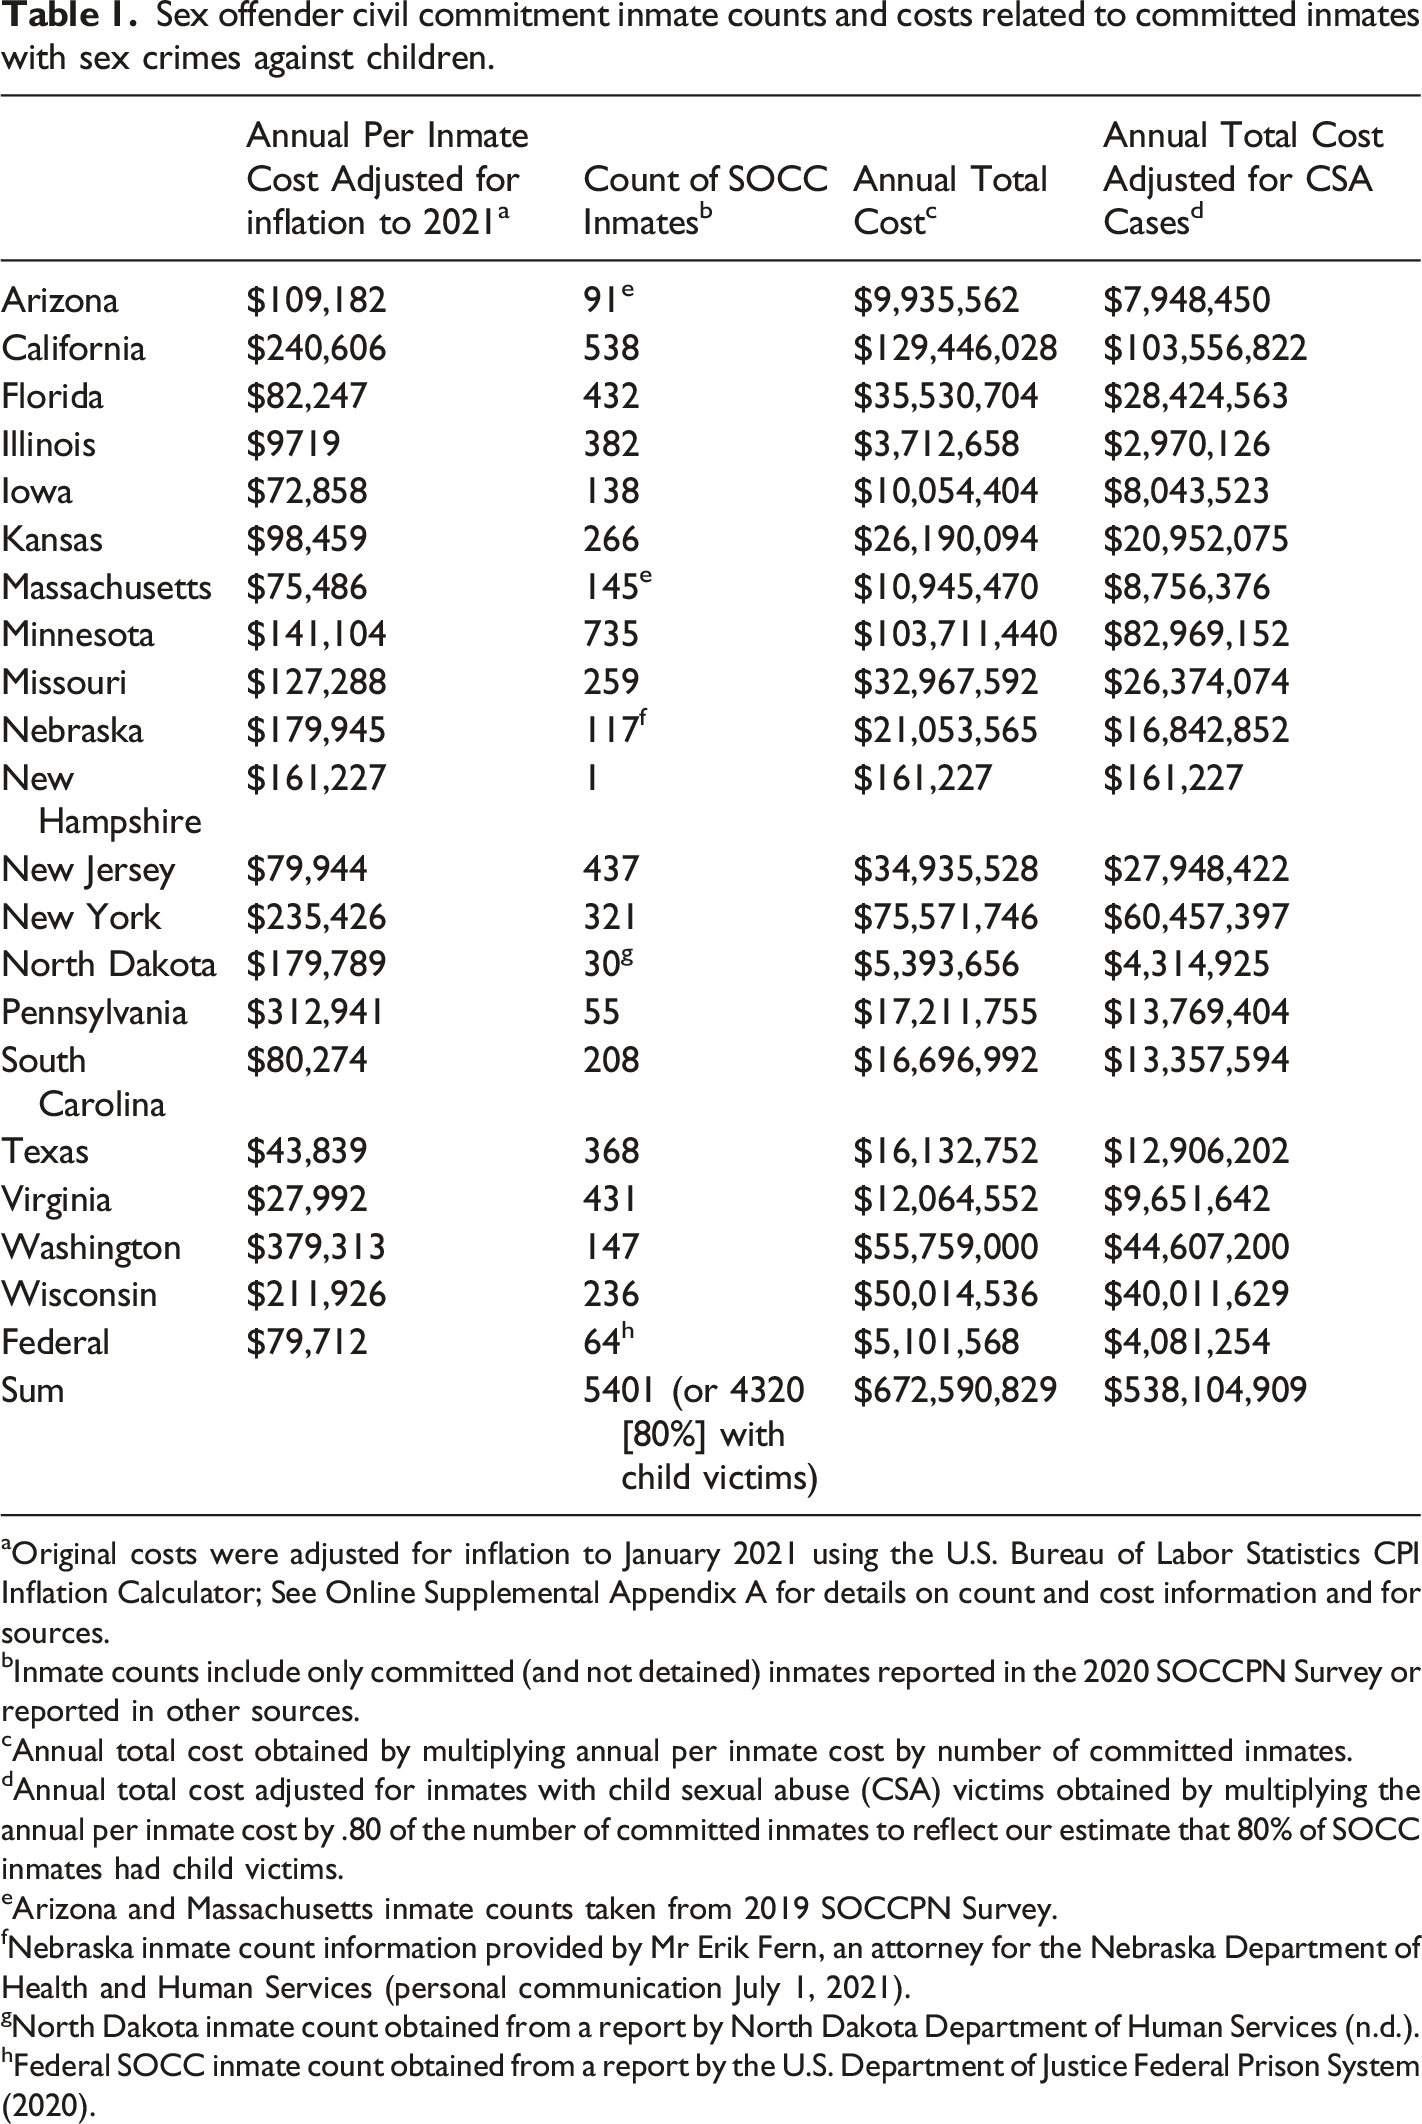
aOriginal costs were adjusted for inflation to January 2021 using the U.S. Bureau of Labor Statistics CPI Inflation Calculator; See Online Supplemental Appendix A for details on count and cost information and for sources.
bInmate counts include only committed (and not detained) inmates reported in the 2020 SOCCPN Survey or reported in other sources.
cAnnual total cost obtained by multiplying annual per inmate cost by number of committed inmates.
dAnnual total cost adjusted for inmates with child sexual abuse (CSA) victims obtained by multiplying the annual per inmate cost by .80 of the number of committed inmates to reflect our estimate that 80% of SOCC inmates had child victims.
eArizona and Massachusetts inmate counts taken from 2019 SOCCPN Survey.
fNebraska inmate count information provided by Mr Erik Fern, an attorney for the Nebraska Department of Health and Human Services (personal communication July 1, 2021).
gNorth Dakota inmate count obtained from a report by North Dakota Department of Human Services (n.d.).
hFederal SOCC inmate count obtained from a report by the U.S. Department of Justice Federal Prison System (2020).
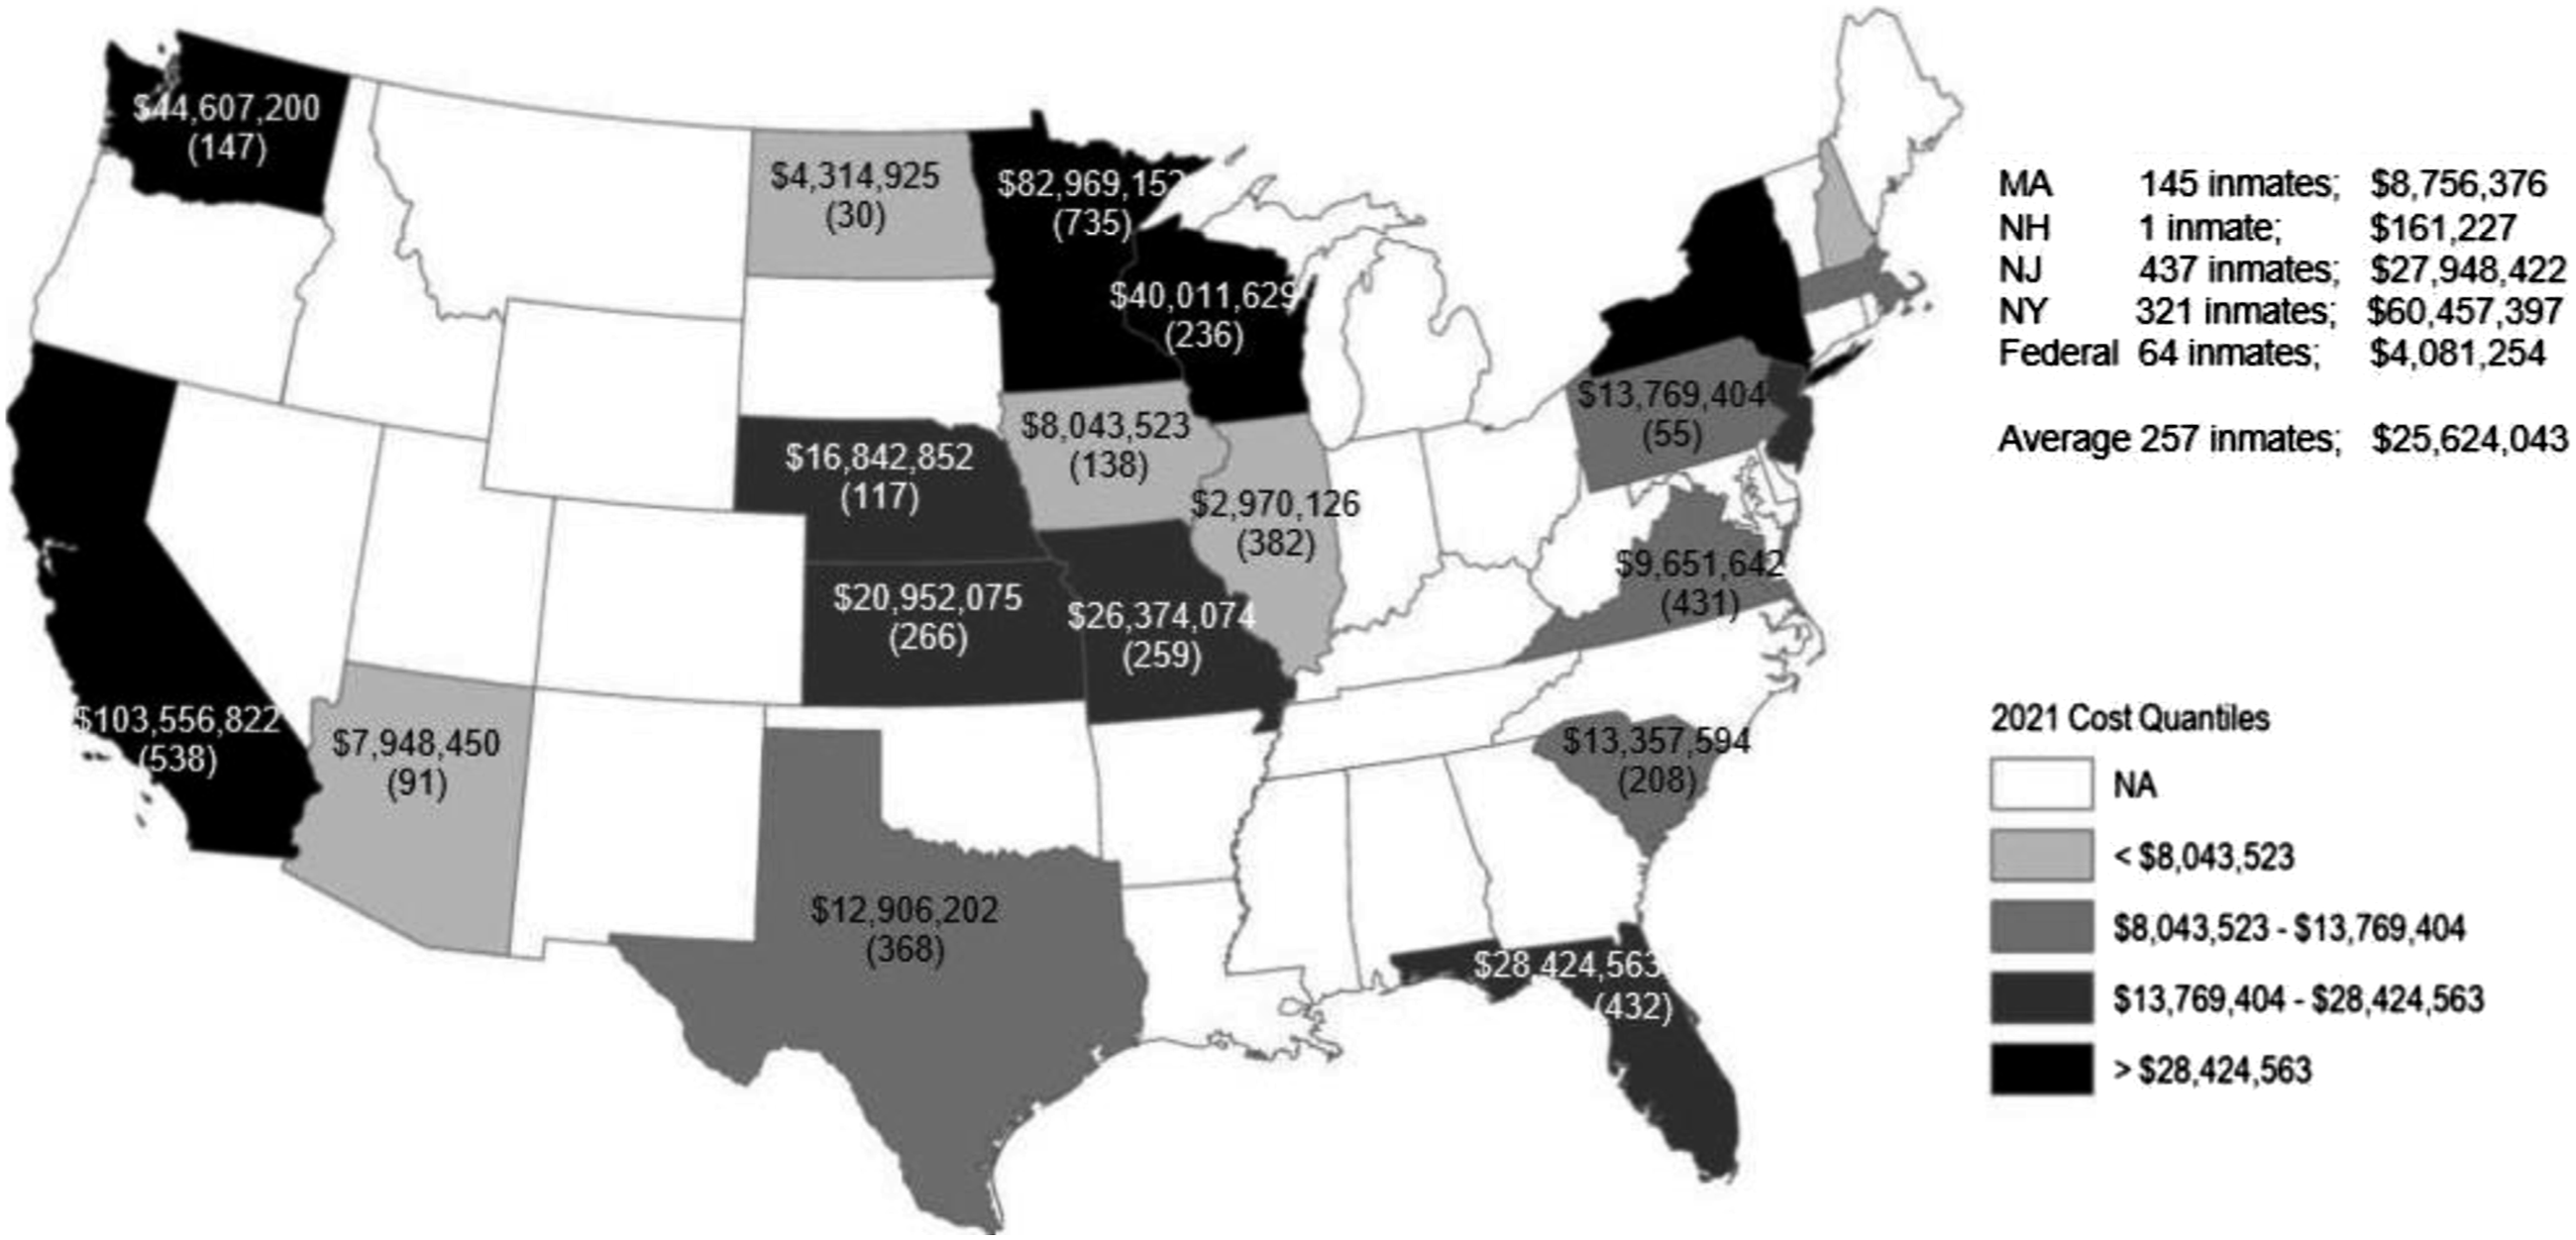
Estimated census count and annual cost (2021) for sex offender civil commitment of people with sex crimes against children.
Sex Offender Civil Commitment Inmate Counts
We did not find a government resource that provided SOCC inmate count information across programs. However, the Sex Offender Civil Commitment Programs Network (SOCCPN) does do so. SOCCPN describes itself as an organization of professionals working in SOCC programs (see https://soccpn.org/about-us/). SOCCPN has conducted surveys of SOCC programs since 2014 (Sandler & Freeman, 2017). Survey results are reported at the organization’s annual conference (Hoppe et al., 2020; Sandler & Freeman, 2017). SOCCPN survey data are requested from all SOCC programs and provided voluntarily by administrators associated with individual programs. Survey questions assess, among other issues, counts of committed, detained, and discharged or released inmates; information on inmate treatment status; staffing information; and types of medical, psychiatric, and other services made available to inmates. Survey questions do not assess SOCC costs. Results from the three most recent surveys (Schneider et al., 2018, 2019, 2020) were provided for our use by SOCCPN member Dr Naomi Freeman (N. Freeman, personal communication, June 9, 2021).
We utilize the 2020 SOCCPN counts of committed (but not detained) inmates in our estimates. Detained inmates are typically awaiting final commitment decisions, are unlikely to be associated with the same costs as committed inmates, and may stay for relatively shorter periods of time in commitment facilities. In the 2020 SOCCPN survey, count data were missing for five SOCC programs, including Arizona, Massachusetts, Nebraska, North Dakota, and the federal program. For Arizona and Massachusetts, we substituted inmate counts from the 2019 SOCCPN survey. For Nebraska, we relied on inmate counts provided by a lawyer for the Nebraska Department of Human Services (Erik Fern, Attorney III, personal communication July 1, 2021). For North Dakota, we relied on a 2019–2020 budget report (North Dakota Department of Human Services, n.d.). For the federal program, we relied on a report by the U.S. Department of Justice Federal Prison System (n.d.a.) that included inmate count information for fiscal year 2019. About 5401 people were committed to SOCC facilities in 2020 (Table 1), of whom we estimate 4321 (80%) had child victims. The total count aligns well with other published estimates of SOCC inmate counts (e.g., Steptoe & Goldet, 2016; Tolman, 2018). An additional 844 detainees are held at the 16 SOCC facilities that responded to the 2020 SOCCPN survey (again, detainees are not reflected in our count, cost, or cohort calculations).
Sex Offender Civil Commitment Inmate Costs
We found just two sources that provided cost information across SOCC programs. In a 2005 report, the Washington State Institute for Public Policy (2005) provided count and cost information for 17 SOCC programs through December 2004. These data were then updated through 2006 (Gookin, 2007). Information for both reports was provided voluntarily by administrators associated with the individual programs. For 2006, annual per inmate costs across 17 programs averaged $97,000 and ranged from $17,391 (Texas) to $166,000 (California). Annual inpatient program costs ranged from $1.2 million (Texas) to $147 million (California) and collectively cost about $455 million for 2006 (Gookin, 2007, see Exhibit 3). Both Washington State Institute of Public Policy reports emphasized that SOCC costs were often difficult to disentangle from other state budget categories and estimates were not based on a uniform set of expenditures across programs.
Because the Washington State Institute of Public Policy reports were more than 15 years old, we searched for more recent cost estimates. We successfully identified more recent program-specific cost information from formal sources (e.g., state agency budget reports, contracts with private facility operators) for all programs. These costs are described in Table and the sources of these costs are detailed in the Online Supplemental Appendix A. As needed, we updated costs to account for inflation through January 2021. Based on the available data and adjusted for inflation to January 2021, we estimated an annual per inmate cost of $139,489.
Sex Offender Civil Commitment Inmate Commitment Duration
Most of the sources we found regarding SOCC inmate counts and costs failed to mention specific durations of commitment. The 2006 Washington State Institute of Public Policy survey (Gookin, 2007) reported that about 11% of SOCC inmates across all programs had ever been fully discharged or released. The three most common reasons for discharge/release were court decision without program staff recommendation (51%), program staff recommendation (38%), and inmate death (17%). No information was provided on the duration of commitment prior to discharge, release, or death.
The SOCCPN surveys included some information about discharge and release. Per the 2020 survey, about 20% of people ever committed to any of the 16 reporting facilities had ever been discharged or released since the inception of those programs. As with the Washington State Institute reports, there was no information in these surveys regarding the duration of commitment prior to discharge or release. The 2018 and 2019 surveys did include information on inmates conditionally released to less secure settings. Among the 13 SOCC programs that offered conditional release, only about 20% of inmates attained conditional release, after a median pre-release commitment duration of 9 years (range of 2–16 years).
Given that only 20% of inmates appear to achieve full or conditional release and that as of 2021 SOCC programs had been in operation for 12 (New Hampshire) to 30 (Washington) years, it appears that most inmates remain committed for one or more decades. Indeed, several SOCC programs, including in Minnesota, Missouri, and North Dakota, were the subjects of class action lawsuits in part because few or no inmates had ever been discharged from these facilities based upon program staff recommendation. For example, in its first 22 years of operation, about 730 people were committed to the Minnesota SOCC program, of whom none (0%) were fully discharged and just 5 (0.7%) were conditionally discharged (Woolman & Anderson, 2016). Likewise, in its first 15 years of operation, about 260 people were committed to the Missouri SOCC program, none of whom (0%) were discharged upon staff recommendation (Bogan, 2015; United States District Court, Eastern District of Missouri, Eastern Division, Case No. 4:09-cv-00971-AGF, 2015). A lawsuit against the North Dakota SOCC program indicated that one-quarter of all inmates had been confined for more than a decade and more than half had been confined for eight or more years (In the United States District Court for the District of North Dakota, Case No. 3:13-cv-3, 2018). Media reports reveal similarly low release rates for some other programs. For example, since launching its secure confinement facility in 2015, the Texas SOCC program discharged or released just 10 (2%) of 552 inmates; during the same time period another 10 inmates died while committed (Dexheimer, 2021). Likewise, since launching in 1999, the New Jersey SOCC facility released just 15% of 579 inmates (Steptoe & Goldet, 2016).
Based on incomplete and limited information on duration of time served at SOCC, we tentatively propose that 20% of SOCC inmates are discharged or released (either fully or to less secure settings) after an average of 9 years. Of the remaining 80%, we tentatively propose that one-third (about 26.6% of the total inmate population) are discharged, released, or die after an average of 15 years confinement, one-third (26.6% of total) after an average of 20 years confinement, and one-third (26.7% of total) after an average of 25 years confinement.
Sex Offender Civil Commitment Calculations
In this section we compiled the SOCC inmate count, cost, and cohort information to derive the annual cost of committing people to secure confinement. We did not attempt to adjust inmate counts to 2021, relying instead on the 2020 figures from the most recent SOCCPN survey and other sources where necessary. We did adjust costs for inflation to January 2021 and also to reflect our assumption that just 80% of inmates have child victims. Based on the available count and cost information (see Table 1 and Online Supplemental Appendix A), we estimated: 1. 4321 SOCC inmates had child victims, derived by multiplying 5401 (number of inmates) by .80 (fraction of inmates with child victims). 2. An average annual per inmate cost adjusted for inflation to January 2021 of $139,489. 3. An average annual per program cost of $32,028,135. 4. An annual total cost across all programs of $672,790,829, derived by summing the per program annual total costs. 5. An annual total cost across all programs specific to inmates with child victims of $538,104,909, derived by multiplying $672,790,829 (annual total cost across all programs) by .80 (fraction of inmates with child victims). 6. A per cohort cost of $10,728,159,783, derived by summing the sub-cohort costs for inmates who remain committed for 9, 15, 20, or 25 years: a. $1,084,870,090 for inmates committed for 9 years, derived by multiplying 4321 (inmates with child victims) by .20 (fraction of inmates serving 9 years) by 9 (years served) by $139,489 (average per inmate cost). b. $2,410,581,341 for inmates committed for 15 years, derived by multiplying 4321 (inmates with child victims) by .267 (fraction of inmates serving 15 years) by 15 (years served) by $139,489 (average per inmate cost). c. $3,214,108,455 for inmates committed for 20 years, derived by multiplying 4321 (inmates with child victims), by .267 (fraction of inmates serving 20 years) by 20 (years served) by $139,489 (per inmate cost). d. $4,017,635,568 for inmates committed for 25 years, derived by multiplying 4321 (inmates with child victims) by .267 (fraction of inmates serving 25 years) by 25 (years served) by $139,489 (per inmate cost).
Thus, we spend more than $538 million each year to incarcerate about 4321 people with sex crimes against children in secure SOCC facilities at an average annual per inmate cost of $139,489. The average per inmate cost for SOCC is so much higher than for state or federal prisons in part because SOCC facilities must provide specialized sex offender treatment, typically delivered by professionals with master’s, doctoral, or medical degrees, per recent SOCCPN surveys (Schneider et al., 2018, 2019, 2020). Assuming the average duration of SOCC incarceration continues as proposed between 9 and 25 years, the estimated cost of incarcerating the current cohort of SOCC inmates with sex crimes against children will exceed $10.7 billion.
In summary, the United States annually spends an estimated $5,397,846,489 to incarcerate about 144,453 people for sex crimes against children across three types of secure facilities: state and federal prisons and SOCC facilities. If the current cohorts of prison and SOCC inmates remain incarcerated for the estimated average durations, the United States will spend an estimated $48,997,026,498 for their keep.
Discussion
Collectively, we estimated that American taxpayers spend nearly $5.4 billion each year to incarcerate people for sex crimes against children in state and federal prisons and civil commitment facilities. This is an enormous amount of money, larger than the gross domestic products of 43 countries (GDP by Country, n.d.). By comparison, the federal budget recently added just $1.5 million dedicated to child sexual abuse prevention research for fiscal year 2021. This is a tiny amount of money, less than we spend annually to investigate diethylstilbestrol, a synthetic hormone now used primarily to treat urinary incontinence in female dogs (Cunha, 2021; NIH-CDC Funding Summary, 2021).
Based on our estimates, the amount we stand to spend on current prison and SOCC inmate cohorts with sex crimes against children is nearly $49 billion, including approximately $33 billion for state prisoners, $5.2 billion for federal prisoners, and $10.7 billion for SOCC inmates. The money we spend to incarcerate SOCC inmates is, of course, spent after we’ve spent money to incarcerate them in prison. More to the point, all of this money is spent after children have already been sexually abused.
Allocating enormous resources to reactive strategies is a choice. Likewise, failing to allocate resources to preventive strategies is a choice. These choices are routine in the United States and, we believe, in most other countries. In efforts to increase U.S. funding for abuse prevention we have yet to meet a single lawmaker who disagreed with the importance of preventing child sexual abuse. At the same time, we have met many lawmakers who argued that there simply was not enough money in the federal budget to support new child sexual abuse prevention efforts. We appear to be comfortable spending millions at the federal level and billions at the state level every year to incarcerate people after they’ve already sexually abused children, while spending almost no money on prevention.
When it comes to punishing sex offenders there is clearly no check we will not write. This is despite the fact that prison fails to deter recidivism (and thus fails to prevent child sexual abuse and other crimes), a finding so common it was labeled a “criminological fact” in a recent meta-analysis (Petrich et al., 2021, unpaginated). The United States leads the world in relying on this “intervention” with 655 prisoners per 100,000 citizens; yet dozens of other (mostly low and middle income) countries also have high rates, with 300 or more prisoners per 100,000 citizens (see https://www.statista.com/statistics/262962/countries-with-the-most-prisoners-per-100-000-inhabitants/other).
Why, when we invest so much in a failed institution like prison, are we so miserly when it comes to funding efforts to prevent abuse from occurring in the first place? We suspect the answer lies in part with the fact that the United States and most other countries have a long history of relying on incarceration to address sexual and nonsexual violent offenses, and in part with the fact that people simply do not think that people who are at risk of sexually abusing children or who have already done so can be deterred from initial or subsequent offending (Fix et al., 2021). However, findings from studies with empirically rigorous research designs support the clinical and cost effectiveness of interventions for people who have already sexually offended (e.g., Duwe, 2018; Elliott & Beech, 2012; Hanson et al., 2009; Marshall & Marshall, 2021; Wilson et al., 2009). Likewise, there is mounting evidence that prevention of first-time sex crimes is also achievable (Assini-Meytin et al., 2020).
However, more money is needed to support prevention efforts. Some readers may interpret this point as a call to fund prevention instead of punishment. Yet we could choose to fund both reactive and preventive strategies. Child sexual abuse is indisputably a criminal justice problem and a public health problem. Approximately 12% of the world’s children will experience some form of child sexual abuse prior to age 18 (Stoltenborgh et al., 2011) at great cost to themselves (Putnam, 2003), their families (Tavkar & Hansen, 2011), and society (Letourneau et al., 2018). There are strong arguments to be made in favor of holding adults accountable for offending against children and for preventing such offending from occurring in the first place (Letourneau et al., 2014; Mercy, 1999; Mercy et al., 1993).
Alternatively, some readers may interpret this point about the need for more funding as a call to reallocate some portion of funding from reactive to preventive efforts. There is a certain logic to this argument. Given the many problems caused by mass incarceration (Brinkley-Rubenstein & Cloud, 2020) and diminishing (if any) returns of lengthy incarceration for all but the most violent offenders (Cullen et al., 2011; Petrich et al., 2021; Smith et al., 2002), one could make the case for reducing the number of people incarcerated and the duration of incarceration and for then reallocating any cost savings toward prevention. However, the fixed costs of prisons (and we presume, SOCC facilities) are relatively impervious to fluctuations in inmate counts; instead, cost savings are more likely to be realized after facilities are completely shut down (Mai & Subramanian, 2017). Reducing the number of people incarcerated and/or the number of years confined is unlikely to unlock funding for child sexual abuse prevention efforts or anything else in the short term. Again, holding adults accountable for harming children is a necessary component of any reasonable approach to child sexual abuse - but we find it incomplete and even potentially harmful to children if not also accompanied by robust prevention efforts.
Happily, we do not need to tie prevention funding to criminal justice funding. Indeed, dedicated federal resources have been allocated to violence prevention efforts for decades (Dahlberg & Mercy, 2009; U.S. Government Accountability Office Report to Congress, 1991; Whittier, 2009) without any overt link to justice expenditures insofar as we know. However, these federal violence prevention resources largely bypassed child sexual abuse (Assini-Meytin et al., 2020; Letourneau et al., 2014; Mercy, 1999; Tabachnick, 2013). State governments also have invested relatively little in the prevention of child sexual abuse and cite limited federal funding as a significant barrier to prevention efforts (CDC Foundation, n.d.)
In the United States, there are mounting efforts to increase federal funding for child sexual abuse prevention. Most ambitiously, a 2021 federal policy blueprint to address sexual violence against children “Keep Kids Safe: Prevention. Healing. Justice” was developed by a coalition of survivor advocate organizations for submission to the Biden Administration (see https://www.keep-kids-safe.org/). This U.S. National Blueprint identifies four priorities, including establishing a whole-of-government approach, developing and passing comprehensive legislation, establishing a bi-partisan commission, and expanding support for global programs. While the full budget has not yet been provided, by our calculations the requested funding approaches $7 billion.
Included within the Blueprint are recommendations to fund several individual acts, including the Invest in Child Safety Act, introduced by five U.S. senators in May 2020. This Act alone requested $5 billion to prevent and address online child sexual exploitation and abuse across a 10-year period. The bill did not receive a vote in 2020 and was reintroduced in February 2021. Unfortunately, the vast majority of funding in this Act supports reactive strategies for detecting, apprehending, and prosecuting online offenders. At both a relative and absolute level, few of this Act’s funds appear to support serious prevention efforts.
The Blueprint also recommends funding the Stronger Child Abuse Prevention and Treatment (CAPTA) Act, introduced by Representative Robert Scott in January 2021. This Act was debated and voted on in the House and is currently under review by the Senate. If enacted as currently written, this Act would more than double CAPTA funding to $270,000,000 annually through 2027 (the Blueprint recommends an even higher funding level for CAPTA). Specific to child sexual abuse, this Act would require states to establish task forces to study and report on efforts to prevent and detect abuse in the context of youth serving organizations and to study and report on child marriage. Much of the Act’s funding would go towards prevention and treatment efforts, without specifying how much funding should be invested in different types of abuse. Given significant overlap in risk factors across different types of child abuse and high rates of polyvictimization (Finkelhor et al., 2011), it is reasonable to address childhood victimization collectively and collaboratively. Yet, historically, CAPTA funding failed to address child sexual abuse (U.S. General Accounting Office, 1991). Moreover, given unique risk factors, not all policies or practices impact different types of childhood abuse equally (Assini-Meytin et al., 2021). Thus, there may be value in specifying a minimum amount of funding specific to child sexual abuse prevention efforts.
Less ambitiously, in 2018 the first author launched an effort advocating for $10 million in federal funding to the CDC’s Center for Injury Prevention and Control (which includes the Division of Violence Prevention) for child sexual abuse prevention research. This effort is also recommended for funding in the Blueprint, and was supported by dozens of organizations that signed letters of support and by dozens of Representatives who signed a “Dear Colleague” letter led by Representative Frank Mrvan (see Online Supplemental Appendices B and C for letters). To date, this effort has been modestly successful, with $1 million in new federal funding added in fiscal year 2020, which was increased to $1.5 million for fiscal year 2021. As of this writing, both the House and Senate Labor HHS budgets for fiscal year 2022 propose increasing this funding to $2.5 million. The rationale for requesting $10 million in annual funding was entirely practical. The Center for Injury Prevention and Control awards grants for extramural research projects, many of which focus on the design, evaluation, and/or dissemination of effective violence prevention strategies. In 2020, the average grant awarded by the Center was approximately $350,000 per year, with grants to larger violence prevention projects and centers reaching $1.3 million per year (Office of Financial Resources, n.d.). Theoretically, $10 million in annual funding could support numerous independent investigations in geographically diverse settings across the U.S. to find effective solutions for child sexual abuse prevention. Also, an earlier effort by the first author requesting $30 million in federal funding for prevention research got nowhere.
Study Strengths and Limitations
For several reasons, we believe the eye-popping numbers estimated in this study are conservative. First, we conservatively estimated that 80% of persons incarcerated for sex crimes had child victims; the resources that provided such estimates actually ranged from more than 79% up to 84% (Cochran et al., 2021; Huenke et al., 2007; Jumper et al., 2012; Schneider et al., 2018; Weidlein-Crist & O’Connell, 2008). Second, our inmate counts are also conservative because we (or the sources upon which we relied) excluded people who were detained but not yet convicted or committed, people serving prison sentences of less than 1 year, and children serving time in youth prisons. Third, our costs are conservative because we limited our estimates to incarceration and did not attempt to calculate any costs associated with actions that necessarily precede incarceration (e.g., related to detection and litigation), costs associated with actions that follow release from incarceration (e.g., related to supervision, registration, notification), costs associated with collateral consequences borne by incarcerated felons in general (e.g., lost wages, higher mortality; McLaughlin et al., 2016), or costs borne by felons convicted of sex crimes in particular (e.g., residence and other restrictions that often accompany sex offender registration; Jennings et al., 2012). Fourth, our costs may be conservative due to the method we used to account for inflation. There is some evidence that prison costs outpaced inflation since 2016 (CRS Report, 2018). Our reliance on the CPI inflation calculator to adjust costs for inflation to January 2021 may have underestimated prison costs. Fifth, we relied on government costs estimates where possible, which may systematically or haphazardly undercount the full costs of incarceration (Henrichson & Delaney, 2012; Gookin, 2007; Mai & Subramanian, 2017). To the extent that our estimates are off, we believe we underestimated rather than overestimated costs.
The primary limitation to this paper is that we did not have raw data with which to categorize cases as involving child versus adult victims (and thus verify average sentence duration and proportion of violent vs. nonviolent sex crimes cases that involved child victims) or to independently verify the costs that informed our calculations. Additionally, some of our cost information was dated, particularly for state prison costs. We relied on the Bureau of Labor CPI inflation calculator to adjust for inflation which, while broadly accepted, does not always reflect accurate consumer pricing (Kovach, 2008). Because there is no single entity charged with tracking SOCC costs, we relied on a wide variety of sources to estimate program-specific SOCC costs and these sources likely included different cost categories in their computations. We were grateful to SOCCPN for sharing their annual surveys and found that their inmate count numbers aligned closely with counts reported by formal and informal (media and personal communication) sources. Nevertheless, there were several programs that did not participate in these surveys. It would be extremely helpful if all SOCC programs participated in the SOCCPN surveys and if the survey was broadened to systematically evaluate costs using clearly defined cost categories. Despite these limitations, we believe this paper provides a reasonable starting point against which to compare future incarceration cost estimates (which we expect will rise with increased scrutiny, at least in the United States) and to weigh future investments in prevention and treatment.
Child sexual abuse is a preventable—not inevitable—public health problem. But we cannot prevent it with a pittance. With billions currently allocated to a regime that has continued to fail to adequately protect children, a more serious and thoughtful investment of resources is needed to ensure that we prevent child sexual abuse in the first place.
Supplemental Material
sj-pdf-1-sax-10.1177_10790632221078305 – Supplemental material for No Check, We will not Write: A Report on the High Cost of Sex Offender Incarceration
Supplemental material, sj-pdf-1-sax-10.1177_10790632221078305 for No Check, We will not Write: A Report on the High Cost of Sex Offender Incarceration by Elizabeth J. Letourneau, Travis W. M. Roberts, Luke Malone, and Yi Sun in Sexual Abuse: A Journal of Research and Treatment
Footnotes
Declaration of Conflicting Interests
The author(s) declared no potential conflicts of interest with respect to the research, authorship, and/or publication of this article.
Funding
The author(s) received no financial support for the research, authorship, and/or publication of this article.
Supplemental Material
Supplemental material for this article is available online.
Notes

References
Supplementary Material
Please find the following supplemental material available below.
For Open Access articles published under a Creative Commons License, all supplemental material carries the same license as the article it is associated with.
For non-Open Access articles published, all supplemental material carries a non-exclusive license, and permission requests for re-use of supplemental material or any part of supplemental material shall be sent directly to the copyright owner as specified in the copyright notice associated with the article.
