
Abstract
There are multiple ways to report risk scale results. Varela et al. (2014) found that Static-99R results were interpreted differently by prospective jurors based on risk level (high vs low) and an interaction between risk level and risk communication format (categorical, absolute estimate, and risk ratio). We adapted and extended Varela et al.’s (2014) study using updated Static-99R norms, recruiting a population-wide sample (n = 166), and adding variables assessing the personality factors ‘cognitive motivation’ (i.e., need for cognition) and ‘attitudinal affect’ (i.e., attitudes toward sex offenders, authoritarianism). We found a main effect of risk level and no effect of either communication format or the interaction between the two. Adding the personality variables increased explained variance from 9% to 34%, suggesting risk perception may be more about the personality of the person receiving the information than the information itself. We also found an interaction between attitudes toward sex offenders and risk level. Our results suggest risk perception might be better understood if personality factors are considered, particularly attitudes toward sex offenders. Because biases/personality of the person receiving the information are unknown in real world settings we argue that sharing multiple methods for communicating risk might be best and more inclusive.
Keywords
Risk assessment is a ubiquitous task within forensic contexts (e.g., expert testimony) and has evolved considerably over the last decades to identify high risk violent offenders (e.g., Hanson, 2009; Harris & Hanson, 2010). Correctional intervention strategies are most effective when they are proportionally matched to the risk posed by the individual (Andrews & Bonta, 2010), which means that accurate risk assessment is a precursor to reducing recidivism. To date, various approaches to risk assessment can be differentiated (Andrews & Bonta, 2010). There is strong evidence that structured, actuarial approaches to risk prediction are more accurate than unstructured professional judgments (Ægisdóttir et al., 2006; Meehl, 1954). Following Dawes et al. (1989), actuarial risk assessment refers to any risk tool that has explicit rules for classification, and that links classification to probabilistic statements about the outcome.
While research on developing and refining sexual recidivism risk assessment scales has “evolved at a dizzying pace” (Harris & Hanson, 2010, p. 296) and there is considerable advice about how to conceptualize and validate risk scales (Helmus & Babchishin, 2017), we know comparatively little about the optimal strategies to communicate that information (Hilton et al., 2015). This lack of knowledge about optimal strategies is concerning as the appropriate use of risk assessment to reduce recidivism hinges on effective risk communication to guide decision-making (e.g., bail, placement within institutions, community release, risk management). If risk assessment results are presented in an unclear or misleading way or if the information is not properly understood by the decision-maker, this can lead to poor decisions at every stage of the criminal justice system. It can result in inefficient use of resources (e.g., over-managing low-risk individuals, which can increase risk; Andrews & Bonta, 2010), unjust restrictions on civil liberties, or the endangerment of public safety.
Comprehensible and convincing risk assessment is also necessary to overcome preconceived notions and biases about people who have committed offenses, particularly sexual offenses. People have a tendency to overestimate risk, particularly for rare or scary events (Kahneman, 2011). Risk perception may be heavily driven by emotional reactions. For example, in one study half of jurors felt that even a 1% chance of sexual reoffense was considered “likely” to reoffend (Knighton et al., 2014), even though this is below the rate of offending seen among justice-involved individuals with no history of a sexual offense (Kahn et al., 2017). Also, research has found that information that may be irrelevant to risk (e.g., demonstrated remorse for the current offense) may have a stronger influence on juror decision-making compared to testimony about risk instrument scores (Turner et al., 2015).
Risk Communication
An important advantage of actuarial risk assessment instruments is that there are multiple ways to report the information provided (Lehmann et al., 2016). Their scores are linked to several types of quantitative, empirically derived estimates of risk. Three important quantitative metrics for risk communication are absolute recidivism rates, percentile ranks, and risk ratios. Absolute recidivism rates give a probability estimate (e.g., 40% of offenders with a score of 5 are reconvicted within 5 years) and are especially important for decisions involving thresholds (e.g., civil commitment evaluations). They are the most commonly reported quantitative metric with most risk assessment instruments used in forensic settings (Blais & Forth, 2014; Chevalier et al., 2015). Percentile ranks (e.g., offenders with a score of 5 are in the top 15% in terms of risk for sexual recidivism) specify the percentage of offenders who score the same or worse on a specific risk tool, which often provide a valuable starting point when interpreting the result of an empirically-validated risk assessment measure. While percentile ranks measure the “unusualness” of assessment findings (Crawford & Garthwaite, 2009), risk ratios (e.g., offenders with the score of 5 have almost three times the sexual recidivism of the typical sexual offender) quantify how much riskier an offender is compared to a reference category. Relative risk metrics such as percentiles and risk ratios are crucial for resource allocation decisions (Harris et al., 2015).
Even though actuarial risk tools are commonly used in the forensic field and offer multiple ways to communicate risk relevant information, some research has demonstrated issues with these different methods of communication (for review of strengths and weaknesses of these metrics, see Lehmann et al., 2016). For example, in terms of identifying absolute recidivism rates, risk assessment instruments do not appear consistent across samples (calibration; Helmus, 2018) and should be reported with numerous caveats and considerations (see Helmus, 2021).
Risk assessment instruments also provide qualitative, categorical risk categories (e.g., low, moderate, and high risk), with evaluators and decision-makers typically preferring categorical labels over quantitative information (Evans & Salekin, 2014; Falzer, 2013; Heilbrun et al., 2004; Heilbrun et al., 2000). Unfortunately, research indicates that risk categories are interpreted inconsistently by professionals (Hilton et al., 2008; Monahan & Silver, 2003), reducing their reliability. As risk categories have historically been arbitrarily developed across scales the same person is often assigned to different risk labels on similar risk assessment scales (Jung et al., 2013; Mills & Kroner, 2006). There have been recent efforts to develop standardized risk levels (Hanson et al., 2017), although this new approach is not without its criticisms as well (Hogan, 2021).
For predicting sexual recidivism, the most commonly used actuarial risk assessment tool worldwide is Static-99R (Kelley et al., 2020; McGrath et al., 2010; Neal & Grisso, 2014). There are at least 10 translations of the scale and it is used in at least 30 different countries (Helmus et al., 2022). Major strengths of Static-99R are that it only uses risk factors empirically associated with sexual recidivism (Helmus & Thornton, 2015) and that it has explicit rules for combining the factors into a total risk score (Phenix et al., 2016a). For a more detailed review of Static-99R (strengths, weaknesses, legal admissibility, predictive accuracy meta-analysis), see Helmus et al. (2022).
Previous Empirical Research on Risk Communication
Risk Level and Communication Format
Summary of Previous Studies on the Influence of Risk Communication Format and Risk Level.
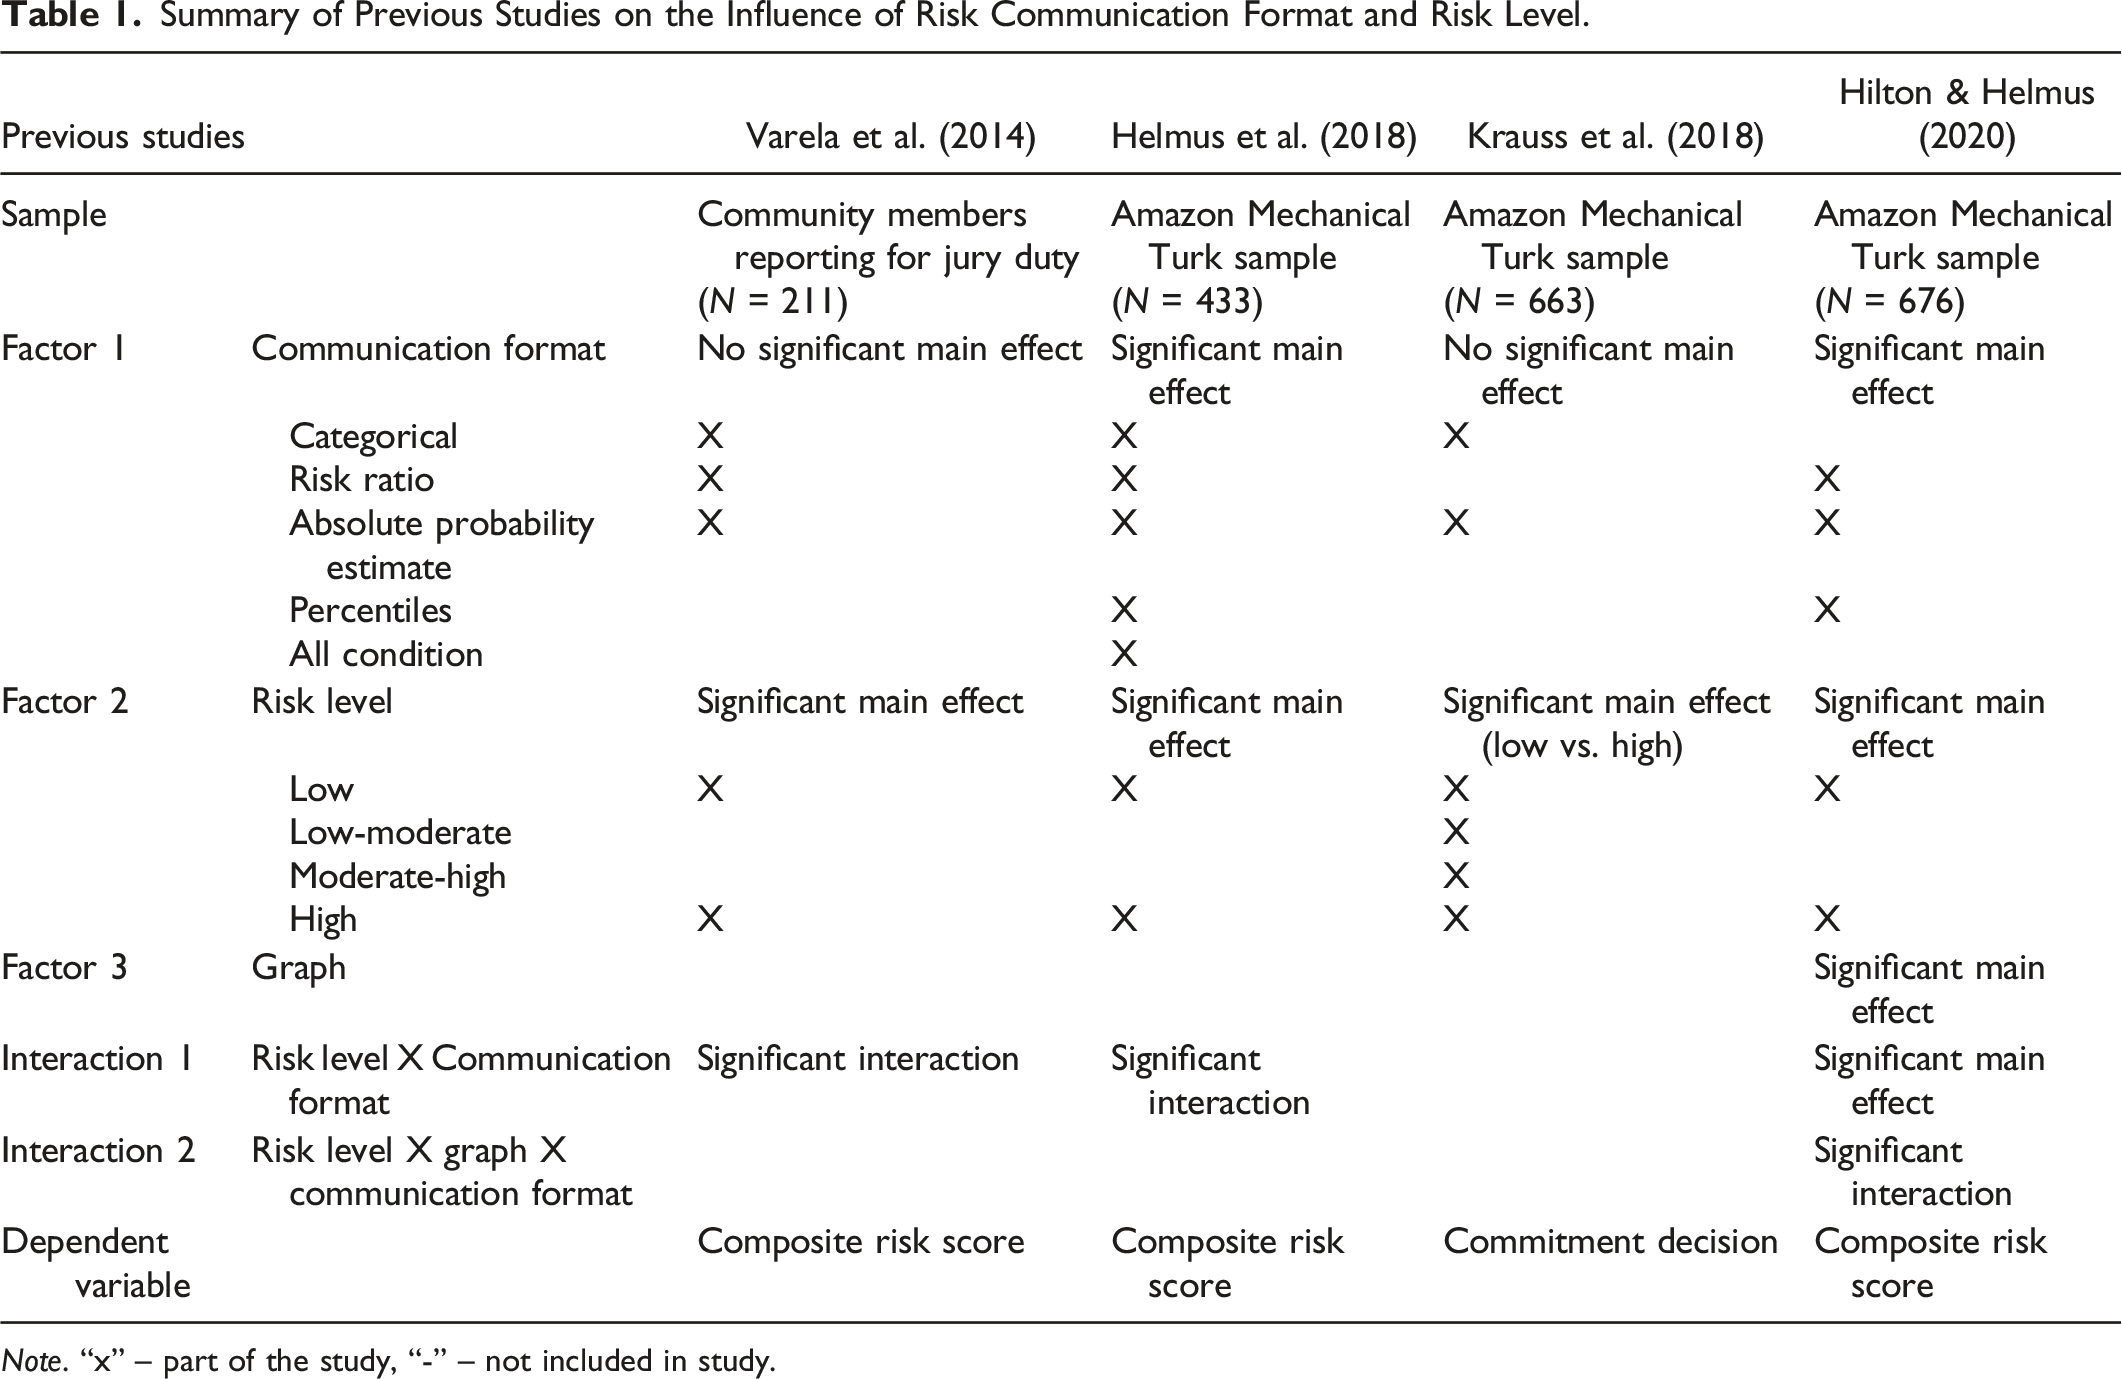
Note. “x” – part of the study, “-” – not included in study.
In their vignette experiment with prospective jurors, Varela et al. (2014) manipulated the risk level of Static-99R (high vs. low) and the communication format (categorical, absolute probability estimate, and risk ratio). After the experimental manipulation they asked participants to make three ratings (on a Likert scale) related to the hypothetical offender: likelihood of committing a new sexual offense in the next 5 years, dangerousness to community members, and support for the use of the “most strict and expensive supervision strategies.” Because of the strong correlation between ratings of likelihood of reoffense and dangerousness Varela et al. averaged ratings for these two items to form a risk composite score. They found a main effect for the risk level, indicating that averaged across risk communication formats, participants viewed higher scoring individuals as higher risk than lower scoring individuals. This was encouraging given that Varela et al. hypothesized participants may devalue risk assessment results when they indicate low-risk. In addition, there was no main effect for the communication format. Risk level did, however, significantly interact with communication format: participants rated high and low-risk individuals most differently in the categorical condition and least differently in the probability estimate condition.
Helmus et al. (2018) conducted a direct replication of Varela et al. (2014) as well as an extension study using participants from Amazon’s Mechanical Turk. The extension study included two additional risk communication metrics: percentiles and an “all” condition using all four metrics. Both the replication and the extension study replicated the main effect of the risk level but additionally found a significant main effect of the communication format: risk categories resulted in higher risk ratings and absolute recidivism rates resulted in lower risk ratings. Additionally, communicating results by combining all metrics together resulted in lower risk perception, similar to absolute recidivism rates. The interaction between risk level and risk communication format was also replicated in both studies: in the extension study, the risk level effect was strongest (i.e., participants more clearly differentiated high and low-risk offenders) when results combining all metrics were used, followed closely behind by categorical communication. The risk level effect was lowest when using either absolute recidivism probabilities or risk ratios.
Krauss et al. (2018) also attempted to replicate some of Varela et al. (2014) findings using participants from MTurk. They examined four risk levels on Static-99R instead of two, but only compared two risk metrics (probabilities and categories). Unlike Varela et al. (2014), they measured perceived risk dichotomously rather than a Likert scale (specifically, they asked whether the offender was more likely than not to commit a future sexually violent offense). Their results were generally consistent with Varela et al. (2014). There was no main effect of risk communication format. Commitment decision did significantly depend on risk level, but only when combining the two lower risk levels (low and low-moderate) and the two high risk levels (moderate-high and high) paralleling Varela et al. (2014). Krauss et al. continued to test for specific relationships between the four risk levels and commitment decision within formats of risk communication. When including all four risk levels, risk level was significantly related to perceived risk only when risk was communicated categorically.
Most recently, Hilton and Helmus (2020) used a sample from MTurk to examine risk perception based on risk levels (high and low), the three quantitative risk communication metrics (percentiles, risk ratios, and absolute recidivism estimates), and whether a graph was included to assist in communicating the quantitative information. All three independent variables revealed an effect, and a three-way interaction was found. Risk ratios were associated with highest perceived risk and absolute recidivism estimates with the lowest. When graphs were provided, participants in the percentile and risk ratio condition tended to show more differentiation between higher and lower risk offenders (especially for percentiles). Inclusion of graphs tended to result in lower overall perceived risk, except for percentiles for a high-risk offender.
In sum, the above studies showed that the most consistent finding is that high-scoring offenders were perceived posing a higher risk than low-scoring offenders. Another common finding was that many participants did not appear to understand the risk ratio information when it communicated lower than average risk. The results pertaining to risk communication format are inconsistent, although most studies found an interaction between risk level and risk communication metric. Ideally, of course, there should not be an effect of communication format as always the same information is communicated. However, even if the formats are based on the same risk scores, each format has a unique quality to it. The interactions (and inconsistent main effects) above, however, suggest that how we communicate risk does matter. Based on these research findings, the Static-99R development team has indicated that reporting all risk communication metrics together may be the optimal approach in most circumstances (Helmus et al., 2021; see also www.saarna.org for more information/resources). Nevertheless, it is important to know what else impacts the understanding of risk as this may lead to new communication methods.
Individual Differences
Need for Cognition
Quantitative information should improve risk communication (Karelitz & Budescu, 2004), but it seems that this improvement depends on the ability to process quantitative information. In this regard, “risk illiteracy” is a common limitation of human reasoning (Garcia-Retamero & Cokely, 2013). Hilton et al. (2015) summarized lessons learned from non-forensic risk communication. Specifically, they pointed out that poor numeracy can limit risk communication. Less numerate participants seem to be particularly susceptible to misinterpret data that require more cognitive effort (Ancker et al., 2006; Ghazal et al., 2014). Specifically, less numerate people apply base rates, relative risks, and percentage information less effectively (Bodemer et al., 2014). Initial evidence (Liberali et al., 2012) suggests that lower numeracy performance is associated with having less motivation to think hard about difficult questions. This indicates that individual differences in cognitive motivation or cognitive investment may play a modulating role in risk perception. Probably the best-known construct that captures cognitive motivation and investment is the need for cognition, which was conceptualized as an individual’s “tendency to engage in and enjoy thinking” (Cacioppo & Petty, 1982, p. 116).
Individuals scoring high on need for cognition have been found to be highly intrinsically motivated to seek information (e.g., Das et al., 2003; Mokhtari et al., 2013) and to prefer complex cognitive tasks over simple ones (e.g., See et al., 2009). Moreover, there is evidence for more elaborated information processing. For example, when examining response behavior in intelligence tests, it was found that individuals with a higher need for cognition did not complete more tasks than individuals with lower scores, but of those tasks they completed, they answered more tasks correctly indicating that they put more cognitive effort into answering these tasks (Fleischhauer et al., 2010). Moreover, they were observed to be less prone to cognitive biases (Palmer & Feldman, 2005) or more likely to correct their judgements for perceived biases (e.g., Martin et al., 1990). As a consequence of their elaborate information processing, their decisions are more accurate (e.g., Carnevale et al., 2011; Levin et al., 2000) and rely more on relevant information (Dickhäuser et al., 2009). The conceptualization and behavioral correlates of need for cognition may indicate that the construct is negatively associated with risk perception as individuals who are more motivated to think deeply about given information may be more receptive to risk assessment results and less susceptible to the often observed tendency to overestimate the risk of sexual offenders (Kahneman, 2011; Mills et al., 2011). Moreover, due to their motivation to also elaborate on information that are principally harder to understand (i.e., risk ratio information) their risk perception should not differ regarding the communication format given in the vignette.
Attitudes Toward Sex Offenders
Because social rejection and negative views of people who have committed sex offenses are prevalent in society (King, 2016; Rydberg et al., 2018; Socia et al., 2019), specific attitudes toward these individuals might also affect risk perception. There is a punitive bias towards sex offenders, in that the perception of risk information is not solely a function of the information itself (i.e., “bottom-up” processing), but is also shaped by the qualities of the observer (i.e., “top-down” processing). In a vignette experiment of Scurich and Krauss (2013), participants who chose to detain the respondent deemed the assessment highly acceptable when it indicated a high level of risk, and relatively unacceptable when it indicated a low level of risk. Kwartner et al. (2006) found similar results with judges showing a tendency to devalue expert opinion indicating a low level of risk. This research shows that negative attitudes toward sex offenders (i.e., “top-down” processing) interfere with accurate interpretation of risk information, potentially leading to higher risk perception and less adequate discrimination of individuals with different risk levels.
Authoritarianism
Authoritarianism (Beierlein et al., 2014) denotes a psychological disposition characterized by extreme conservatism as well as aggression and negative attitudes towards individuals and groups that are perceived as deviant (e.g., people who committed a sexual offense). People who score high on authoritarianism seem to rely on harsher sentencing strategies for high severity crimes, such as sex offenses (Ryckman et al., 1986). Also, people scoring high on vengeance/punitiveness seem more likely to make commitment decisions in sexually violent predator trials (Dover et al., 2012). In the study by Krauss et al. (2018), vengeance-sentencing attitudes (e.g., “in deciding a criminal case, all convicted sexual offenders should be chemically castrated”) made a significant contribution to the prediction of commitment decision.
The Current Study
The current study adapts and extends the study by Varela et al. (2014), comparing the influence of three Static-99R risk communication formats (i.e., categorical, absolute probability estimate, and risk ratio) and the risk level (high vs. low) on venirepersons’ perceptions of sexual offenders. We used the same vignette as Varela et al. (2014) but made three conceptual changes to the study materials. The first difference refers to the experimental variation of risk level. While Varela et al. (2014) manipulated high versus low-risk by using Static-99R scores of 1 and 6, we tried to make the difference between the risk levels more salient and used scores of −2 and 6. As Static-99R scores have a range of −3 to 12, we thus used almost the lower bound for the very low-risk category, which also has a negative sign. The second difference refers to the norms used. For the current study, we used updated norms for routine samples from Phenix et al., 2016b, whereas Varela et al. (2014) used older norms from preselected high risk/needs samples (Phenix et al., 2009). We chose the routine norms because the case did not include information to justify the high risk/need normative data, as per the developers’ recommendations (Hanson et al., 2016). The third difference relates to the sample used. While Varela et al. (2014) included community members reporting for jury duty, we used a population-wide sample. To establish a more comprehensive model of risk perception, we also included the above discussed individual variables need for cognition, attitudes toward sex offenders, and authoritarianism.
In Part I the current study will investigate the effects of risk level and communication format. Based on previous research (Table 1) we expected that actuarially higher risk cases would be perceived as higher risk than lower risk cases (Hypothesis 1). Additionally, an interaction between risk level and risk communication format was expected insofar as that the difference in risk perception between low-risk and high-risk individuals should be largest for the categorical format (Hypothesis 2), while there is little evidence for a main effect of communication format.
In Part II we will look at the influence of individual and personality factors on risk perception. With respect to personality, we expected that higher need for cognition is associated with lower risk perception (Hypothesis 3), whereas higher negative attitudes towards sexual offenders (Hypothesis 4) as well as higher authoritarianism (Hypothesis 5) are associated with higher risk perception. In addition, we examined the role of personality as a moderator. We expected that “need for cognition” would moderate the effect of communication format on risk perception insofar that risk perception might be higher for the categorical than for the absolute communication format among individuals low in NFC because they are less likely to elaborate on given information whereas for individuals scoring high on NFC no such difference should occur. For negative attitudes and authoritarianism, an interaction with risk level was expected, in that participants with higher scores would be less likely to discriminate between low and high-risk individuals.
Method
In the methods section, we report how we determined our sample size, all data exclusions, all manipulations, and all measures in the study, from the 21 Word Solution (Simmons et al., 2012).
Participants
The statistical power to detect an expected population effect should be as large as possible but at the same time economically realistic. High-powered studies should set alpha and beta errors equal (5%) to be able to detect the expected population effect with a high probability of 95% (e.g., Open Science Collaboration, 2012; Simonsohn, 2015). For the interaction effect (Hypothesis 2), which is hardest to detect, a power analysis using G*Power (Faul et al., 2007) revealed a minimal sample size of N = 251, given a medium sized population effect. Despite all the effort in participant recruitment, only 166 subjects were included in the data analysis for the study (see below), which corresponds to a post hoc power of 82% for the detection of the interaction effect and a post hoc power of 89% for the detection of the main effect of risk level. The post hoc power of all regression analyses (Hypotheses 3–5) was always above 95% with this sample size.
Participants were recruited online via social media platforms (Facebook, Instagram). Also, the study link was distributed within the lead author’s university via E-Mail. The recruitment material included brief information about the general conditions as well as the content of the study, estimated completion time (15–20 minutes), data handling and privacy. Participants had to give informed consent form before starting the survey. Recruitment was open for 35 days. In sum the response rate was 64.07% (based on the number of people who clicked open the informed consent). Our initial sample comprised 173 adult community members. Of those participants, we excluded seven who failed a validity check (described below), resulting in a final sample of 166 participants. Their average age was 34.26 years (SD = 11.86). The majority (68.1%) of participants were women. The sample had the following educational breakdown: 48.8% were university students or had a university degree (bachelors, masters), 22.9% had professional education, 16.3% completed abitur, which is a German school certificate similar to U.S. high school, 10.8% have less education than abitur, and 1.2% provided no answer. Thirteen participants interrupted the survey and finished it later. On average the study took 21.79 minutes with a range from 4.28 to 98.7 minutes for those participants, who completed it without interruption.
The study was conducted in accordance with ethical guidelines of the German Psychological Society (Ethische Richtlinien der Deutschen Gesellschaft für Psychologie e.V. und des Berufsverbands Deutscher Psychologinnen und Psychologen e.V., https://www.dgps.de/aktuelles/details/ethische-prinzipien-psychologischer-forschung/), which is a German adaptation of the “Ethical Principles of Psychologists and Code of Conduct” (American Psychological Association, 2002, p. 1060–1073; standards 3.10 and 8.01–8.15). As per ethical guidelines in Germany where the study was conducted, ethics review board approval was not required for this truly voluntary research with non-vulnerable groups. All procedures performed within this research were in accordance with the ethical standards of the 1964 Helsinki Declaration and its later amendments or comparable ethical standards.
Measures of Need for Cognition, Attitudes Toward Sex Offenders, and Authoritarianism
First, we assessed need for cognition, attitudes toward offenders, and authoritarianism. The current study applied a German translation of the need for cognition scale, originally presented by Cacioppo and Petty (1982). Similar to the original scale, the German 16 item short-version (Bless et al., 1994) allows an efficient assessment of individuals' tendency to engage in and enjoy thinking and investigates dispositional differences in the intensity of cognitive processing. The scale contains items like “I would rather do something that requires little thought than something that is sure to challenge my thinking abilities” (inversely coded). Responses to each item were recorded on a 7-point Likert scale (anchored at −3 and 3) and averaged for the analyses, with higher scores indicating higher need for cognition. The need for cognition scale demonstrated very good internal consistency in the current study (Cronbach`s α = .88).
Participants completed the Attitudes Towards Sex offenders (ATS-21) measure (Hogue & Harper, 2019) to assess their attitudes toward people convicted of sexual offenses. The ATS-21 was translated to German by the authors of this study following a team approach (Behr et al., 2015). First, two authors translated the measure separately. Translations were reviewed followed by the adjudication of the final version. The scale contains 21 statements (e.g., “I think I would like a lot of sex offenders”), each of which are rated using a five-point Likert scale ranging from 0 (strongly disagree) to 4 (strongly agree), resulting in a sum score with a range from 0 to 84. Higher scores indicate more positive attitudes. The ATS-21 demonstrated excellent internal consistency in the current sample (Cronbach`s α = .92).
Authoritarianism was measured using the nine-item German version (KSA-3; Beierlein et al., 2014) of Altemeyer’s authoritarianism scale (Altemeyer, 1996). The nine indicators of authoritarianism (e.g., “We need a strong leader in order to live in a safe society”) were phrased such that high scores (or agreement with their statements) were associated with a higher degree of authoritarianism. KSA-3 items were scored on a five-point Likert scale from 1 (strongly disagree) to 5 (strongly agree) and their mean was used in the analyses (Cronbach`s α = .78).
Sexual Offense Risk Assessment Case
As the current study was designed as an adaptation and modification of the study by Varela et al. (2014), we included the same sexual offense risk assessment case, translated into German by the study authors. In line with Varela et al. (2014), the first paragraph explained that special laws guide the management of people convicted of sexual offenses who are released from prison (this paragraph was adjusted to the German criminal code). The second and third paragraphs provided a nontechnical description of Static-99R (see Appendix in Varela et al., 2014 for detailed information).
Experimental Manipulation
In line with Varela et al. (2014), we randomly assigned participants to conditions based on a 2 (risk level) by 3 (risk communication format) between-subjects design. Following Varela et al. (2014), the three risk communication formats were categorical, risk ratio, and absolute probability estimate. However, the modifications of using updated norms, norms for routine samples, and a low-risk condition of −2 points influenced the case example for some conditions. In the categorical conditions, the offender’s risk was communicated in the following manner: “According to the Static-99R developers, Mr X’s score of −2 (or 6) places him in the Low (or High) risk category for being charged with another sexual offense.” In the risk ratio conditions, the case description reported the Static-99R score and the offender’s risk was described as “one fourths the recidivism rate of the typical sex offender” for the low-score condition and “3.77 times the recidivism rate of the typical sex offender” for the high-score condition. In the risk probability conditions, the case description read “in the Static-99R research sample, 1.3% (or 20.5%) of men who scored −2 (or 6) on the Static-99R (like Mr X.) were rearrested for a sexual offense within 5 years.”
Dependent Variables
We used the same dependent variables as Varela et al. (2014). After reading the case description and Static-99R results, participants were asked to make three ratings related to the hypothetical offender: likelihood of committing a new sexual offense in the next 5 years, dangerousness to community members, and support for the use of the “strictest and most expensive supervision strategies.” They rated each of these items on a scale ranging from 1 (not likely at all/not at all dangerous) to 6 (very likely/very dangerous). Based on previous research examining jurors’ perceptions of offender risk (e.g., Boccaccini et al., 2008), we expected that ratings of the first two items would be highly correlated and that we would combine them to form a single risk composite variable (see below).
We also asked participants to make two dichotomous decisions regarding the hypothetical offender’s risk. The first question asked participants to report whether they believed the offender was less likely or more likely than most offenders to commit a new offense. We included this item to help examine whether participants understood relative risk ratio messages. Those in the high-score condition who read a risk ratio message should report that the offender is more likely than others to reoffend, whereas those in the low-score condition who read a risk ratio message should report that the offender is less likely than other offenders to reoffend. The second question asked participants to report whether they believed that the offender would or would not commit a new sex offense in the next 5 years.
Participants then rated the importance of the Static-99R results using a 6-point scale, ranging from 1 (not at all important) to 6 (very important) before they finally answered a question asking them to indicate whether the Static-99R results were easy to understand or difficult to understand.
Data Analysis
Dichotomous dependent variables were analyzed by logistic regression analyses in JASP and SPSS using the Wald test to infer statistical significance. Odds ratios (and 95% confidence intervals) are reported as effect sizes. Continuous dependent variables were analyzed by analyses of variance in SPSS. Cohen’s d or η2 are reported as effect sizes. Cohen’s d values of .20, .50, and .80 and η2 values of .01, .06, and .14 were considered small, moderate, and large effect sizes (Cohen, 1992). There were no outliers, and the variance in all conditions was homogeneous. The hierarchical regression analyses were run in SPSS. Models are compared by F-tests, and the difference between models is quantified by ΔR2. All variables were normally distributed, and all relationships between the predictor variables and the outcome were sufficiently linear (as observed from the Loess lines). Like in Varela et al. (2014), Alpha was set to 5% to infer statistical significance.
Results
Part I – The Effects of Risk Level and Communication Format
Intercorrelations (Pearson r and p Values) Among Dependent Variables.

Original Study’s and Present Study’s Effect Sizes for the Continuous Dependent Variables.
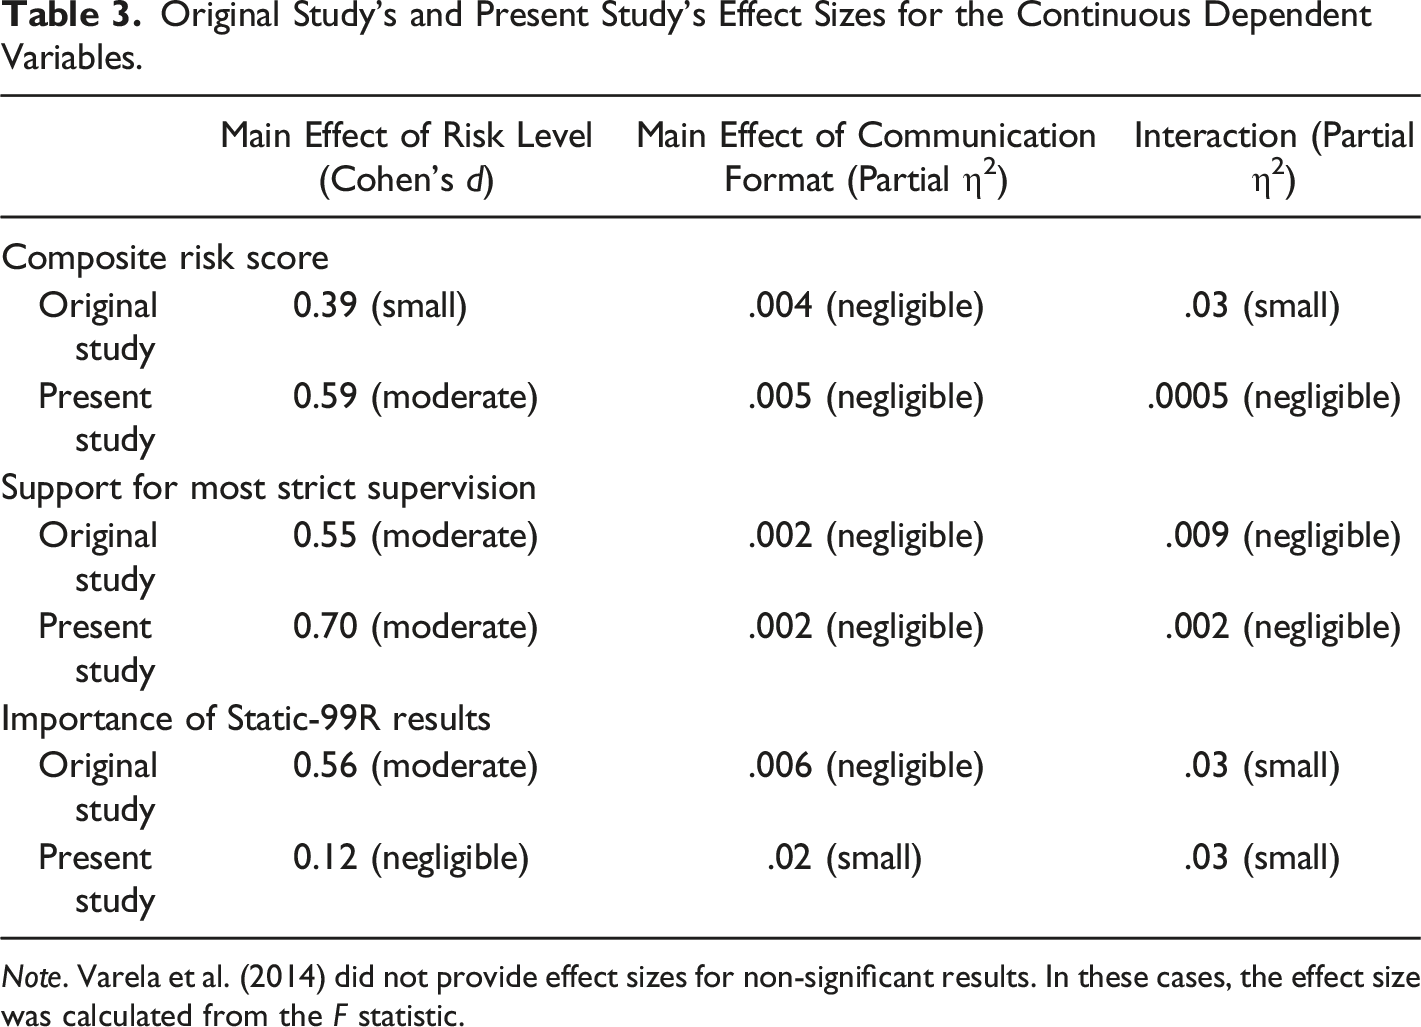
Note. Varela et al. (2014) did not provide effect sizes for non-significant results. In these cases, the effect size was calculated from the F statistic.
Perception of Risk
Reoffense in the Next Five Years
Varela et al. (2014) reported that 95% of their participants indicated that the individual would commit a new sex offense in the next 5 years, and so they were not able to compare the responses across the conditions. In the present sample, only 74.1% of participants deemed a reoffense likely. Thus, we were able to run a logistic regression analysis to compare the responses across the conditions. The regression model was significant, χ2 = 14.33, p = .014, Nagelkerke R
2
= .12. There was a main effect for risk level, b = 0.71, W = 12.35, p < .001. Participants in the high-risk condition deemed a reoffense more likely than participants in the low-risk condition, OR = 2.02, 95% CI [1.37, 3.00]. Communication format (categorical vs. absolute: OR = 1.07, and risk ratio vs. absolute: 0.81) and the interaction between risk level and communication format (high-risk and categorical: OR = 1.07, and high-risk and risk ratio: 0.81) had no significant effect on the reoffense responses (see also Figure 1). Percent of participants in each risk level and communication format condition indicating that a reoffense in the next 5 years is likely.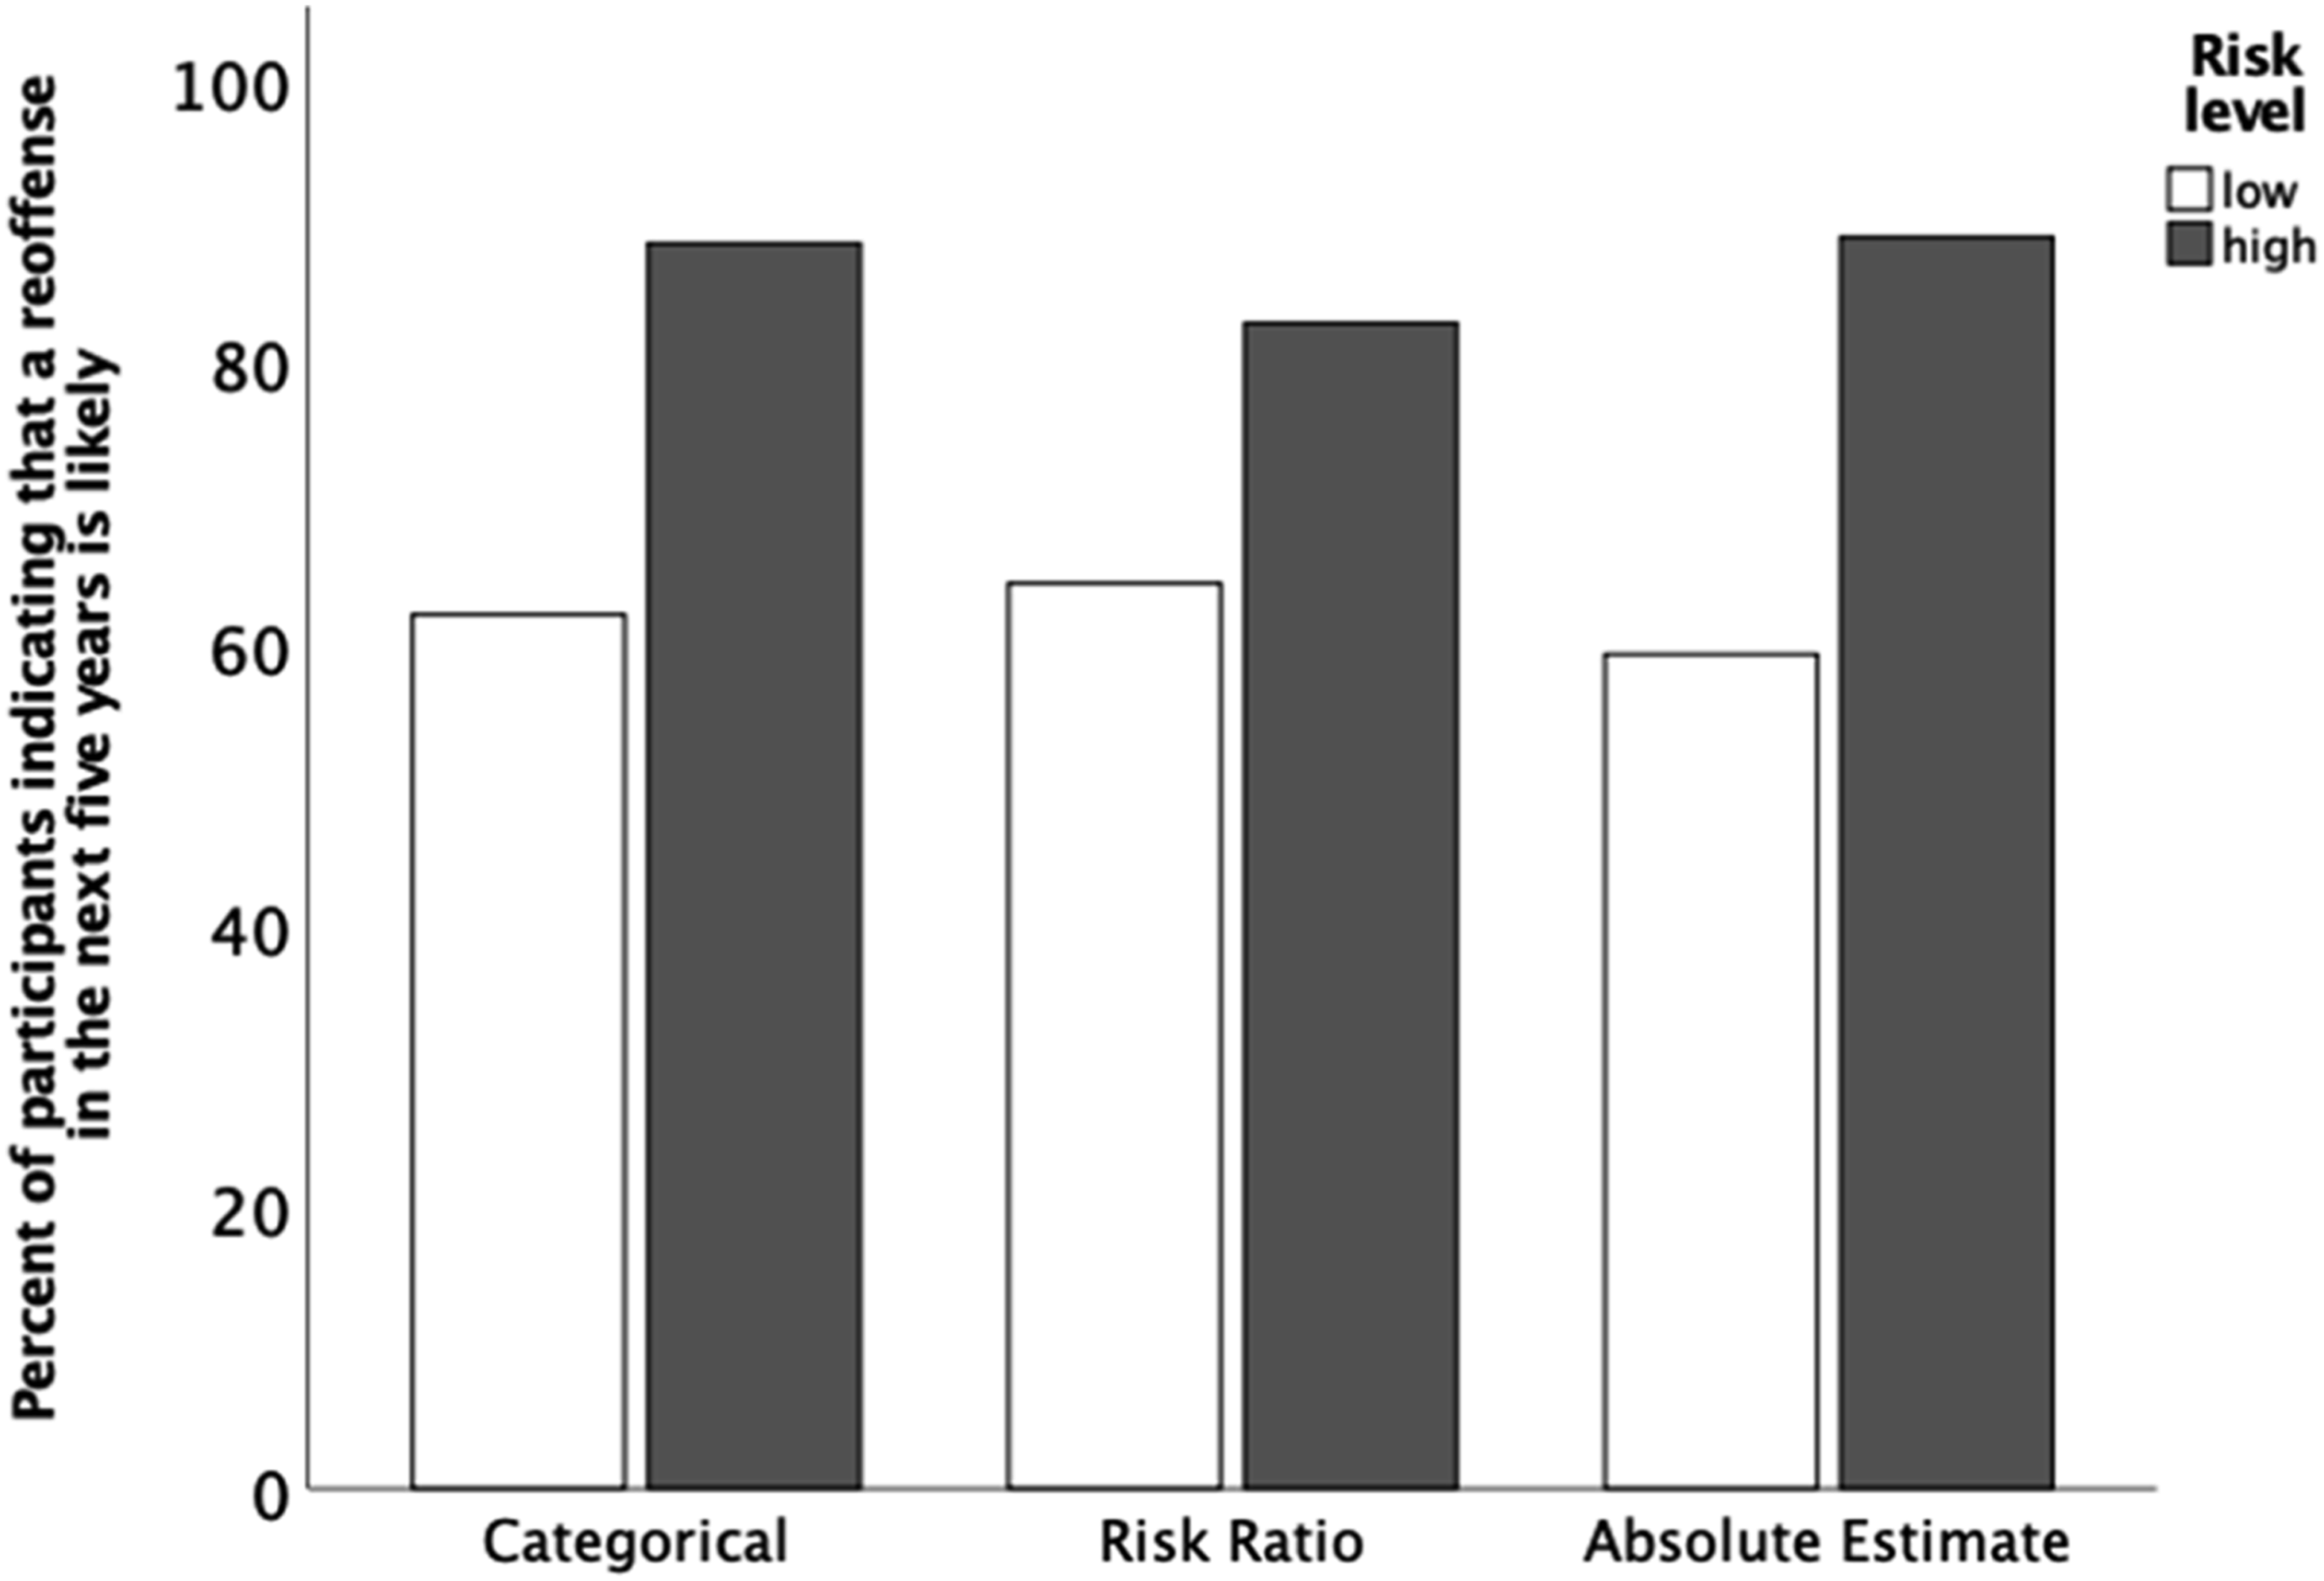
Risk Composite Ratings
We used a 2 × 3 between groups analysis of variance (ANOVA) to examine the effect of risk level and communication format on participants’ risk composite ratings (see also Figure 2). There was a medium-sized significant main effect for risk level, F (1,160) = 14.39, p < .001, d = 0.59, 95% CI [0.28, 0.90]. There was no main effect for communication format, F (2,169) = 0.44, p = .647, partial η
2
= .005, and no interaction effect, F (2,160) = 0.04, p = .960, partial η
2
= .0005. In sum, these findings indicate that participants viewed offenders as significantly more dangerous when they got the information that the risk level was high, whereas the communication format had no effect. In contrast to the original study, the effect of risk level did not depend on the communication format. Means (and 95% CI) for the risk composite score across study conditions.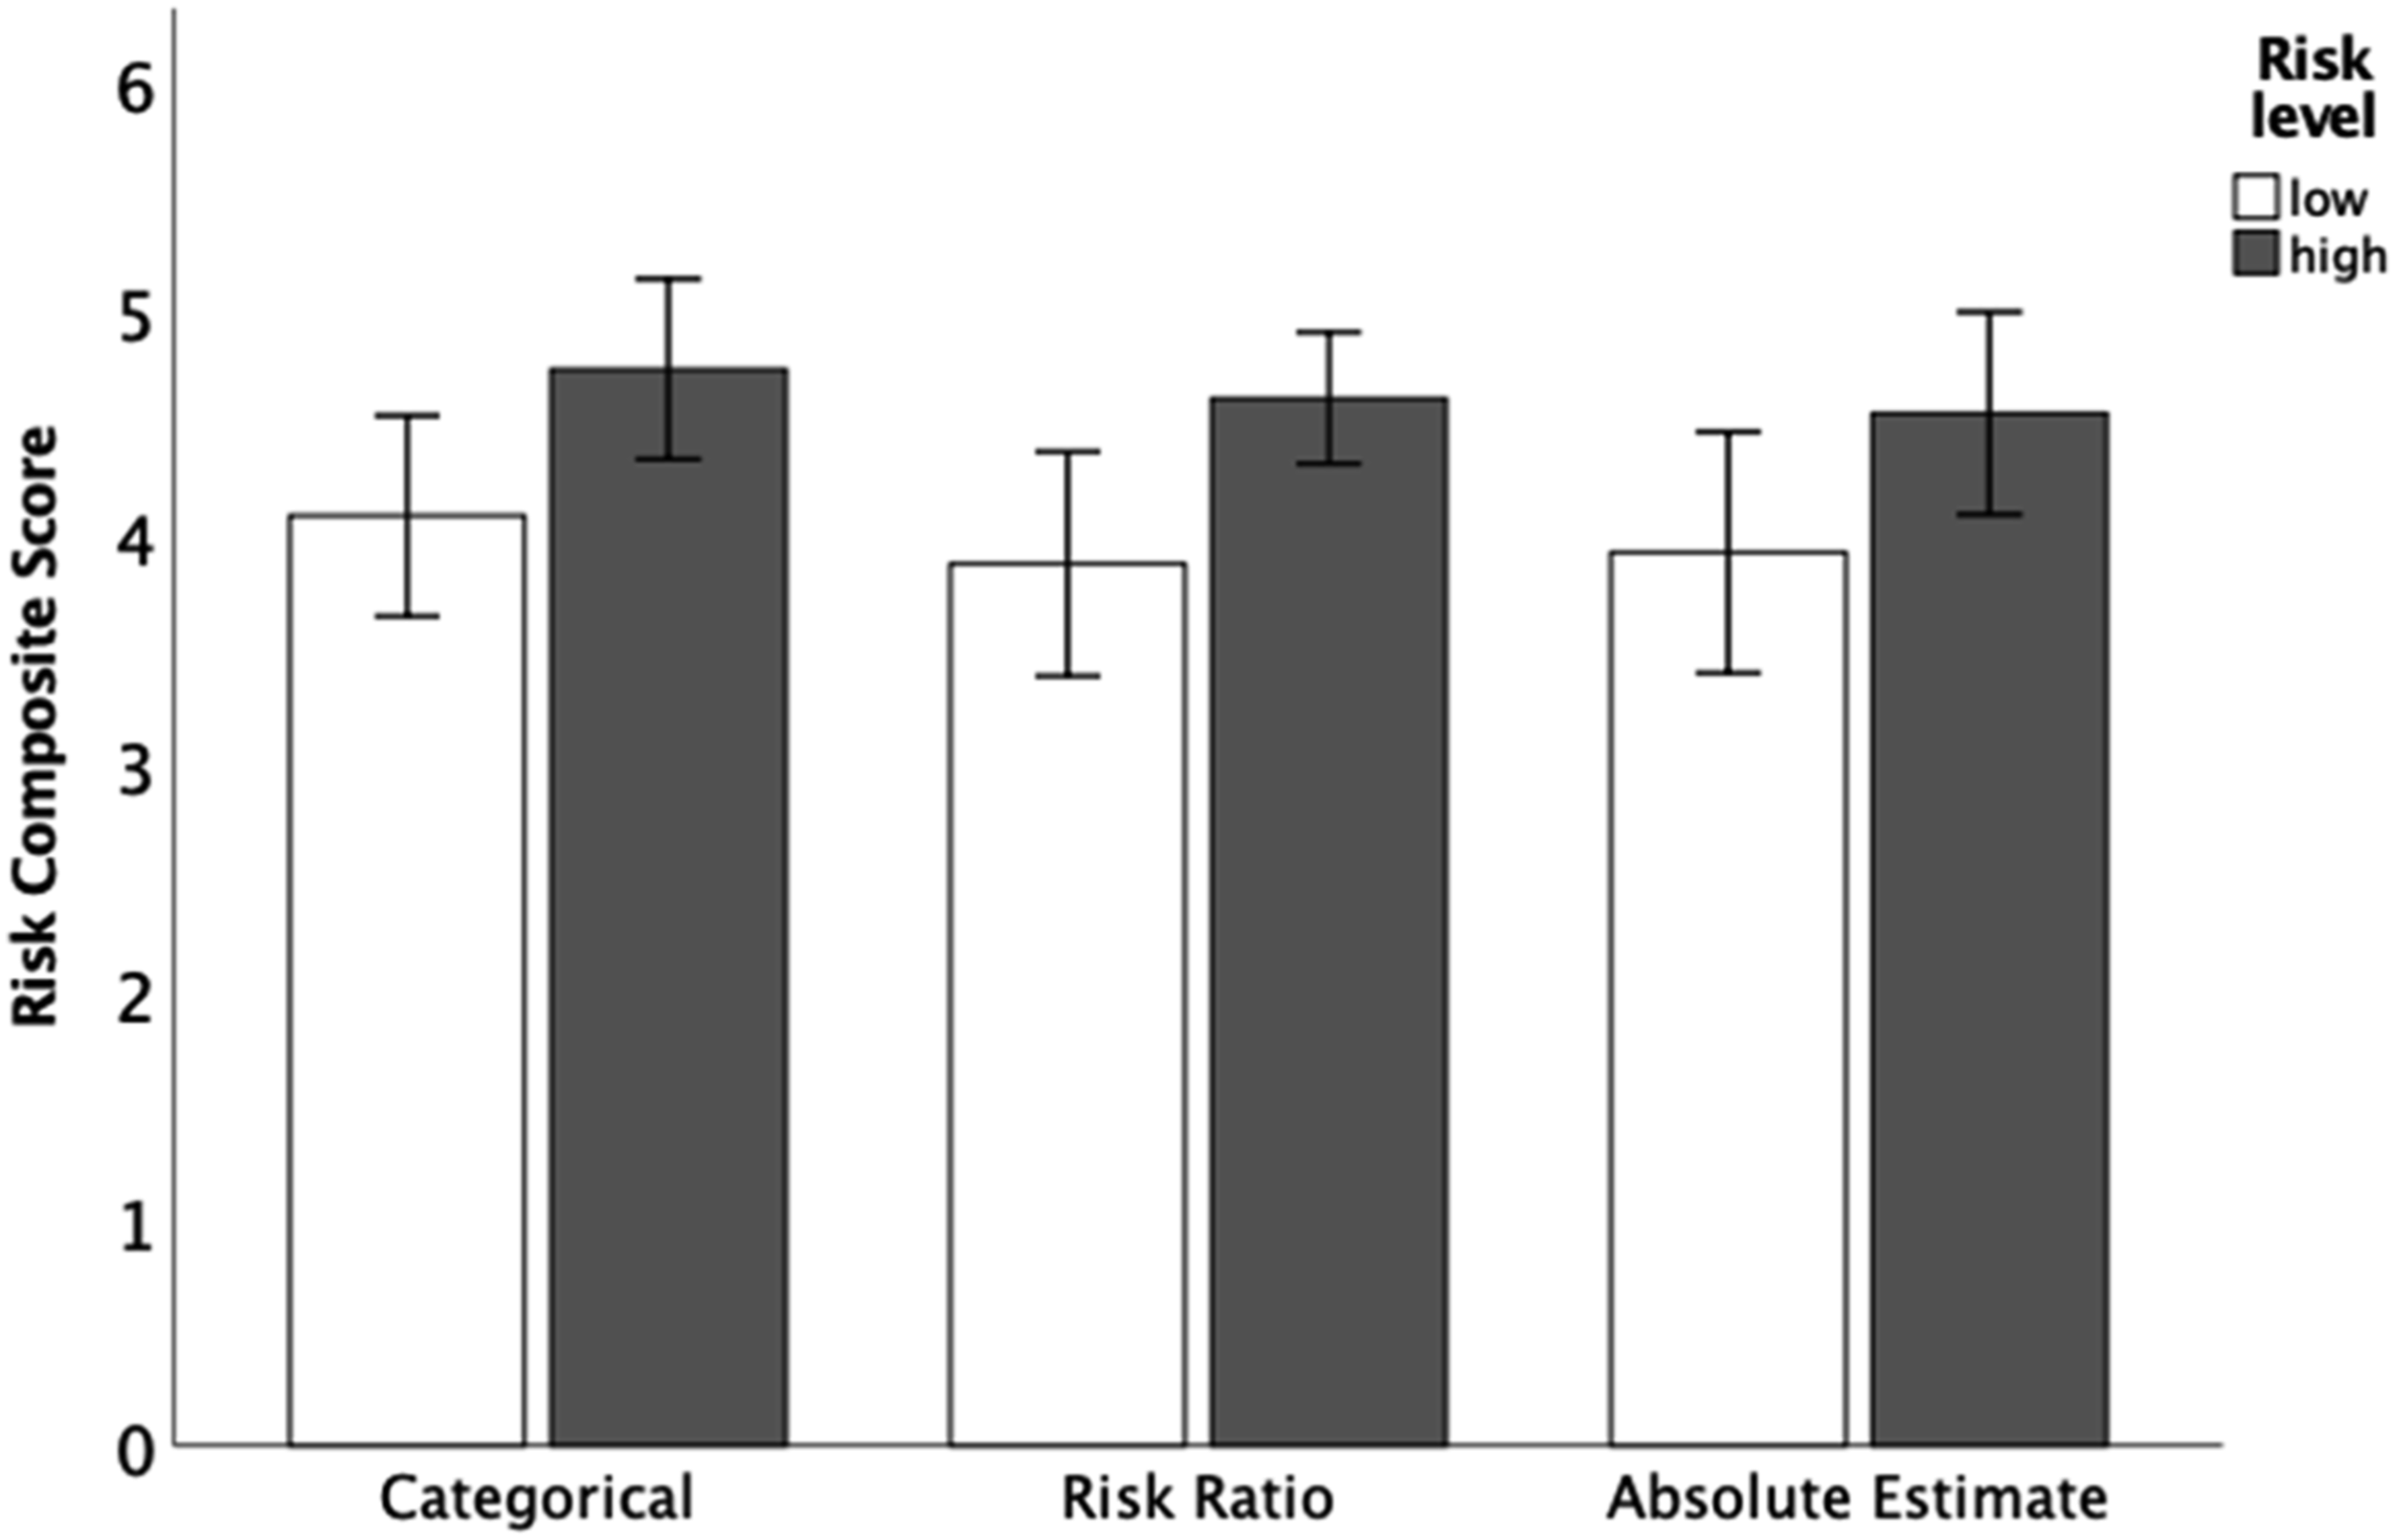
Support for Most Strict and Expensive Supervision Strategies
An ANOVA revealed a medium-sized main effect for risk level, F (1,160) = 19.97, p < .001, d = 0.70, 95% CI [0.38, 1.01], indicating that participants that were presented a high Static-99R score reported more support for strict and expensive supervision strategies. There was no main effect for communication format, F (2,169) = 0.17, p = .842, partial η2 = .002, and no interaction effect, F (2,160) = 0.15, p = .864, partial η2 = .002 (see also Figure 3). In sum, these findings indicate that risk level has a significant impact on how much participants support the strictest and most expensive supervision, independent of the communication format. Means (and 95% CI) for the support for the strictest and most expensive supervision strategies across study conditions.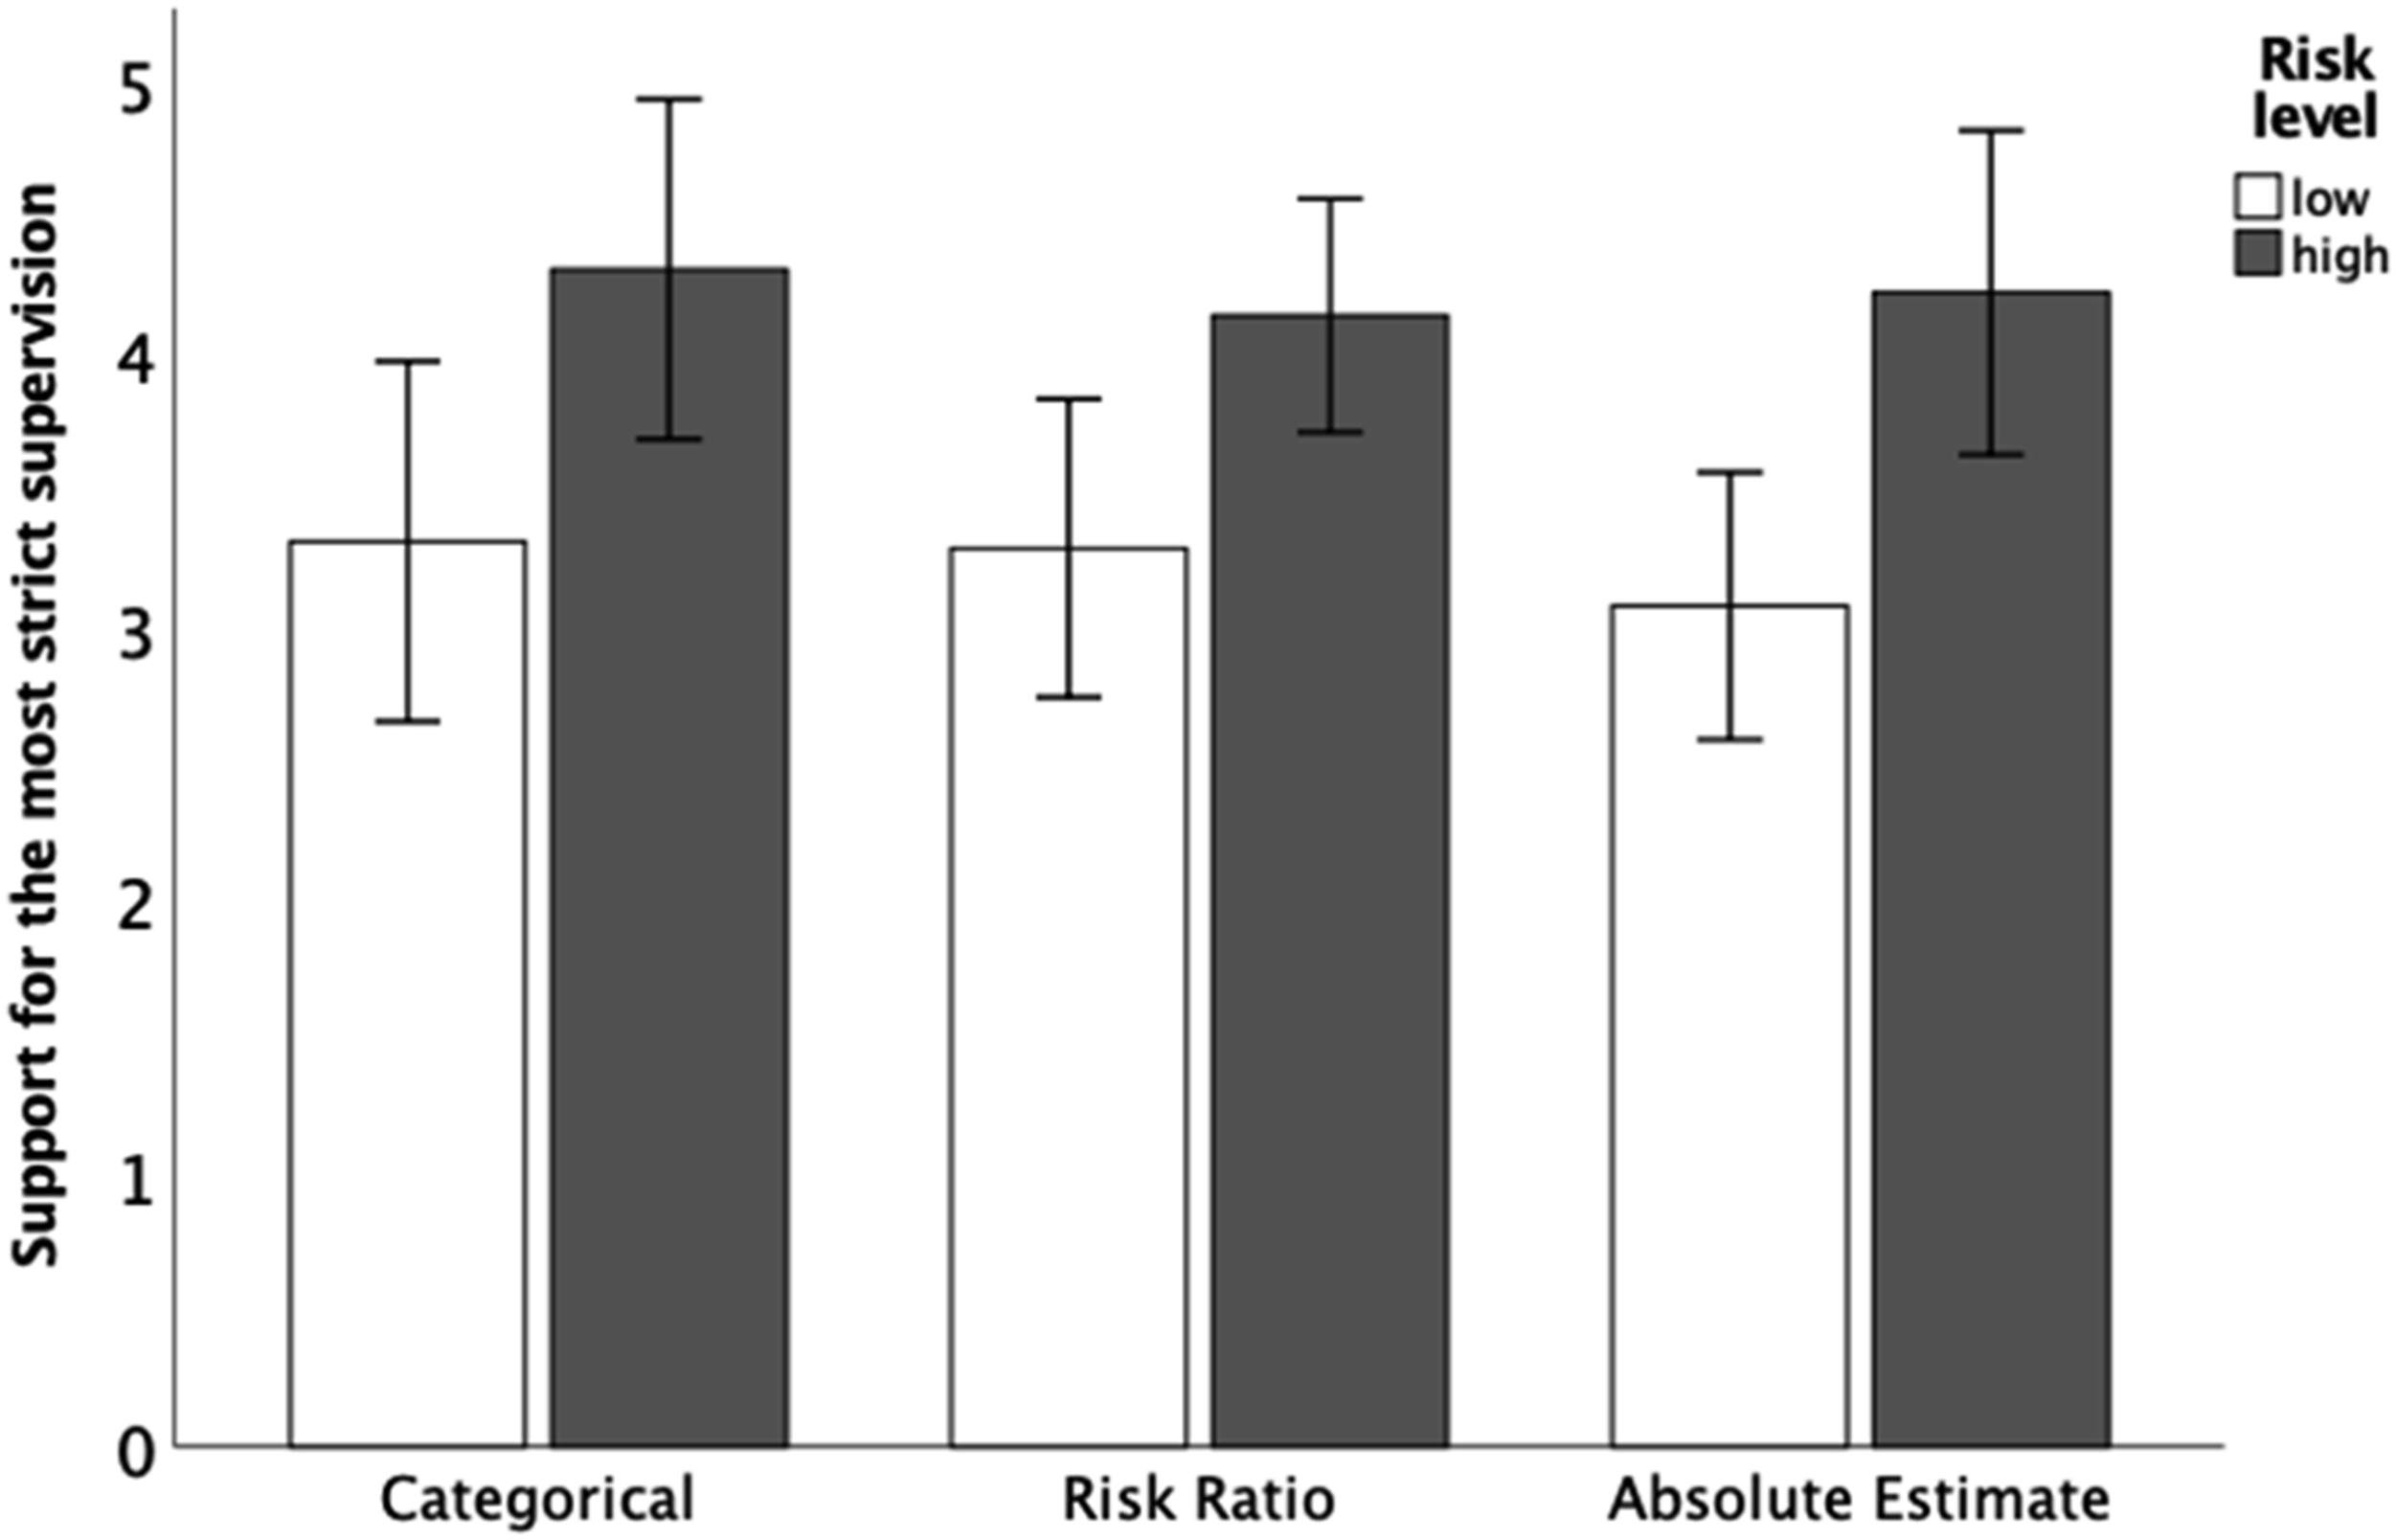
Likelihood of Reoffending Compared with Other Offenders
Overall, 59% of participants indicated that a reoffense was more likely compared to most offenders (compared to 80% in Varela et al., 2014). The logistic regression analysis was significant, χ2 = 22.03, p < .001, Nagelkerke R
2
= .17, and revealed that participants’ ratings were significantly influenced by the risk level, b = 0.69, W = 15.06, p < .001. Participants in the high-risk condition more often (74%) expected the offender to be more likely to reoffend compared with other offenders than participants in the low-risk condition (44%), OR = 1.99, 95% CI [1.42, 2.81]. Communication format (categorical vs. absolute: OR = 1.13, and risk ratio vs. absolute: 1.29) and the interaction between risk level and communication format (high-risk and categorical: OR = 0.95, and high-risk and risk ratio: 1.56) had no effect on the ratings, after controlling for risk level (see Figure 4). Percent of participants in each risk level and communication format condition indicating that the offender was more likely to reoffend than the typical offender.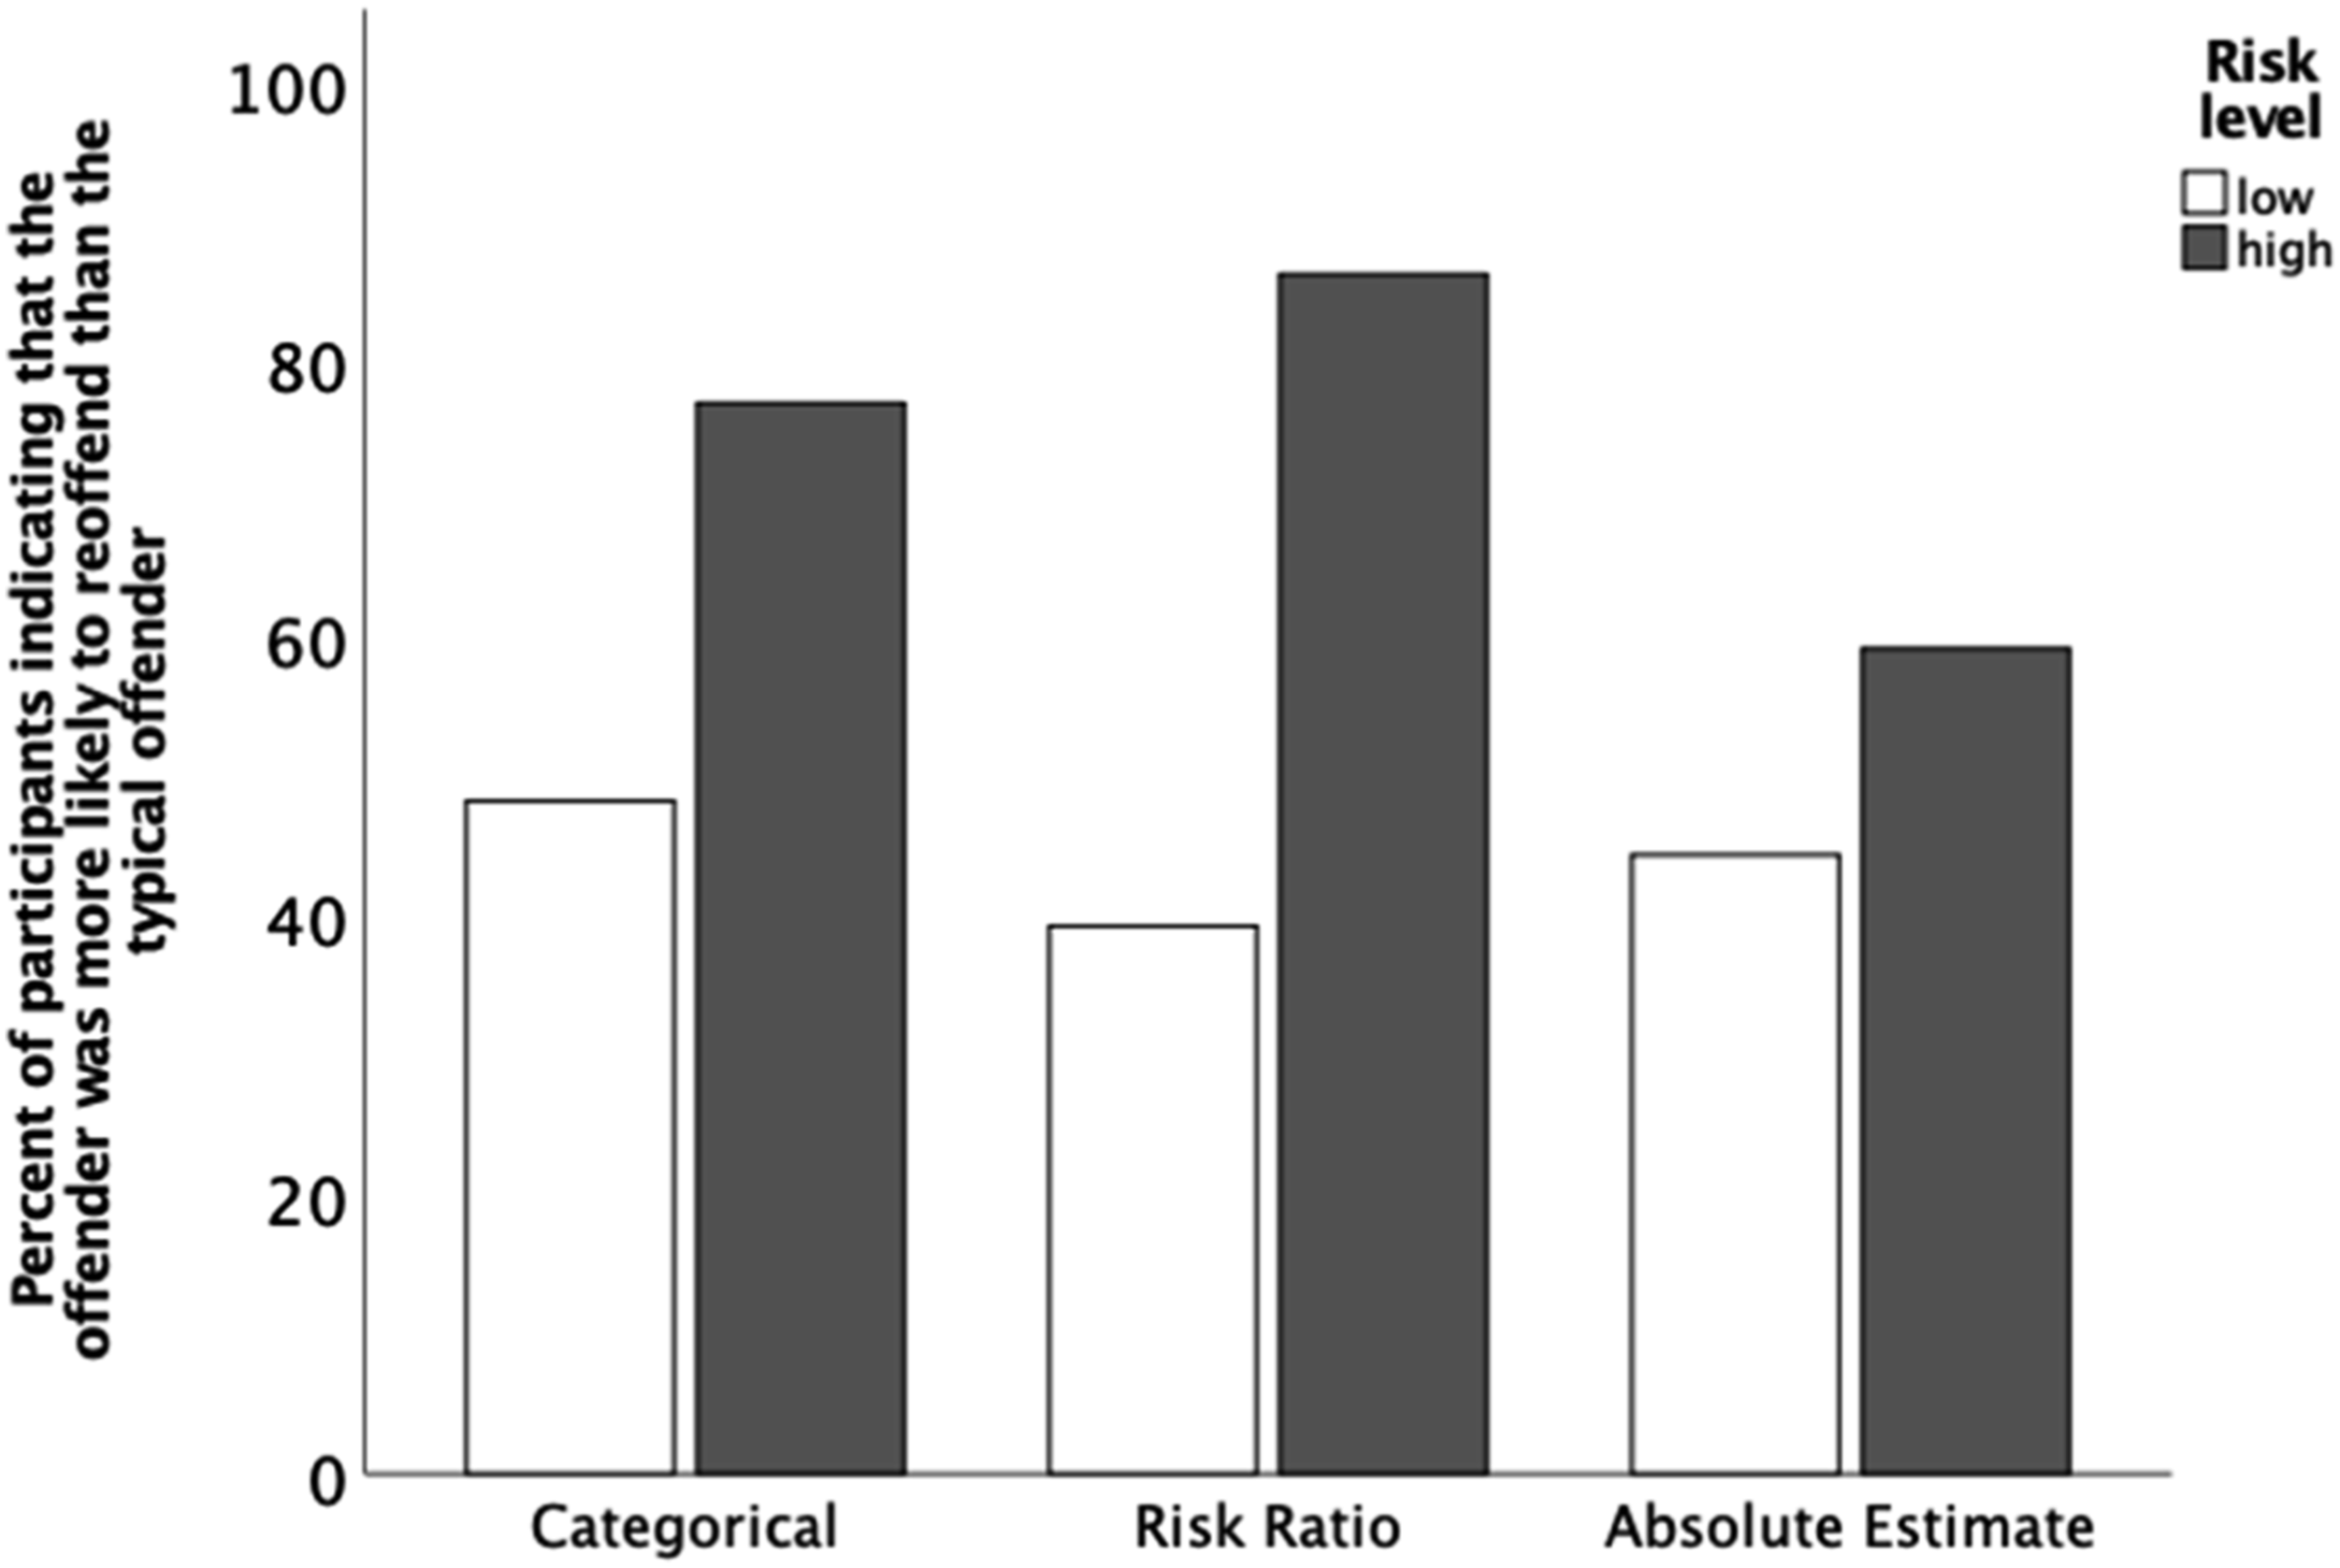
Varela et al. (2014) were specifically interested in the differences in the estimated likelihood of reoffending (yes/no) between low and high-risk offenders. They expected that within the risk ratio communication condition, the low-risk information would lead to significantly lower ratings for the likelihood of reoffending than the high-risk information. Yet, the effect was very small and non-significant (80% vs. 85%). We ran the same analysis with our data and obtained a significant difference between the two risk level conditions, b = 1.13, W = 11.70, p < .001. Participants who read about a low-risk (approximately one fourth that of the typical offender) were less likely (31% vs. 69%) to indicate that the person will reoffend compared with other offenders than participants who read about a high-risk (3.77 times the recidivism rate of the typical offender), OR = 3.11, 95% CI [1.62, 5.95].
Perception of the Static-99R
Importance of the Static-99R Results
The ANOVA revealed a non-significant effect for risk level, F (1,160) = 0.57, p = .452, d = 0.12, 95% CI [-0.18, 0.43], a small, non-significant effect for communication format, F (2,160) = 1.56, p = .214, partial η2 = .02, and a small, non-significant effect for the interaction between risk level and communication format, F (2,160) = 2.25, p = .108, partial η2 = .03. Thus, contrary to the original results, in the present study, neither the risk level, nor the communication format, nor the interaction thereof had a significant effect on the perceived importance of the Static-99R results. Though, in line with Varela et al.’s (2014) expectation, the small interaction effect indicates that the high-risk information was indeed rated as more important when it was provided in a categorical format (d = 0.57; see Figure 5). Means (and 95% CI) for the importance of the Static-99R results across study conditions.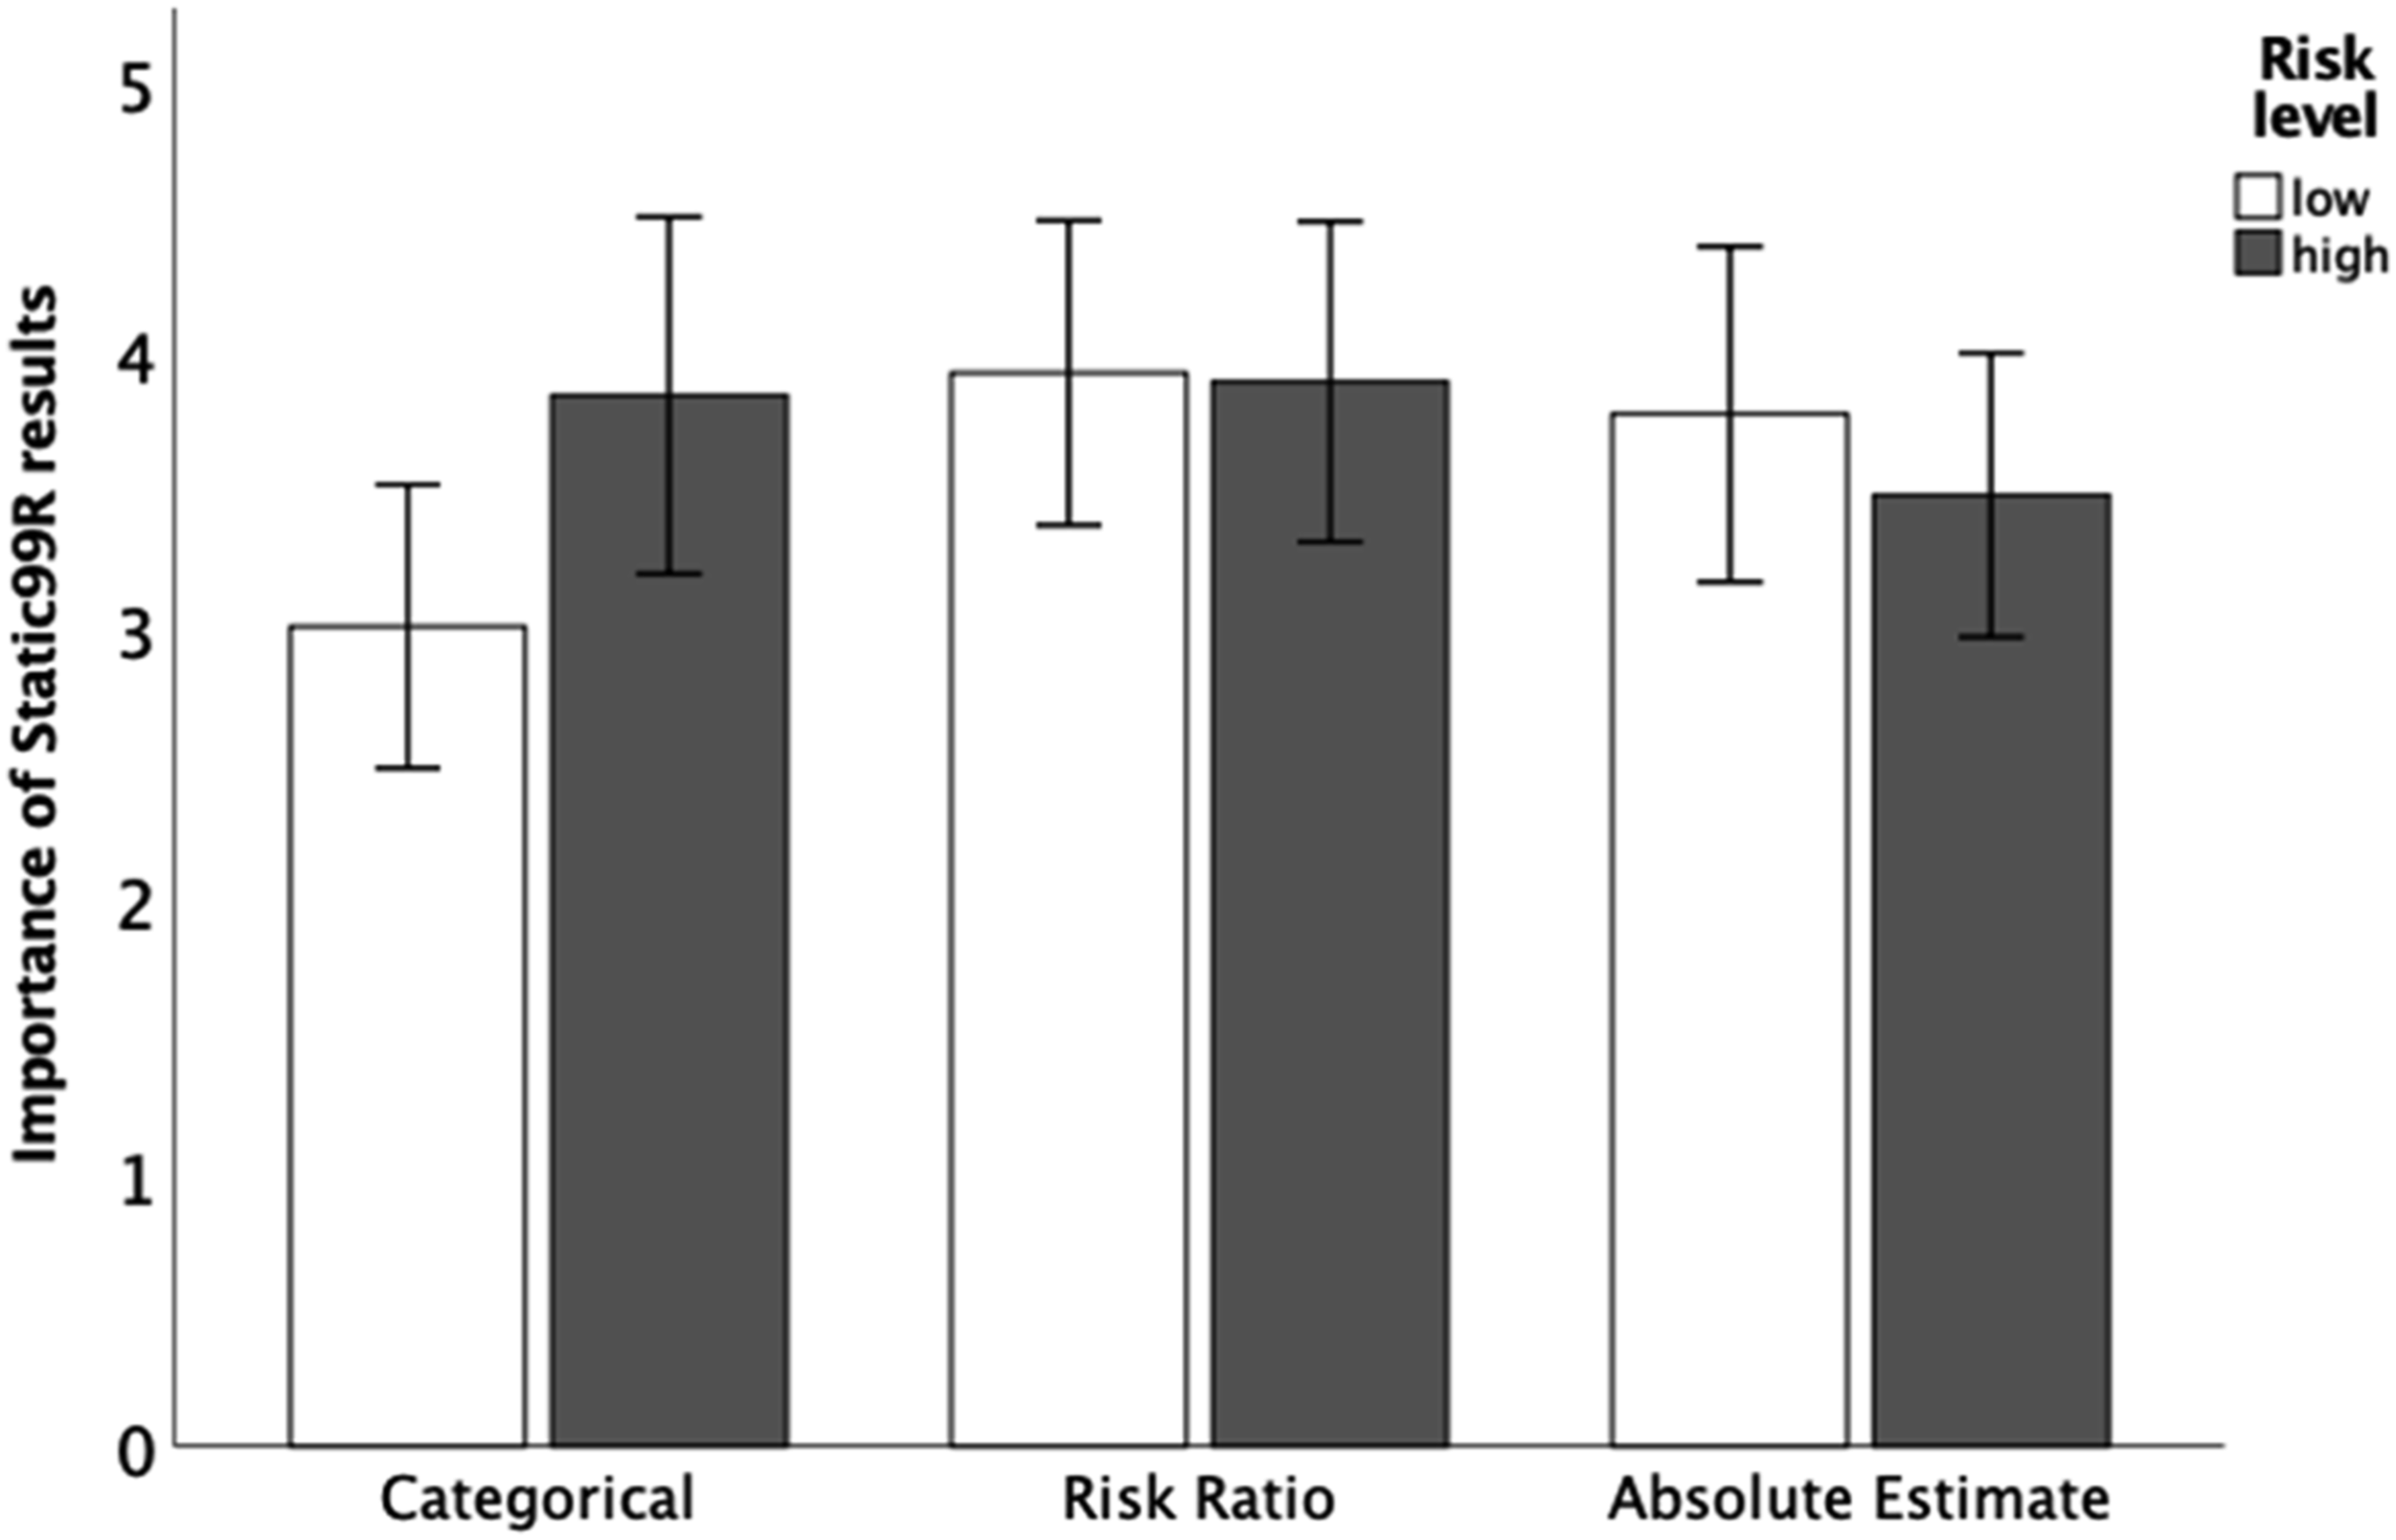
Ease of Understanding the Static-99R Results
Varela et al. (2014) found a significant main effect for communication format and a significant interaction effect. Participants who were presented a low-risk level were more likely to report that the Static-99R results were difficult to understand in both the categorical and the risk ratio communication format condition while this pattern was reversed in the absolute communication format condition. We found different results. The logistic regression model was not significant, χ2 = 8.58, p = .127, Nagelkerke R
2
= .07. There was no significant main effect for communication format (categorical vs. absolute: OR = 0.95, and risk ratio vs. absolute: 0.93), but a significant main effect for risk level, b = 0.37, W = 4.14, p = .042. Participants in the low-risk level condition found it more difficult than participants in the high-risk level condition to understand the Static-99R results, OR = 1.44, 95% CI [1.01, 2.05]. Although the interaction between risk level and communication format was not significant (high-risk and categorical: OR = 1.57, and high-risk and risk ratio: 0.92) there was a clear tendency that participants more often indicated that the Static-99R results were difficult to understand in the low-risk condition than in the high-risk condition when they were confronted with the categorical communication format, but not when they were confronted with the risk ratio or absolute communication format (see Figure 6). Percent of participants in each risk level and communication format condition indicating that the Static-99R results were difficult to understand.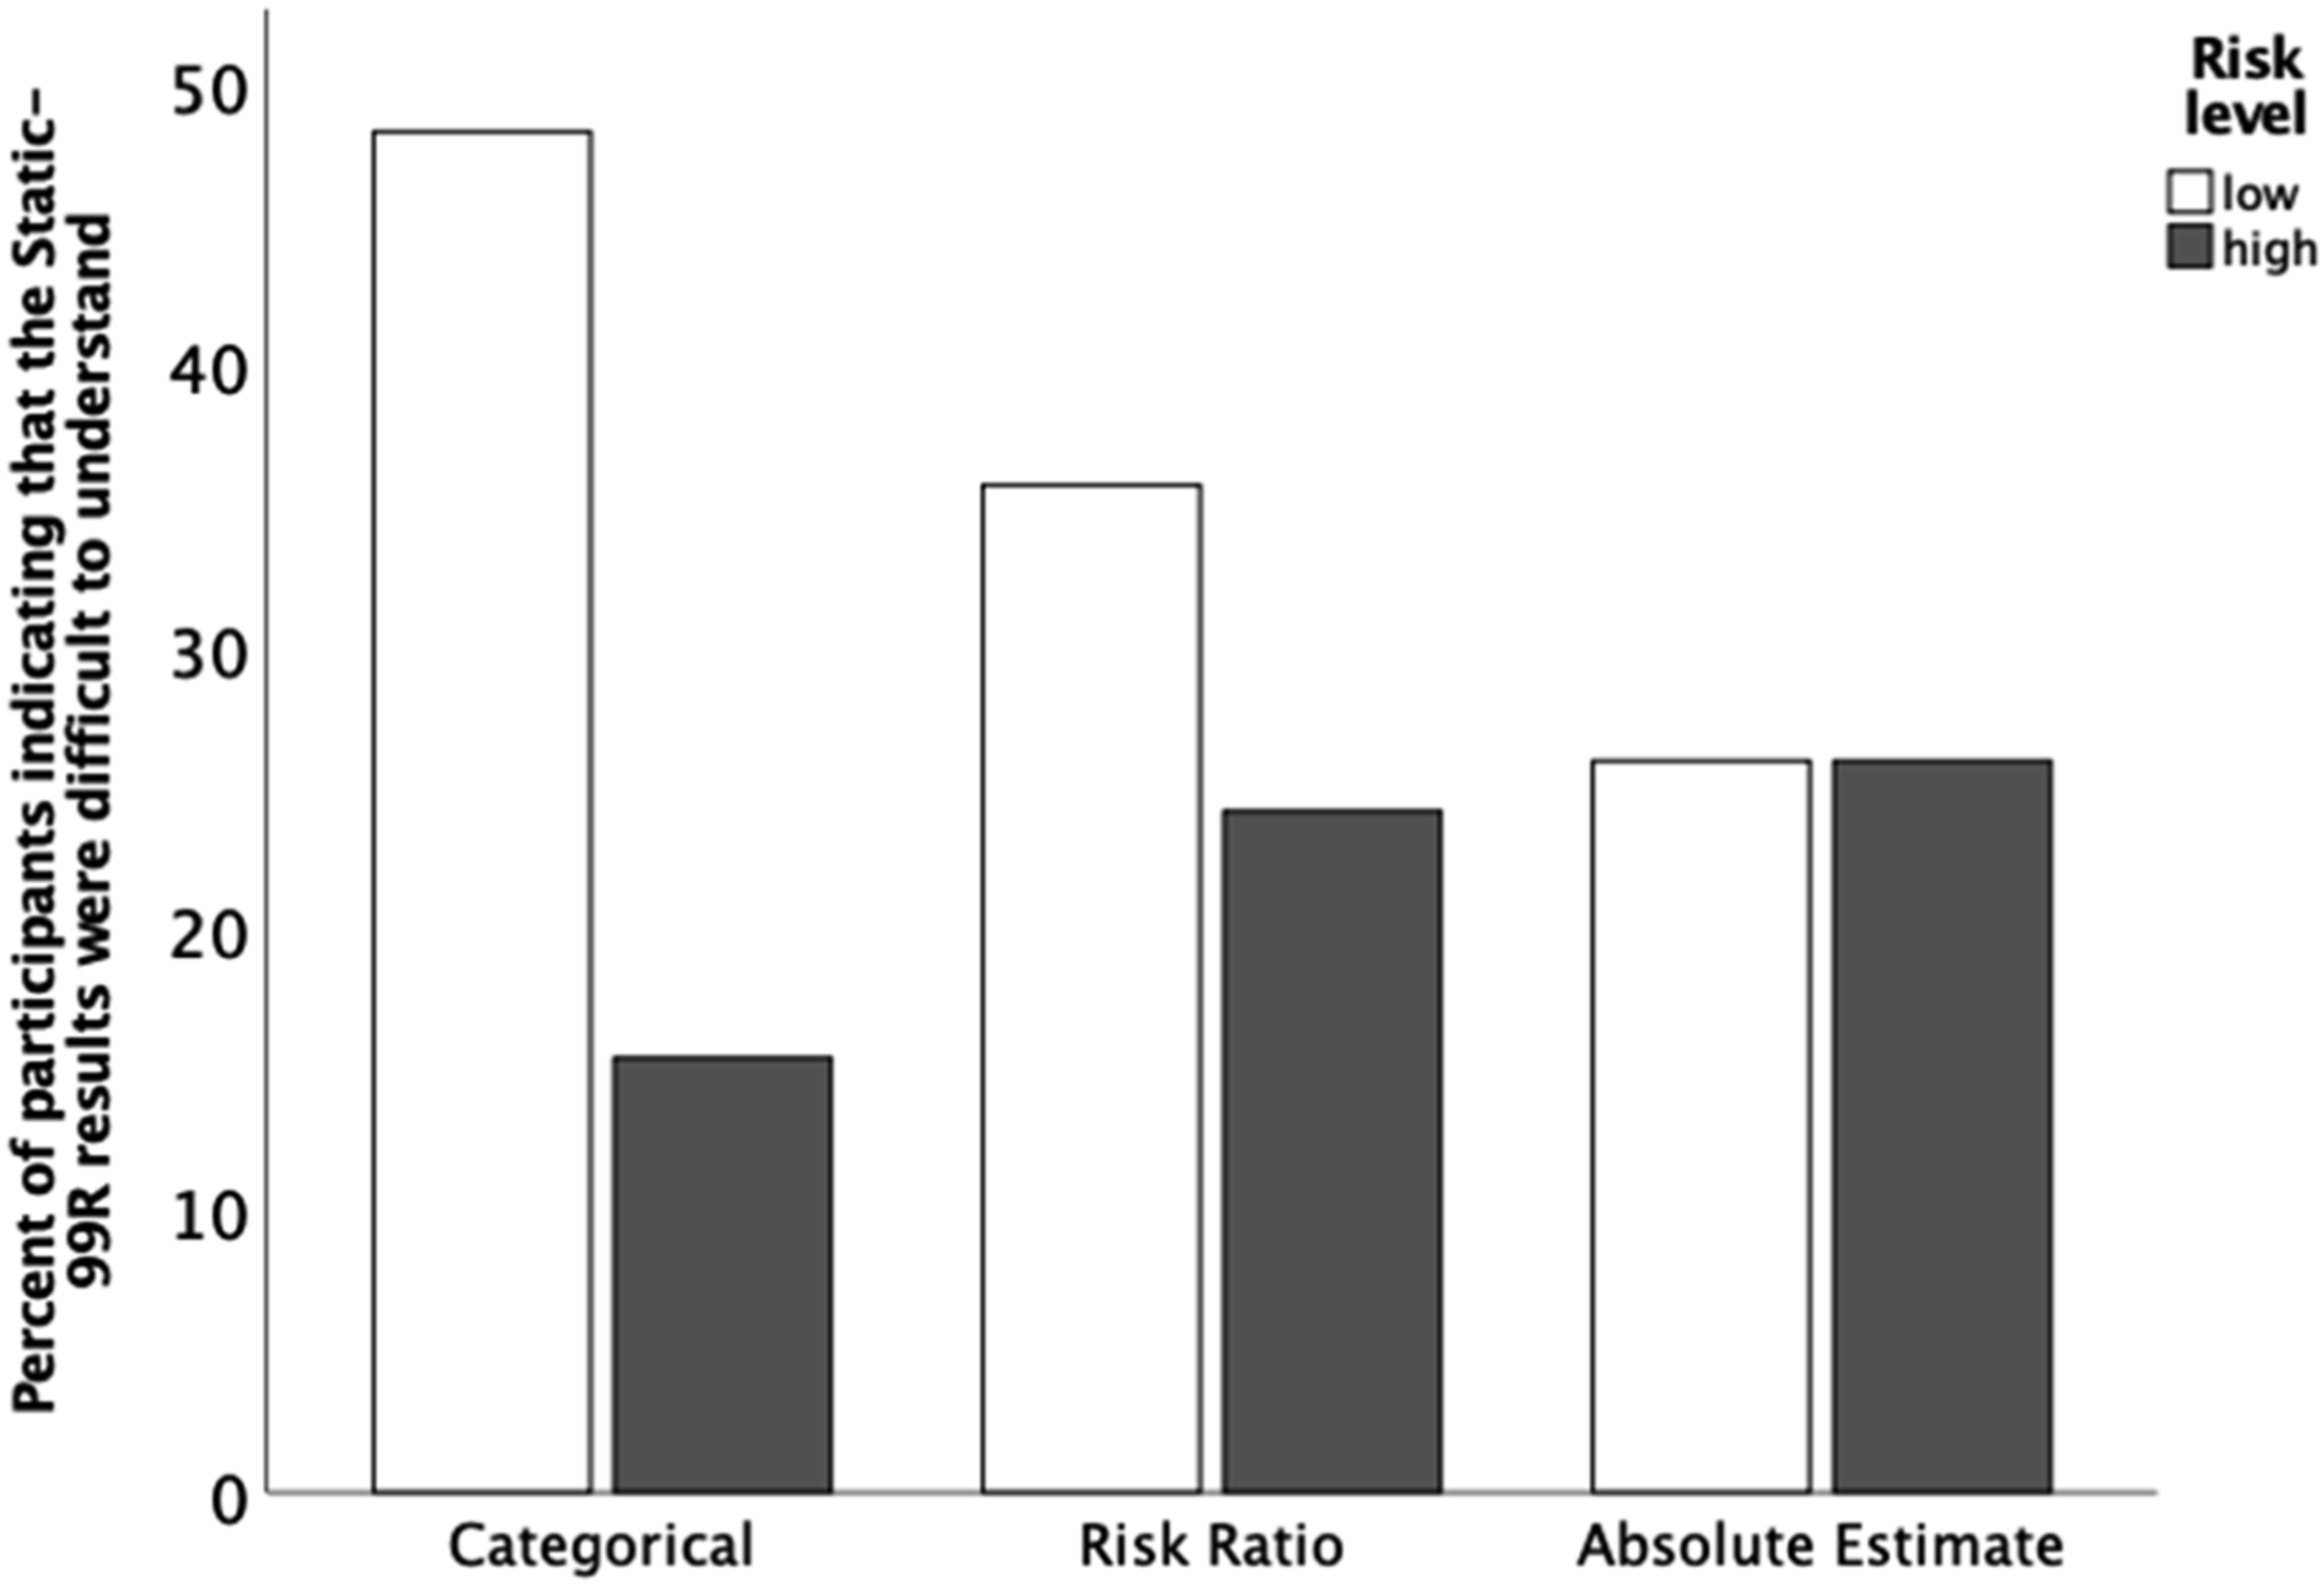
Part II – The Influence of Individual and Personality Factors on Risk Perception
Before exploring the primary personality factors of interest in this study, we examined whether perceptions of risk differed for male (M = 4.40, SD = 1.24, n = 53) versus female (M = 4.24, SD = 1.12, n = 113) participants. Participant gender was virtually unrelated to risk perception (t = 0.79, df = 92.7, p = .434, d = .13).
As outlined above, the personality factors need for cognition, attitudes toward sexual offenders, and authoritarianism may play a role in risk perception. Thus, we analyzed the amount of variance these additional variables may account for and their moderating effect on the relationship of risk level and communication format, respectively, with risk perception. To limit the number of models, we focused on the risk composite score as the most important dependent variable. This score demonstrates large associations with the other dependent variables of the individuals’ risk perception (see Table 2).
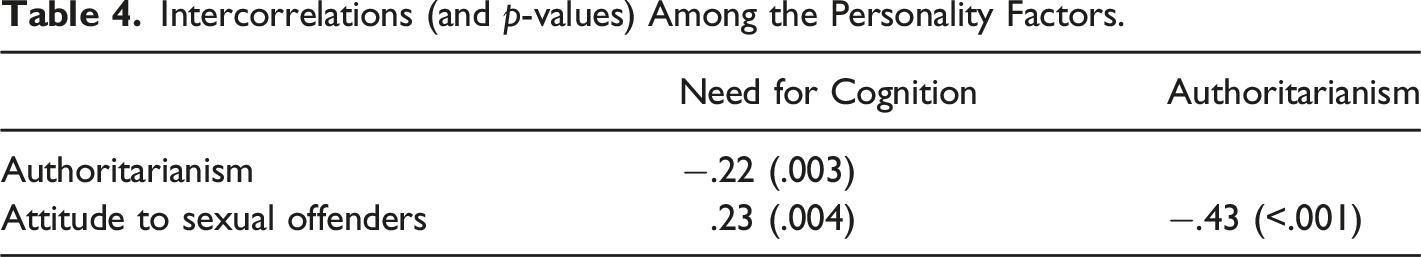
Intercorrelations (and p-values) Among the Personality Factors.
Results of the Stepwise Regression Analysis for Predicting the Risk Composite Score.
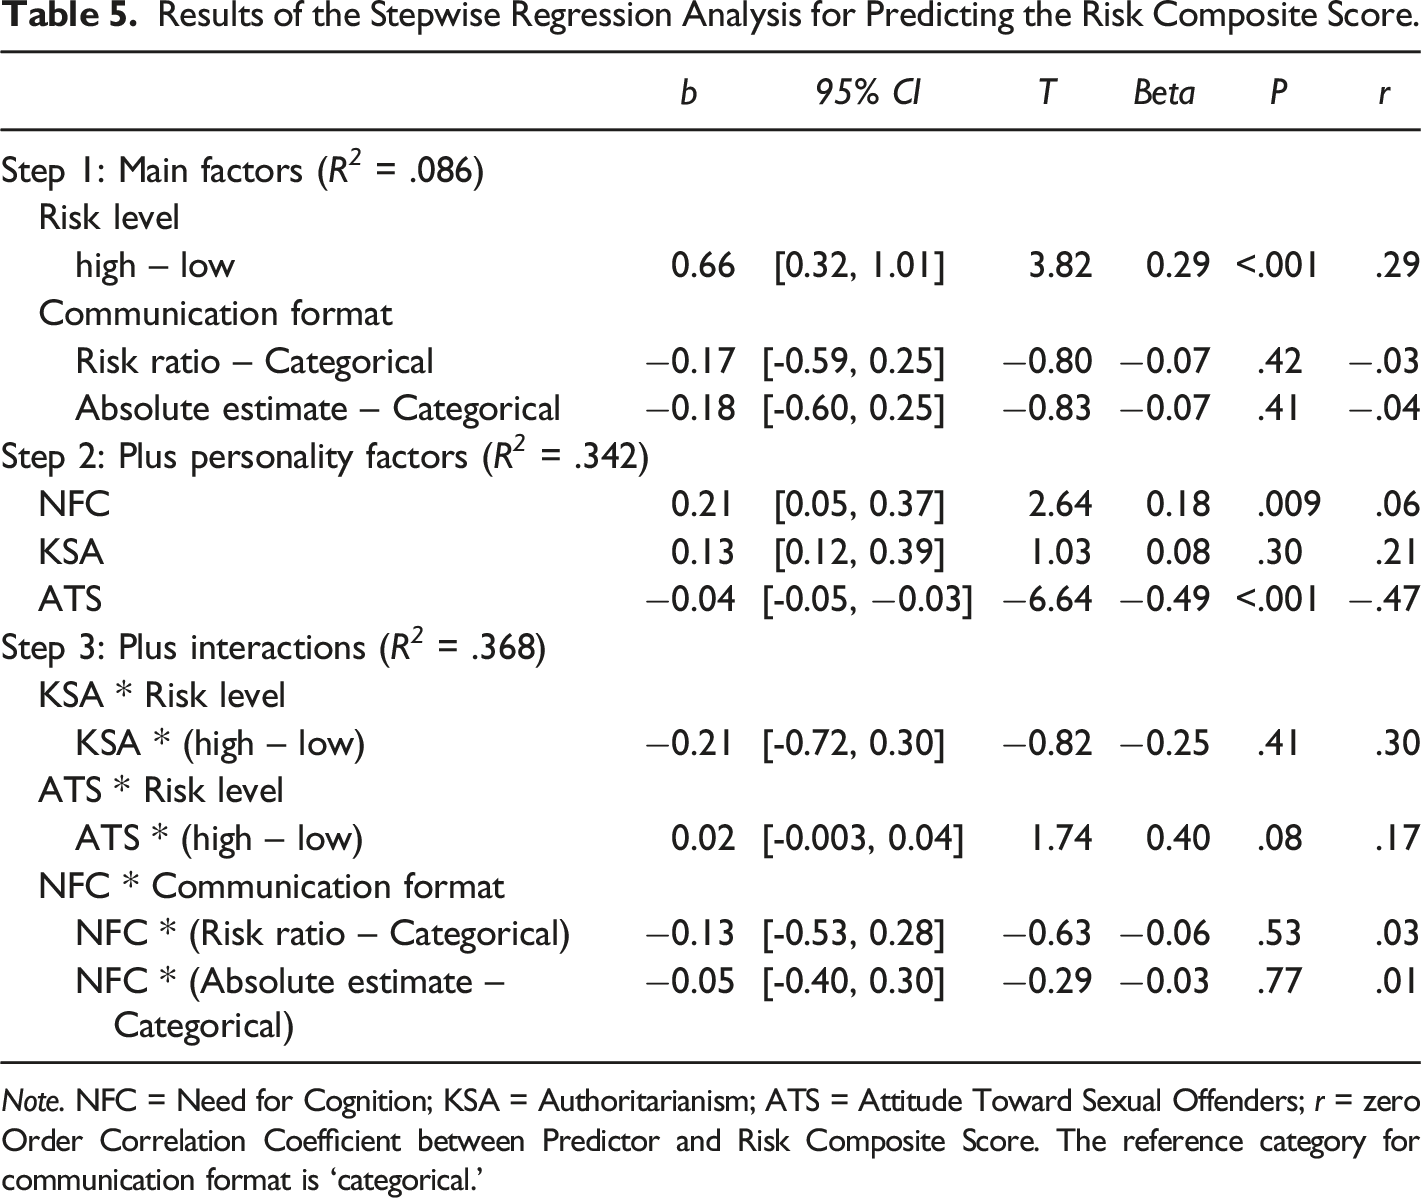
Note. NFC = Need for Cognition; KSA = Authoritarianism; ATS = Attitude Toward Sexual Offenders; r = zero Order Correlation Coefficient between Predictor and Risk Composite Score. The reference category for communication format is ‘categorical.’
In the third step of the regression, the interaction of need for cognition and communication format (Hypothesis 3) as well as the interactions of attitudes toward sexual offenders and authoritarianism, respectively, with the factor risk level (Hypotheses 4 and 5) were entered into the model. Explained variance improved by only 2.7%, which is a non-significant improvement, F (4,155) = 1.63 (p = .17). Yet, the interaction between attitudes toward sexual offenders and risk level yielded a considerable effect size. As depicted by Figure 7, no substantial difference in risk perception dependent on the risk level condition occurred for individuals reporting a more negative attitude towards sexual offenders (low ATS), whereas individuals with a more positive attitude towards sexual offenders (high ATS) showed the expected differentiation. Moderating effect of ATS on the influence of risk level on the risk composite score.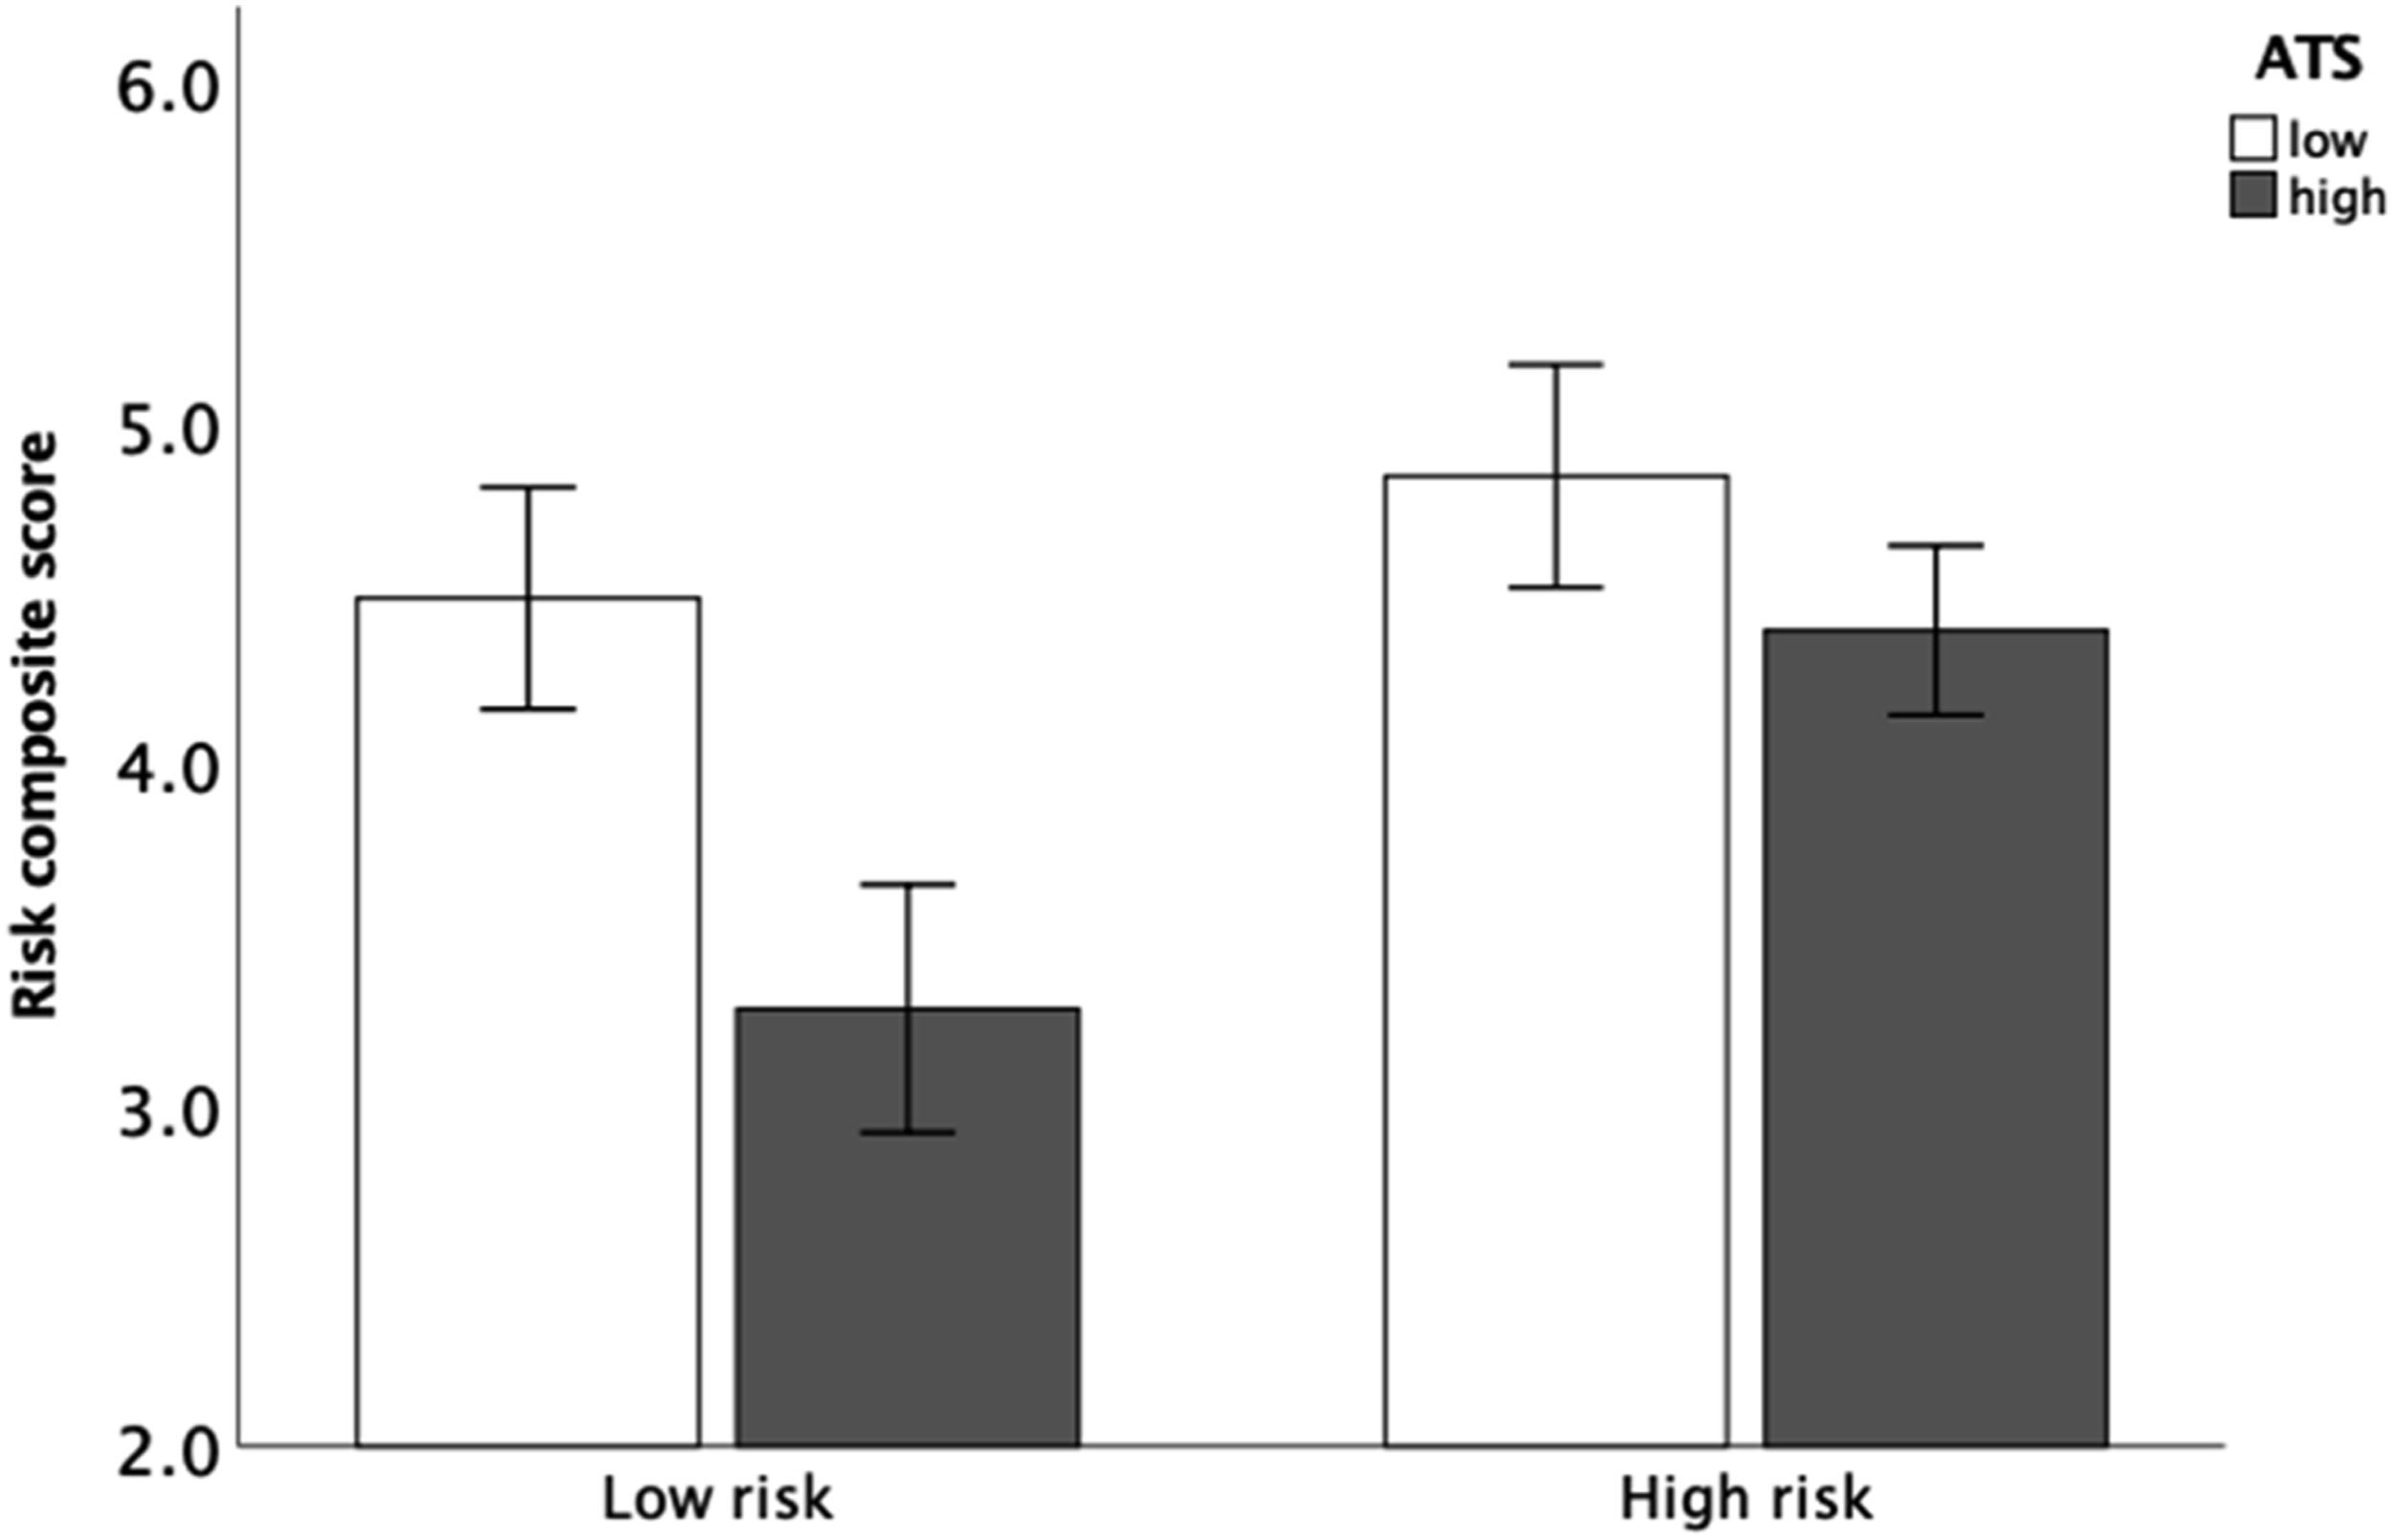
Discussion
Using a vignette approach, we examined the influence of three Static-99R risk communication formats (i.e., categorical, risk ratio, and absolute probability estimate) and the risk level (high vs. low) on individuals’ perceptions of risk posed by someone convicted of a sexual offense. With our study, we aimed to adapt and extend the study by Varela et al. (2014). Specifically, we adapted that study by introducing some conceptual changes (using a lower Static-99 score of −2 instead of 1, using updated norms, using a population-wide sample instead of community members reporting for jury duty); and we extended that study by additonally investigating the influence of the personality factors trait cognitive motivation (i.e., need for cognition) and attitudinal affect (i.e., attitudes toward sex offenders, authoritarianism) on participants’ risk perception. We found a main effect of risk level, which is consistent with the results of Varela et al. (2014) and Helmus et al. (2018).
Whereas Varela et al. (2014) reported that 95% of their participants indicated that the individual would commit a new sex offense in the next 5 years in the current study only 74.1% of participants deemed a reoffense likely. This might be due to the salience of the lower risk level. It could also be due to cultural differences, as the criminal justice systems are quite different in Germany versus the United States (with the latter tending to be more punitive), which may influence attitudes towards offenders (Subramanian & Shames, 2013). In contrast to both previous studies (Helmus et al., 2018; Varela et al., 2014), the current results did not show a significant interaction between risk level and communication format. Furthermore, a main effect of communication format was not found in the present study but only in the study by Helmus et al. (2018). Again, the salience of the risk level might have deemed the communication format irrelevant.
An alarming finding in Varela et al.’s (2014) study was that 80% of participants said that the individual’s risk to reoffend was three-fourths that of the typical offender they reported that the individual was more likely to reoffend than most offenders. Part of this could be a blatant disregard of the risk information, but given the other findings in the paper, it suggests serious difficulty understanding the risk ratio information. Risk ratios have numerous advantages and in some ways are the most natural fit for the measurement model of risk scales (Hanson et al., 2013), but this is a major limitation revealed by the original study: if people do not understand the information, how can they be expected to use it effectively in decision-making?
The current findings are more encouraging but still suggest need for improvement. If participants understood and believed the risk ratios, one would expect 0% in the low-risk condition to say the individual is at higher risk than most offenders, compared to 100% in the high-risk condition. We found 31% in the low-risk condition and 69% in the high-risk condition said the individual was more likely to reoffend than most. But this still means that roughly 31% of participants’ responses in both conditions did not match the risk ratio information they received.
It is difficult to discern how much of this misalignment between risk ratio information and the relative likelihood question can be attributed to participants not understanding the risk ratios versus ignoring them. One way to test this in future research would be to compare results in a vignette like this to similarly structured risk ratio information and comprehension questions on a more emotionally neutral and apolitical topic. If these results yield similarly concerning rates of misunderstanding risk ratios, this poses a clear need for further research on how to improve the understandability of this information.
Our additional analysis with cognitive motivation (i.e., need for cognition) and attitudinal and normative affect (i.e., attitudes toward sex offenders and authoritarianism) as further predictors of risk perception suggest that risk perception can be better understood if personality factors are additionally considered in the analyses.
Need for cognition did not show a meaningful bivariate zero-order association with the risk composite score (although it yielded a significant regression coefficient in the multiple regression, which might be largely due to a suppressor effect). Given the conceptualization and the behavioral correlates of need for cognition, a negative association between need for cognition and risk perception was expected. Individuals high in need for cognition are characterized by elaborated information processing and more rational than intuitive thinking (Cacioppo et al., 1996), which, in turn, has been shown to be associated with a lower risk perception (Harper & Hogue, 2015; Hilton & Helmus, 2020). Moreover, need for cognition is negatively associated with conservatism (e.g., Crowson, 2009), and individuals high in need for cognition showed less support for punitive measures against crime than people with a low need for cognition (Sargent, 2004). Support for a less conservative but more positive attitude towards offenders is also found in our data by the positive association between need for cognition and attitudes toward sexual offenders and the negative association between need for cognition and authoritarianism, which, however, were both only small in size.
Nevertheless, given the non-significant bivariate association with the risk composite score, our results indicate that individual differences in cognitive motivation may play a less important role for general risk perception. Similarly, the null effects could be due to our population-based sample and the fact that some knowledge of forensic assessment is necessary to resist the general tendency to overestimate risk by elaborately thinking about actuarial information. An investigation of the role of need for cognition in a more informed sample (e.g., judges) would be worthwhile. The non-significant interaction of need for cognition and communication format, in turn, is consistent with the non-significant main effect of communication format. This could be due to the fact that the very clear risk statements of −2 and 6 also lead to more easily understandable information about the risk. For example, in the risk probability condition and the low-risk condition the statement that only “1.3% of men who scored −2 on the Static-99R (like Mr X.) were rearrested for a sexual offense within 5 years” should give rather little room for interpretation, so that deep elaboration of the information does not matter for adequate risk assessment. In a design with more ambiguous risk scores, cognitive motivation might play a more important role.
Attitudes toward sexual offenders (ATS) was most strongly associated with the risk composite score as the most comprehensive indicator of risk perception. As suggested by the large negative main effect, individuals who reported to have a more negative attitude towards sexual offenders (i.e., lower ATS scores) perceived the risk generally higher than those with less negative attitudes (i.e., higher ATS scores). Beside this large main effect, a trend of an interaction of attitudes to sexual offenders with risk level was observed, indicating that the higher risk perception especially resulted from the fact that individuals with negative attitudes ignored the information of low-risk provided by the Static score in the low-risk vignette and evaluated the individual similarly dangerous as the high-risk condition. As one reason for this lack of differentiation, the activation of stereotypical images might provide a schematic representation of how a ‘sexual offender’ typically behaves (Harper et al., 2017). This stereotypical representation can lead to a short-cut heuristic information processing (Harris & Socia, 2014). That is, by reading the vignette, the schema of the typical sex offender is activated and it is concluded that the person in question must be dangerous, without elaborating further on the given information.
Authoritarianism also showed a non-trivial bivariate zero-order correlation with the risk composite score. Authoritarianism is seen to be related to “strategies for attaining collective security at the expense of individual autonomy” (Duckitt et al., 2010, p. 685) and previous research suggests that it is associated with a larger willingness to punish (for meta-analyses see Devine & Caughlin, 2014; Narby et al., 1993). Consistent with these conceptualizations and behavioral correlates of authoritarianism, a positive association between authoritarianism and the risk composite score occurred, indicating that individuals high in authoritarianism perceived the sexual offender’s risk to reoffend generally higher than individuals low in authoritarianism. However, this relationship was no longer evident when controlling for the quite large amount of shared variance with attitudes toward sexual offenders (18%). Due to the central characteristic of individuals high in authoritarianism to possess negative attitudes towards individuals perceived as deviant, there might have been no incremental validity over and above the more specific construct attitudes to sexual offenders in the regression model.
Overall, the additional analyses on the moderating role of individual difference factors in the perception of people convicted of sexual offenses contribute to our understanding of risk perception. The results suggest that particularly the individual’s attitude towards sexual offenders seem to be relevant for a more or less valid use of the information given by actuarial risk measurement tools, such as Static-99R. Thus, the results underline that factors beyond a mere lack of understanding, but related to not elaborating on or ignoring relevant risk information, may contribute to the discrepancy between risk measure information and risk perception. Accordingly, the results stress the point of educating decision-makers about possible bias. Here, the current study shows empirical evidence for asking prospective jurors about biases (e.g., negative attitudes towards individuals who sexually offend) before they are potentially selected, as is already the case in some countries (e.g., Cramer et al., 2009).
Strengths and Limitations
Although in the present study, we made some conceptual changes to the study of Varela et al. (2014), we kept their vignette, which improves the comparative ability of our study. Additionally, cross-cultural research is becoming increasingly important, and the current study provides useful information on risk communication from a German-speaking country. Two of the three self-report measures had already been translated and validated in German; for the third, we had it translated by two German-speaking researchers to improve translation quality. Lastly, the use of validated self-report measures to understand the role of personality characteristics in risk communication opens up several new avenues for future research. In this context, it might also be worthwhile to systematically investigate the relevance of further personality constructs such as numeracy for (forensic-related) risk communication. For example, Reyna et al. (2009) point out that numeracy is related to perceptions of (health-related) risks and benefits. Specifically, participants lower in numeracy tend to overestimate risk, are less able to use risk reduction information, and may overestimate benefits of uncertain treatments.
One limitation of the study is associated with online sampling, especially the limited representativeness of the target population. The sample mainly included females (about two-thirds) as well as considerably highly educated participants (about half with higher education). However, people facing the task at hand in real-life settings (e.g., within community supervision, forensic psychological assessment, offender treatment) are very likely to hold a university degree. In this regard, future studies should try to replicate the results with forensic clinicians, lawyers, or judges as participants in real-life settings rather than under experimental survey conditions. Nonetheless, our participants may reflect the characteristics and responses of the general public, whose perceptions of men who have committed a sexual offense indirectly influence public policy regarding the detainment of persons convicted of sex offenses and reactions to their rehabilitation in the community. Although the current sample differs from both the general population and those working in the criminal justice system, it is unlikely that these differences would meaningfully impact the results. A recent study has found that the relationship between the attitudes toward sexual offenders and risk perception was similar among students and forensic professionals (Harper & Hicks, 2022).
This study contributes to our understanding of diversity in psychological research findings by replicating a North American study in a German-speaking country. Overall, the sample would be considered more diverse than typical university student samples but are unlikely to be fully representative of the population of German-speaking Europeans. In our analyses we did not find differences in risk perception between male and female participants. We did not have sufficient sample size to explore differences across other dimensions of variability in participants (e.g., non-binary gender identities, race/ethnicity).
To our knowledge, this is the first study trying to establish a more comprehensive model of risk perception by including individual variables in relation to ‘cognitive motivation’ (i.e., need for cognition) and ‘attitudinal affect’ (i.e., attitudes toward sex offenders, authoritarianism). Future studies might want to investigate the importance of additional constructs based on the current results.
Supplemental Material
Supplemental Material - Same Score, Different Audience, Different Message: Perceptions of Sex Offense Risk Depend on Static-99R Risk Level and Personality Factors of the Recipient
Supplemental Material for Same Score, Different Audience, Different Message: Perceptions of Sex Offense Risk Depend on Static-99R Risk Level and Personality Factors of the Recipient by Robert J. B. Lehmann, Thomas Schäfer, L. Maaike Helmus, Julia Henniges, and Monika Fleischhauer in Sexual Abuse
Footnotes
Acknowledgments
The authors take responsibility for the integrity of the data, the accuracy of the data analyses, and have made every effort to avoid inflating statistically significant results.
Declaration of Conflicting Interests
The author(s) declared no potential conflicts of interest with respect to the research, authorship, and/or publication of this article.
Funding
The author(s) received no financial support for the research, authorship, and/or publication of this article.
Supplemental Material
Supplemental material for this article is available online.
References
Supplementary Material
Please find the following supplemental material available below.
For Open Access articles published under a Creative Commons License, all supplemental material carries the same license as the article it is associated with.
For non-Open Access articles published, all supplemental material carries a non-exclusive license, and permission requests for re-use of supplemental material or any part of supplemental material shall be sent directly to the copyright owner as specified in the copyright notice associated with the article.