
Abstract
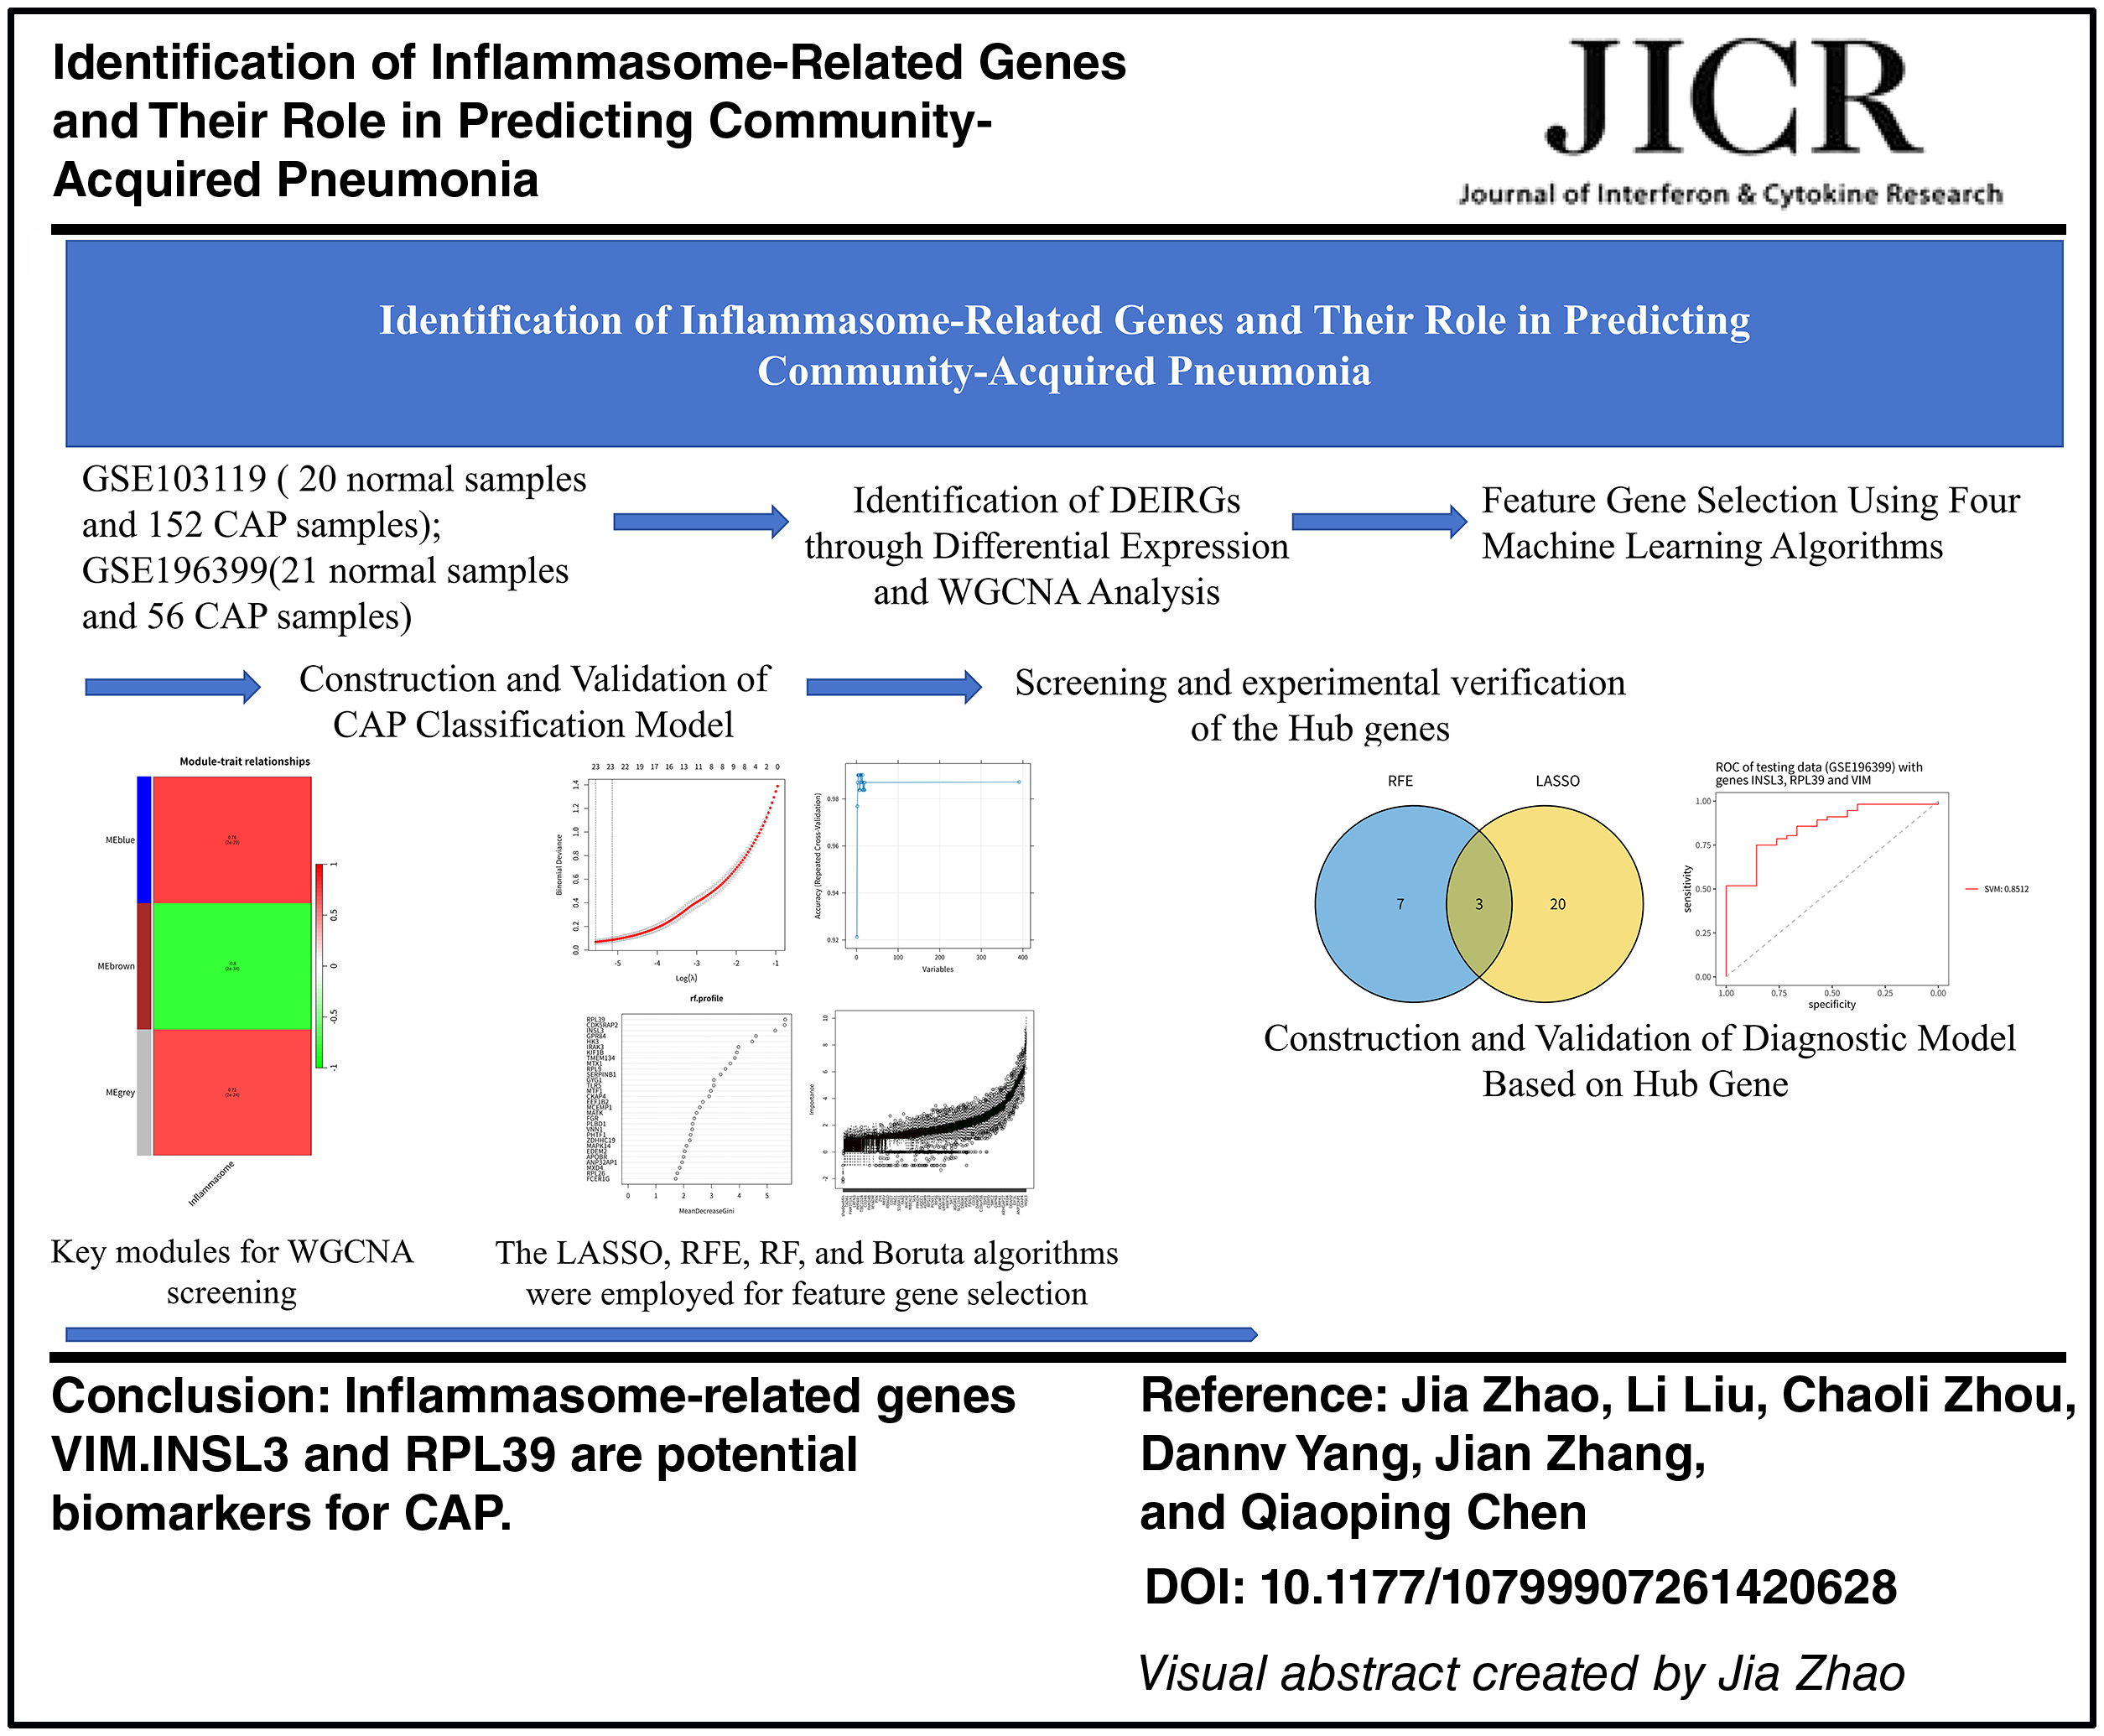
Community-acquired pneumonia (CAP) is a common respiratory infectious disease worldwide, posing a significant threat to human health. In recent years, the crucial role of inflammasomes in the occurrence and development of pneumonia has gradually been recognized. This study aims to systematically explore potential diagnostic biomarkers related to inflammasomes in CAP. CAP transcriptome datasets GSE103119 and GSE196399 were obtained from the GEO database. First, we conducted differential expression analysis and combined it with weighted gene co-expression network analysis to screen inflammasome-related differentially expressed genes (DEIRGs). Subsequently, we carried out Kyoto Encyclopedia of Genes and Genomes and Gene Ontology enrichment analysis. Then, based on multiple machine learning algorithms [least absolute shrinkage and selection operator (LASSO), recursive feature elimination (RFE), Boruta, and random forest], we performed feature gene selection and combined a support vector machine (SVM) to construct a classification model. The diagnostic performance was evaluated in the training set and validation set through the receiver operating characteristic curve and precision-recall curve. Finally, we collected peripheral blood samples from 5 patients with CAP and 5 healthy controls and used quantitative real-time polymerase chain reaction (qRT-PCR) to verify the expression differences of candidate genes. A total of 414 DEIRGs were identified, mainly enriched in immune response regulation, Th17 cell differentiation, and autophagy pathways. Combined with machine learning and SVM analysis, the LASSO and RFE models showed the best performance in CAP diagnosis. Based on the intersection of these two algorithms, RPL39, INSL3, and vimentin (VIM) were ultimately determined as the core candidate genes. The qRT-PCR results further confirmed that in CAP peripheral blood samples, INSL3 and VIM showed significantly increased expression, while RPL39 showed decreased expression, which was consistent with the bioinformatics prediction. This study identifies RPL39, INSL3, and VIM as potential diagnostic markers for CAP, which may provide new evidence for early diagnosis and stratified management.
Introduction
Pneumonia is one of the major public health challenges worldwide and is a leading cause of hospitalization and death. Depending on the environment where the infection occurs, pneumonia can be classified as community-acquired pneumonia (CAP) and hospital-acquired pneumonia (Lanks et al., 2019). Among them, CAP refers to non-Interstitial lung parenchymal infection that occurs outside the hospital and has a relatively high incidence and mortality rate, imposing a heavy burden on public health and the social economy (Meyer Sauteur, 2024). Epidemiological studies have shown that the annual incidence of CAP is approximately 1.76–7.03 cases per 1,000 people (Aliberti et al., 2021). If not diagnosed promptly and accurately, patients with CAP may progress to severe CAP (SCAP), with an in-hospital mortality rate of up to 25%–50% (Cao et al., 2018; Cilloniz et al., 2018; Nair and Niederman, 2021). Currently, the diagnosis of CAP mainly relies on clinical manifestations (such as physical examination and imaging tests) and microbiological tests (such as sputum culture, bronchoalveolar lavage, and lung biopsy) (Meyer Sauteur, 2020; Meyer Sauteur, 2024). However, these methods have certain limitations, such as some tests being invasive and some methods having insufficient sensitivity and specificity (Meyer Sauteur, 2020). Therefore, developing new diagnostic strategies is of great significance for improving the early identification and accurate diagnosis of CAP.
Inflammasomes are key components of the innate immune response and can be activated by various stimuli such as infection and intracellular and environmental factors (Yao et al., 2024; Zou et al., 2025). Once activated, inflammasomes can mediate the release of pro-inflammatory cytokines IL-1β and IL-18, thereby triggering an inflammatory cascade (Broz and Dixit, 2016; Kelley et al., 2019; Noonin and Thongboonkerd, 2021). Numerous studies have shown that inflammasomes play a role in the pathogenesis and development of various diseases, including cardiovascular diseases and neurodegenerative diseases (Anderson et al., 2023; Chou et al., 2023; Guo et al., 2015; Toldo et al., 2022). In pneumonia, the abnormal activation of inflammasomes is closely related to the severity of the disease. For example, the activation of NLRP3 inflammasome may mediate the recruitment of neutrophils and macrophages through IL-1β and other pro-inflammatory factors, promoting bacterial clearance while possibly causing excessive responses that lead to tissue damage and systemic inflammation, thereby affecting the progression of Streptococcus pneumoniae infection (Surabhi et al., 2020). In addition, CircCDC42 encoded by CDC42-165aa can trigger excessive activation of the Pyrin inflammasome, leading to pyroptosis of alveolar macrophages and exacerbating Klebsiella pneumoniae infection (Xu et al., 2024), while NLRP12 regulates host defense through the IL-17A-CXCL1 axis and may alleviate Klebsiella pneumonia (Cai et al., 2016). Other studies have found that Demethyleneberberine effectively alleviates acute pneumonia caused by Pseudomonas aeruginosa by inhibiting AIM2 inflammasome activation and oxidative stress (Han et al., 2023). Nevertheless, the potential application of inflammasomes in the diagnosis of CAP has not been fully explored.
This study aims to systematically screen potential diagnostic biomarkers for CAP by integrating transcriptomics analysis and multiple machine learning methods. Based on the CAP transcriptome data from the Gene Expression Omnibus (GEO) database and inflammasome-related genes (IRGs), the study first conducted differential expression gene (DEGs) and differential inflammasome-related gene (DEIRGs) analyses and combined them with weighted gene co-expression network analysis (WGCNA) to screen key module genes. Subsequently, using four machine learning methods [random forest (RF), recursive feature elimination (RFE), Boruta, and least absolute shrinkage and selection operator (LASSO) regression], robust candidate genes were selected, and finally, a CAP diagnostic biomarker system was constructed. This study is expected to provide a new molecular basis for the early identification and precise diagnosis of CAP.
Materials and Methods
Data acquisition
CAP datasets GSE103119 (training set: 20 normal and 152 CAP samples) and GSE196399 (testing set: 21 normal and 56 CAP samples) were downloaded from GEO (https://www.ncbi.nlm.nih.gov/geo/). 141 IRG were obtained from previous literature (Tsao et al., 2022).
Identification of DEIRGs through differential expression and WGCNA analysis
First, we utilized the GEO2R tool in the GEO database to conduct a differential analysis between the normal samples and the CAP samples in the GSE103119 training set. We selected the DEGs based on the criteria of |log2FC| > 0.585 and false discovery rate (FDR) < 0.05. Subsequently, we calculated the coefficient of variation (CV) for these DEGs and removed the genes with extremely low expression levels or too small variability. Finally, we retained the genes with CV ≥ 4% (approximately 3/4 of all genes), aiming to reduce noise while maximizing the retention of characteristic genes with potential biological significance.
Scores for IRGs were computed using the GSVA R package (Ferreira et al., 2021). WGCNA was performed using the WGCNA R package (Zeng et al., 2023) to identify gene modules associated with IRG scores. All CAP samples were clustered based on gene expression levels, excluding outliers above a height threshold of 5e + 6. A correlation matrix was constructed using the WGCNA R package, and an optimal soft threshold was selected to convert this correlation matrix into an adjacency matrix. A topological overlap matrix was then generated, and hierarchical clustering of genes was conducted to identify modules correlated with IRG scores. After identifying all potentially associated modules based on |r|> 0.25, further screening was conducted to select those modules with the strongest correlation (|r|> 0.7) to IRG scores for subsequent in-depth analysis.
Kyoto Encyclopedia of Genes and Genomes (KEGG) and Gene Ontology (GO) enrichment analyses were performed on DEIRGs within these key modules using the clusterProfiler R package (Yu et al., 2012), with results visualized through the ggplot2 R package (Qin et al., 2023).
Construction and validation of CAP classification model using machine learning algorithms
To identify the genes significantly related to the inflammasomes in CAP, we applied various machine learning algorithms based on DEIRGs. Specifically, RF analysis was conducted using the “randomForest” R package (Alderden et al., 2018). RFE analysis was performed using the “caret” R package (Ma et al., 2023). LASSO regression analysis with 10-fold cross-validation was carried out using the “glmnet” R package (Liu et al., 2023). Boruta feature selection was conducted using the “Boruta” R package (Parvez et al., 2024), retaining the genes marked as “Important.”
Furthermore, we used the Support Vector Machine (SVM) as a unified classifier to compare the classification performance of the gene models obtained by the four methods (RF, RFE, LASSO, and Boruta) in distinguishing patients with CAP from the control group. Subsequently, combining the four machine learning algorithms, the receiver operating characteristic (ROC) curve and precision-recall (PR) curve were plotted using the “pROC” R package (Robin et al., 2011) to evaluate the classification performance of different models. The establishment and validation of the models were based on the training set and validation set.
CAP diagnostic model based on hub genes
Based on the evaluation of feature selection methods, both LASSO and RFE demonstrated high classification accuracy. Building on this finding, we employed these two algorithms to identify key genes and construct a diagnostic model. The intersection of feature genes selected by LASSO and RFE was determined to define hub genes. Using the GSE196399 testing set, ROC and PR curves were plotted using the pROC R package (Robin et al., 2011) to assess model diagnostic performance. Expression differences of hub genes between control and patients with CAP were investigated using both the GSE103119 training set and the GSE196399 testing set.
Clinical sample collection
From January to May in 2025, a total of 5 patients with CAP and 5 healthy controls were included in this study. Blood samples were collected from all participants for analysis. Patients who had previously been diagnosed with CAP were included. Patients with the presence of other major pulmonary diseases (such as tuberculosis and lung tumors) and severe immunodeficiency diseases (such as AIDS), as well as patients with severe comorbidities (such as unstable vital signs and severe liver and kidney dysfinction), were excluded. All participants signed written informed consent forms. The collection of clinical samples and related experiments was conducted per the ethical requirements of the Medical Ethics Committee of Zhuji Affiliated Hospital of Wenzhou Medical University, approval number [2024]1212.
qRT-PCR
According to the manufacturer’s instructions, total RNA was extracted from the blood samples using the TRNzol kit (Invitrogen, USA). The RNA concentration and purity were determined using a NanoDrop One microv visible spectrophotometer. cDNA was synthesized using the PrimeScript™ RT Reagent Kit (TaKaRa, Japan). The qRT-PCR reaction was performed using the TB Green® Premix Ex Taq™II kit (TaKaRa, Japan). GAPDH was used as the reference gene. Each sample was run in triplicate to ensure accuracy. The relative expression level was calculated using the 2-ΔΔCt method. The primer sequences are summarized in Table 1.
qRT-PCR Primer Sequences
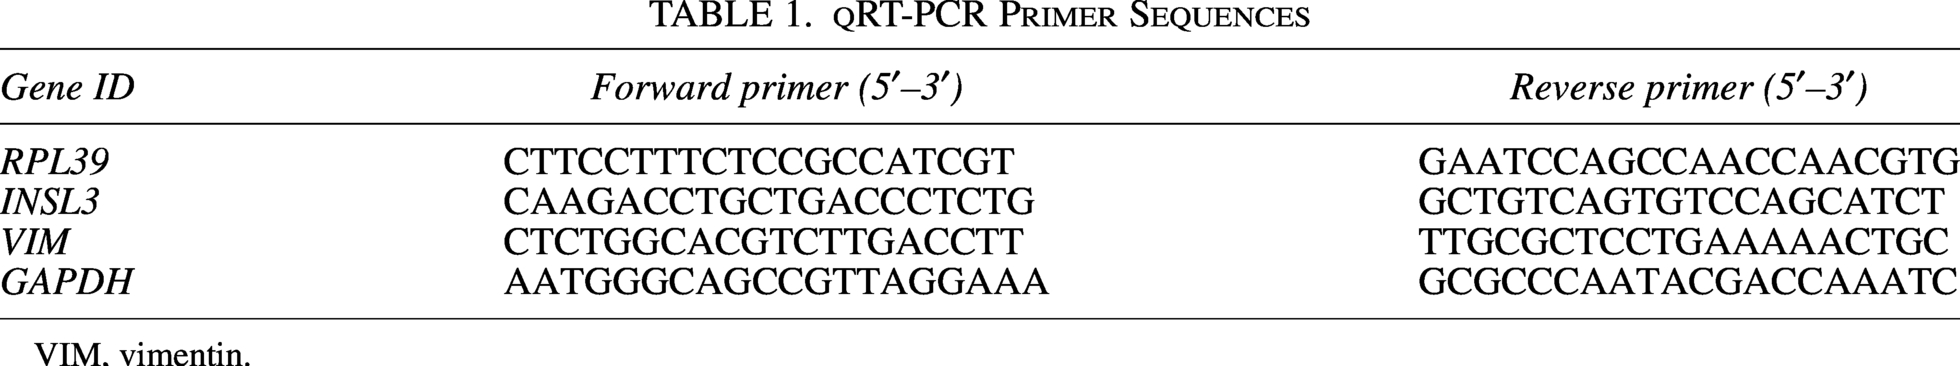
VIM, vimentin.
Statistical analysis
Statistical analysis was performed using GraphPad Prism 10.1.2. The expression levels between the two groups were compared using the t-test; a P value <0.05 was considered statistically significant.
Results
Identification of DEIRGs through differential expression and WGCNA analysis
First, we conducted a differential expression analysis between CAP samples and normal samples in the GSE103119 training set, resulting in 1,745 DEGs for subsequent WGCNA construction (Fig. 1A). Subsequently, we used WGCNA to construct a network and screen for related modules and set the soft threshold power to 14 (unscaled R2 = 0.99) (Fig. 1B and C). On this basis, we constructed a hierarchical clustering tree and identified the modules co-expressed with IRGs through a dynamic tree-cutting method, while merging the modules with a similarity distance of <0.25 (Fig. 1D). Finally, we selected the blue and brown modules with significantly positive correlations (correlation coefficient > 0.7) with the IRGs scores as DEIRGs (Fig. 1E). A total of 414 DEIRGs were screened from these two modules (Supplementary Table S1).
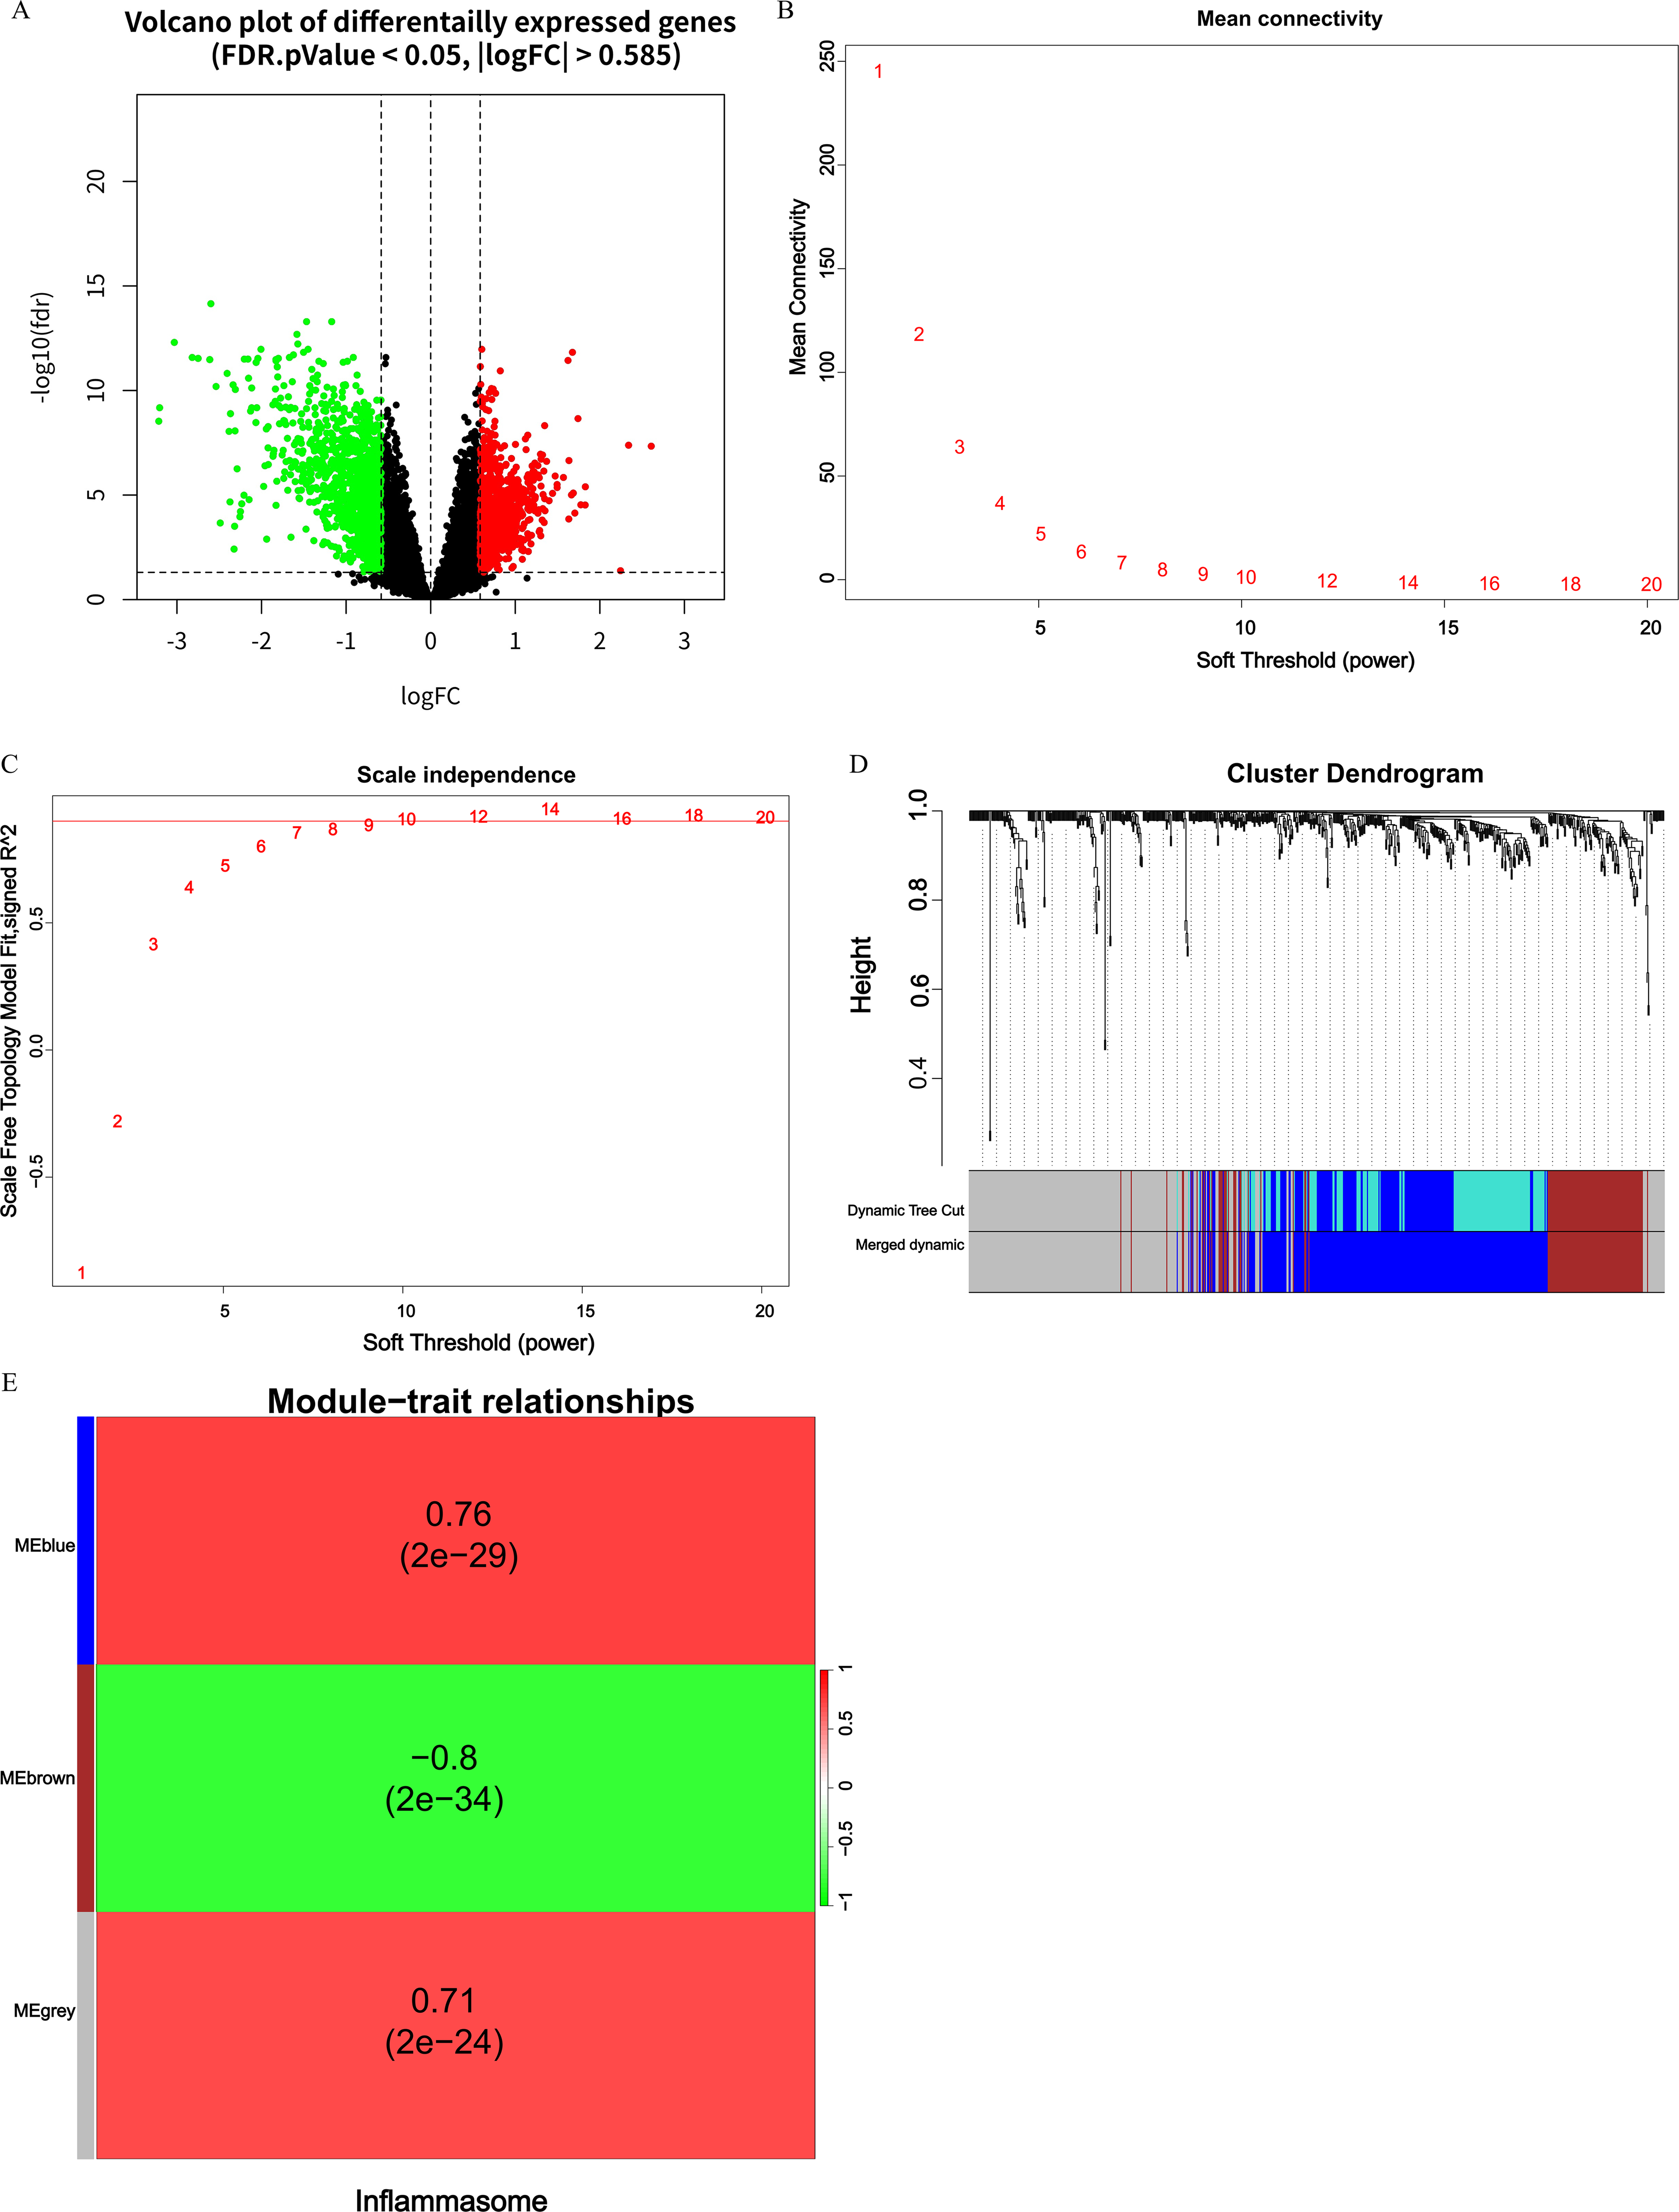
Identification of DEIRGs using WGCNA.
Following this, functional enrichment analysis was conducted on 414 DEIRGs. GO analysis revealed that these genes were primarily associated with pathways such as immune response-regulating signaling pathway, focal adhesion, cytoplasmic translation, and immune receptor activity (P < 0.05) (Fig. 2A). KEGG analysis indicated that these genes were significantly linked to pathways including coronavirus disease, Th17 cell differentiation, osteoclast differentiation, and autophagy (P < 0.05) (Fig. 2B).
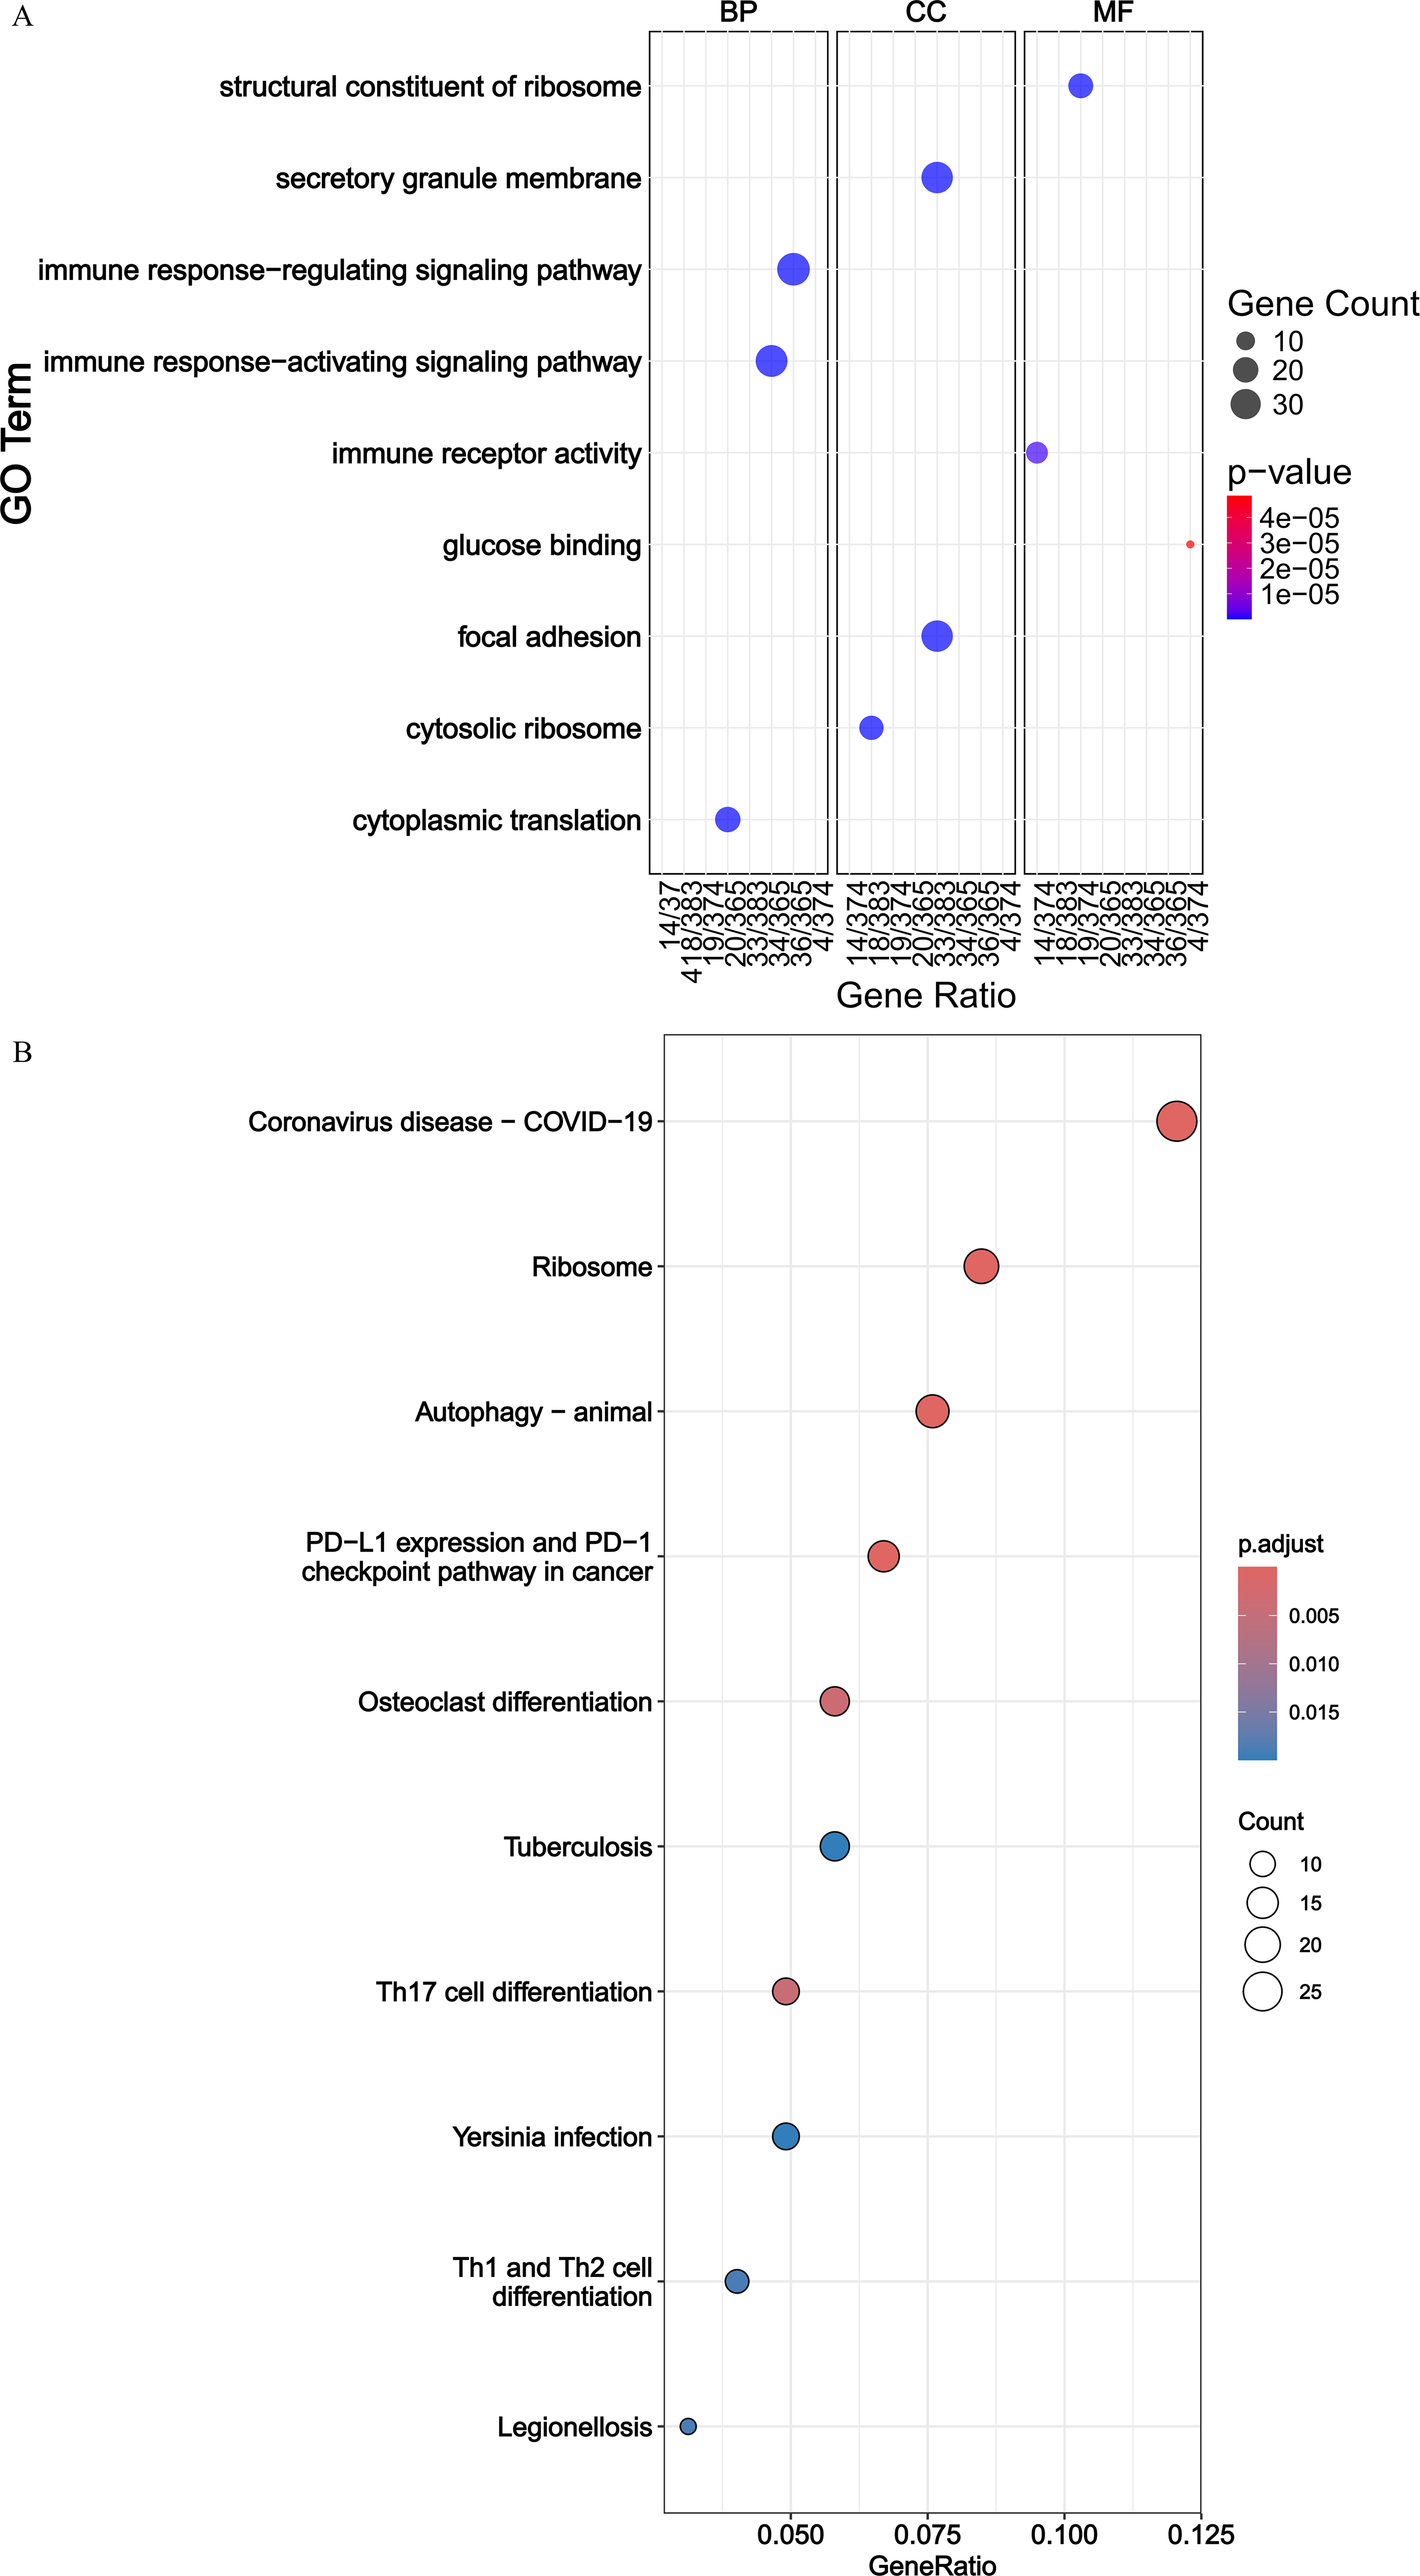
GO and KEGG enrichment analyses of DEIRGs.
Feature gene selection using four machine learning algorithms
To identify the genes significantly related to inflammasomes in CAP, we selected characteristic genes based on DEIRGs using LASSO, RFE, RF, and Boruta algorithms. The LASSO regression algorithm extracted 23 characteristic genes from the DEIRGs (Fig. 3A). The RFE algorithm identified 10 characteristic genes (Fig. 3B). To ensure the selection of important genes and to control the number of characteristic genes as consistently as possible, we chose 23 characteristic genes. Based on this, the RF algorithm selected the first 23 characteristic genes (Fig. 3C). Similarly, the Boruta algorithm selected the first 23 characteristic genes (Fig. 3D).
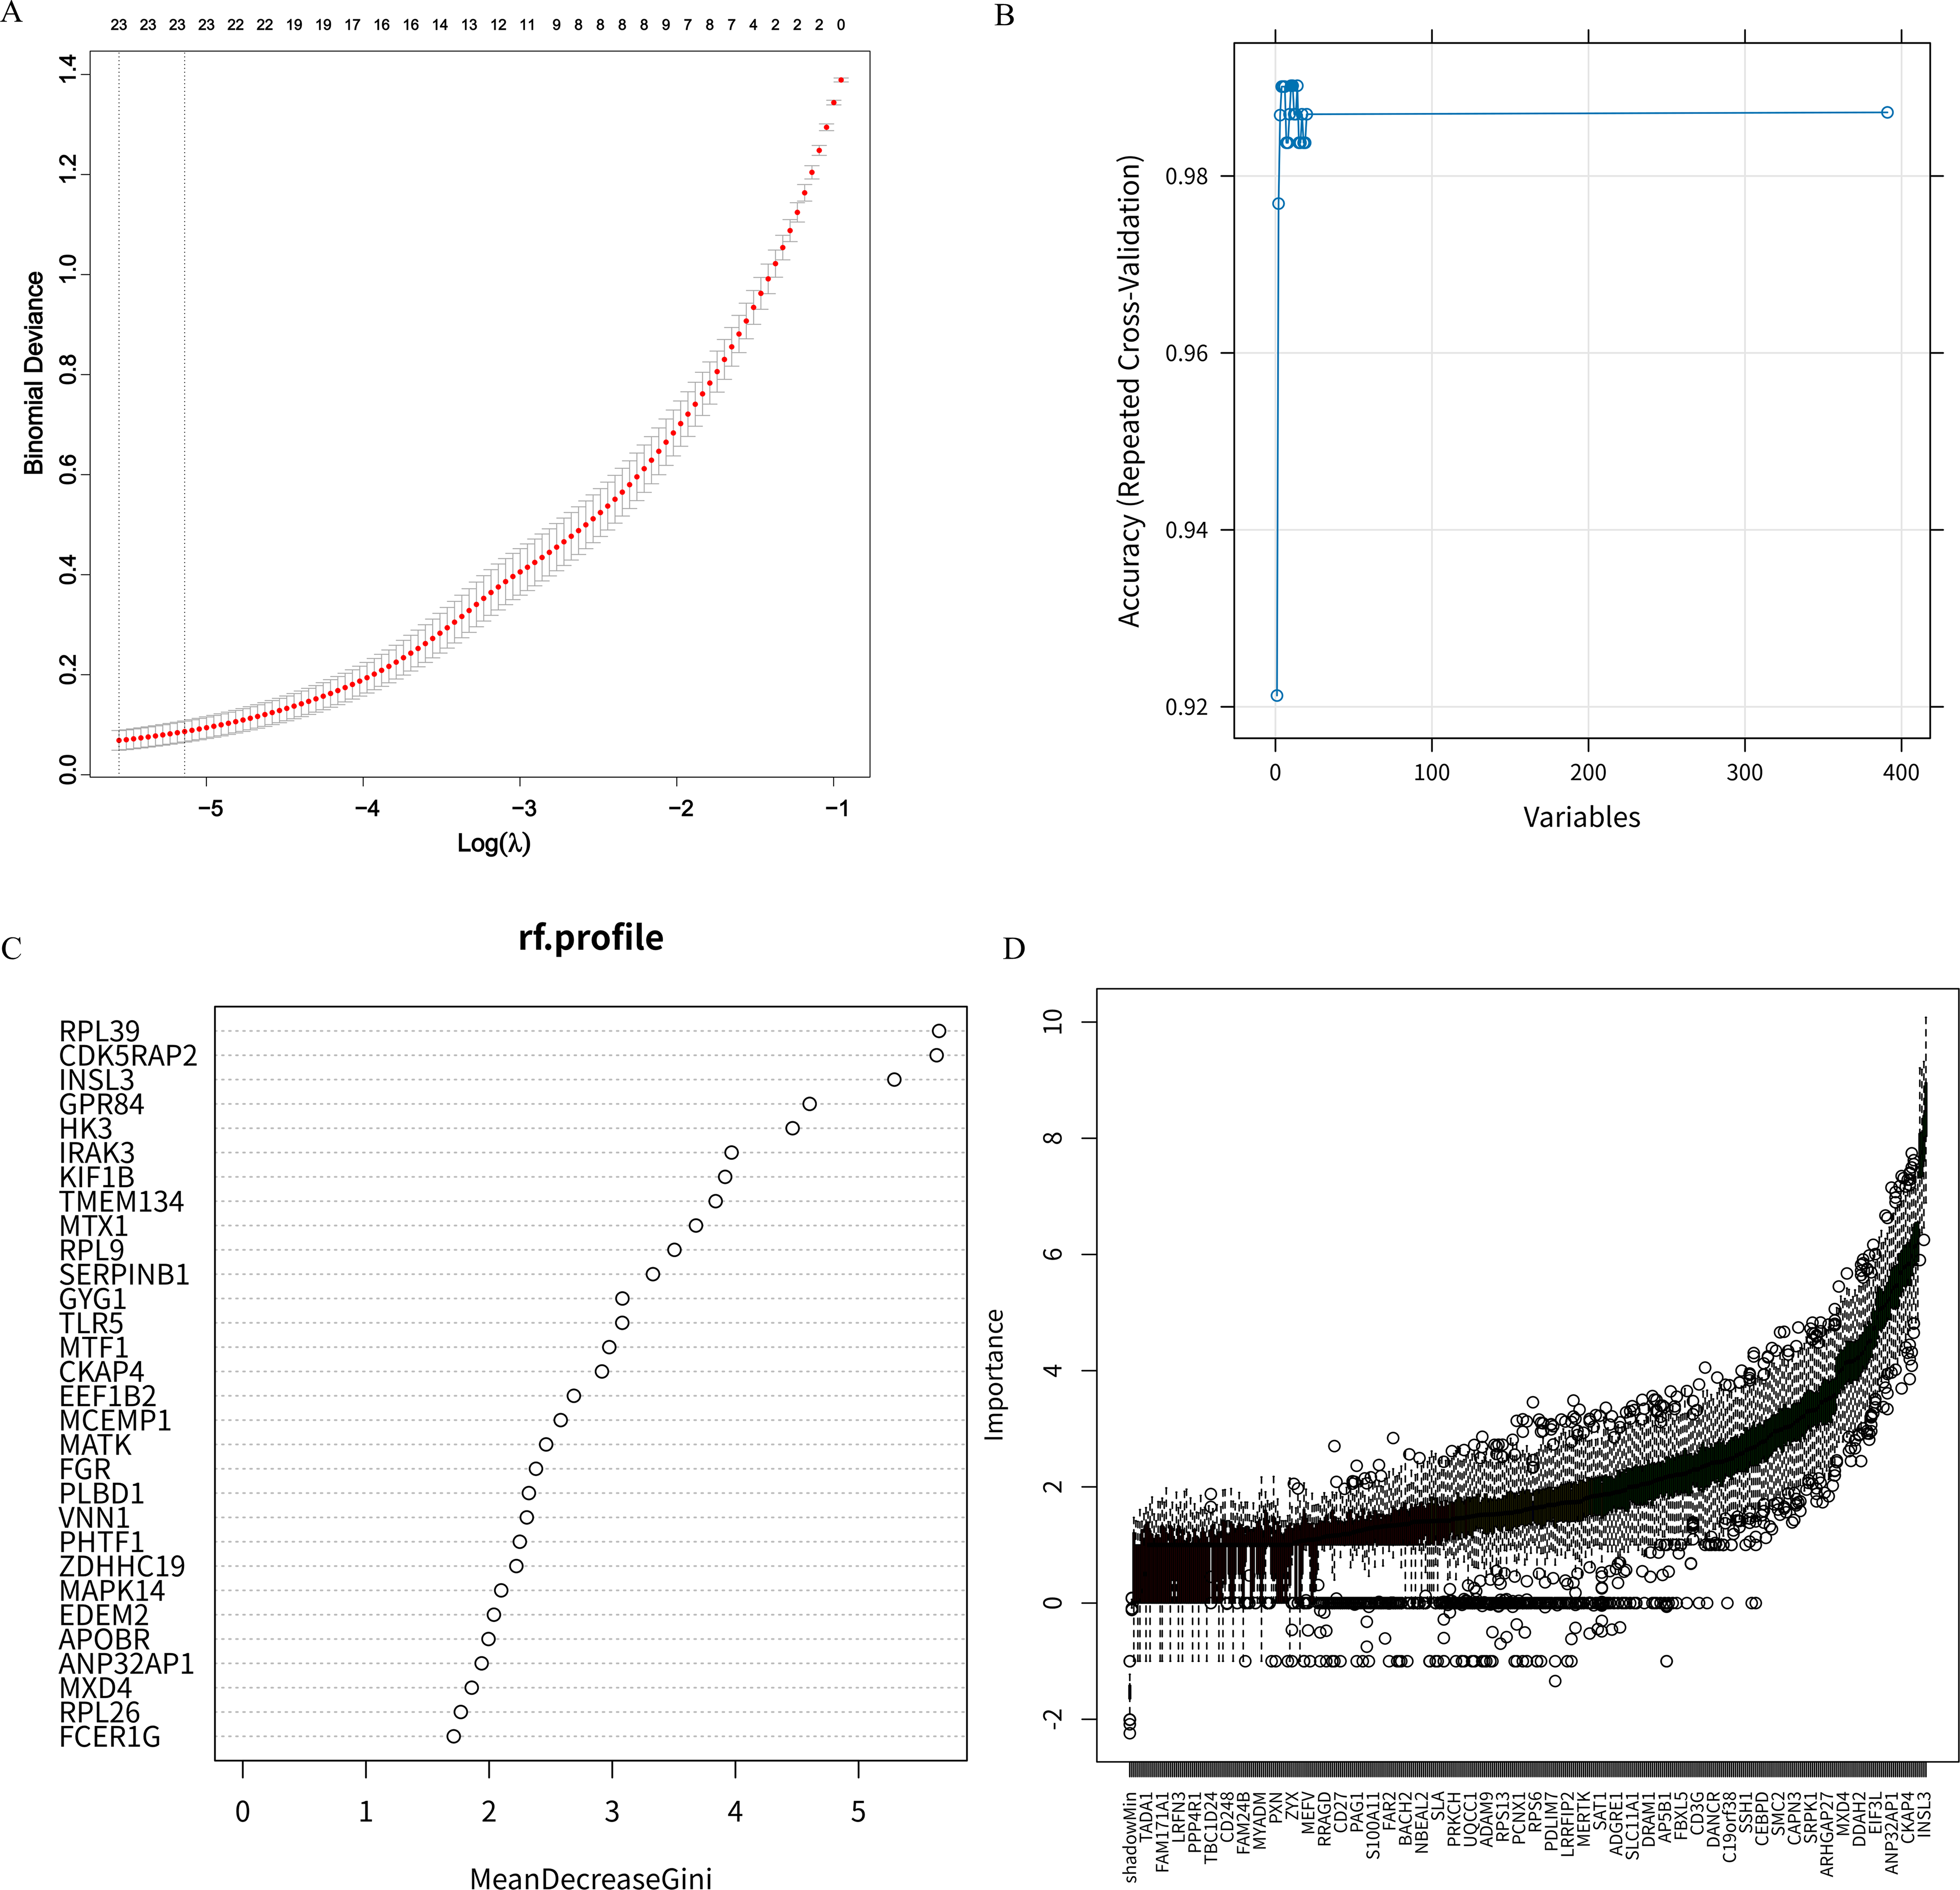
Feature gene selection using machine learning algorithms.
Construction and validation of CAP classification model
We assessed the diagnostic performance of gene models identified by four machine learning algorithms (LASSO, RFE, Boruta, and RF) using an SVM classifier. The results showed that in the training set GSE103119, the ROC-AUC and PR-AUC values of LASSO, RFE, Boruta and RF based on the SVM classifier were all 1 (Fig. 4A and B), indicating that all four methods had good fitting effects on the training set. However, in the GSE196399 validation set, there were significant differences in the generalization performance of the model. The corresponding area under the receiver operating characteristic curve (ROC-AUC) values were 0.913, 0.884, 0.583, and 0.470, and the area under the precision-recall curve (PR-AUC) values were 0.948, 0.940, 0.779, and 0.673 (Fig. 4C and D). Among them, LASSO and RFE performed significantly better than Boruta and RF on the validation set. Based on this, we did not solely rely on the ROC-AUC or PR-AUC of a single dataset for evaluation but instead considered the overall performance of each algorithm in both datasets. Finally, we chose LASSO and RFE, which demonstrated good generalization ability in both the training set and the validation set, for the integration and biological interpretation of the subsequent feature genes.
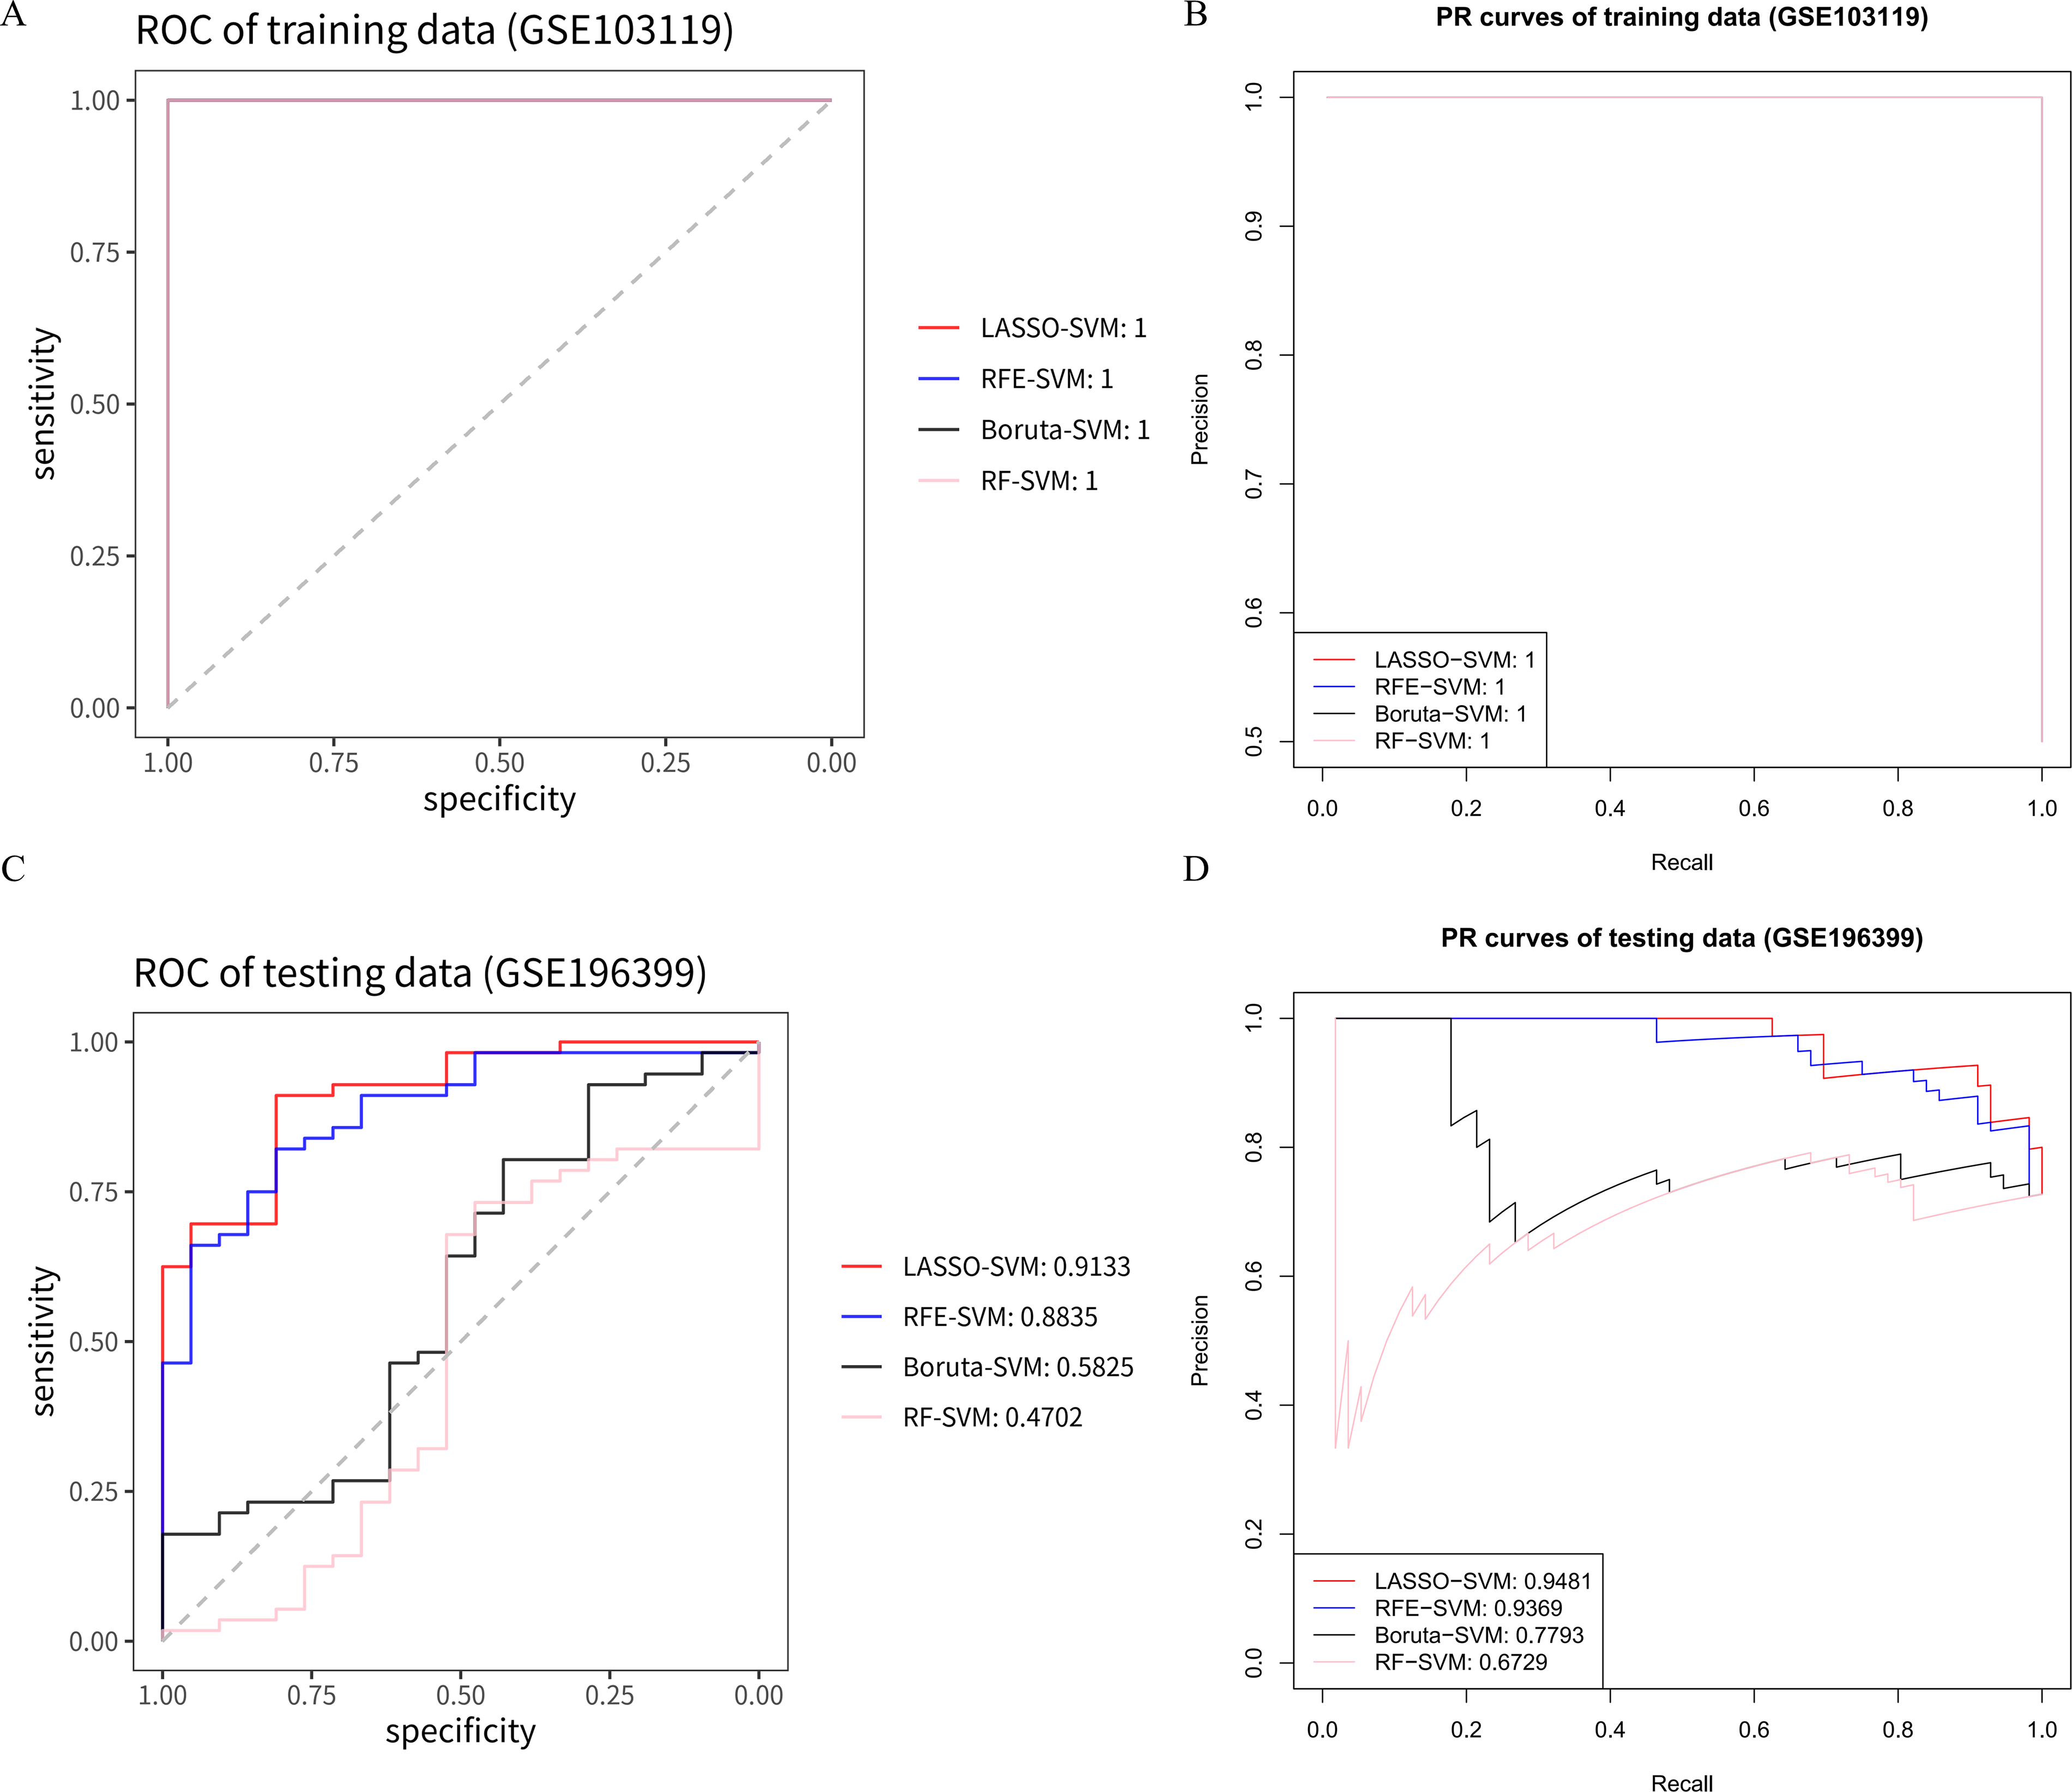
Evaluation of diagnostic performance of gene models determined by four machine learning algorithms (LASSO, RFE, Boruta, and RF) using ROC and PR curves in the GSE103119 training set and GSE196399 testing set. Classification performance is represented by area under the curve (AUC) values based on SVM methods to differentiate patients with CAP from controls.
Screening and experimental verification of the hub genes
Given the strong predictive performance of the model constructed from LASSO and RFE algorithms combined with the SVM classifier, we decided to conduct an analysis using these two methods. By intersecting genes selected by LASSO and RFE, we identified three hub genes: RPL39, INSL3, and VIM (Fig. 5A). The diagnostic performance of the model based on these three hub genes was evaluated using the GSE196399 testing set, yielding an AUC-ROC value of 0.85 for the SVM classifier (Fig. 5B). The AUC-PR value reached 0.99 in this dataset (Fig. 5C). Comparative analysis revealed that INSL3 and VIM were significantly upregulated in CAP compared with normal samples in the GSE103119 dataset, while RPL39 was more highly expressed in the normal group (P < 0.05) (Fig. 5D). Validation using the GSE196399 dataset confirmed that INSL3 and VIM levels were also significantly higher in CAP samples (P < 0.05). Although the difference for RPL39 was not statistically significant, its expression was lower in CAP than in the normal group (Fig. 5E). Thus, the diagnostic model constructed based on these three hub genes demonstrated robust performance in diagnosing CAP.
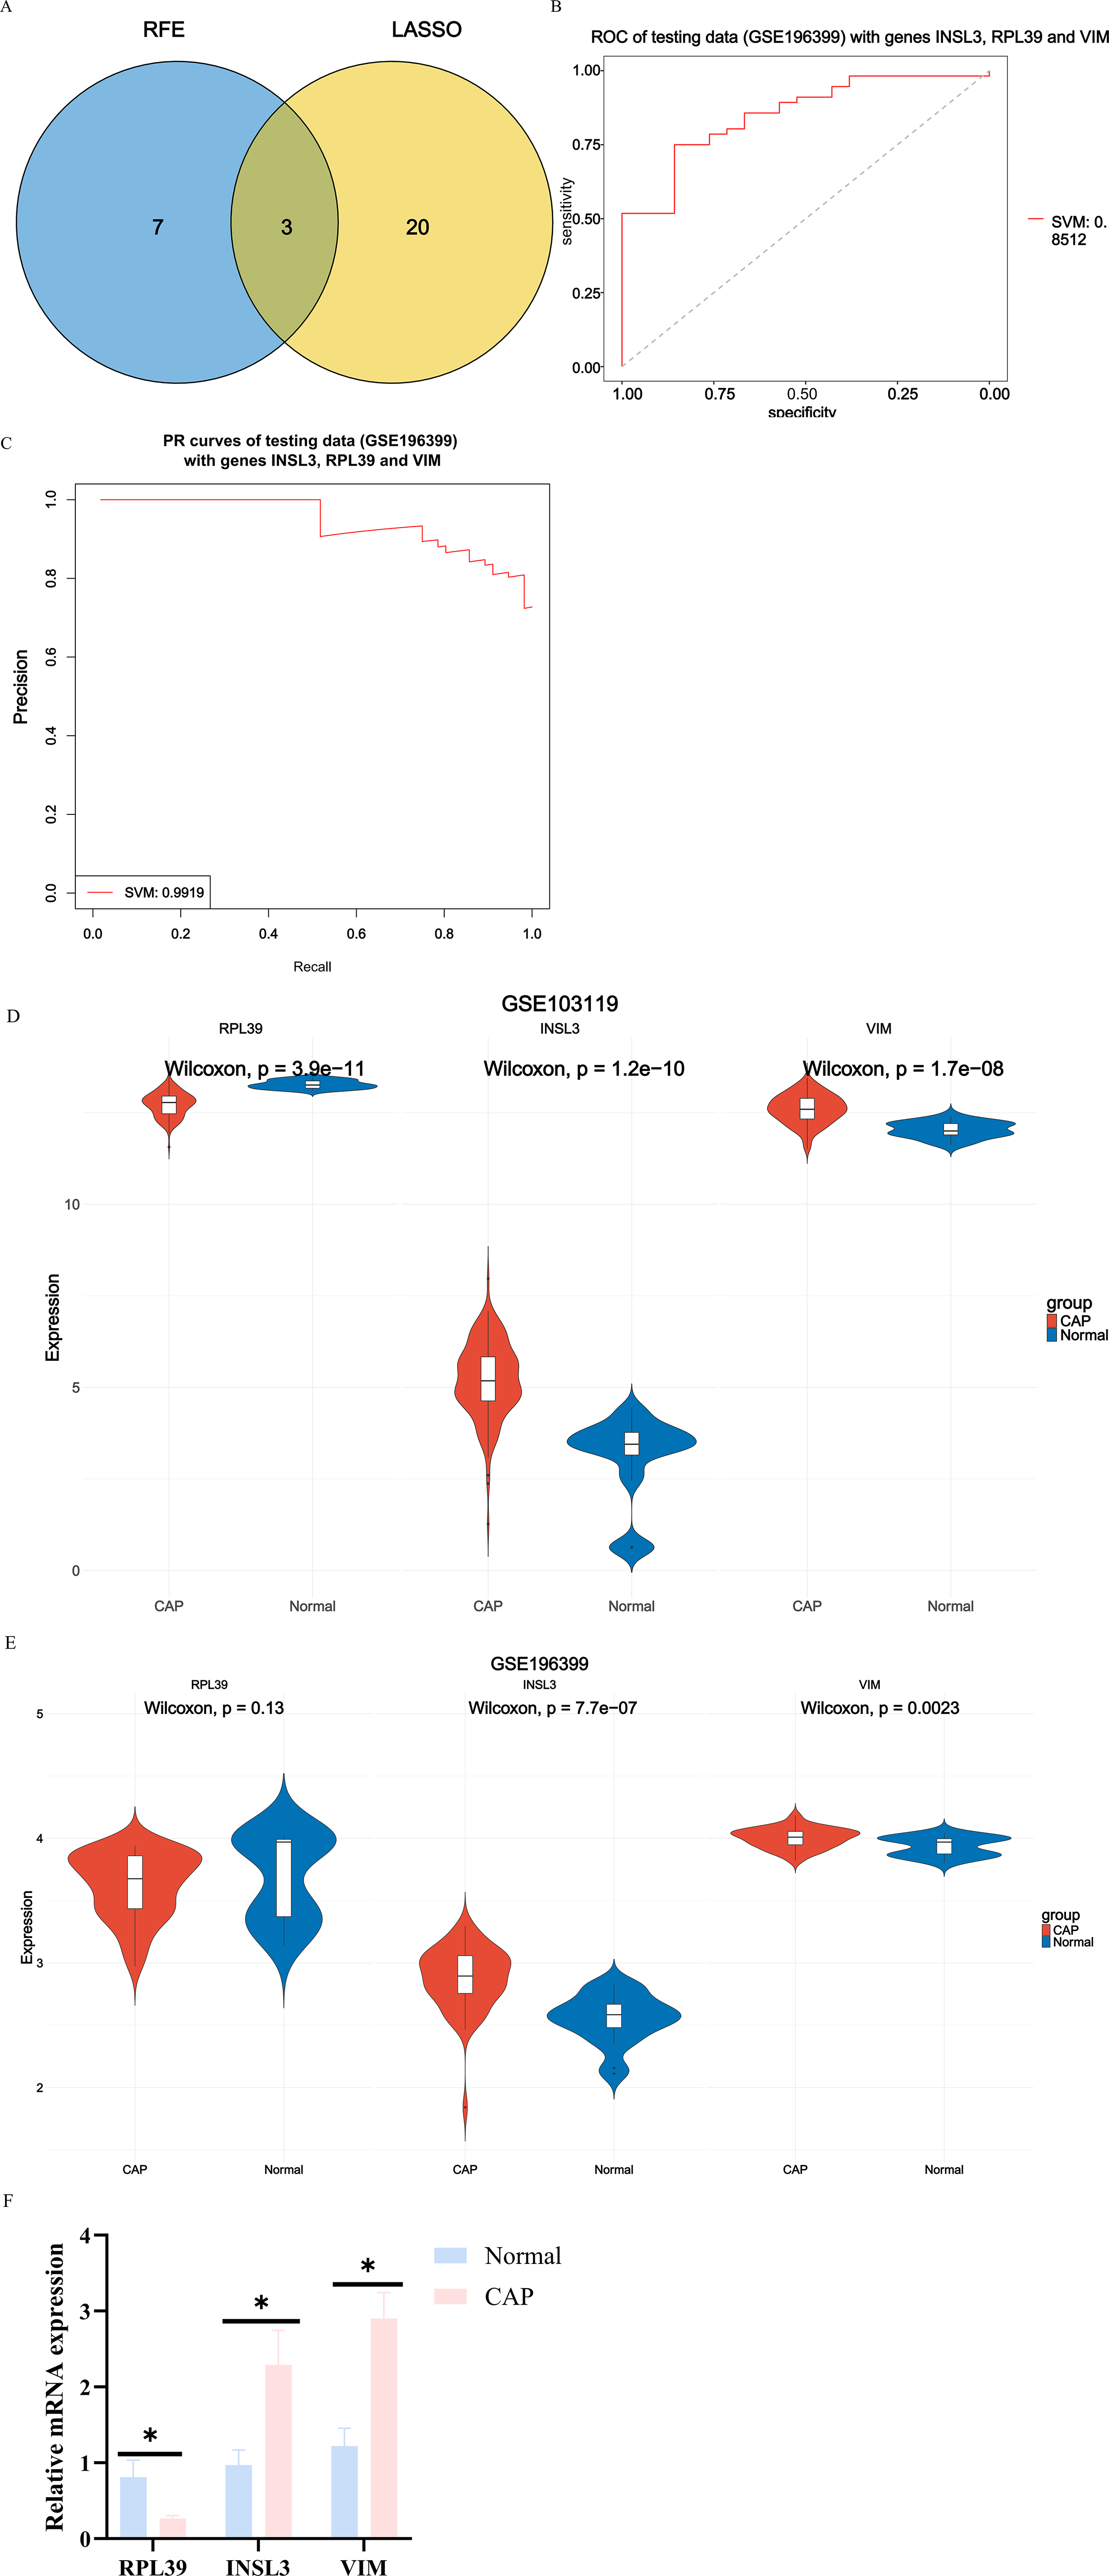
Selection of hub genes based on LASSO and RFE algorithms, and evaluation of diagnostic model.
To verify the expression differences of the three core genes we obtained in CAP, we detected the mRNA expression levels of RPL39, INSL3, and VIM in the blood samples of 5 cases of CAP and 5 healthy controls. The qRT-PCR results showed that compared with the normal group, the expression levels of INSL3 and VIM in the CAP group were significantly upregulated, while the expression level of RPL39 showed a downward trend (P < 0.05) (Fig. 5F). This result suggested that RPL39, INSL3, and VIM may have potential diagnostic value in the occurrence and development of CAP.
Discussion
CAP is a leading cause of morbidity and mortality worldwide, often resulting in significant medical, social, and economic burdens due to misdiagnosis and improper treatment (Mandell, 2015). Early diagnosis of CAP is crucial for effectively alleviating the overall burden associated with this disease (Principi et al., 2017). Inflammasomes may play a pivotal role in the pathogenesis of pneumonia (Xian et al., 2021; Yang et al., 2024). Knockout of NLRP3 can protect mice from acute pneumonia induced by Serratia marcescens by suppressing inflammasome activation and PD-L1/PD-1 (Chen et al., 2024). The precise function of inflammasomes in CAP is yet unknown, though. Therefore, the goal of our work was to construct a diagnostic model by highlighting key inflammasome genes that distinguish patients with CAP from controls through a thorough investigation incorporating differential gene expression, WGCNA, and machine learning techniques. Our research might yield useful biomarkers for CAP diagnosis.
By combining differential expression analysis and WGCNA, we were able to find 414 DEIRGs from GSE103119 and IRGs. Their participation in several cellular signaling networks was demonstrated by this investigation. According to functional studies, these genes are important for immune response-regulating signaling pathways and lung illnesses such as coronavirus. Th17 cell differentiation and autophagy were found to be biological processes linked to CAP by GO and KEGG enrichment analysis. By releasing cytokines such as IL-17, Th17 cells—a subgroup of helper T cells—promote inflammatory reactions. By suppressing B7-H3 expression, miR-29c has been demonstrated to boost Th17 cell activation and proliferation in Mycoplasma pneumoniae pneumonia, aggravating inflammation. Higher Th17 cell counts are associated with worsening disease severity (Li et al., 2019b). Tissue-resident mucosal-associated invariant T cells (MAIT) cells contribute to inflammatory responses by locally inducing IL-17 production in children with CAP (Lu et al., 2020). The autophagy process contributes to the management of inflammatory responses by controlling cytokine release and influencing the construction and activation of inflammasomes (Deretic, 2021; Li et al., 2019a; Zhang et al., 2021). According to one study, autophagy limits inflammasome activity to control inflammation during Chlamydia pneumoniae infection (Crother et al., 2019). Toll-like receptors (TLRs) promote transcription factor Epstein-Barr (virus) (EB)-mediated autophagy, which worsens Mycoplasma pneumoniae infection (Liu et al., 2022). All things considered, our findings point to a high enrichment of DEIRGs in CAP-related pathways, which calls for much research into possible processes behind these enriched pathways and how they contribute to the pathological development of CAP.
The previously found DEIRGs were assessed as possible candidate genes to differentiate between patients with CAP and healthy controls. Four machine learning techniques—LASSO, RF, RFE, and Boruta—were used to identify significant candidate genes and evaluate their diagnostic precision in training and testing datasets. Some transcriptome studies have documented the use of machine learning techniques in CAP research. One research, for instance, predicted the likelihood of death and severity of disease in patients with CAP by combining machine learning with clinical immunology data (Qin et al., 2024). The probability of readmission for patients with CAP after therapy was predicted by Aldhoayan et al. using machine-learning methods (Aldhoayan et al., 2022). Using machine learning methods, we created a CAP diagnosis model for our investigation. Models built from these genes showed better predictive accuracy in the CAP dataset, while LASSO and RFE discovered 23 and 10 feature genes, respectively, according to comparisons of various models. This suggests that genes of substantial utility for the diagnosis of CAP may be found in DEIRGs using both LASSO and RFE methods.
After evaluating the classification performance of different algorithms, we determined that the LASSO and RFE methods performed better in selecting stable characteristic genes. By taking the intersection of the genes obtained from the two algorithms, we finally identified three core genes: VIM, INSL3, and RPL39. Preliminary bioinformatics analysis showed that compared with the healthy control group, the expression of VIM and INSL3 was upregulated in patients with CAP, while the expression of RPL39 was downregulated. To verify these findings, we further collected peripheral blood samples from 5 patients with CAP and 5 healthy controls, and detected the mRNA expression levels of these three genes through qRT-PCR experiments. The experimental results showed that INSL3 and VIM were significantly upregulated in the CAP group, while RPL39 showed a downward trend, which was consistent with the bioinformatics prediction. This result supports the potential role of RPL39, INSL3, and VIM in the development of CAP and suggests their potential as diagnostic biomarkers. Existing literature indicates that vimentin (VIM) plays an important role in the inflammatory response, which can participate in the recognition and binding of pathogens through cell surface receptors and initiate immune responses (Ridge et al., 2022). For example, in chronic hepatitis B, VIM expression increases and can predict the degree of liver fibrosis through a RF model (Wang et al., 2022). In patients with sepsis and septic shock, VIM levels increase, and VIM deficiency can lead to caspase-3 upregulation and the decrease of inflammatory factors (Interleukin-2 (IL-2), interleukin-10 (IL-10), and interferon alpha (IFN-α)), suggesting that VIM regulates lymphocyte apoptosis and inflammatory responses (Su et al., 2019). Our qRT-PCR results are consistent with these studies, suggesting that VIM may have a similar function in the inflammatory process of CAP. Furthermore, existing studies have confirmed that genes of the ribosomal protein family are involved in inflammatory responses (Das et al., 2025; Poddar et al., 2013). As a member of this family, RPL39 (ribosomal protein L39) may possess similar functions, though further direct evidence is still required to support this hypothesis. Insulin-like protein 3 (INSL3) has specific endocrine regulatory functions (Facondo et al., 2020). Currently, although the mechanisms of INSL3 and RPL39 in CAP have not been clearly defined, this study emphasizes their correlation with CAP through cross-method validation. In addition, based on these three genes, the diagnostic model constructed shows good classification performance in ROC and PR curves and can effectively distinguish CAP from healthy controls.
In conclusion, through bioinformatics screening, machine learning modeling, and clinical sample experiments, this study systematically identified VIM, INSL3, and RPL39 as potential diagnostic markers for CAP. All three genes were repeatedly screened as hub genes in differential expression analysis and co-expression networks, suggesting that their expression patterns are closely related to the pathogenesis of CAP and may serve as stable molecular labels for clinical detection. For high-risk populations (such as those with weakened immune function), regular detection of these markers may help detect CAP risks at an early stage, thereby reducing the rate of severe conversion and hospitalization burden. However, this current study still has some limitations. First, this study mainly conducted computational analysis based on retrospective samples, and the available CAP transcriptome dataset is limited, with the training set and validation set covering only a single cohort. Second, the specific biological mechanisms of these genes in CAP still need to be further verified through more functional experiments (such as animal models or larger-scale clinical samples). Future research can further improve the diagnostic accuracy and molecular classification ability of CAP by expanding the sample size, integrating multi-omics data, and adopting more complex algorithm strategies.
Authors’ Contributions
J.Z. and L.L. conceived and designed the study and contributed to the article drafting. C.Z. and D.Y. collected the data and analyzed and interpreted the data. J.Z. and Q.C. performed the statistical analysis and revised the article critically. All the authors read and approved the final article.
Footnotes
Author Disclosure Statement
The authors declare that they have no conflicts of interest with the contents of this article.
Funding Information
No funding was received for this article.
Availability of Data and Materials
The data and materials in the current study are available from the corresponding author on reasonable request.
Ethics Approval and Consent to Participate
The collection of clinical samples and related experiments was conducted per the ethical requirements of the Medical Ethics Committee of Zhuji Affiliated Hospital of Wenzhou Medical University, approval number [2024]1212.