
Abstract
Purpose:
This study aims to identify potential biomarkers for diabetic retinopathy (DR) by focusing on genes associated with mesenchymal stem cell-derived exosomes (MSCs-Exo).
Methods:
By integrating DR transcriptome data with the protein dataset of MSCs-Exo, we utilized a comprehensive array of bioinformatics techniques, including weighted gene coexpression network analysis, Mfuzz clustering, and machine learning algorithms such as least absolute shrinkage and selection operator regression and random forest to pinpoint key genes. Functional mechanisms were explored through functional enrichment analysis, immune infiltration, and single-cell RNA sequencing. The immunohistochemistry and Western blotting were used for validation on DR mice models.
Results:
Our comprehensive analysis identified 16 hub genes associated with MSCs-Exo. Through the application of interpretable machine learning techniques, YBX1 and PSMA7 were further identified as central genes within this network. A predictive diagnostic model for DR was developed and validated using receiver operating characteristic curve analysis, which demonstrated modest diagnostic efficacy, as indicated by an area under the curve exceeding 0.7. Importantly, experimental validation showed that the protein expression levels of YBX1 and PSMA7 were significantly reduced in the retinal tissues of DR mice compared with the control group (P < 0.05). Functional enrichment analysis suggested that YBX1 and PSMA7 are involved in critical biological processes, specifically the regulation of protein and amino acid metabolism. In addition, immune infiltration results show that they are significantly associated with the immune dysregulation of DR, especially in CD4T memory cells. Single-cell analysis also supported the above finding.
Conclusion:
These findings suggest that YBX1 and PSMA7, derived from MSCs-Exo, may serve as potential biomarkers for DR. Further studies are needed to confirm their clinical utility and therapeutic relevance.
Keywords
Introduction
Diabetic retinopathy (DR), a prevalent microvascular complication associated with diabetes mellitus (DM), has become the foremost cause of irreversible vision impairment among the global working-age demographic and the elderly population.1–5 The early detection of DR presents significant challenges, largely attributable to its subtle onset and the inadequacies of existing screening techniques, especially the absence of early, specific diagnostic biomarkers.6,7
In terms of treatment, the predominant current modalities encompass intravitreal injections of antivascular endothelial growth factor (VEGF), retinal laser photocoagulation, and vitrectomy.8,9 While these interventions can decelerate disease progression, they are primarily directed toward advanced proliferative DR or diabetic macular edema. These treatments are invasive, impose a substantial treatment burden, and are limited in their ability to reverse established retinal neurovascular damage. Additionally, their efficacy varies significantly among individuals. 6 Consequently, there is a critical scientific and clinical imperative to elucidate the molecular and cellular mechanisms underpinning the pathogenesis and progression of DR, to identify highly sensitive and specific early biomarkers, and to develop novel therapeutic targets that address key pathogenic pathways. Such advancements are essential for facilitating early detection, precise intervention, and effective management of DR.
The utilization of mesenchymal stem cell-derived exosomes (MSCs-Exo) in the context of DR is attracting increasing scholarly interest.10–12 MSCs-Exo exhibit a range of critical functions, including vascular repair, anti-inflammatory effects, neuroprotection, and immunomodulation.13–15 Notably, in comparison to stem cell therapy, exosomes, being acellular, effectively mitigate risks such as tumorigenicity and immune rejection and possess the capability to traverse the blood–retinal barrier. In a rat model of retinal ischemia, the intravitreal administration of MSCs-Exo 24 h postischemia significantly improved functional recovery and reduced neuroinflammation and apoptosis. 16 Prior research has demonstrated that MSCs-Exo can decrease retinal vascular leakage in DR animal models without incurring the risk of fibrosis. 17 Nonetheless, the precise molecular mechanisms and key targets through which MSCs-Exo exert therapeutic effects in DR remain to be elucidated.
Therefore, this research endeavors to utilize the perspective of MSCs-Exo by employing a range of bioinformatics techniques—including weighted gene coexpression network analysis (WGCNA), Mfuzz clustering, and machine learning approaches such as least absolute shrinkage and selection operator (LASSO) regression and random forest (RF)—to identify key exosome-related molecules linked with DR in the context of mesenchymal stem cells. Additionally, this study aims to develop a diagnostic model. The objective is to lay the groundwork for the translational application of MSCs-Exo in the treatment of DR and to enhance understanding of the pathogenesis and early diagnosis of this condition.
Experimental Procedures
Data sources
Detailed information on the datasets analyzed in this study is provided in Table 1. The dataset pertaining to mesenchymal stem cell exosomes was sourced from the ExoCarta Database, while all RNA transcriptome datasets were obtained from the Gene Expression Omnibus (GEO) database. The analytical workflow employed in this study is depicted in Figure 1.
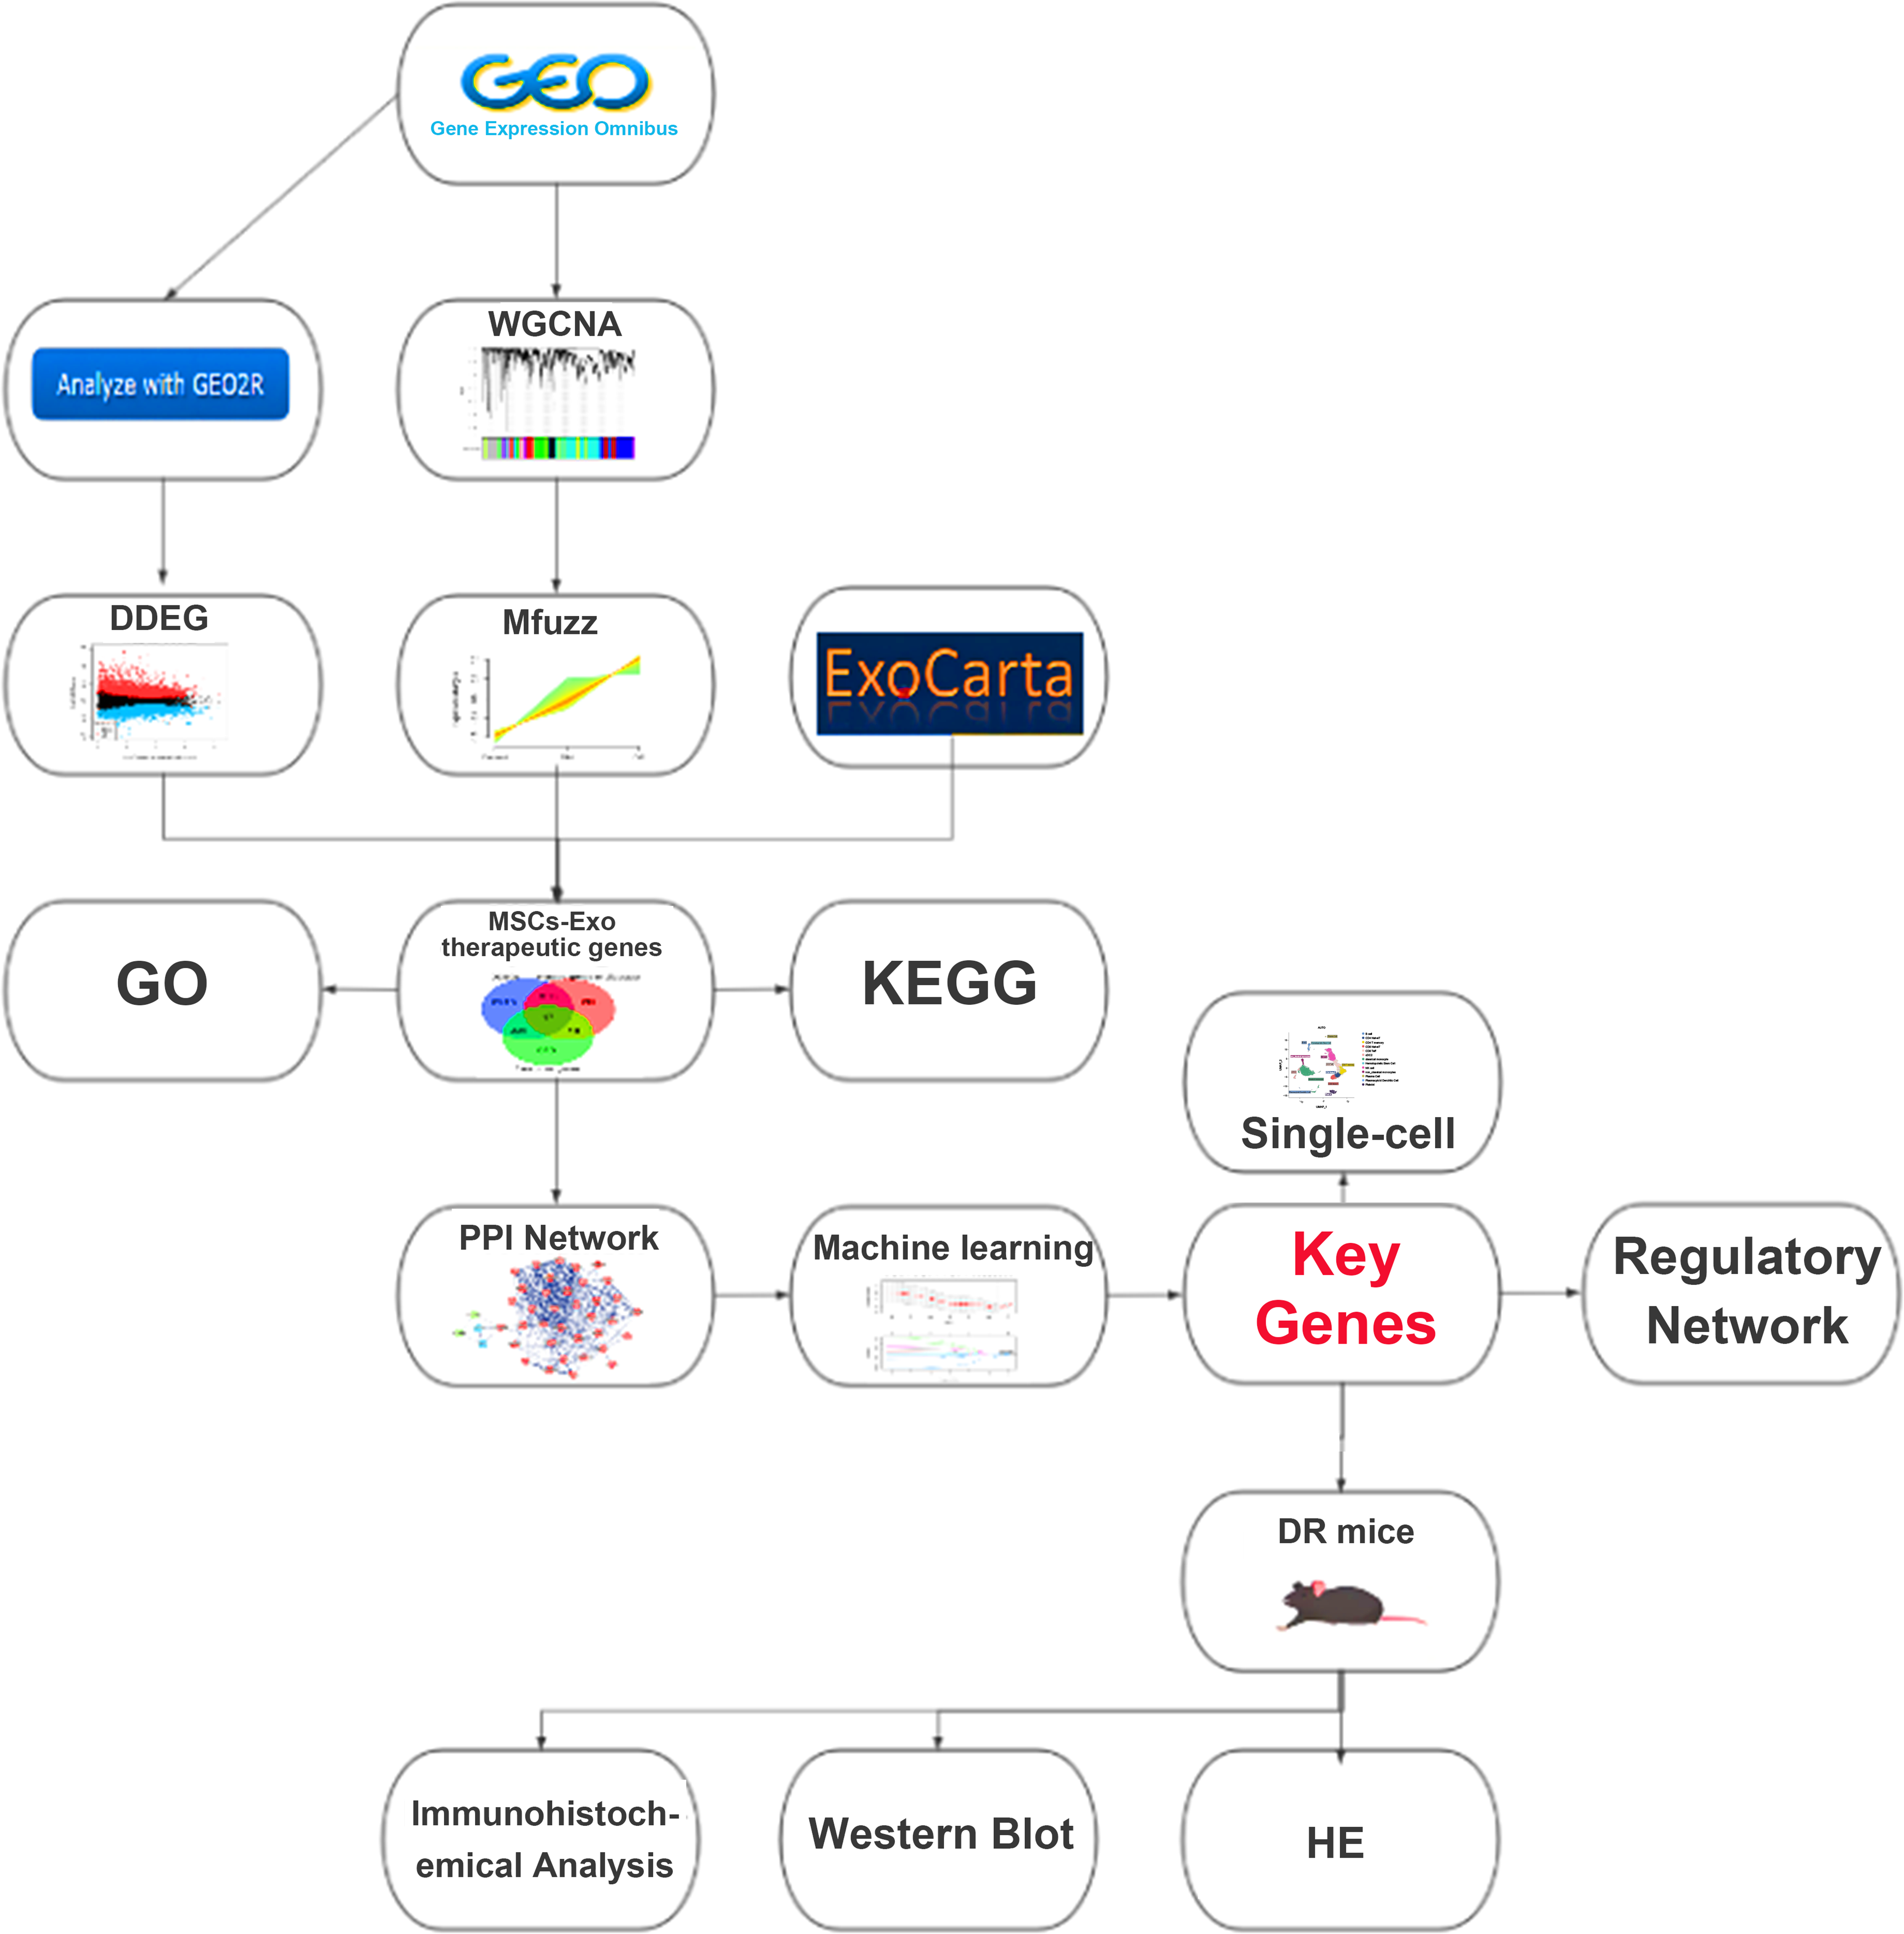
The flowchart of the study. DR, diabetic retinopathy; H&E, hematoxylin and eosin; MSCs-Exo, mesenchymal stem cell-derived exosomes; PPI, protein–protein interaction; WGCNA, weighted gene coexpression network analysis.
Details of the Datasets
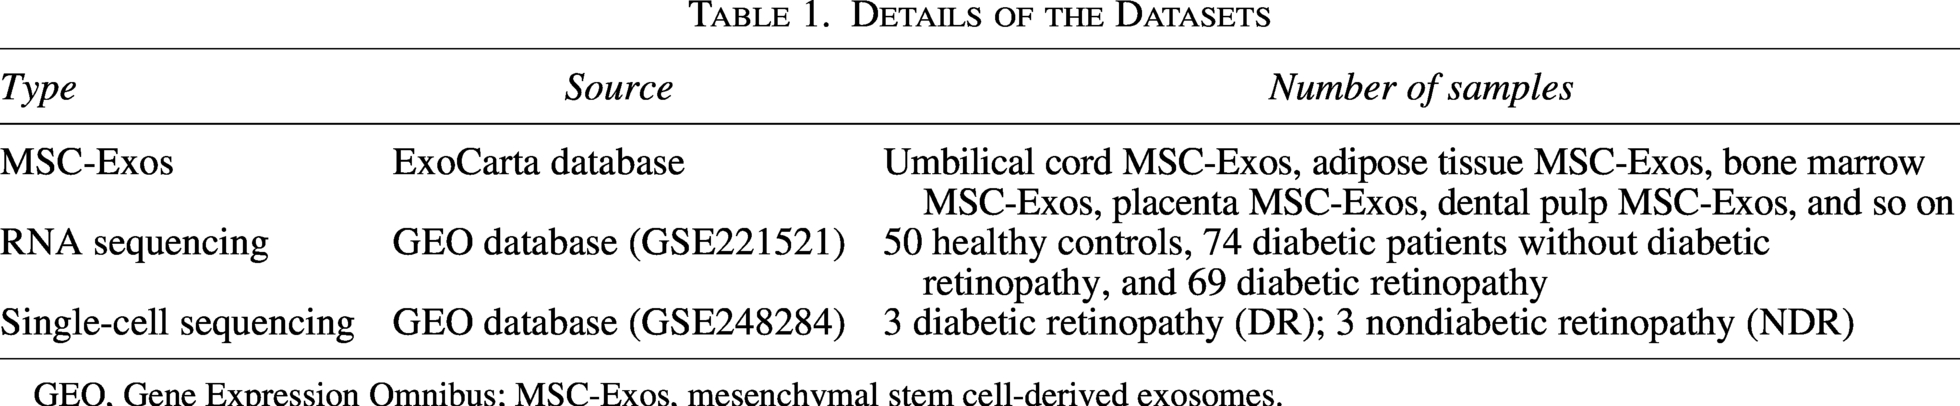
GEO, Gene Expression Omnibus; MSC-Exos, mesenchymal stem cell-derived exosomes.
Weighted gene coexpression network analysis
The WGCNA was conducted utilizing the R package “WGCNA.” Initially, hierarchical clustering was employed to identify and eliminate potential outlier samples. Subsequently, the pickSoftThreshold function was utilized to ascertain an appropriate soft-thresholding power (β) to approximate a scale-free network topology. This procedure resulted in the generation of an adjacency matrix, which was subsequently transformed into a topological overlap matrix (TOM). Genes exhibiting similar expression patterns were clustered into distinct modules through average linkage hierarchical clustering based on the TOM dissimilarity measure.
Mfuzz clustering analysis
Soft clustering was performed utilizing the “Mfuzz” package in R. Initially, the mean protein expression values for each stage—control, DM, and DR—were calculated. These values were subsequently input into the fuzzy c-means algorithm, which yielded distinct protein clusters, each exhibiting a unique dynamic expression pattern across the stages.
Differential expression gene analysis
The GEO2R online tool facilitated the normalization and preprocessing of RNA transcriptome data, as well as the identification of differentially expressed genes (DEGs) between comparison groups. DEGs were defined as those genes with an adjusted P value of <0.05.
Functional enrichment analysis
Functional enrichment analyses, including GO analyses encompassing biological processes, cellular components, and molecular functions, as well as KEGG pathway analyses, were conducted using the R package “clusterProfiler.” Furthermore, gene set enrichment analysis (GSEA) was employed to perform pathway enrichment analysis from a systems biology perspective.
Protein–protein interaction network analysis
The protein–protein interaction (PPI network for the identified genes was constructed utilizing the STRING database, and the resulting network was visualized through Cytoscape software. To identify hub genes within the PPI network, the cytoHubba plugin in Cytoscape was employed.
Machine learning and SHapley Additive exPlanations analysis
Novel analytical approaches, specifically machine learning algorithms, were applied to identify key genes. The LASSO regression algorithm and the RF algorithm were implemented to screen for pivotal genes. Furthermore, five distinct machine learning algorithms—voting, XGBoost, AdaBoost, Naïve Bayes, and artificial neural network (ANN)—were used to develop diagnostic models. The robustness of the predictive capability of the key genes and the diagnostic models was assessed using receiver operating characteristic (ROC) curves. SHapley Additive exPlanations (SHAP) values were calculated to evaluate the overall feature importance within the model that demonstrated the best predictive performance.
Immune infiltration and single-cell analysis
The CIBERSORT tool, employing a gene expression-based deconvolution algorithm, was utilized to assess the relative proportions of 22 infiltrating lymphocyte subtypes in each sample group. Single-cell data (GSE248284) were processed with the “Seurat” R package. Quality-controlled data were converted into Seurat objects. PCA was performed on the top 2,000 highly variable genes, followed by UMAP for dimensionality reduction and clustering. Cell–cell communication was analyzed using the “CellphoneDB” package.
Construction of transcription factor–messenger RNA–microRNA–long noncoding RNA network
To elucidate the molecular mechanisms underlying the disease, a comprehensive transcription factor (TF)–messenger RNA (mRNA)–microRNA (miRNA)–long noncoding RNA (lncRNA) network was established. Initially, the RegNetwork and JASPAR databases were employed to investigate TF–mRNA interactions, with interactions deemed valid only if consistently identified by both resources. Subsequently, the miRNet and StarBase databases facilitated the identification of miRNA–mRNA and lncRNA–miRNA interactions, respectively, maintaining the criterion of consistent identification across both platforms for validation.
Drug–gene interaction analysis
To identify potential therapeutic targets, network-based proximity between pharmacological agents and disease-associated proteins was analyzed. The algorithm developed by Emre Guney et al. was utilized to compute a drug-disease proximity metric, specifically the distance (d) and the corresponding relative proximity (z-score), which quantify the network relationships between drugs and proteins encoded by disease-related genes. Finally, a drug–gene interaction network was visualized to pinpoint potential pharmacological agents targeting the critical genes.
Genes expression validation
This retrospective study enrolled four DR patients and four non-DR subjects at the First Affiliated Hospital of Guilin Medical University (February to March 2026). Peripheral blood samples were obtained from the hospital biobank. Written informed consent was provided by all participants. The study was approved by the hospital’s Ethics Committee (approval no. 2025IITLL-26) and adhered to the tenets of the Declaration of Helsinki. RNA was extracted from peripheral blood using TRIzol reagent (Invitrogen, USA). Complementary DNA was synthesized using a First-Strand Synthesis kit (Yugong Biotechnology, Jiangsu, China). qRT-PCR was performed to detect YBX1 and PSMA7 expression. The primer sequences were as follows: PSMA7 forward: 5′-TGACGAAGCCATTGAAAC-3′, reverse: 5′-TGCCACCTGACTGAACCA-3′; YBX1 forward: 5′-AGAAGTGATGGAGGGTGCTG-3′, reverse: 5′-GCTGTCTTTGGCGAGGAG-3′; β-actin forward: 5′-TGGACTTCGAGCAAGAGATG-3′, reverse: 5′-GAAGGAAGGCTGGAAGAGTG-3′. Relative expression was calculated using the 2−ΔΔ Ct method. PCR conditions were as follows: initial denaturation at 95°C for 30 s, followed by 40 cycles of 95°C for 10 s and 60°C for 30 s.
Establishment of a DR mouse model
Male C57BL/6J mice (6–8 weeks, 18–24 g) were obtained from Tianqin Biotechnology Co. All procedures were approved by the Animal Ethics Committee of Guilin Medical University (approval no. GLMU-IACUC-20251099) and adhered to the Association for Research in Vision and Ophthalmology statement. The DR model was induced by intraperitoneal injection of streptozotocin (55 mg/kg) for five consecutive days. Control mice received citrate buffer alone. Successful model establishment was defined by random blood glucose ≥16.7 mmol/L on three consecutive measurements. The study included a control group (n = 6) and a DR group (n = 6), assessed at 3 months post-modeling.
Histological assessment of DR
Three months post-modeling, mouse eyeballs were enucleated, fixed, embedded in paraffin, and sectioned (4 μm thickness). Sections were stained with hematoxylin and eosin (H&E) for histopathological evaluation.
Immunohistochemistry
Paraffin sections were deparaffinized, rehydrated, and subjected to antigen retrieval in citrate buffer (pH 6.0). After blocking endogenous peroxidase, sections were incubated overnight at 4°C with primary antibodies against YBX1 (1:200; Hua An Biotech, China) or PSMA7 (1:1000; Hua An Biotech), followed by HRP-conjugated secondary antibody (San Ying, China). Color was developed using DAB (ZSGB-BIO, China), and sections were counterstained with hematoxylin.
Western blotting analysis
Retinal tissues were homogenized in RIPA buffer (Solarbio, Beijing, China) with protease inhibitors (Solarbio). Protein concentration was measured using a BCA kit (Epizyme, Shanghai, China). Equal amounts of protein (30 μg) were separated by 10% SDS-PAGE and transferred to PVDF membranes (Millipore, USA). Membranes were blocked using a rapid blocking buffer (Epizyme) and then incubated overnight at 4°C with primary antibodies against YBX1 (1:2000; Hua An Biotech, China), PSMA7 (1:10000; Hua An Biotech), or β-actin (1:4000; San Ying, China). After incubation with HRP-conjugated secondary antibody (1:4000; San Ying), protein bands were visualized using a chemiluminescence detection kit (Epizyme). Band intensities were quantified using ImageJ software and normalized to β-actin.
Statistical analysis
Accordingly, comparisons between two groups were performed using Student’s t-test, with statistical significance determined at a P value threshold of <0.05. Statistical analyses were conducted utilizing GraphPad Prism 8 software (GraphPad Software, Inc., USA).
Results
Identification of disease-associated genes in DR
WGCNA was utilized to identify gene modules associated with DR. The soft-thresholding power β was set to 10 (refer to Fig. 2A). The dynamic tree cut algorithm identified 12 distinct gene modules (refer to Fig. 2B), with their correlations illustrated in Figure 2C. As depicted in Figure 2D, six modules (blue, brown, green, grey, pink, and red) demonstrated significant correlations with DR. To further identify genes associated with DR traits, Mfuzz pseudo-time series cluster analysis was conducted. Genes were grouped into six distinct clusters based on progressive disease severity (control, DM, and DR; refer to Fig. 3A–F). The findings indicated that Cluster 3 and Cluster 4 exhibited consistent trends with disease severity, where gene expression was progressively more impaired with increasing disease severity. Therefore, the genes of Clusters 3 and 4 were identified as related genes for DR (they were in total of 636, and detailed information is provided in Supplementary Table S1).
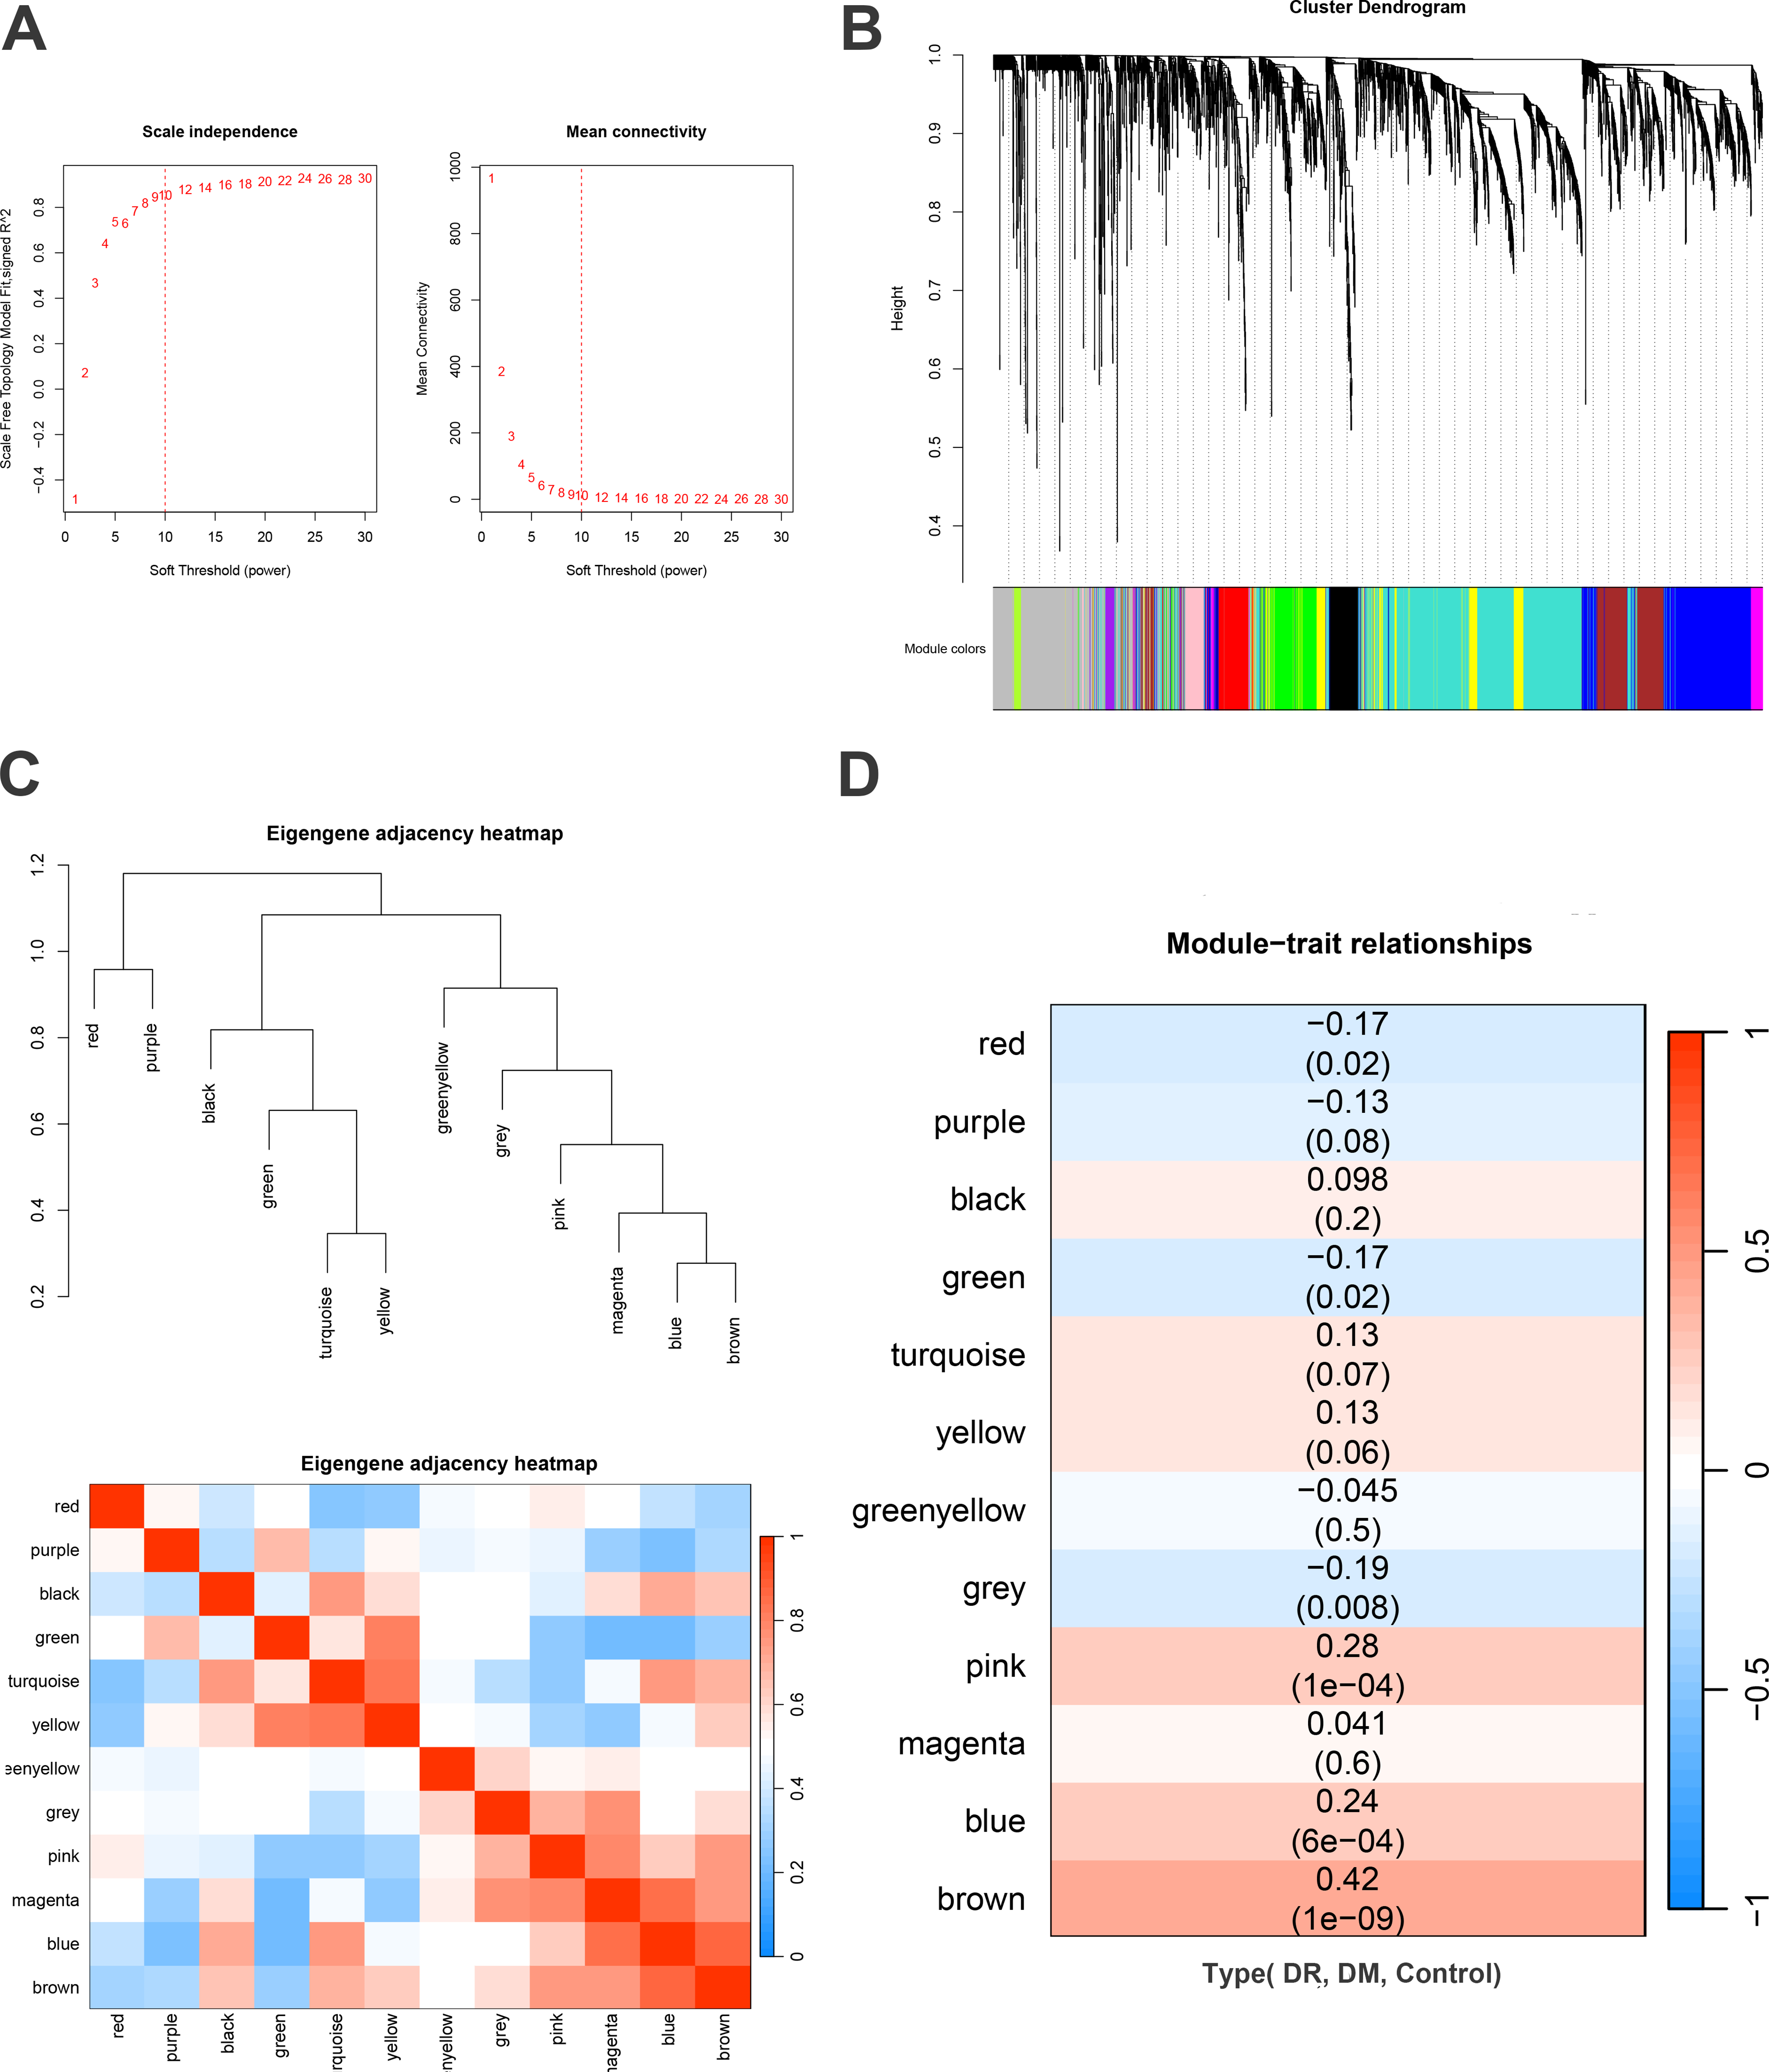
WGCNA analysis.
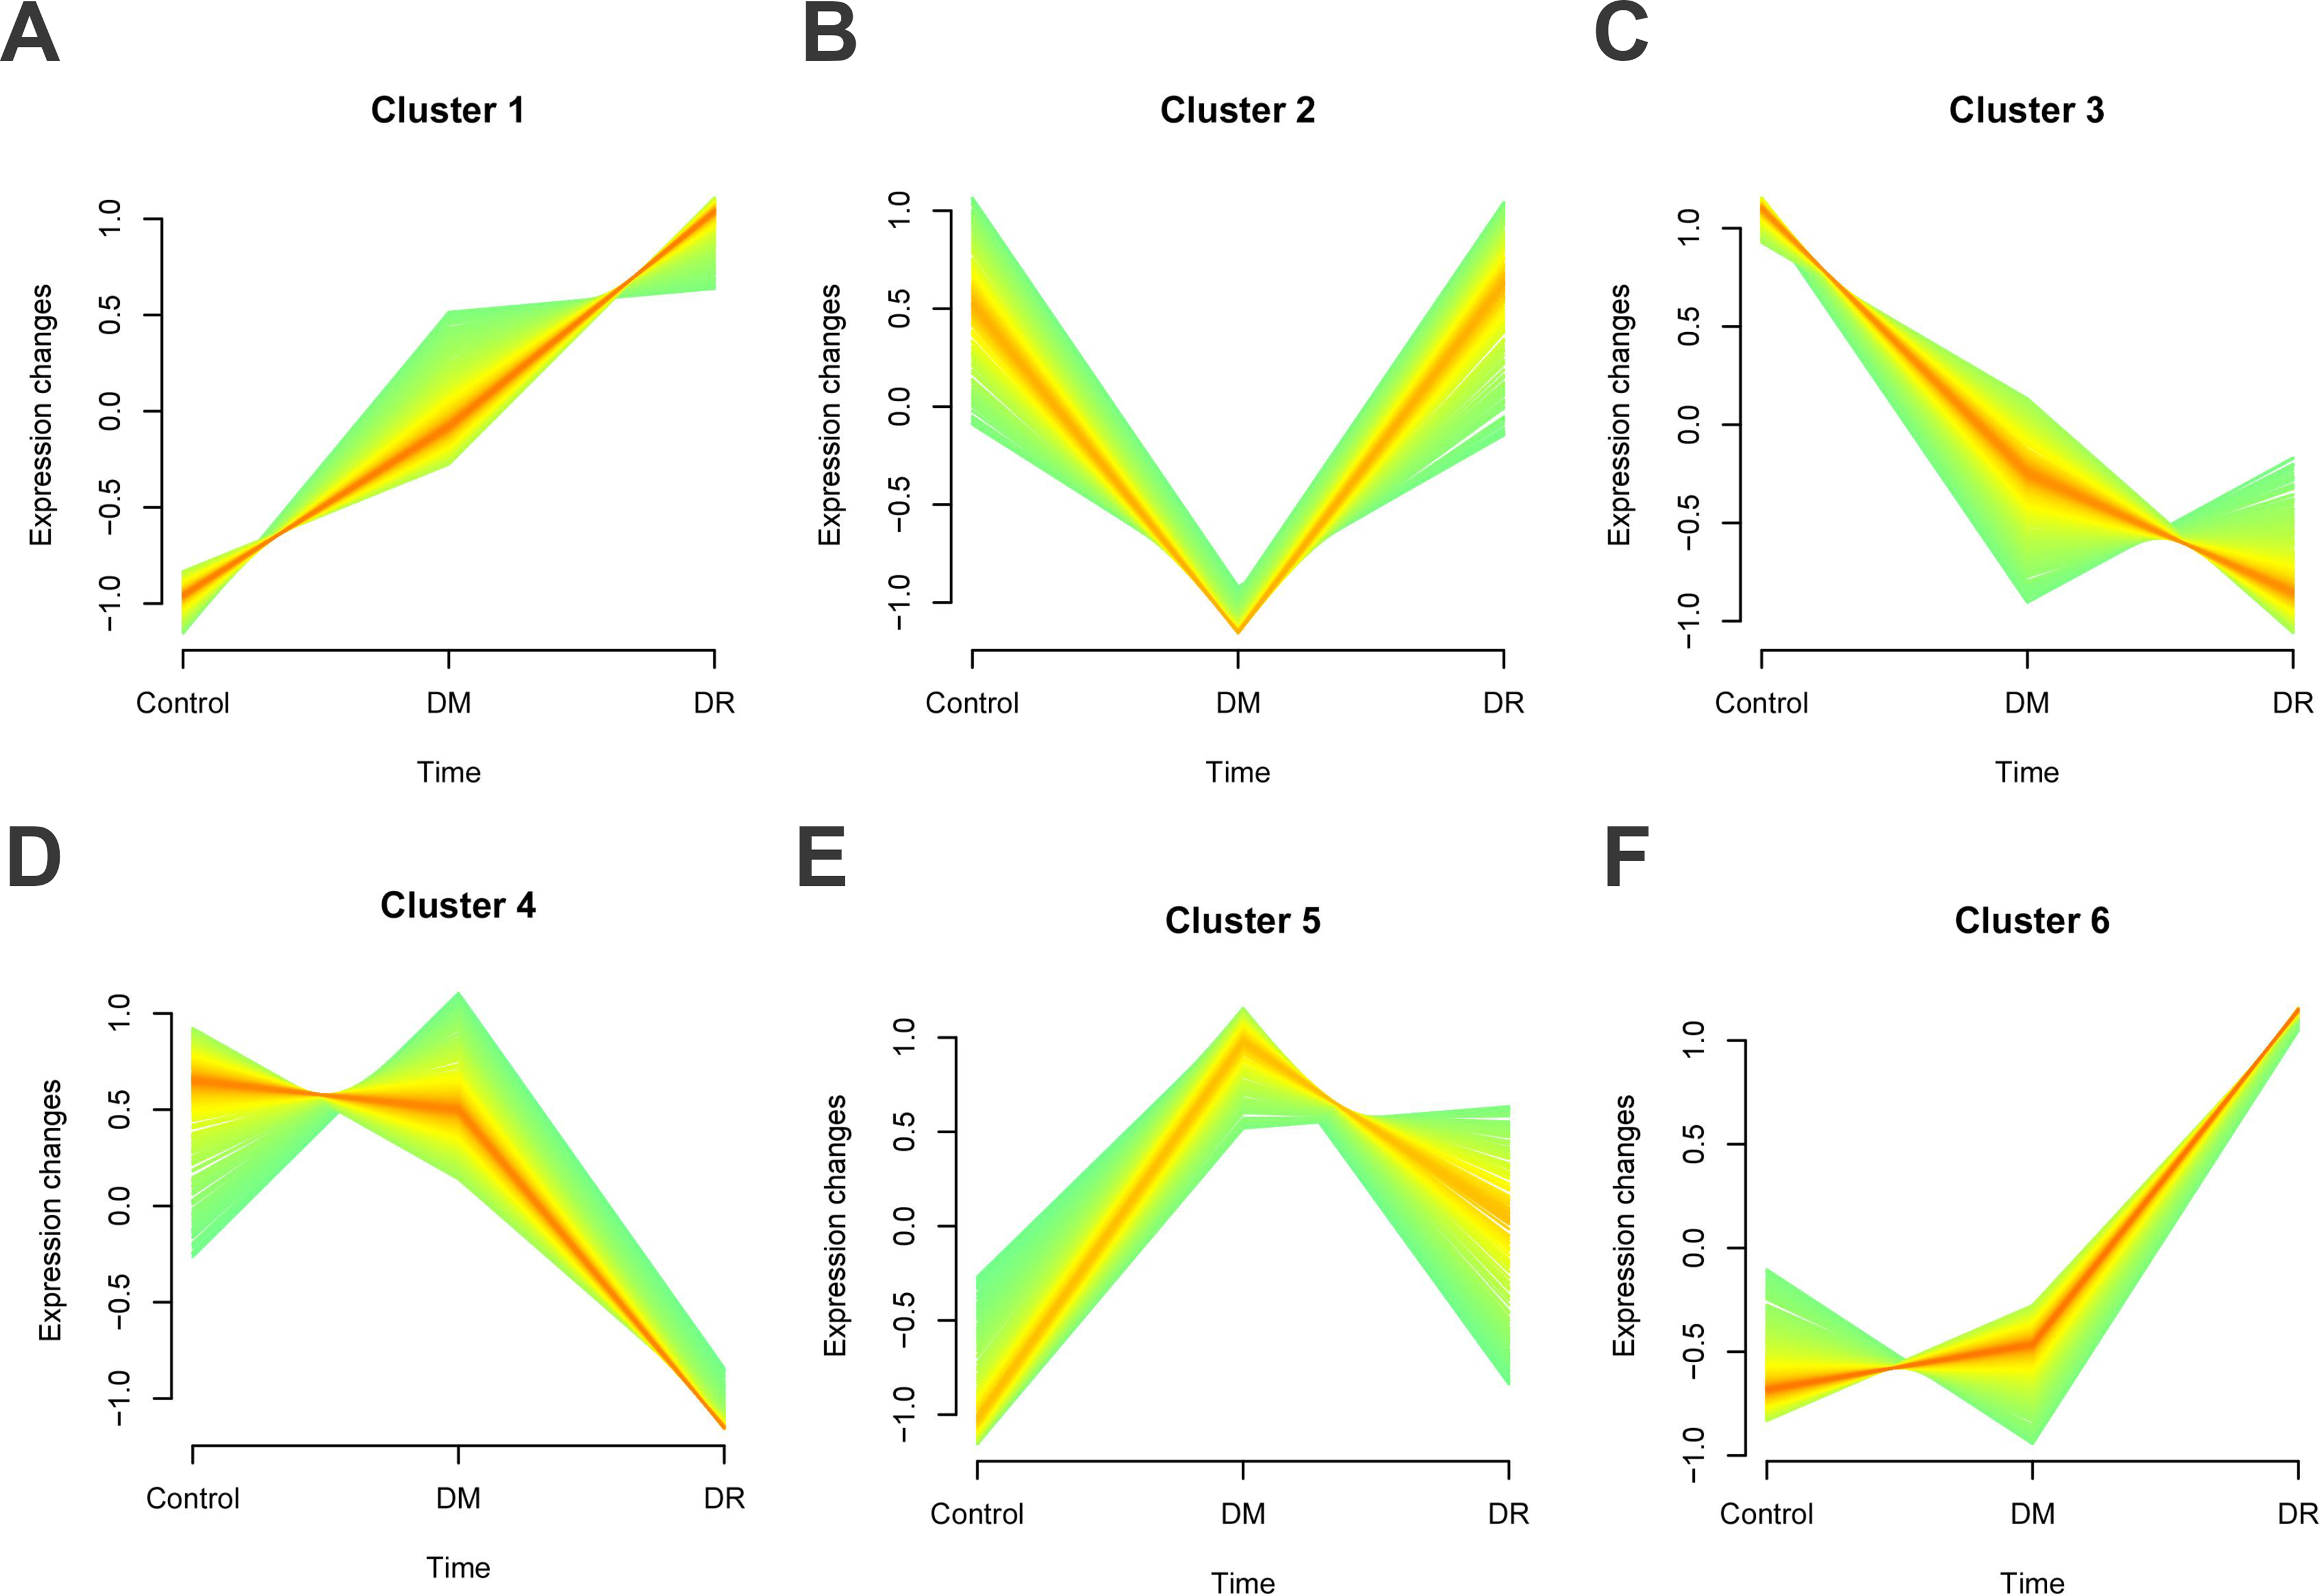
Mfuzz cluster analysis illustrated six different clusters in the process of DR development from the MSCs-Exo therapeutic genes
Identification of MSCs-Exo-related therapeutic genes for DR
Figure 4A presents the normalized expression profile dataset GSE221521 related to DR. Differential expression analysis was conducted utilizing the GEO2R tool, resulting in the generation of a volcano plot depicting the gene expression data (Fig. 4B). This analysis led to the identification of 6,872 potentially protective downregulated genes. Additionally, a protein dataset for MSCs-Exo, consisting of 938 proteins, was sourced from the ExoCarta database. Through cross-referential analysis, we identified 47 therapeutic genes associated with DR that are related to MSCs-Exo (Fig. 4C).
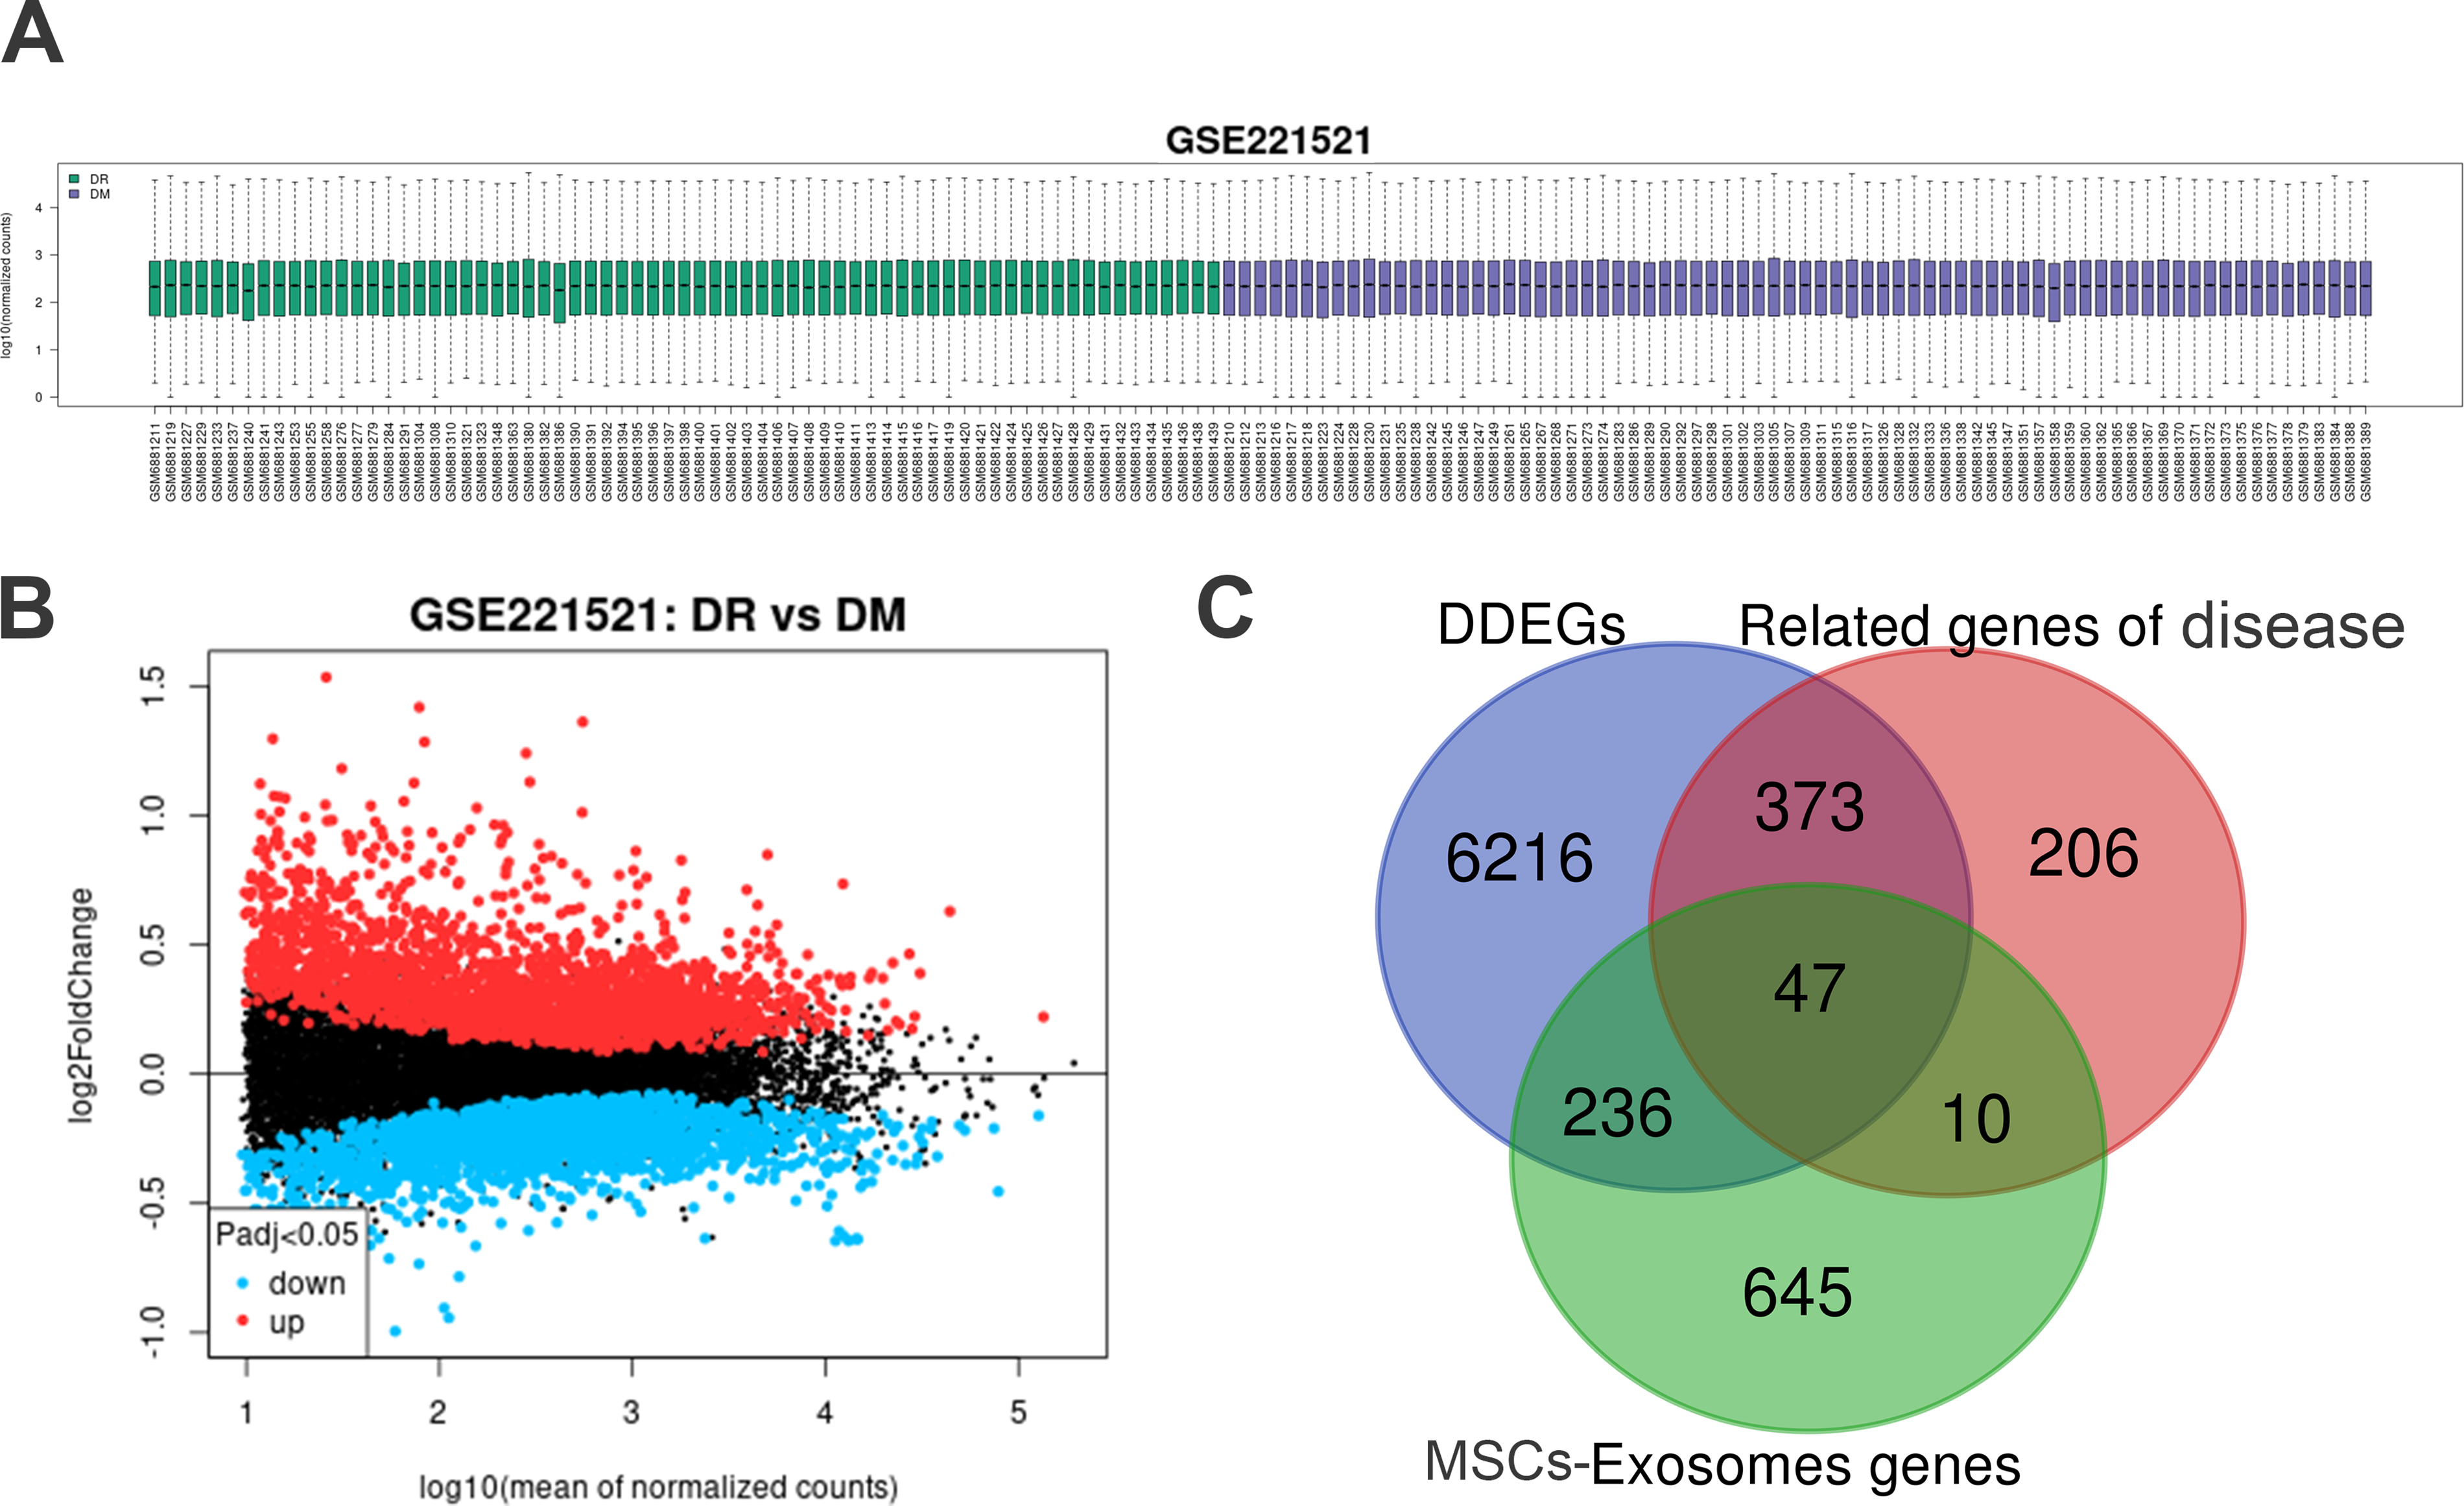
Identification of potential MSCs-Exo therapeutic genes for DR.
Functional analysis of MSCs-Exo-related therapeutic genes in DR
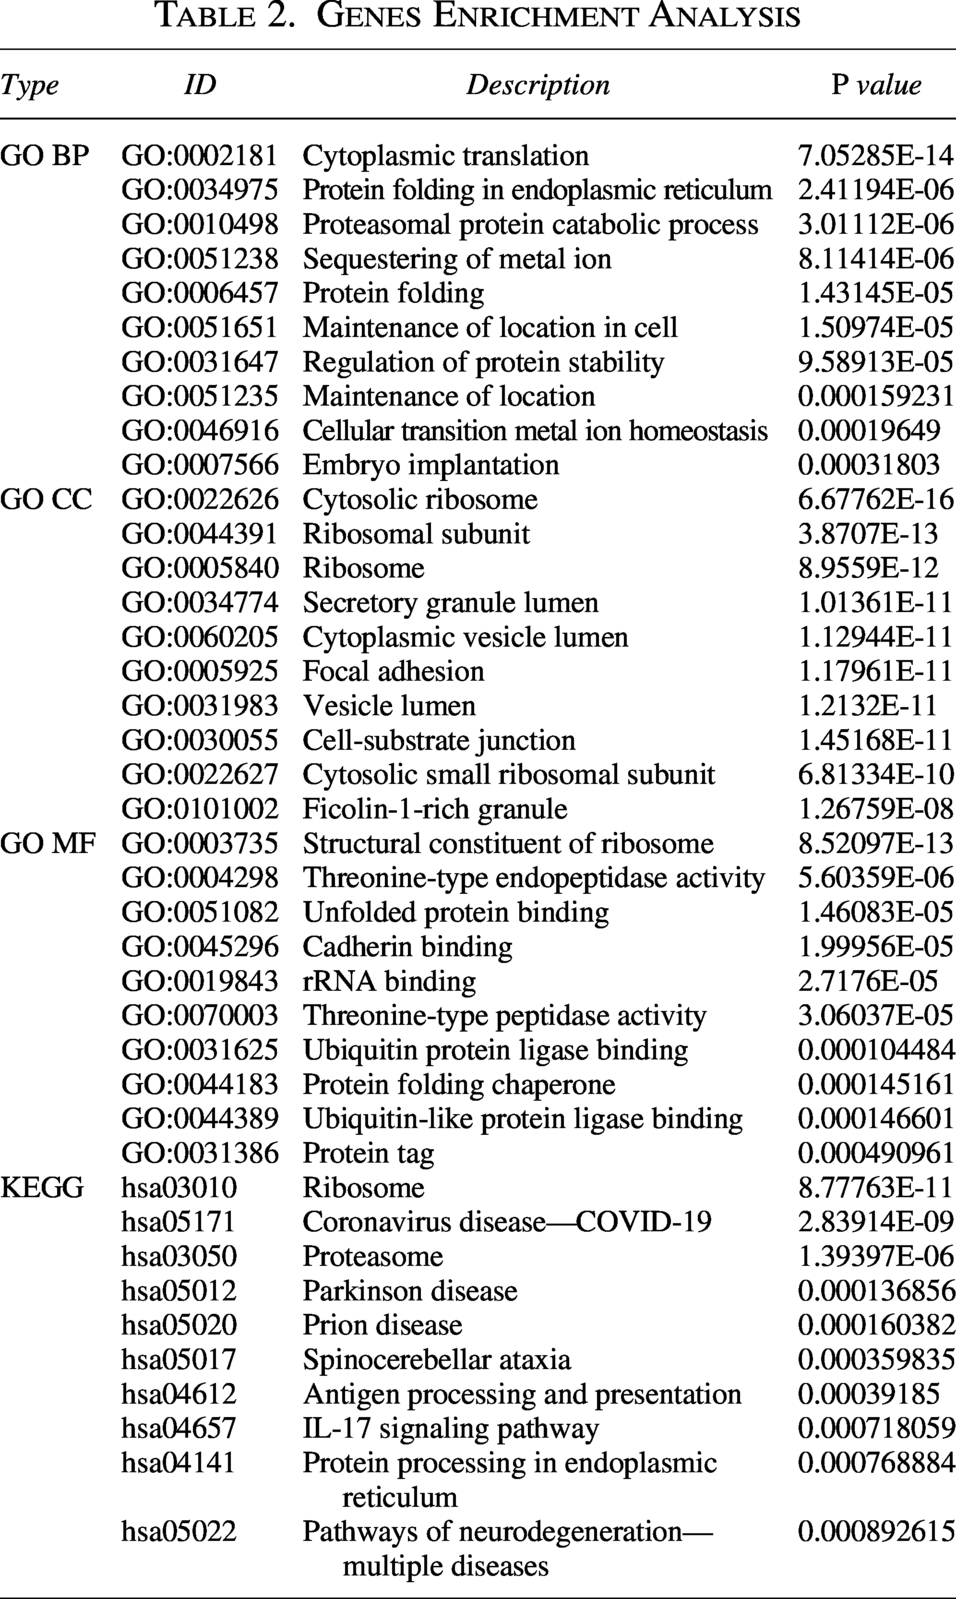
The functional annotation analysis elucidated the biological roles of the identified MSCs-Exo-related therapeutic genes in DR, as detailed in Table 2. As illustrated in Figure 5A, within the biological processes category, these genes were predominantly implicated in cytoplasmic translation, the proteasomal protein catabolic process, and the regulation of protein stability. Figure 5B indicates that, concerning cellular components, these genes were chiefly localized to the cytosolic ribosome, cytosolic small ribosomal subunit, and ribosome. In terms of molecular functions, depicted in Figure 5C, the genes were primarily associated with ubiquitin protein ligase binding, ubiquitin-like protein ligase binding, and unfolded protein binding. Furthermore, pathway enrichment analysis, shown in Figure 5D, demonstrated that the shared DEGs were significantly involved in pathways such as pathways of neurodegeneration-multiple diseases, protein processing in the endoplasmic reticulum (ER), ribosome, and the interleukin 17 (IL-17) signaling pathway, among others. Since these genes are lowly expressed in DR, it suggests that the pathways regulated by these genes are also downregulated in DR. Specifically, protein-related anabolism is inhibited under DR conditions, thereby triggering signals of neuronal damage and degeneration. These results offer valuable insights into the potential therapeutic applications of MSCs-Exo in the treatment of DR.
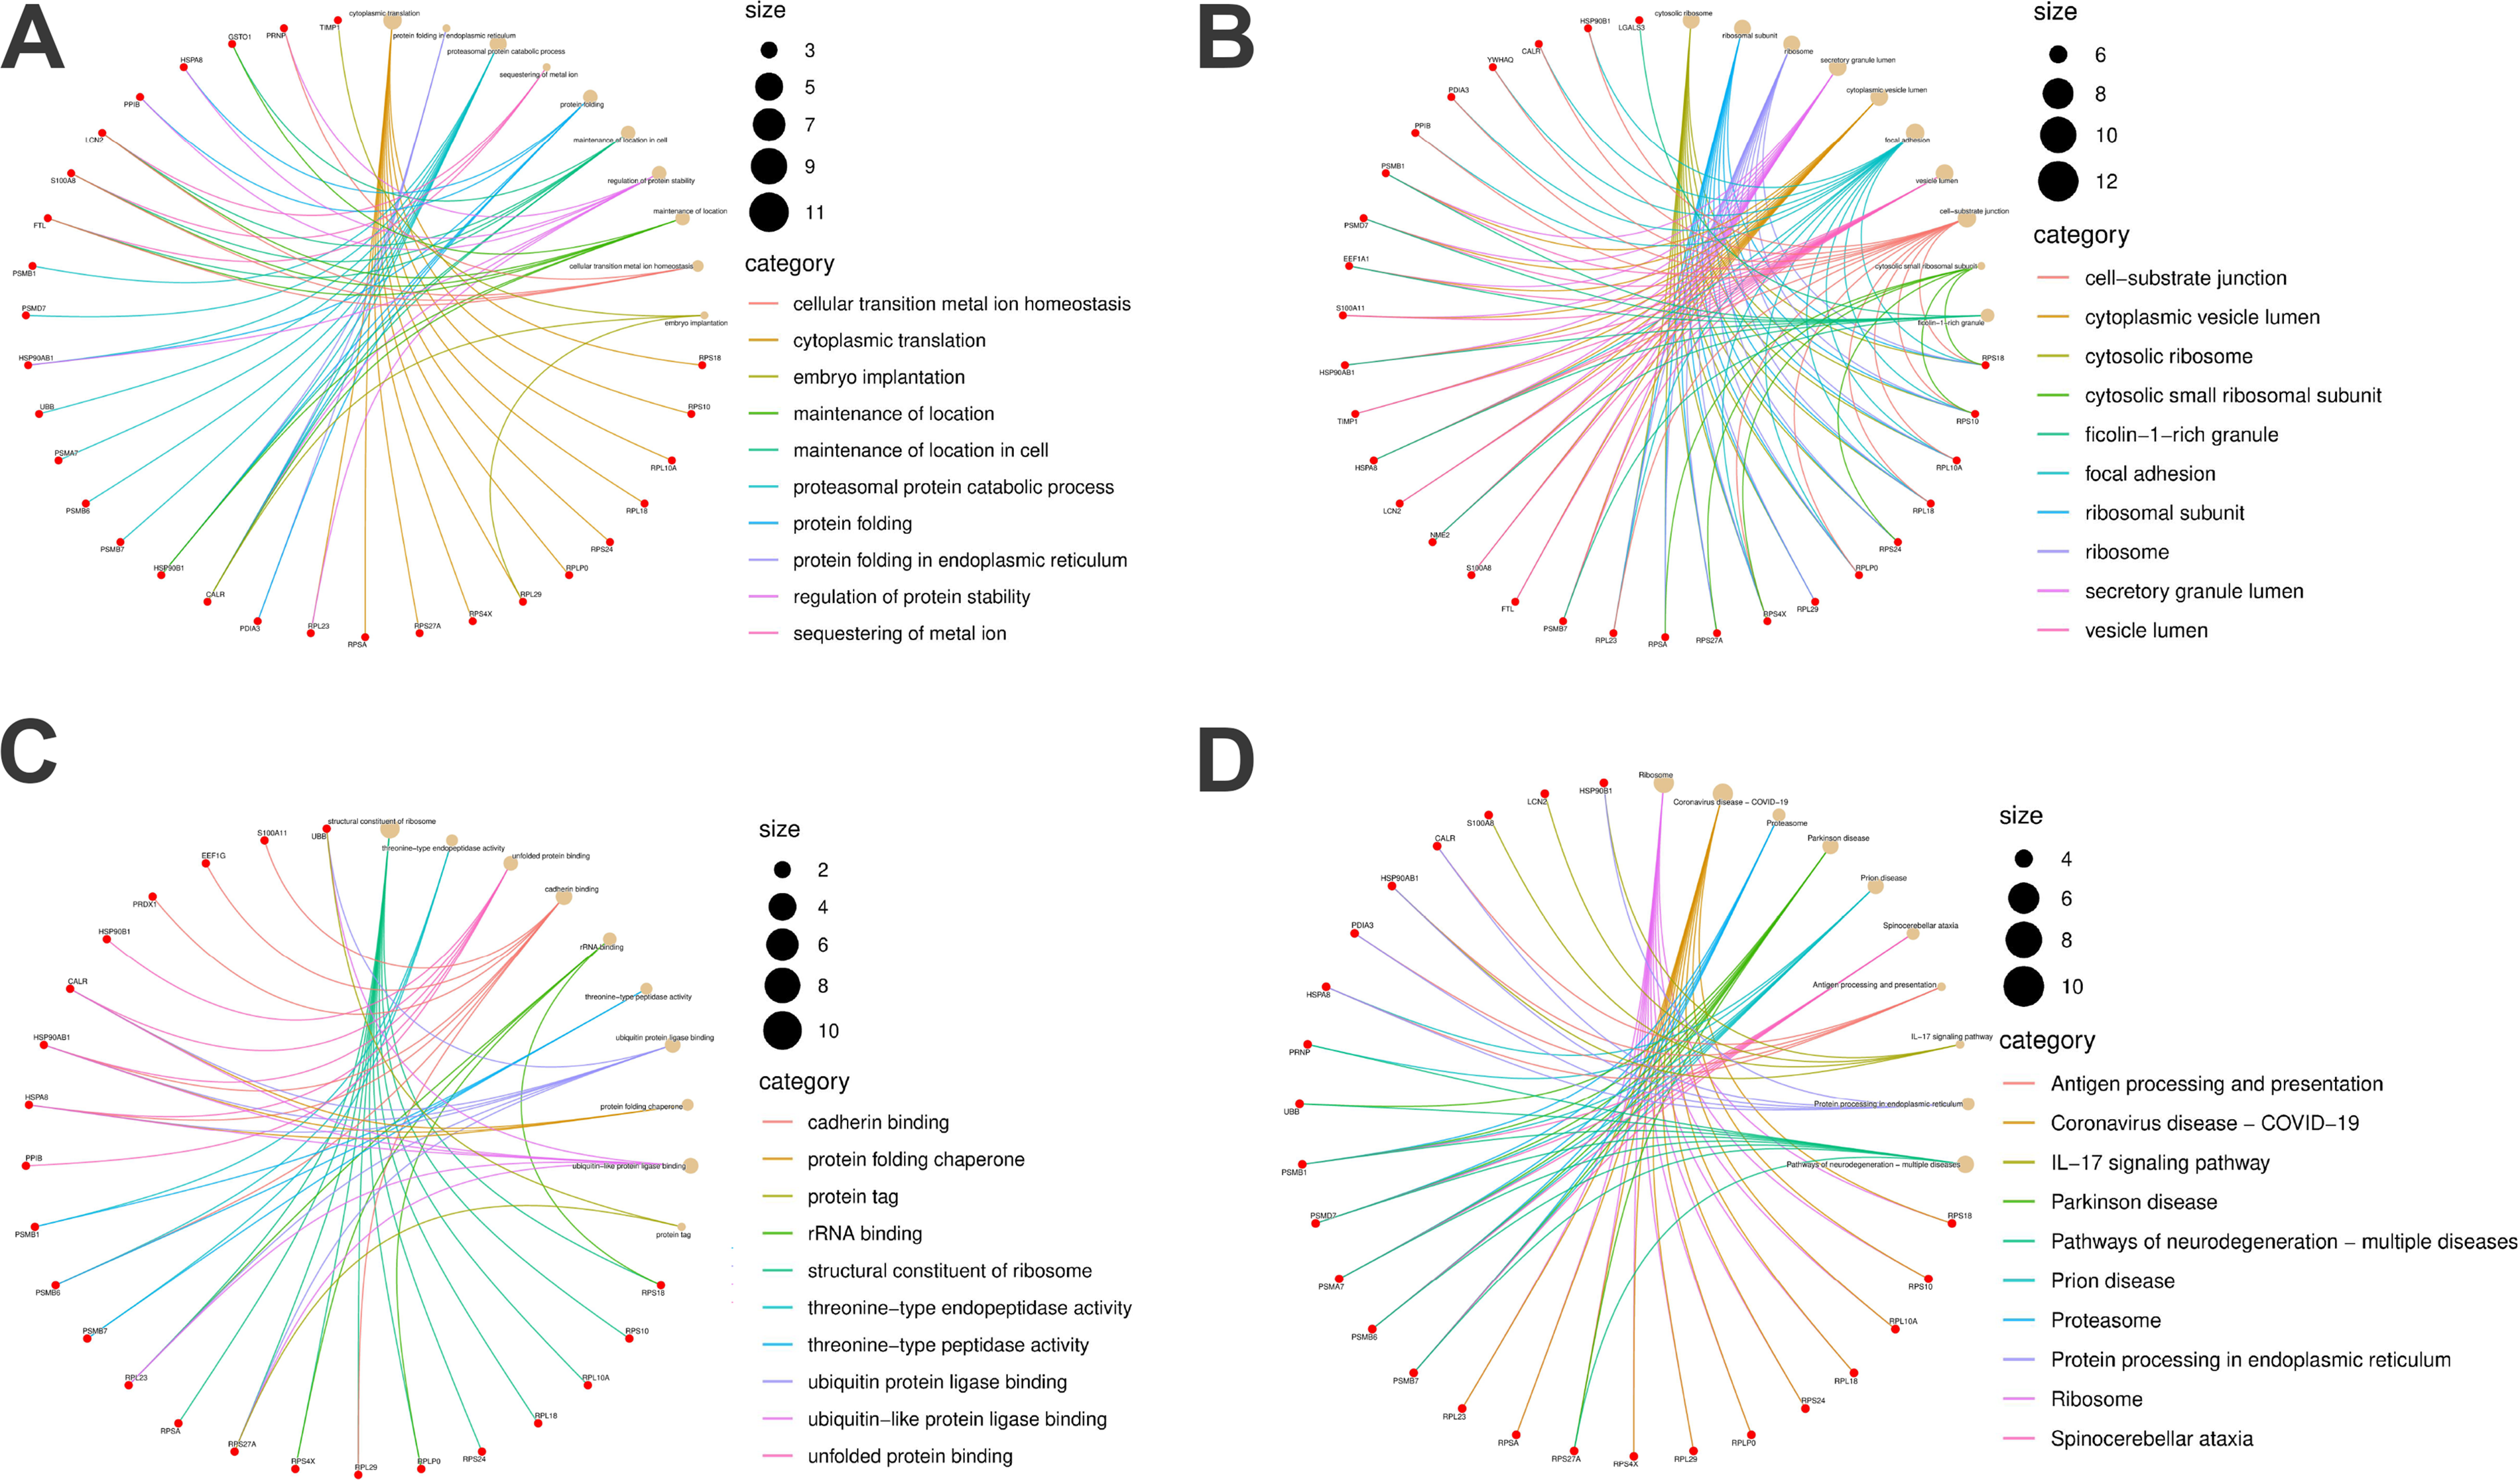
Function enrichment analyses of the MSCs-Exo therapeutic genes.
Genes Enrichment Analysis
Identification of potential key MSCs-Exo-related therapeutic genes in DR
Proteins typically do not operate independently; rather, they engage in interactions with one another. A PPI network pertaining to MSCs-Exo-related therapeutic genes was developed utilizing the STRING database. This network consisted of 3 clusters, 40 nodes, and 275 edges (refer to Fig. 6A). As depicted in Figure 6B–E, the top 20 hub genes were identified through the application of four distinct algorithms available in the cytoHubba plugin. A cross-analysis subsequently revealed 16 common hub genes (see Fig. 6F and Table 3).
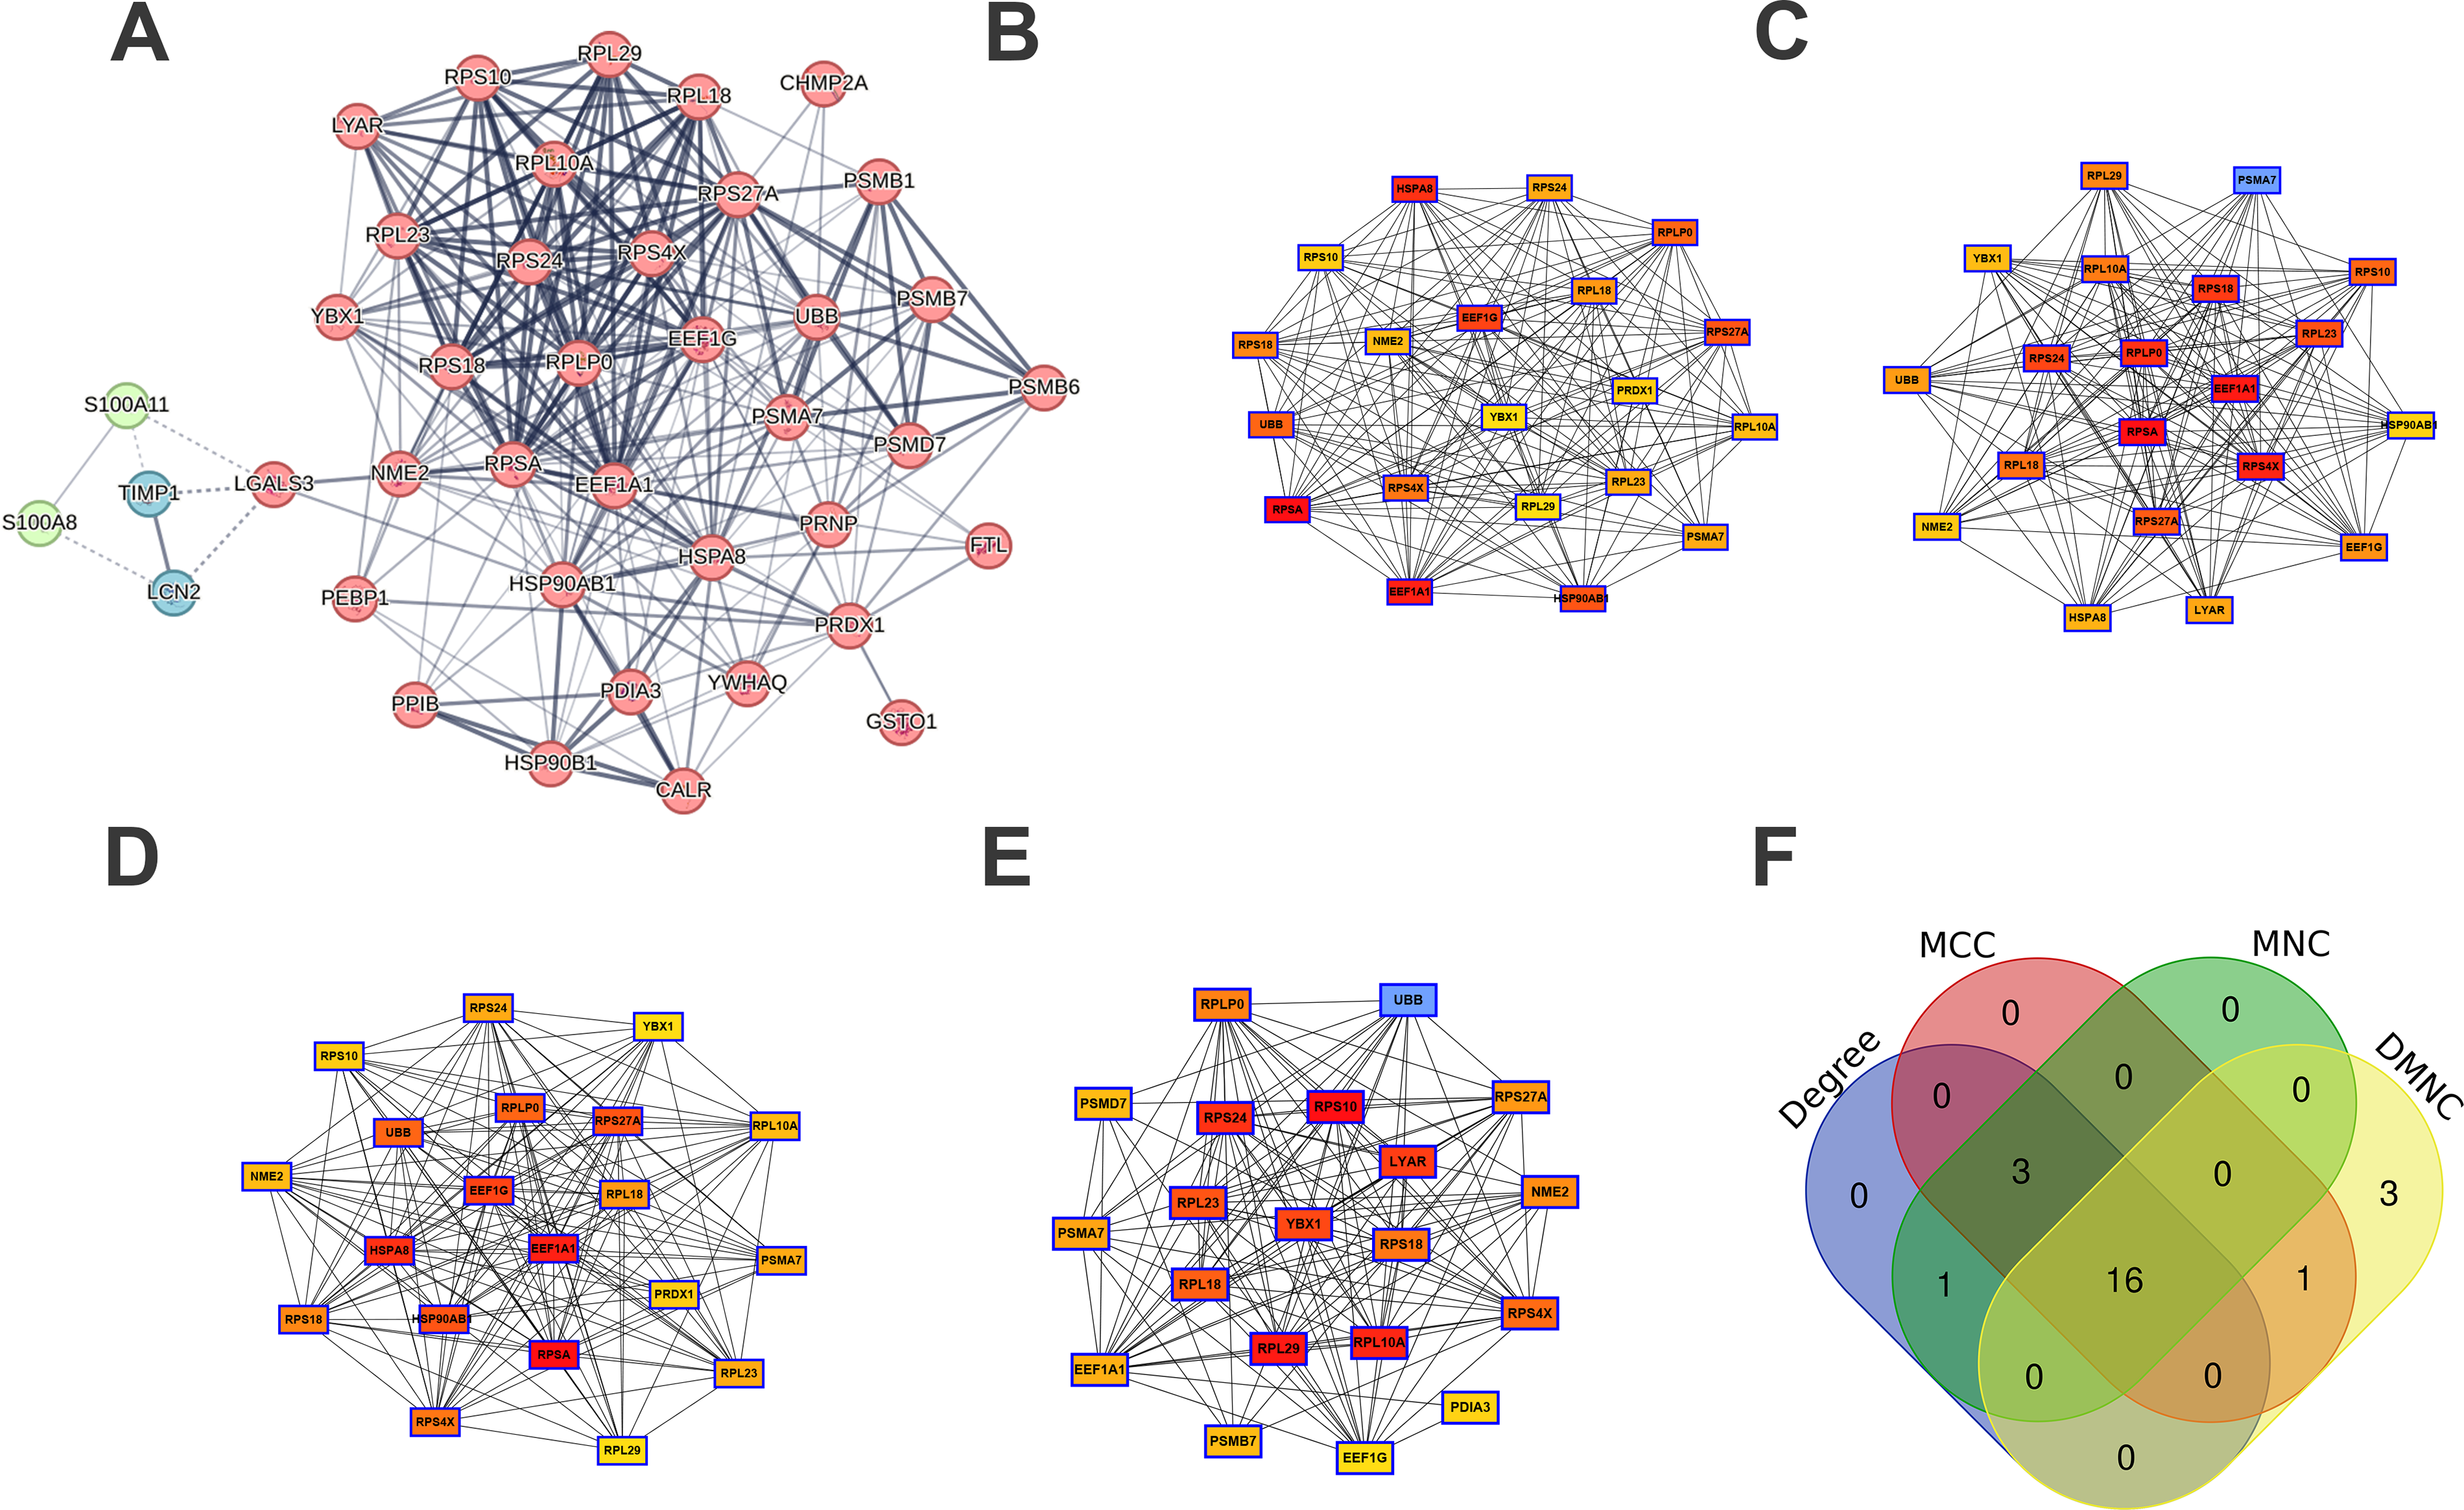
PPI analysis.
Hub Genes
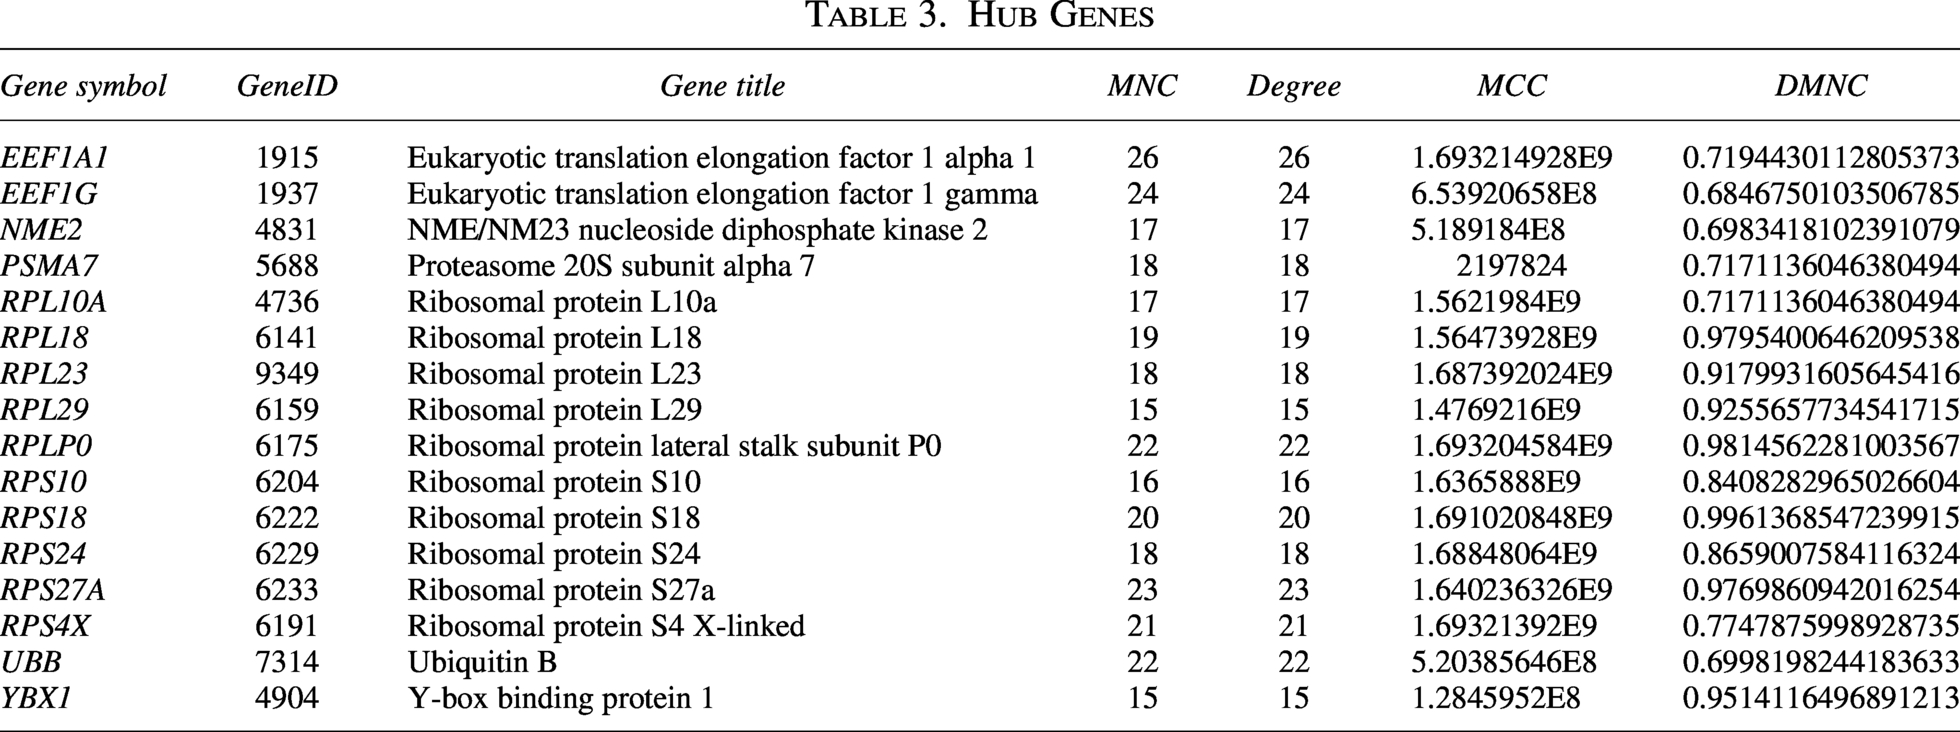
To enhance the identification of reliable biomarkers, various machine learning algorithms were employed for feature selection among the hub genes. The LASSO regression algorithm identified two potential key molecules, YBX1 and PSMA7 (Fig. 7A), a result that was corroborated by their high importance ranking in the RF algorithm (Fig. 7B and C). Subsequently, diagnostic models were constructed using five machine learning algorithms: voting, XGBoost, AdaBoost, Naive Bayes, and ANNs, based on gene weights, and evaluated using ROC curves. The models exhibited modest diagnostic performance, with an area under the curve ranging from 0.707 to 0.757 (Fig. 7D), suggesting their potential efficacy in distinguishing between DM and DR, thereby serving as early diagnostic markers. This highlights the clinical significance of these key genes. Moreover, SHAP interpretability analysis was employed to assess and rank the feature importance of key genes within the most effective model, AdaBoost. The global importance ranking of these key genes is illustrated through a beeswarm plot (Fig. 7E) and a bar plot (Fig. 7F). In addition, a local feature analysis was conducted, utilizing a heatmap (Fig. 7G) and a force plot (Fig. 7H). The findings revealed that PSMA7 exhibited a notably higher contribution to the model’s predictive capabilities.
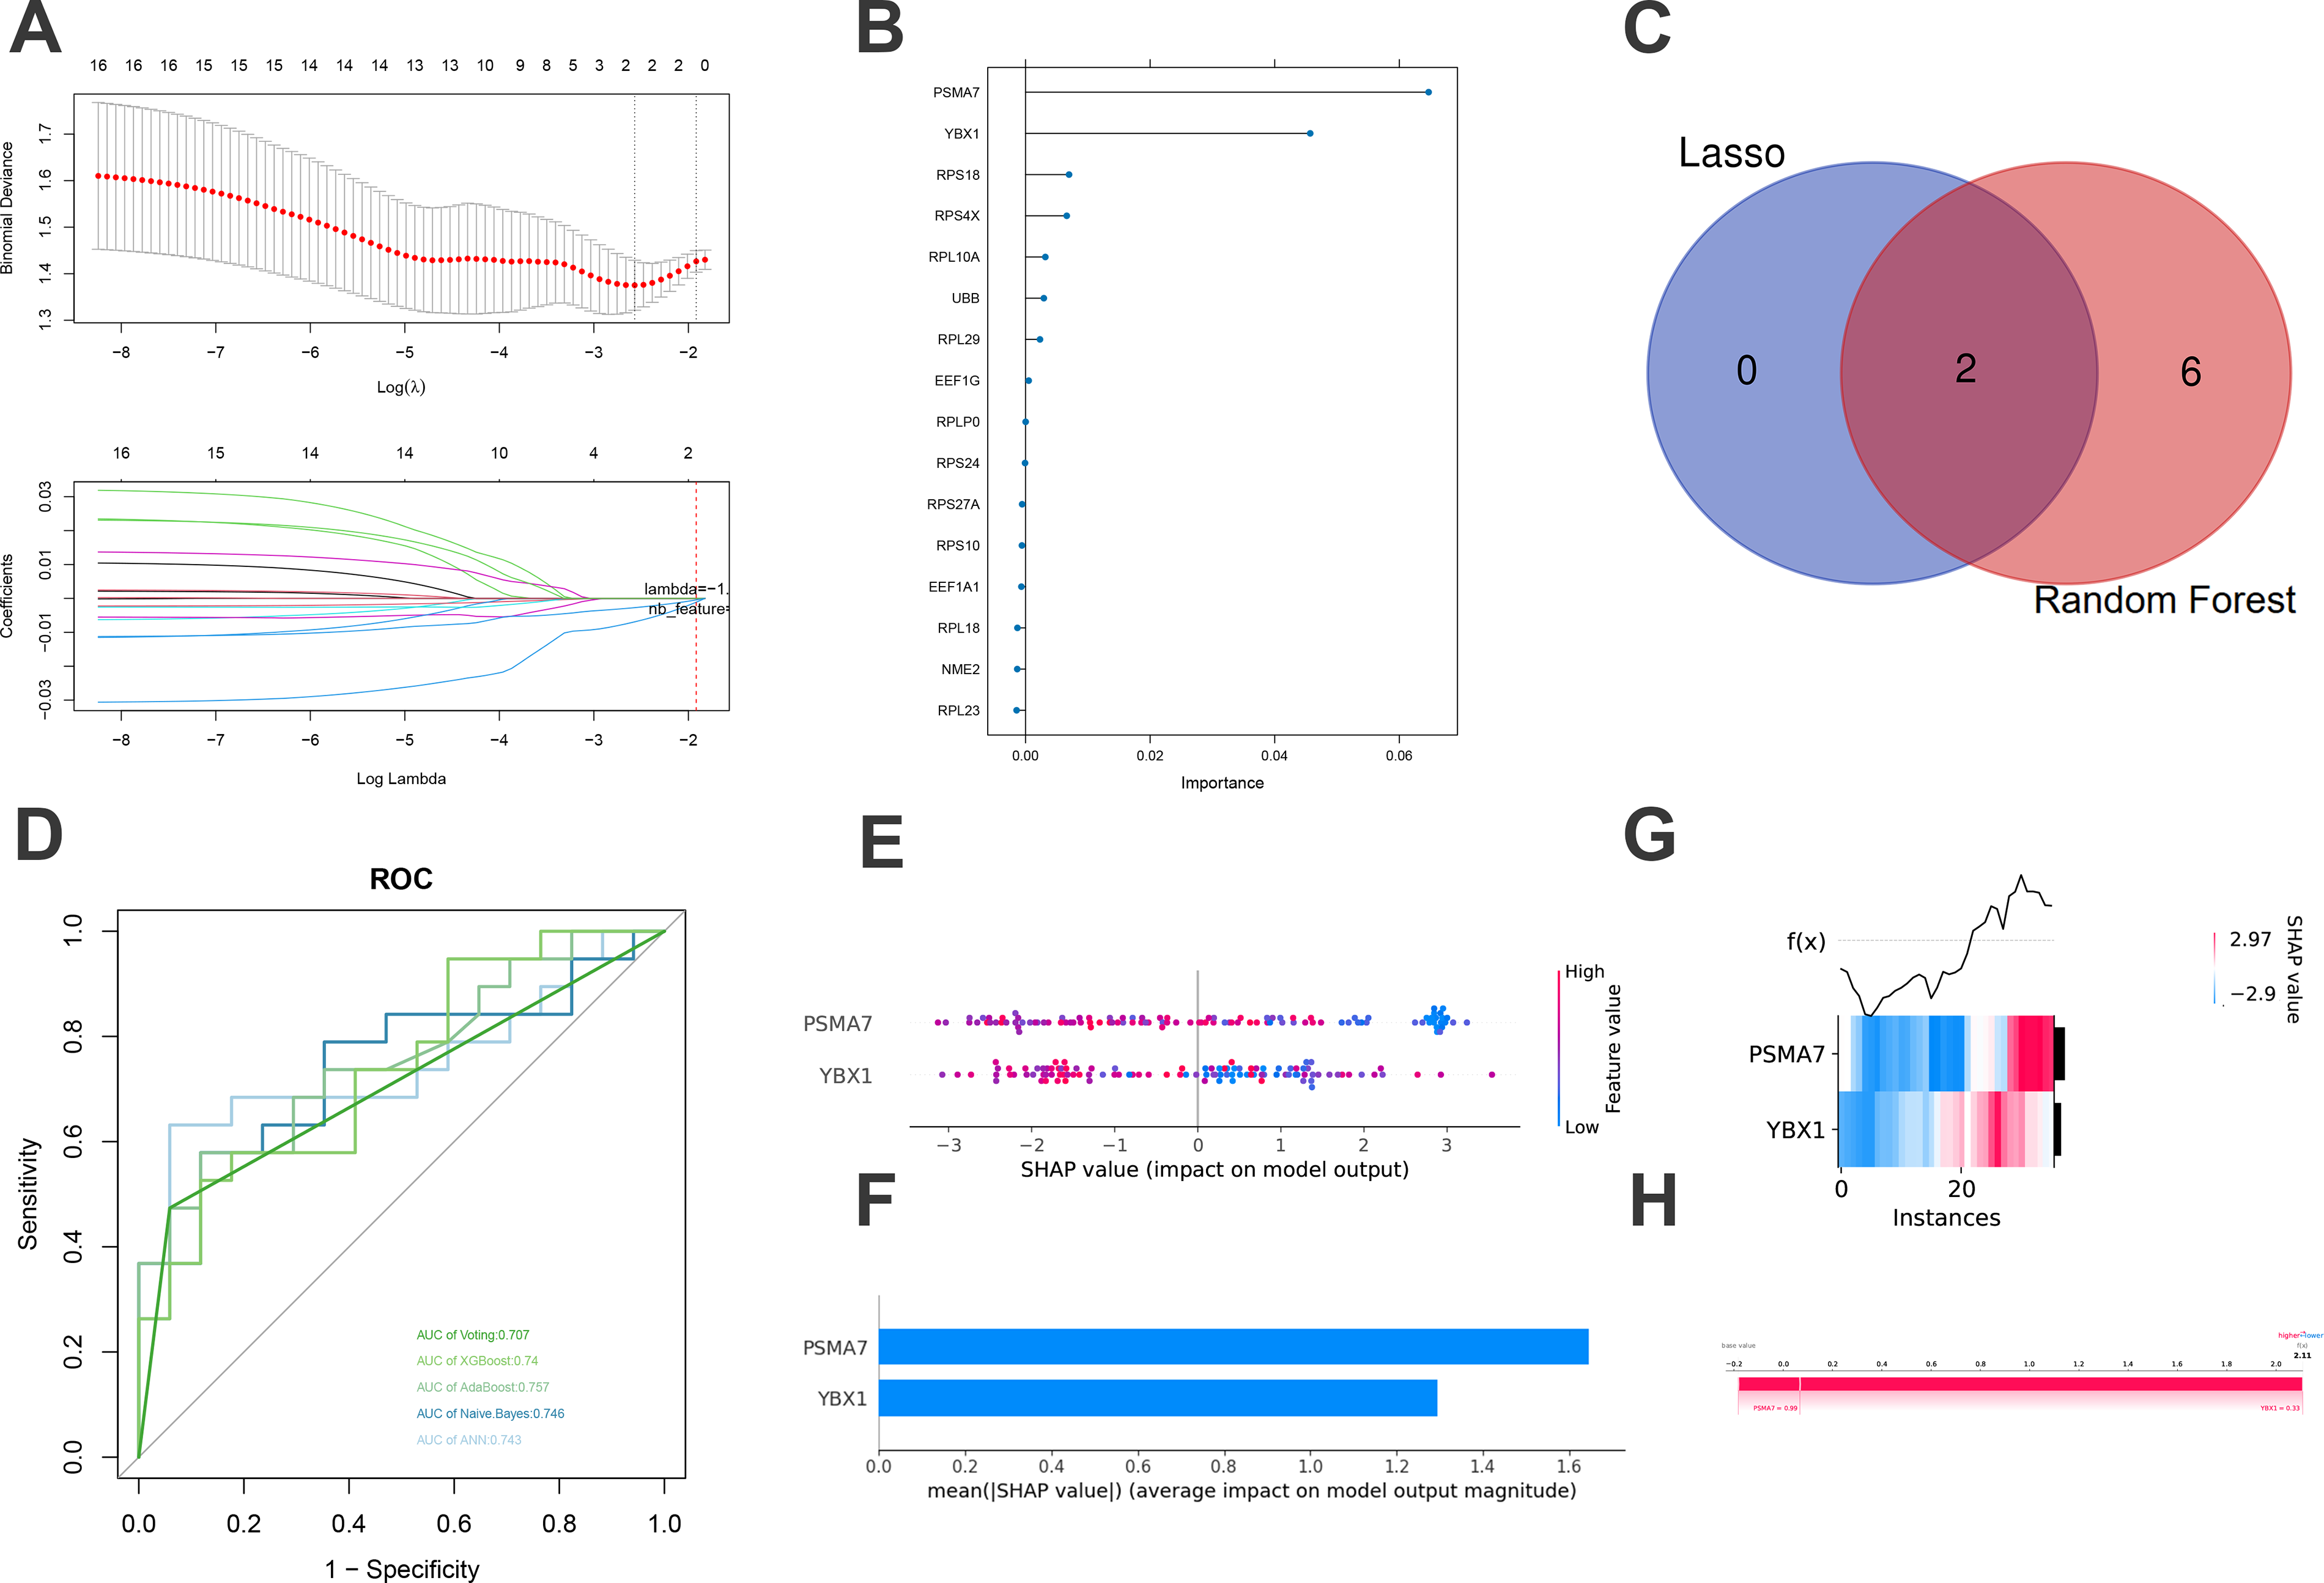
Identification of key MSCs-Exo therapeutic genes for DR.
The results of immune infiltration and single-cell analysis
Immune dysregulation represents a critical mechanism underlying the pathogenesis of DR. Immune infiltration analysis revealed that immune dysregulation in DR exhibited significant differences compared with DM and normal samples, as exemplified by immune cell subsets including CD4 T cells, regulatory T cells (Tregs), dendritic cells, monocytes, and mast cells (Fig. 8A). Specifically, the proportions of activated memory CD4 T cells and resting mast cells were the lowest in DR, whereas those of Tregs and monocytes were the highest (Fig. 8B). Figure 8C illustrates the intercorrelations among these differentially infiltrating immune cells. We further analyzed the correlation between key genes and differentially infiltrating cells (Fig. 8D). The key genes were significantly positively correlated with activated memory CD4 T cells and other subsets but negatively correlated with Tregs and counterparts. Notably, these key genes were markedly downregulated in DR, which potentially implies an intrinsic association between immune imbalance and the expression of key genes in DR.
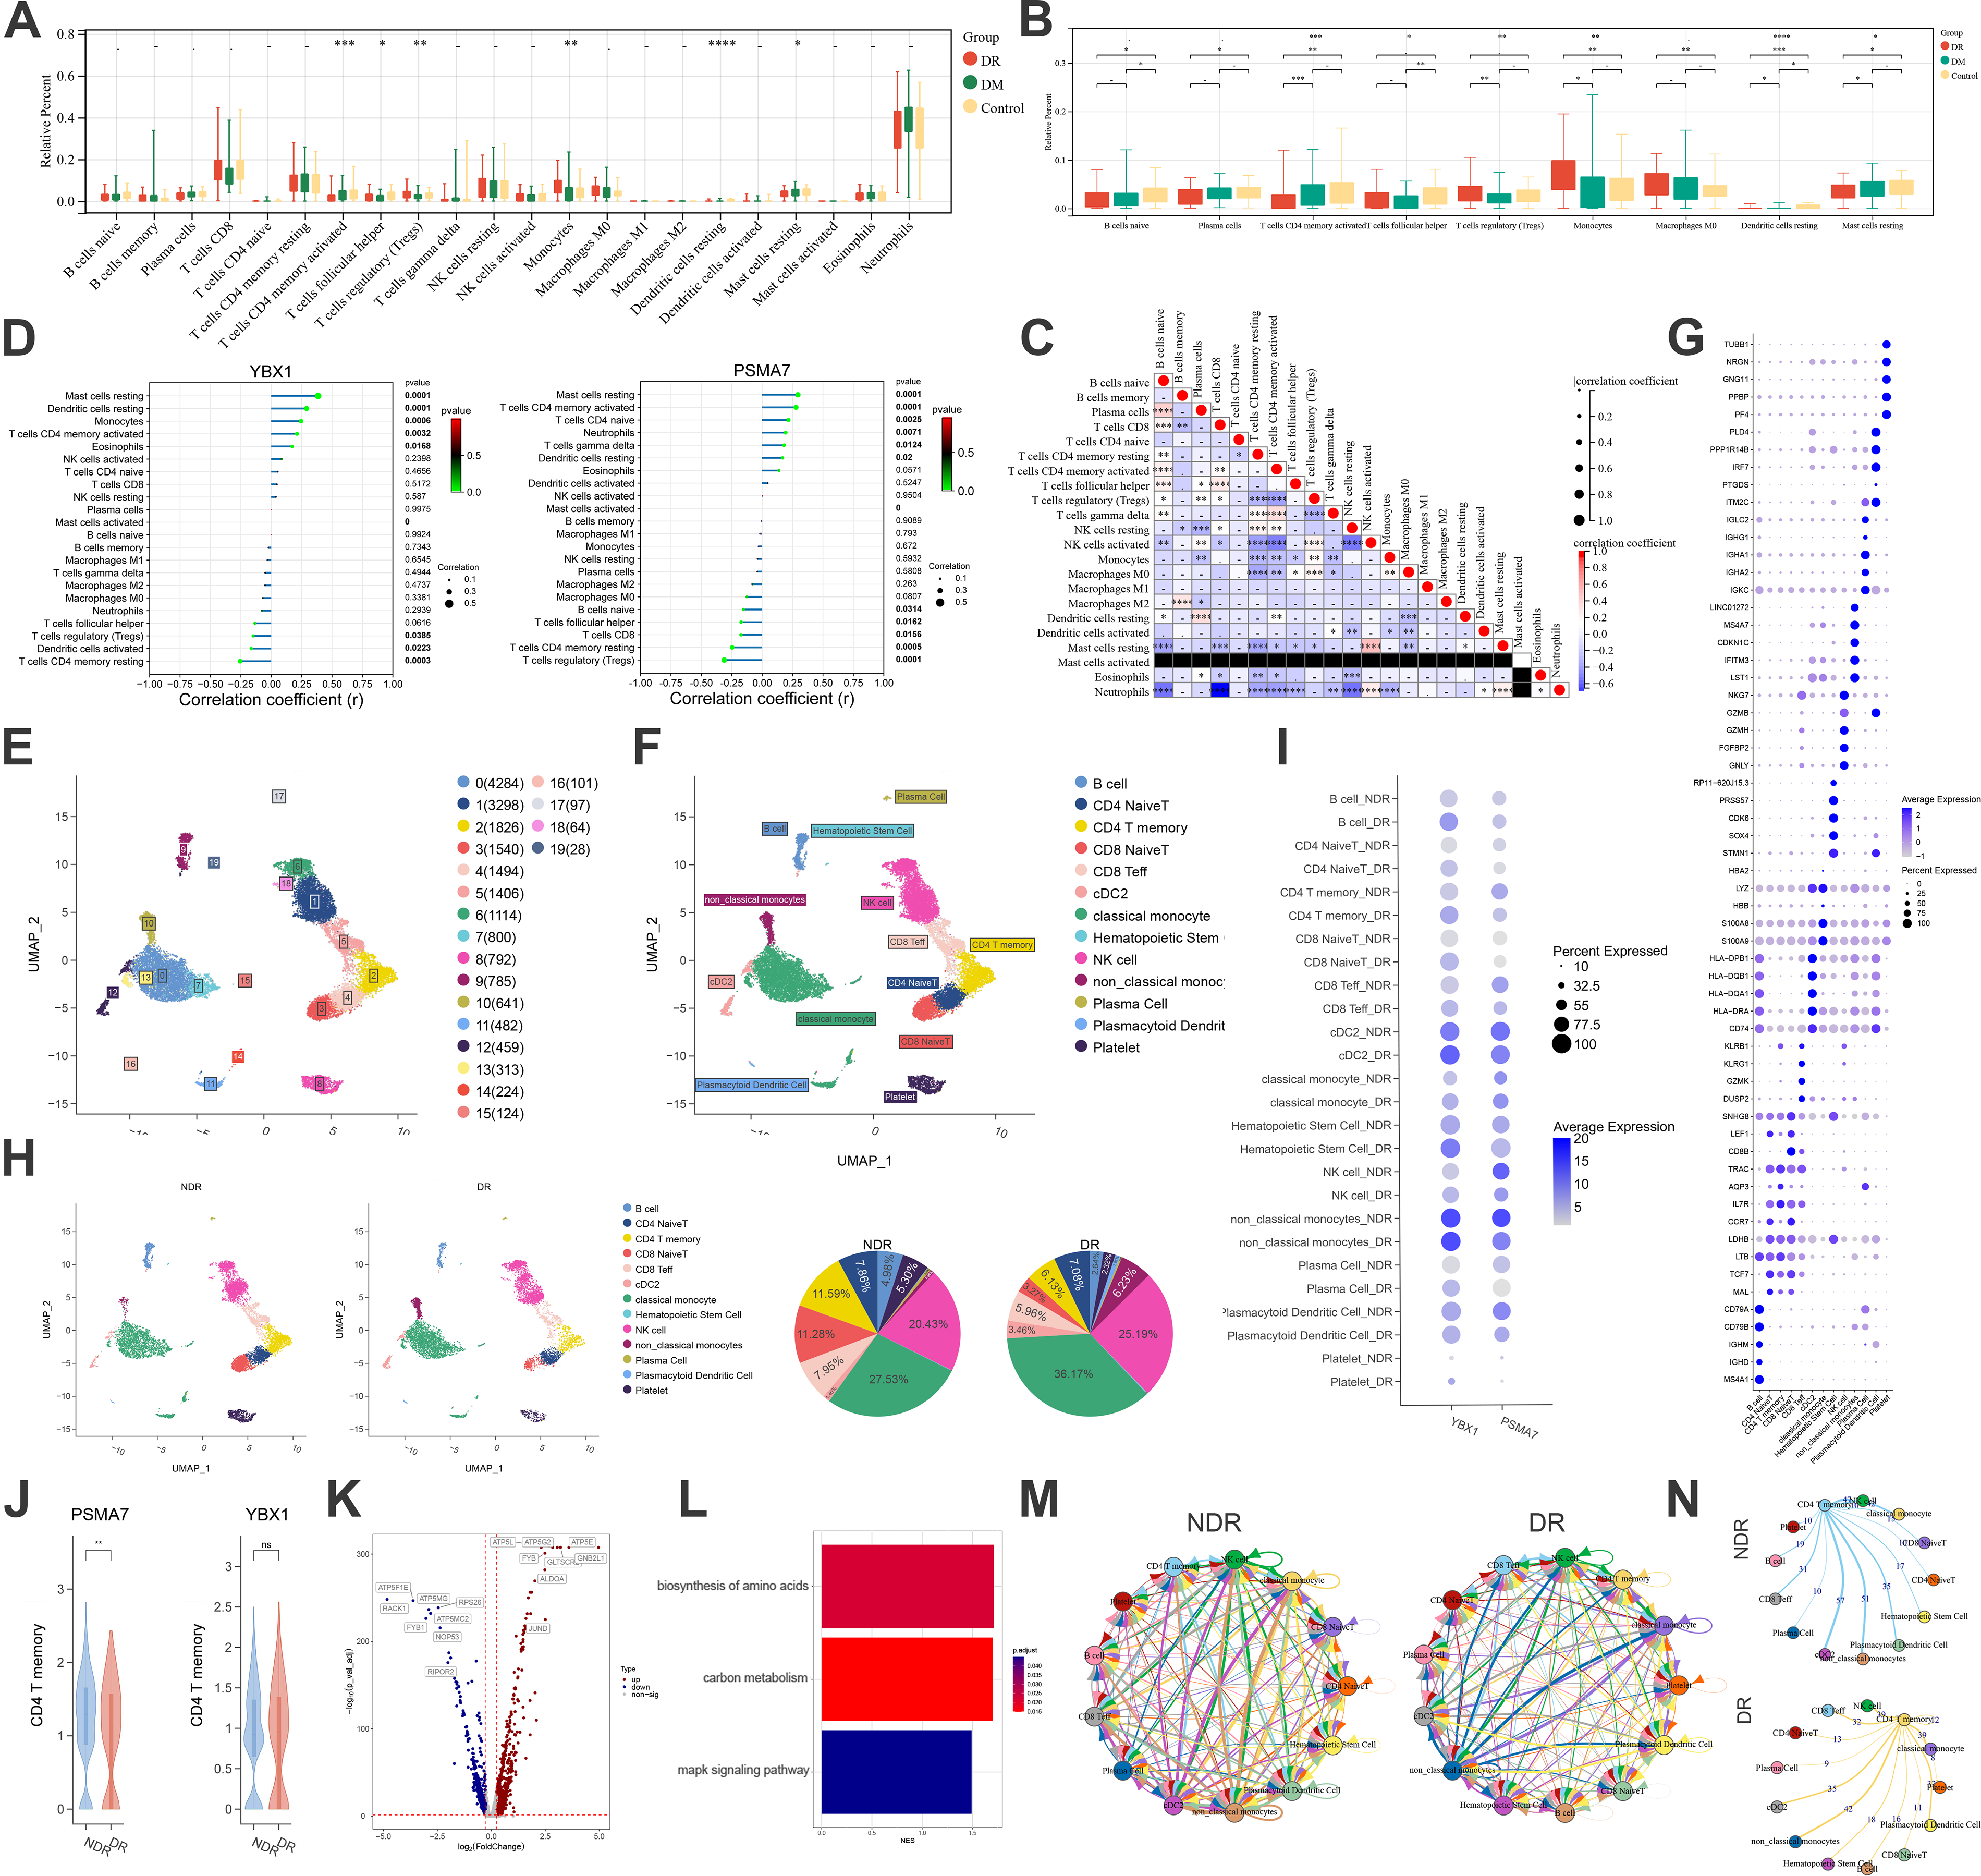
Immune infiltration and single-cell analysis.
After quality control, data normalization, and unsupervised dimensionality reduction clustering, a total of 20 cell clusters were identified (Fig. 8E), together with 13 distinct cell subtypes, including B cells, CD4 naive T, CD4 T memory, CD8 naive T, and CD8 Teff, among others (Fig. 8F). Figure 8G displays the specific marker genes of each cell subtype. Single-cell annotation analysis demonstrated that, compared with the control group, the DR group had higher proportions of monocytes and natural killer cells, along with lower abundances of CD4 T memory and CD8 naive T, which was consistent with our immune infiltration results (Fig. 8H). As shown in Figure 8I and J, the key genes were significantly downregulated in CD4 T memory. Accordingly, we performed further analyses focusing on the memory CD4 T cell subset. Figure 8K presents the significantly DEGs in memory CD4 T cells. Figure 8L shows that the biosynthesis of amino acids was the major signaling pathway enriched in CD4 T memory, which corroborated our aforementioned findings. CellPhoneDB analysis delineated the intercellular interaction patterns among various cell subtypes in DR (Fig. 8M). Moreover, compared with the control group, the interactions between CD4 T memory and other subsets were relatively attenuated in DR (Fig. 8N).
Regulatory network analysis of key MSCs-Exo-related genes
To achieve a more comprehensive understanding of the key molecules and to explore their potential functions, single-gene GSEA was conducted. As illustrated in Figure 9A, the top 10 signaling pathways associated with PSMA7 included the spliceosome, valine, leucine, and isoleucine degradation, and basal TFs. For YBX1, the top 10 pathways encompassed RNA polymerase, the phosphatidylinositol signaling system, and glycolysis/gluconeogenesis (Fig. 9B). By leveraging multiple online databases, a regulatory network consisting of 113 TF–mRNA–miRNA–lncRNA axes involving the key genes was constructed. This network includes, for instance, TFAP2A/PSMA7//hsa-miR-522-3p/SNHG8 and NFYA/YBX1/hsa-miR-9-5p/XIST, among others (Fig. 9C). Furthermore, a key gene–target–drug interaction network was developed (Fig. 9D). These findings offer deeper insights into the regulatory context of YBX1 and PSMA7.
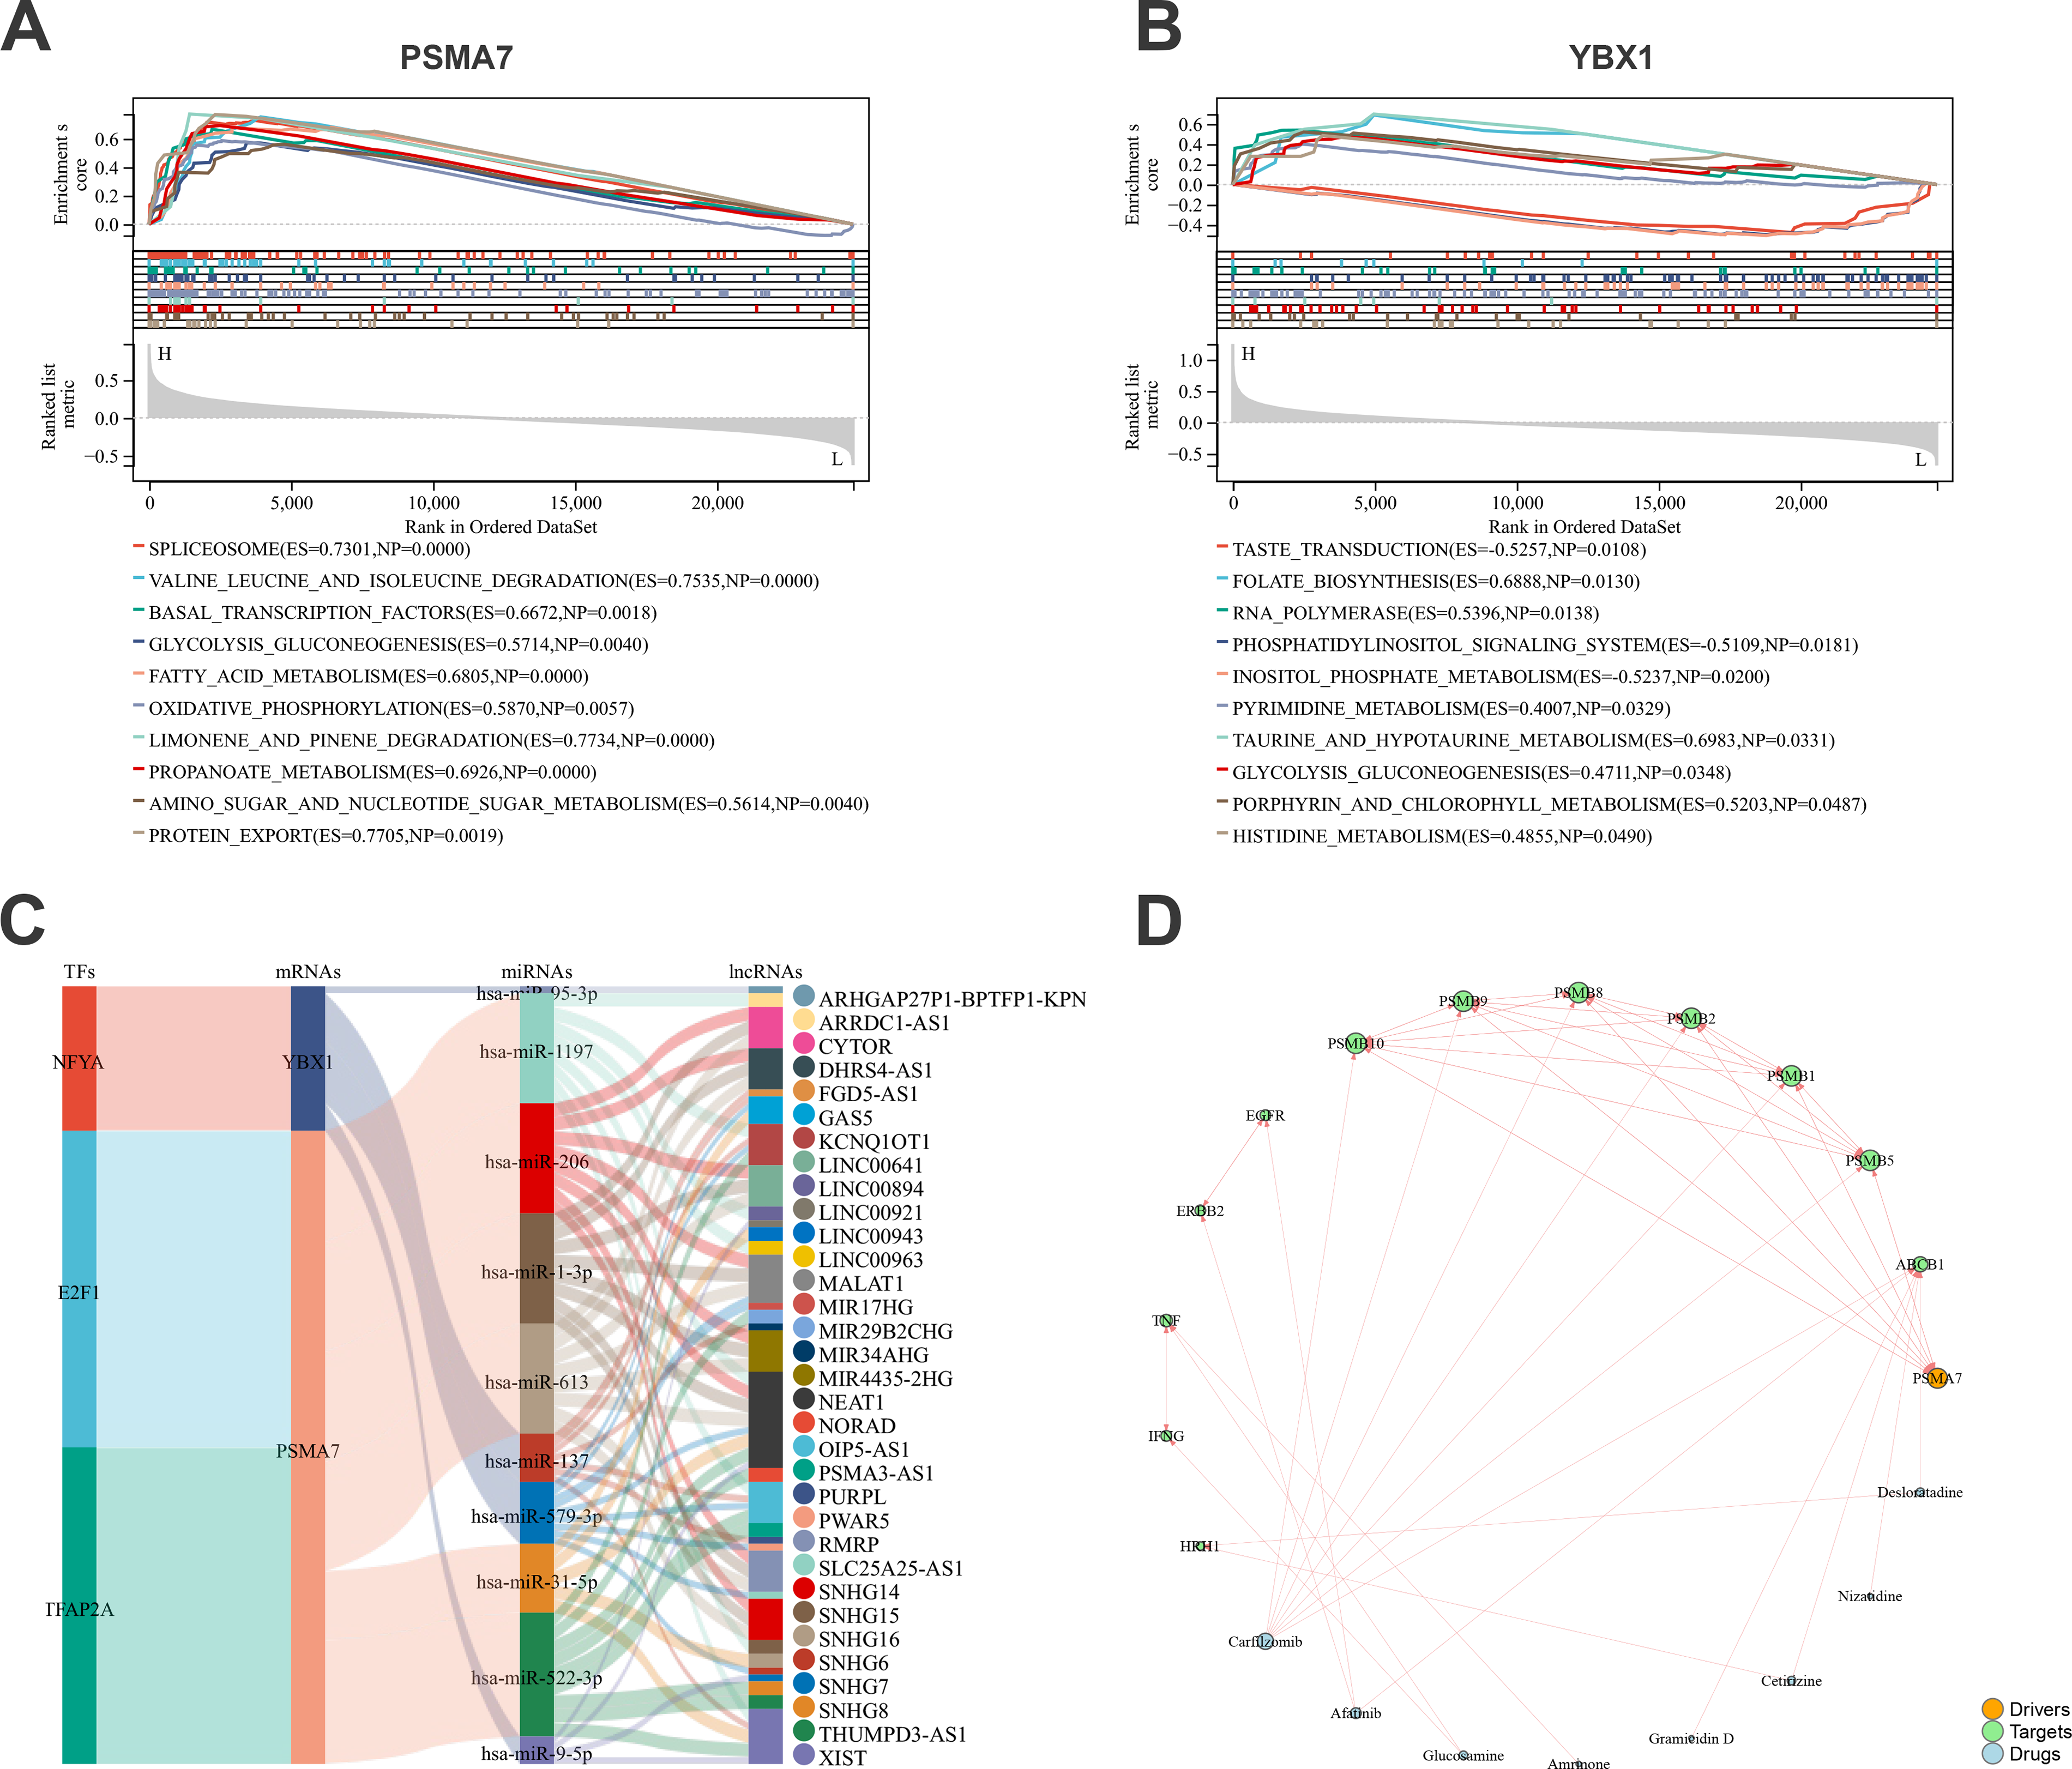
Regulatory analysis of the key MSCs-Exo therapeutic genes.
Expression of YBX1 and PSMA7 is decreased in the peripheral blood of patients with DR
To validate the bioinformatics analysis results, we examined the mRNA expression levels of YBX1 and PSMA7 in the peripheral blood of patients with DR and non-DR subjects. qRT-PCR analysis revealed that, compared with the non-DR control group, the expression levels of both YBX1 and PSMA7 were significantly downregulated in the DR group (Fig. 10A).
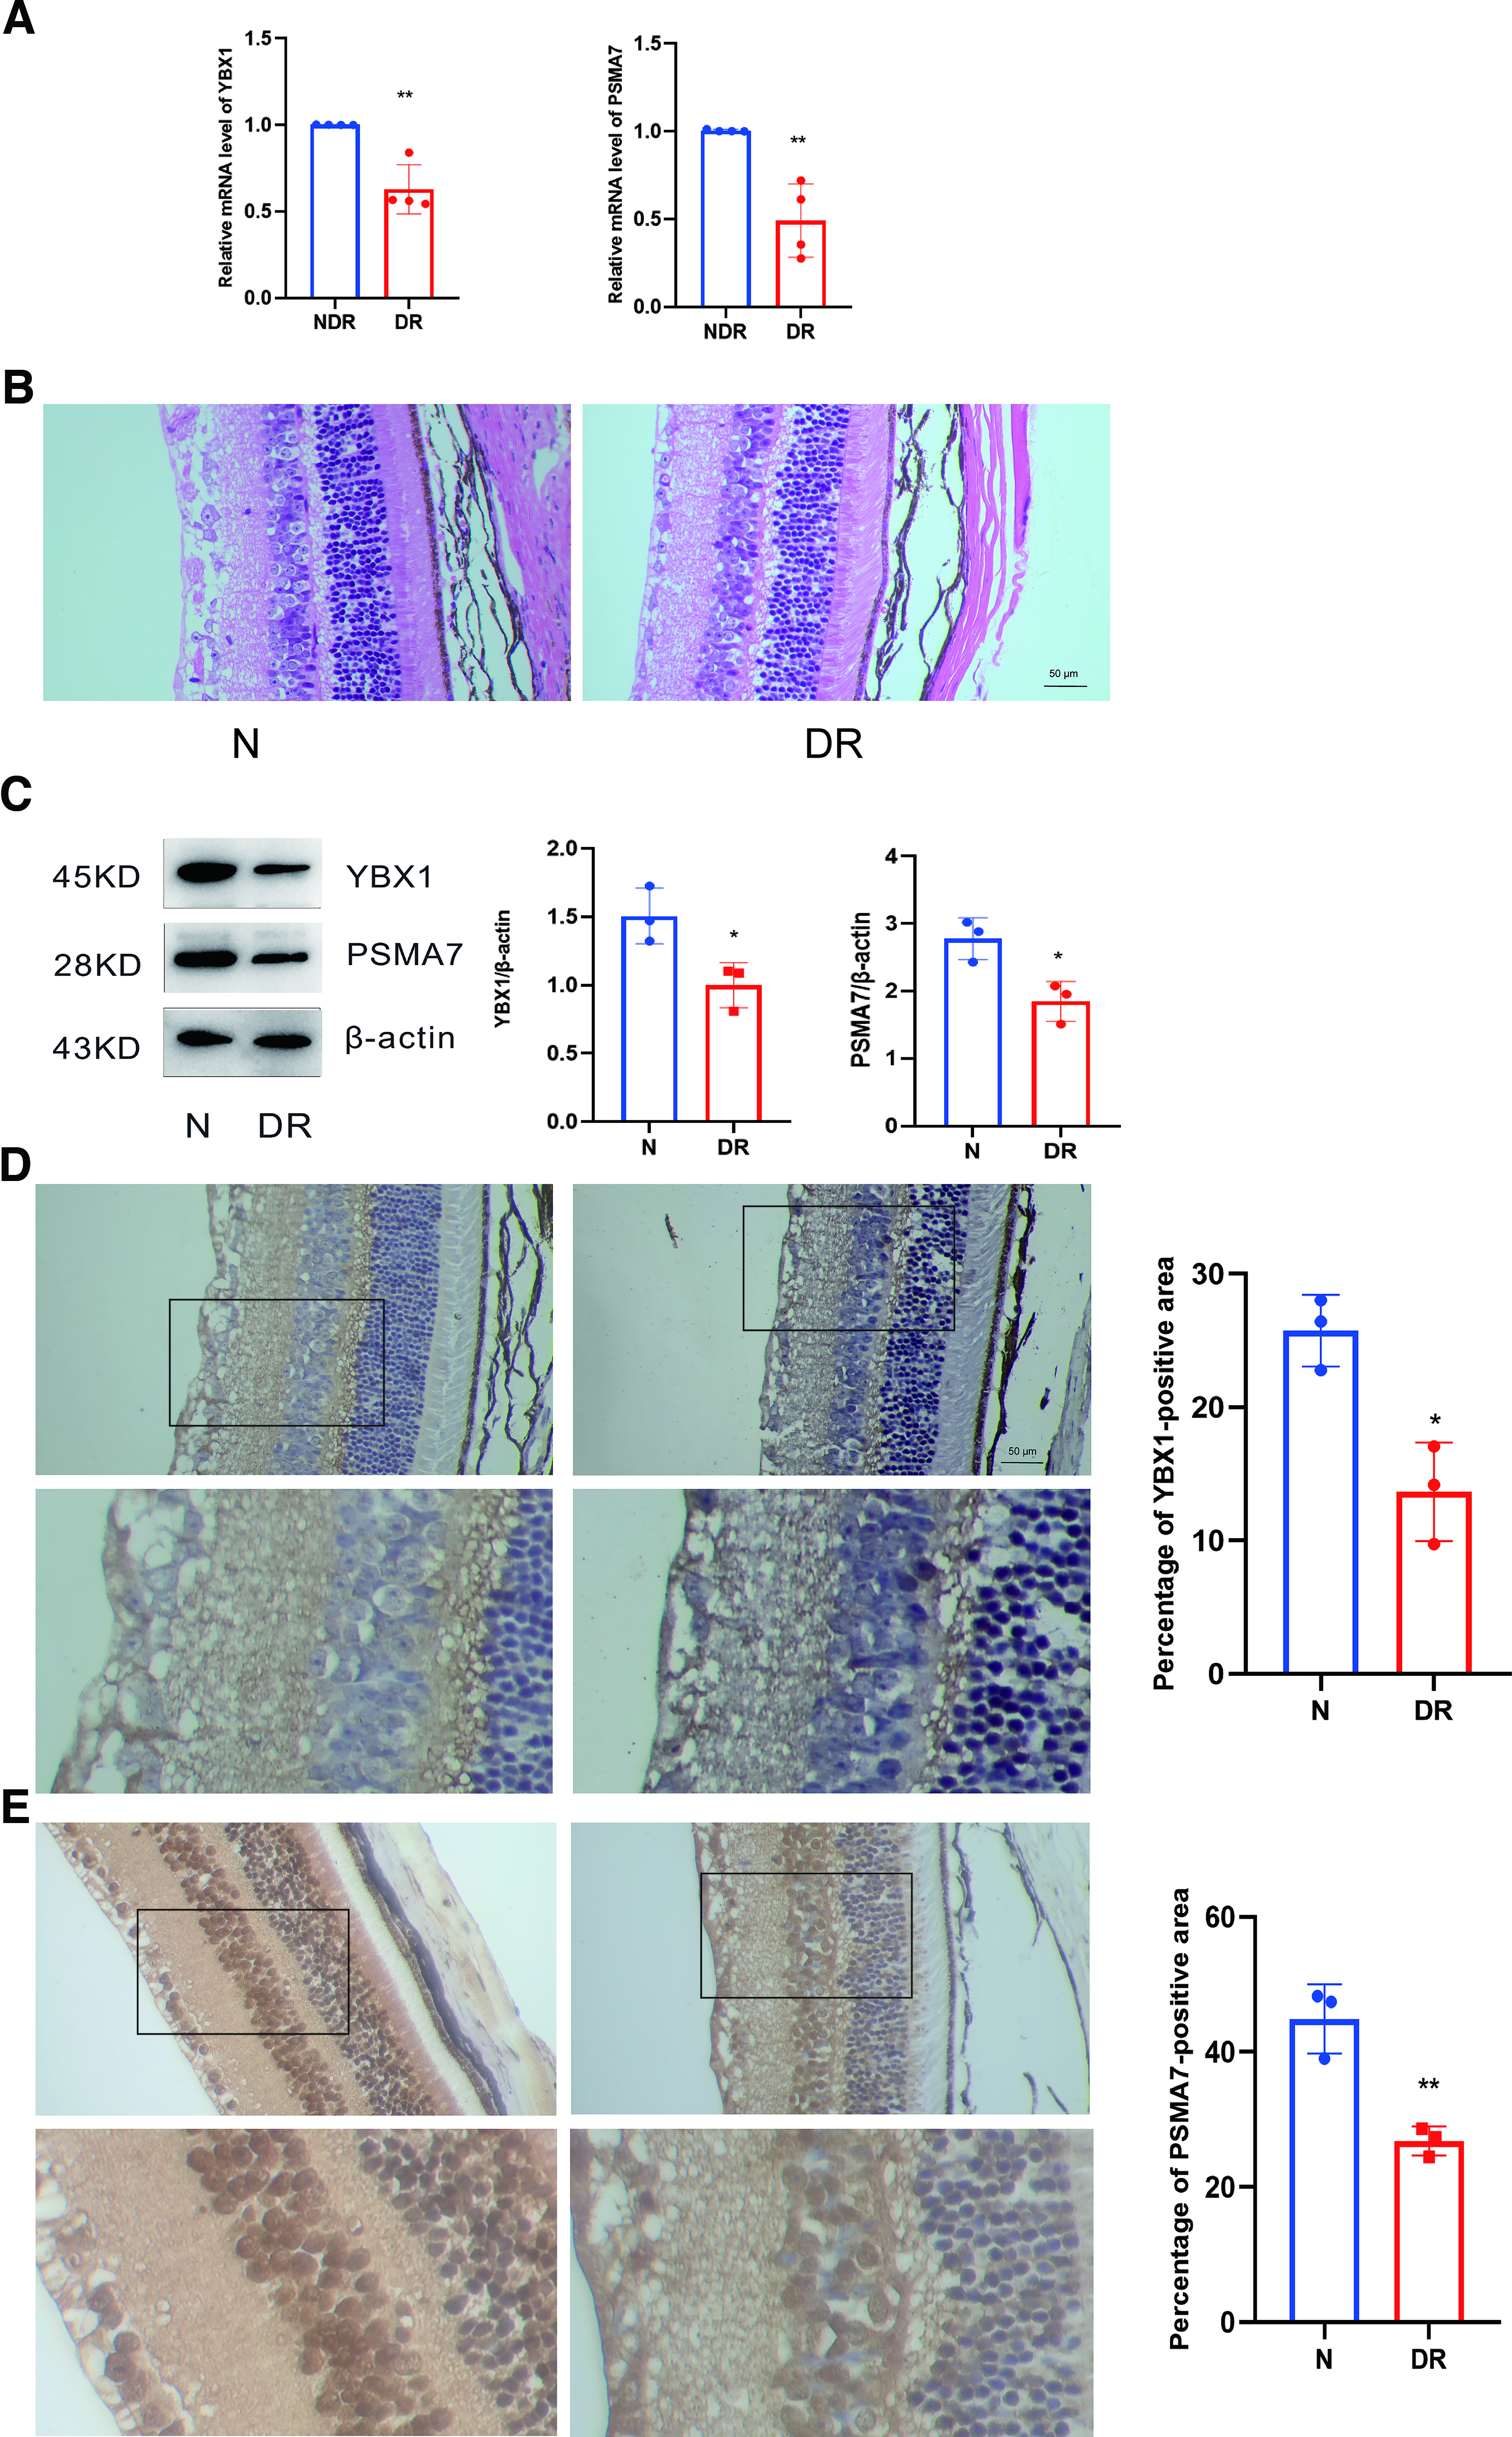
Histological assessment of DR
To evaluate the pathological alterations associated with DR, enucleation of eyeballs was performed 3 months post-induction of the model, followed by H&E staining. Histological analysis demonstrated a disorganized and attenuated retinal pigment epithelium layer in the DR model group relative to the normal control group (Fig. 10B), thereby confirming the successful establishment of the DR model and validating its use for subsequent experiments.
Decreased expression of YBX1 and PSMA7 is a pathological feature in DR mice
To explore the expression changes of YBX1 and PSMA7 during the pathogenesis and progression of DR, their localization and protein expression levels in retinal tissues from both control and DR model mice were assessed using immunohistochemistry and Western blotting, respectively. The findings indicated a significant reduction in the protein expression levels of YBX1 and PSMA7 in the retinas of the DR group compared with the control group, with these differences being statistically significant (Fig. 10C, D, and E).
Discussion
DR, a severe microvascular complication associated with diabetes, is characterized by a multifaceted pathogenesis. This pathogenesis encompasses oxidative stress induced by chronic hyperglycemia, the accumulation of advanced glycation end products, activation of protein kinase C, and sustained inflammatory responses. Together, these factors contribute to the disruption of the blood–retinal barrier, loss of pericytes, and dysfunction of the neurovascular unit, culminating in irreversible vision impairment.6,18–20 Current therapeutic approaches predominantly address the advanced stages of the disease, demonstrating limited efficacy and an inability to reverse preexisting damage. This underscores the critical need for the identification of early diagnostic markers and novel therapeutic targets. MSCs-Exo have emerged as a promising therapeutic avenue for DR due to their substantial potential in promoting vascular repair, exerting anti-inflammatory effects, and providing neuroprotection.10,17 This study presents an innovative investigation of DR through the lens of MSCs-Exo-associated genes. By employing a multiomics analysis integrated with interpretable machine learning techniques, we identified YBX1 and PSMA7 as potential key regulatory molecules in DR. These findings offer potential insights into the mechanisms underlying the therapeutic effects of MSCs-Exo.
Our findings consistently indicate a significant downregulation of YBX1 and PSMA7 in the retinal tissues of a diabetic mouse model, suggesting that these molecules may play crucial roles in the pathophysiology of DR. Notably, these two molecules highlight an imbalance in cellular homeostasis in DR from two fundamental perspectives: the regulation of gene expression (YBX1) and the maintenance of protein homeostasis (PSMA7). This discovery is further supported by functional enrichment analysis, which provides potential insights into the mechanisms through which MSCs-Exo may exert effects in DR.
In this study, biomarker identification was based on blood transcriptomic data (DR vs. DM), while protein validation was performed in retinal tissue (normal vs. DR). This discrepancy arose from the following considerations: blood samples are suitable for clinical screening, whereas retinal tissue directly reflects local pathology. The two strategies (DR vs. DM for progression-related gene identification and normal vs. DR for end-stage confirmation) are complementary. Notably, we further validated the downregulation of YBX1 and PSMA7 mRNA in the peripheral blood of DR patients, which was consistent with the findings in retinal tissue, partially mitigating the limitation arising from sample source differences. Nevertheless, molecular expression may still differ between blood and retinal tissue, which represents a limitation of this study and awaits further investigation.
Functional enrichment analysis identified significant enrichment of key MSCs-Exo-related genes in several pathways, including prion disease, proteasome, protein processing in the ER, ribosome, and the IL-17 signaling pathway. This finding suggests that MSCs-Exo may be associated with the modulation of multiple pathways involved in DR pathology. Notably, the enrichment of the proteasome and protein processing in the ER pathways highlights the critical role of the protein quality control system in DR. The downregulation of PSMA7, a core alpha subunit of the 20S proteasome, may result in compromised ubiquitin-proteasome system (UPS) function. 21 In the pathological context of DR, chronic hyperglycemia-induced oxidative stress and ER stress lead to an accumulation of misfolded and damaged proteins, necessitating efficient clearance by the UPS.22,23 The downregulation of PSMA7 may impair proteolytic clearance, resulting in the accumulation of toxic proteins, which can subsequently induce apoptosis in retinal cells, such as pericytes and retinal pigment epithelial cells, and exacerbate ER stress. This cascade ultimately disrupts the integrity of the blood–retinal barrier.23,24 Research has identified the prion protein as a significant contributor to pathological neovascularization in DR. 25 Bulk RNA sequencing and single-cell enrichment analysis results mutually confirm each other that YBX1 and PSMA7 play roles in the regulation of protein and amino acid metabolism, which indicates their potential therapeutic mechanism to DR.
In addition to maintaining protein metabolism, the rescue of downregulated ribosomal pathways and IL-17 signaling pathways further highlights potentially protective mechanisms of MSCs-Exo, which are involved in translational regulation and immune modulation. T cells, especially CD4 T cells, serve as the core regulatory cells in chronic inflammation.26,27 Their dysfunction directly impairs the functions of other immune cells and promotes vascular lesions as well as neurodegenerative changes.28–30 By integrating immune infiltration and single-cell analyses, we found that the proportion of CD4 memory T cells activated was significantly decreased in DR, and this reduction was consistent with the downregulation of key genes in DR. Multiple previous studies have indicated that CD4 memory T cells are closely associated with the pathogenesis and progression of DR.31,32 IL-17 can directly act on CD4 T cells and endow them with resistance to immunosuppression. For instance, human CD4 T cells exposed to the Th17-polarizing microenvironment interact with their receptors (IL-17RA and IL-17RC) via IL-17A, IL-17F, and IL-17AF heterodimers. This interaction enhances the resistance of CD4 T cells to CD8 T cell-mediated immunosuppression, which may affect the activation and proliferation of CD4 T cells. 33 MSCs-Exo are recognized for their robust anti-inflammatory properties, which may correlate with the modulation of inflammatory pathways such as IL-17, potentially contributing to the suppression of chronic inflammation in the retina and mitigation of neurovascular damage.
Through regulatory network analysis, this study has constructed a complex network consisting of 113 TF–mRNA–miRNA–lncRNA axes. Examination of this network reveals that pivotal genes such as YBX1 and PSMA7 are targets of transcriptional regulation, while also being subject to posttranscriptional regulation by noncoding RNAs, including hsa-miR-31-5p, which are potentially derived from MSCs-Exo, along with their competing endogenous RNAs, such as XIST. Accumulating studies have demonstrated that the core pathological processes of DR encompass inflammatory responses, oxidative stress, abnormal angiogenesis, and neurodegenerative changes, in which noncoding RNAs exert critical regulatory functions. At the miRNA level, hsp-miR-31-5p has been proven to be closely associated with DR through bioinformatic analysis and may participate in disease progression by regulating mitochondrial function-related genes. 34 In terms of lncRNAs, XIST is one of the most well-documented molecules to date. Existing evidence indicates that XIST is significantly upregulated in DR patients and high glucose-stimulated retinal endothelial cells and facilitates angiogenesis and inflammation via modulating the miR-101-3p/VEGFA axis. 35 Although direct investigations on these TFs in DR remain limited, their essential roles in regulating oxidative stress and inflammation confer biological plausibility to their involvement in DR pathogenesis. 36 Collectively, the regulatory network indicates that multilevel regulatory axes may be formed among TFs (e.g., E2F1), miRNAs (e.g., miR-31-5p), and lncRNAs (e.g., XIST). This sophisticated multilayered regulatory network may also underlie the molecular mechanism by which myeloid-derived exosomes concurrently modulate multiple pathological characteristics of DR.
The downregulation of PSMA7 is significant as it may exacerbate DR pathology through a dual mechanism. First, impaired proteasome function results in the abnormal accumulation of misfolded and oxidatively damaged proteins within retinal cells. Second, PSMA7 is implicated in the degradation of hypoxia-inducible factor-1α (HIF-1α).37,38 Its downregulation may lead to the aberrant accumulation and activation of HIF-1α in the chronically hypoxic retina, subsequently upregulating the expression of proangiogenic factors such as VEGF, thereby promoting pathological neovascularization—a hallmark of proliferative DR. This finding is consistent with observations of downregulated proteasomal components, including PSMA7, in the synovial tissue of patients with rheumatoid arthritis comorbid with type 2 diabetes. 39 The Human Protein Atlas reports that PSMA7 expression is elevated in the blood of diabetic patients. In contrast, we observed significant downregulation of PSMA7 in both retinal tissue and peripheral blood of patients with DR. This discrepancy suggests that at the advanced complication stage of DR, PSMA7 expression may have transitioned from compensatory upregulation to decompensatory downregulation. This dynamic expression pattern requires further experimental validation in future studies. Using the analytical algorithm developed by Emre Guney et al., 40 we constructed a drug–gene interaction network. It can be observed that these drugs influence the key gene PSMA7 through the PSMB family and inflammatory mediators such as tumor necrosis factor (TNF) and interferon-gamma (IFNG). In DR, chronic inflammation, oxidative stress, and dysregulated protein homeostasis are critical pathological features. 41 Inflammatory mediators such as TNF and IFNG contribute to retinal damage, while the epidermal growth factor receptor signaling pathway is involved in cellular stress responses and vascular dysfunction. 42 Meanwhile, the proteasome system, including PSMA7 and PSMB subunits, plays a key role in maintaining protein homeostasis under these conditions. The interplay among these pathways supports the biological relevance of the identified network.
Based on these findings, we propose that MSCs-Exo may facilitate the delivery of functional proteins, such as YBX1 and PSMA7, which synergistically enhance gene expression regulation and protein homeostasis in the DR retina. Concurrently, they modulate ribosomal function and suppress inflammatory pathways, including IL-17, thereby exerting protective effects at multiple levels. This multitarget mechanism of action positions MSCs-Exo as a potentially more promising therapeutic strategy compared with single-target drugs.
Conclusion
This study illustrates that YBX1 and PSMA7, derived from MSCs-Exo, are consistently downregulated in DR, suggesting that they may be protective factors and showing promise as diagnostic biomarkers for DR. Our findings propose potential avenues for the translational application of MSCs-Exo in the treatment of DR and contribute novel insights into the pathogenesis and early diagnosis of this condition.
Authors’ Contributions
L.Z. and J.J. were responsible for the research design and performed the experiments. J.L. and X.S. conducted data analysis and polished the article. S.P. and Z.D. conceived the study design and revised the article.
Ethics Approval and Consent to Participate
The study was approved by the hospital’s Ethics Committee (approval no. 2025IITLL-26) and adhered to the tenets of the Declaration of Helsinki. And it has been registered and filed in the national medical research registration and filing information system (http://114.255.48.20). All procedures were approved by the Animal Ethics Committee of Guilin Medical University (approval no: GLMU-IACUC-20251099) and adhered to the Association for Research in Vision and Ophthalmology statement.
Footnotes
Availability of Data and Materials
Author Disclosure Statement
The authors declare that they have no competing interests.
Funding Information
This work was supported by the National Natural Science Foundation of China (grant no. 82160197), Guilin Medical University Research Funding (grant no. LXIIT2025028), and the Graduate Innovation Project of Guilin Medical University (grant no. GYBK2025004).
Supplemental Material
Supplemental Material
References
Supplementary Material
Please find the following supplemental material available below.
For Open Access articles published under a Creative Commons License, all supplemental material carries the same license as the article it is associated with.
For non-Open Access articles published, all supplemental material carries a non-exclusive license, and permission requests for re-use of supplemental material or any part of supplemental material shall be sent directly to the copyright owner as specified in the copyright notice associated with the article.