



Abstract
Purpose:
This study evaluated the correlations between findings from 18F-fluorodeoxyglucose (FDG) positron emission tomography (PET), contrast-enhanced magnetic resonance imaging (MRI), and diffusion-weighted imaging (DWI) for hepatocellular carcinoma (HCC) lesions, and differences in imaging features between the infiltrative and noninfiltrative morphological subtypes of HCC were investigated.
Methods:
In this retrospective study, 79 patients with HCC imaged with hepato-specific contrast-enhanced dedicated liver PET/MRI were included. Patients were grouped as positive or negative based on MRI, and the sensitivity and specificity of PET imaging were calculated. In addition, patients were classified as infiltrative and noninfiltrative, and tumor SUV, metabolic tumor volume, total lesion glycolysis (TLG), and apparent diffusion coefficient (ADC) variables were compared. Correlations between SUV, tumor size, and ADC values were investigated through regression analyses. Linear regression analyses were used to investigate the relationships between DWI-/PET-derived variables and serum alfa-feto protein (AFP) levels.
Results:
A total of 79 patients were included in the study. PET imaging demonstrated 77% sensitivity and 88% specificity, and 19 (27%) patients had infiltrative morphology. The infiltrative subgroup showed a higher rate of portal venous tumor thrombosis (79%), and most tumor thrombi (79%) were 18F-FDG-avid. A significant relationship was observed between tumor SUV values, ADCmin, and tumor size. Serum AFP levels correlated with SUVpeak (R2 = 0.223) and TLG (R2 = 0.283; both p < 0.001) values.
Conclusions:
Higher 18F-FDG uptake was observed in infiltrative lesions compared with noninfiltrative ones. The majority of malignant tumor thrombi exhibited increased 18F-FDG uptake. Although the ability of 18F-FDG PET to detect HCC lesions is limited by the variable uptake in HCC tumors, it proves valuable in assessing tumor aggressiveness.
Keywords
Introduction
Hepatocellular carcinoma (HCC) is the most common primary liver cancer and ranks as the third leading cause of cancer-related death. 1 In patients with underlying chronic liver disease, HCC can be diagnosed noninvasively during routine follow-up through imaging techniques.2,3 Several modalities, including ultrasonography (US), liver magnetic resonance imaging (MRI), and dynamic computed tomography (CT), are utilized for detecting and characterizing liver nodules. 4 While US is widely available, MRI imaging offers a potential advantage over CT and US due to its superior soft tissue contrast. To standardize and improve the accuracy of imaging techniques such as US, CT, and MRI for HCC, the American College of Radiology developed the LI-RADS® CT/MRI v2018 system. 5 The categories in this system range from benign (LR 1–2) to intermediate probability for HCC (LR-3), probably HCC (LR-4), and definitely HCC (LR-5). This structured approach allows for noninvasive diagnosis of HCC in patients with chronic liver disease based solely on imaging findings, avoiding the need for biopsy, which is often required in other malignancies.
HCC presents in several different morphological subtypes, including nodular, massive, and infiltrative forms. 6 Among these, the infiltrative subtype is particularly difficult to identify against a background of cirrhosis, as it often blends into the liver parenchyma, making ill-defined lesions that are hard to detect. 7 Infiltrative HCC is also associated with a tendency for aggressive infiltration, frequently involving the portal vein, which further complicates treatment. Due to these characteristics, curative surgical options are usually not viable for infiltrative HCC.
In oncological imaging, molecular imaging methods such as 18F-fluorodeoxyglucose (FDG) positron emission tomography (PET) have gained importance and found several key uses in patient management. FDG PET plays a crucial role in oncology as metabolic changes often precede anatomical manifestations. This enables 18F-FDG PET to predict therapeutic response earlier than anatomical imaging methods. Despite its vital role in many solid tumors, its use in HCC is limited in HCC lesions. 8 In HCC, the activity of glucose-6-phosphatase, an enzyme abundant in liver cells, can be retained in well-differentiated HCC cells. This retention allows 18F-FDG to leave the cell without becoming trapped inside the cell. In addition, HCC cells often exhibit lower glucose transporter activity compared with other cancers, further limiting 18F-FDG uptake. Despite these limitations, 18F-FDG PET has utility in determining the in vivo differentiation of HCC lesions. Poorly differentiated and more aggressive HCC tumors show reduced glucose-6-phosphatase activity, resulting in higher 18F-FDG uptake.9,10 Given that more aggressive lesions are prone to develop extrahepatic metastases, the rationale for utilizing FDG PET in detecting metastasis of HCC becomes more relevant.
Recently, integrated PET/MRI systems have been introduced in several centers, offering a combination of high soft tissue contrast from MRI with the metabolic insights provided by PET. One key advantage of PET/MRI is the absence of X-ray radiation, making it especially useful in oncological settings where patients undergo repeated examinations. In addition, PET/MRI systems can utilize respiratory gating for PET, which significantly minimizes respiratory artifacts. This is particularly important for lesions near the diaphragm, where respiratory motion can lead to partial volume effects, potentially hindering lesion assessment.
In this study, we evaluated the correlations between findings from 18F-FDG PET, contrast-enhanced MRI, and diffusion-weighted imaging (DWI) for HCC lesions. By utilizing late-point integrated liver PET/MRI as the standard of care at their center, the authors sought to maximize the information that could be gained from 18F-FDG PET in evaluation of HCC. In addition, the authors investigated the differences in imaging features between the infiltrative and noninfiltrative morphological subtypes of HCC.
Methods
Patients and study design
This study is a single-center retrospective analysis involving HCC patients who were imaged with late-point dedicated 18F-FDG PET/MRI for staging or restaging indication and had at least 1 year of follow-up. Patients who had been imaged with PET/MRI with hepato-specific (Gadoxetate) contrast agent between September 2018 and December 2022 were included in this retrospective study. The exclusion criteria were as follows: (1) a history of treatment with transarterial radio/chemo-embolization or radiofrequency/microwave ablation, (2) a history of transplantation surgery, (3) lack of follow-up, and (4) the presence of a secondary primary malignancy. The study was approved by the institutional review board (Approval No. İ05-390-24).
18F-FDG PET/MRI protocol
Patients fasted for at least 6 h before imaging, and blood glucose levels were checked before the scan. Patients with blood glucose levels above 150 mg/dL did not undergo scanning. Images were acquired from the vertex to the proximal femur with the patient in a supine position. Whole-body 18F-FDG PET/CT imaging was performed approximately 1 h after an intravenous injection of 296–370 MBq (8–10 mCi) of 18F-FDG.
After the whole-body 18F-FDG PET/CT imaging, dedicated respiratory-gated contrast-enhanced liver 18F-FDG PET/MRI images were acquired during the same session without any additional injection of radiopharmaceutical. This was done with a mean delay of 138 ± 44 min after the 18F-FDG injection. PET/MRI imaging was conducted using a 3 Tesla GE Healthcare SIGNA™ PET/MRI (GE Healthcare, Milwaukee, Wisconsin, USA) system. The PET/MRI system is equipped with a spine body coil and a digital PET detector based on silicon photomultiplier (SiPM) technology.
The MRI sequences included axial T2-weighted fat-saturated (FS) and nonfat-saturated (non-FS) PROPELLER, axial pre- and postcontrast (late arterial, portal, venous) imaging, axial and coronal hepatobiliary (postinjection at 10 and 20 min) T1 LAVA, axial DWI with b-values of 50, 800, 1000, and 2000, axial apparent diffusion coefficient (ADC), axial out-of-phase and in-phase imaging, and coronal T2-weighted single-shot fast spin echo. PET imaging had a 20-min acquisition time, and PET images were reconstructed using a time-of-flight enabled VPFX algorithm with a 256 × 256 matrix, 2 iterations, and 28 subsets, along with a respiratory-gating enabled Q.Static algorithm.
18F-FDG PET/MRI image evaluation
Hybrid PET/MRI images were reviewed in three planes (transaxial, coronal, and sagittal) using an AW VolumeShare 7 workstation (GE Medical Systems). The PET/MRI were evaluated by consensus between a nuclear medicine specialist with 5 years of experience in PET/MRI and a radiologist with 7 years of experience in abdominal MRI. For all patients, the reference liver SUVmean was determined from a spherical volume of interest (VOI) with a 2 cm diameter, located in the nontumoral parenchyma of the right lobe of the liver.
All lesions detected on T2-weighted fat-suppressed (T2w FS) PROPELLER sequences and hypointense lesions on hepatobiliary LAVA T1 MRI sequences were evaluated for 18F-FDG avidity. Lesions were segmented using a threshold of 40% of the SUVpeak value within the VOI. All quantitative variables are calculated from the delayed 18F-FDG PET/MRI for this study, and the whole-body 18F-FDG PET/CT images were only used for systemic evaluation. The SUVpeak, SUVmean, metabolic tumor volume (MTV), and total lesion glycolysis (TLG) (calculated as MTV × SUVmean) of the segmented lesions were recorded. A lesion was considered 18F-FDG-avid if its SUVpeak was greater than 1.5 times the liver reference SUVmean. The tumor-to-background ratio (TBR) was calculated with the following formula:

For statistical analysis, the total number of 18F-FDG-avid lesions, the maximum SUVpeak value among the tumors, the SUVmean of all lesions, and the total MTV and TLG of all lesions were recorded. In addition, the presence, 18F-FDG avidity, and location (main trunk, right/left lobar, or segmental branches) of portal vein tumor thrombosis were recorded separately. In cases where the number of lesions exceeded 10, the analysis was limited to the 10 most significant lesions. If the tumor morphology was infiltrative, the lesion count was recorded as 1.
Dynamic contrast-enhanced MRI was reviewed according to the LI-RADS CT/MRI v2018 system developed by the American College of Radiology. 5 Lesions classified as LI-RADS 4 or LI-RADS 5 were considered positive on MRI. In addition to standard criteria such as arterial enhancement, venous washout, size, and growth, lesions were also categorized based on their morphological pattern—solitary, nodular, massive (noninfiltrative), or infiltrative—as described in the existing literature.6,7,11 The largest lesion in terms of diameter was identified, and its size was recorded. For each lesion, diffusion-weighted images and ADC maps were evaluated to measure ADCmin, ADCmean, and ADCmax (mm2/s) values, specifically for the lesion with the highest SUVpeak value. If no 18F-FDG-avid lesions were present, these measurements were performed on the largest lesion. Given that the diagnosis of HCC does not necessarily require histopathological confirmation due to the specific patient population, imaging characteristics, and the high accuracy of MRI in detecting and diagnosing HCC, MRI findings combined with follow-up data were considered the gold standard.
Statistical analyses
Descriptive statistics are presented as counts and percentages for categorical variables and as mean ± standard deviation and median (range) for continuous variables. A p-value of less than 0.05 was considered statistically significant for all analyses. PET findings were categorized as true positive, true negative, false positive (FP), and false negative using MRI findings as the gold standard.
The distribution of PET-derived variables between noninfiltrative and infiltrative categories was compared using the Mann–Whitney U test. The prevalence of portal vein tumor thrombosis between these two morphological groups and the rate of FDG avidity with LI-RADS categories were compared using chi-square tests. In addition, the correlation between PET-derived variables, ADC values, and the size of the largest lesion was analyzed using linear and logarithmic regression models. The PET- and DWI-derived variables’ relationships with the serum alfa-feto protein (AFP), albumin, and bilirubin levels were investigated with regression analyses. All statistical analyses were performed using IBM SPSS software (version 27, IBM, Chicago, Illinois, USA).
Results
Patient population and descriptive data
A total of 79 patients were included in the analysis. Of these, 65 (82%) were male and 14 (18%) were female. Seventy-one patients (90%) had underlying chronic liver disease, and 39 patients (49%) had histopathological confirmation of HCC diagnosis. Thirty-seven patients (46%) were imaged for staging, whereas the remaining 42 patients (53%) were imaged for restaging. Eighteen patients had extrahepatic metastases of HCC, including 13 with lymph node metastases, 6 with lung metastases, 4 with bone metastases, and 3 with peritoneal metastases.
Out of 79 patients, 68 patients’ serum AFP, albumin, and bilirubin levels were available. The median serum alpha fetoprotein (AFP), albumin, and bilirubin levels were 43.90 ng/mL (range: 1.33–60500), 36.50 g/L (range: 22.50–48.60), and 1.05 mg/dL (range: 0.35–20.39), respectively. Twenty-six patients (38.2%) were classified as albumin-bilirubin (ALBI) grade 1, 31 patients (45.6%) as ALBI grade 2, and 11 patients (16.2%) as ALBI grade 3.
Dynamic contrast-enhanced MRI and DWI findings
Of the patients, 71 patients had at least one LI-RADS 4 or LI-RADS 5 lesion. Eight patients (11.3%) had only LI-RADS 4 lesions, and 63 patients (88.7%) had at least one LI-RADS 5 lesion. The median largest tumor maximum diameter was 49 mm (range: 9–185). According to the mentioned morphological classification, 19 (27%) patients had infiltrative HCC lesions, whereas the remaining 52 (73%) patients had noninfiltrative subtypes. The median number of lesions detected by MRI in noninfiltrative group was 3 (range: 1–10). Total detected individual lesion number was 156. While no portal venous tumor thrombosis was observed in 52 (73%) patients with HCC lesions, 19 (27%) patients had macroscopic venous involvement. Among these patients, 8 patients had tumor thrombosis in main trunk of portal vein, 8 had tumor in the right portal vein or its branches, and finally, 3 patients had tumor in the left portal vein or its branches. In addition, in the 2 patients tumor thrombosis in right hepatic vein and inferior vena cava was observed. Among the infiltrative group 15 (79%) patients had macroscopic venous involvement, whereas among the noninfiltrative group 4 (8%) patients had tumor thrombosis of portal vein (p < 0.001).
In the analysis of DWI and ADC maps, the median ADCmin, ADCmean, and ADCmax were calculated as 793 × 10−6 mm2/s (433 × 10−6 to 1396 × 10−6), 1051 × 10−6 mm2/s (560 × 10−6 to 2047 × 10−6), and 1432 × 10−6 mm2/s (683 × 10−6 to 2384 × 10−6), respectively.
Among the infiltrative and noninfiltrative groups, the median ADCmin values were 712 × 10−6 mm2/s (528 × 10−6 to 1012 × 10−6) versus 840 × 10−6 mm2/s (433 × 10−6 to 1396 × 10−6); ADCmean values were 964 × 10−6 mm2/s (764 × 10−6 to 1396 × 10−6) versus 1088 × 10−6 mm2/s (560 × 10−6 to 2047 × 10−6); and ADCmax values were 1420 × 10−6 mm2/s (1097 × 10−6 to 2252 × 10−6) versus 1450 × 10−6 mm2/s (683 × 10−6 to 2384 × 10−6), respectively. No statistically significant difference was observed between the distribution of ADCmin (p = 0.077), ADCmean (p = 0.265), and ADCmax (p = 0.531) across the infiltrative and noninfiltrative groups (Table 1). In addition, no statistically significant difference was observed between the distribution of ADCmin (p = 0.581), ADCmean (p = 0.472), and ADCmax (p = 0.747) across the LI-RADS 4 and LI-RADS 5 groups.
Magnetic Resonance Imaging, Diffusion-Weighted Imaging, and Positron Emission Tomography Imaging Findings Across Infiltrative and Noninfiltrative Subtypes
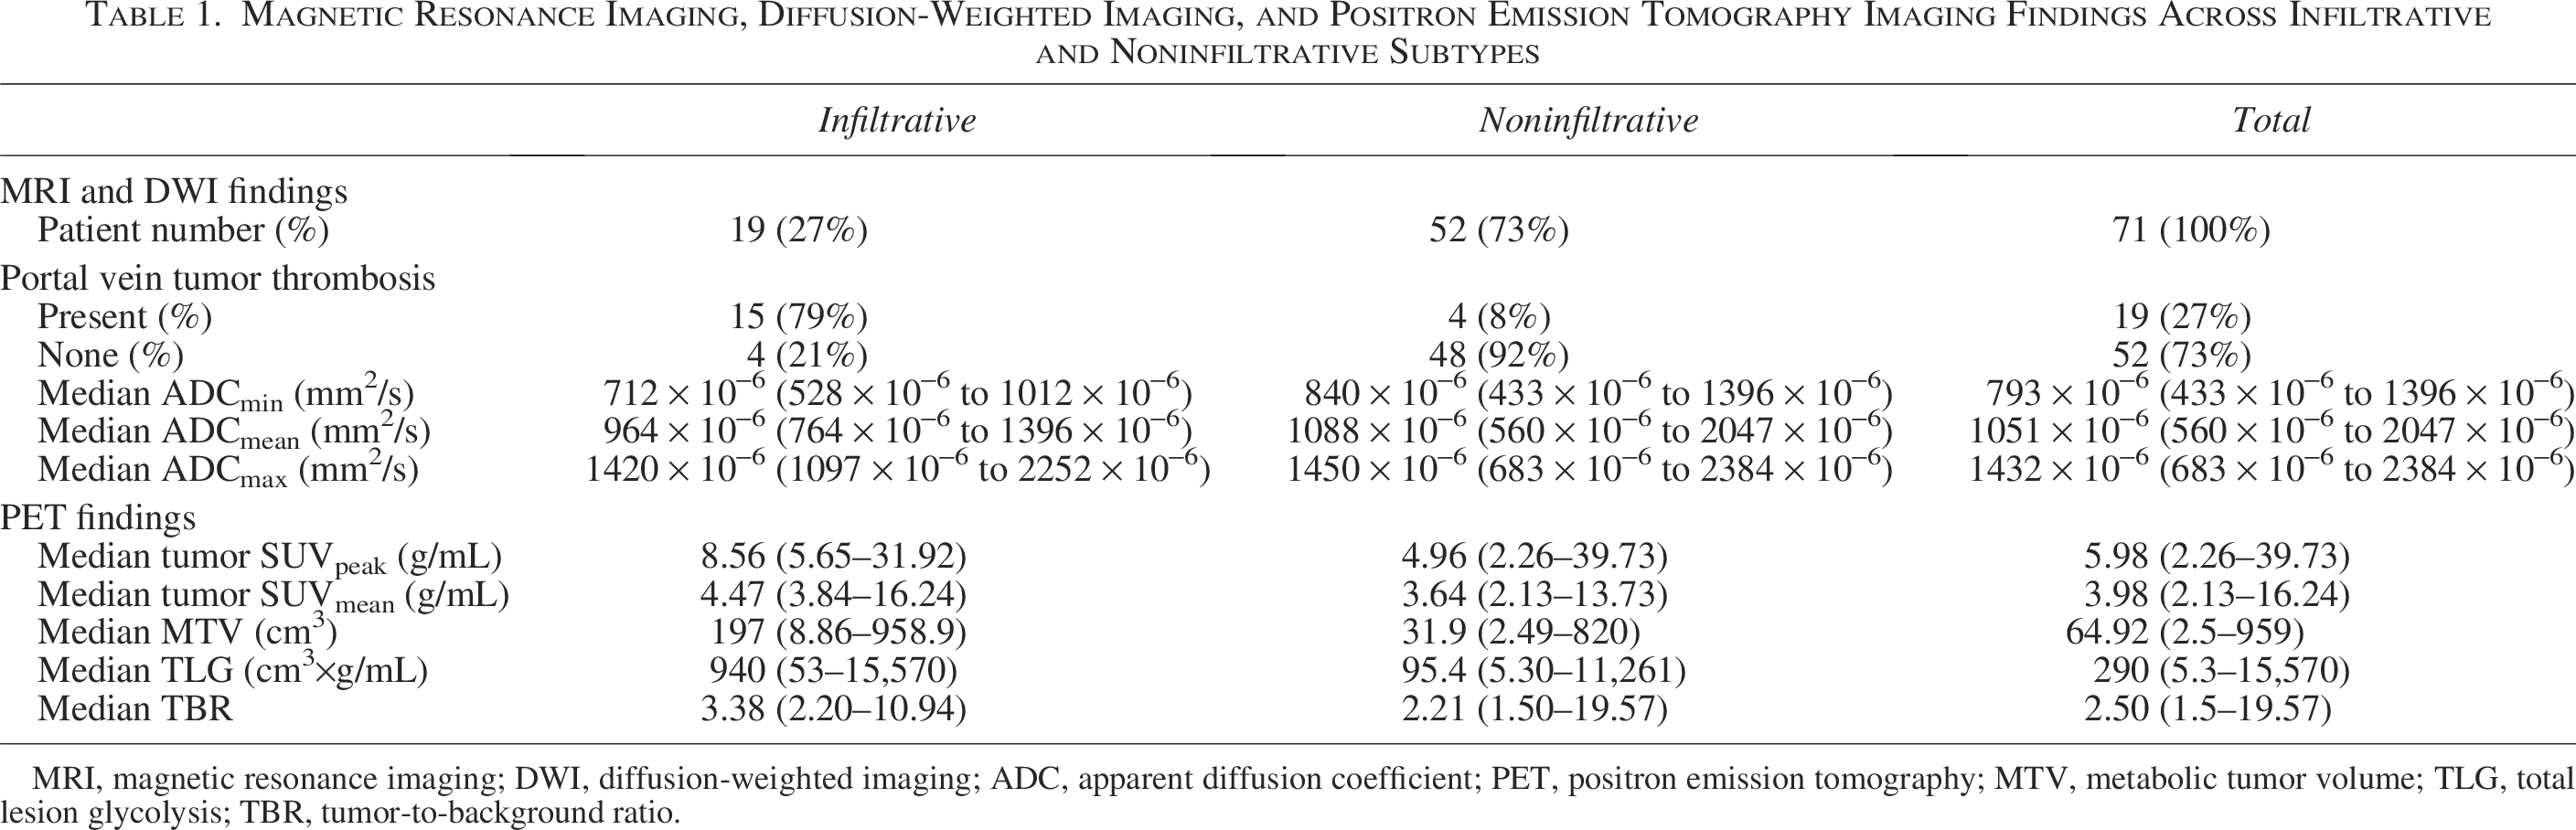
MRI, magnetic resonance imaging; DWI, diffusion-weighted imaging; ADC, apparent diffusion coefficient; PET, positron emission tomography; MTV, metabolic tumor volume; TLG, total lesion glycolysis; TBR, tumor-to-background ratio.
In the linear regression analyses between the serum AFP levels and ADCmin (R2: 0.029, p = 0.185), ADCmean (R2: 0.000, p = 0.999), and ADCmax (R2: 0.002, p = 0.711) values, no statistically significant relationship was observed. Similarly, no statistically significant relationships were observed between the DWI-derived variables and serum albumin and bilirubin levels.
18F-FDG PET imaging findings
A total of 56 patients (71%) had at least one 18F-FDG-avid focus in the PET component of the PET/MRI scans, with a total of 95 18F-FDG-avid foci detected. The sensitivity of PET imaging was 77% (95% CI: 67%–86%) and its specificity was 88% (95% CI: 56%–99%) in the patient-based analysis. The detailed true/false positivity/negativity rates and confusion matrix are given in the Table 2. In the lesion-based analysis, the sensitivity of PET imaging was 60% (95% CI: 53%–68%) (Fig. 1). The detection rate of PET imaging was 38% (3/8) in LI-RADS 4-only patients and 83% (52/63) in the LI-RADS 5 group (p = 0.015).

A 44-year-old male patient with the previous diagnosis of chronic Hepatitis B infection and poorly differentiated hepatocellular carcinoma was imaged for staging. Numerous intensely 18F-FDG-avid nodular lesions (red arrows) with diffusion restriction can be observed in PET MIP
Patient-Based Diagnostic Metrics and Confusion Matrix of 18F-Fluorodeoxyglucose Positron Emission Tomography Imaging Compared with Magnetic Resonance Imaging as Gold Standard

18F-FDG, 18F-fluorodeoxyglucose; PET, positron emission tomography; MRI, magnetic resonance imaging; TP, true positive; FP, false positive; FN, false negative; TN, true negative.
There was only one instance of false positivity observed in a patient who had previously undergone segmentectomy for HCC. The FDG-avid focus was in the operation site, with no significant arterial enhancement on MRI. Over a 2-year follow-up, no disease progression or changes in the operation zone were observed, and the described uptake was evaluated as postoperative changes (Fig. 2).
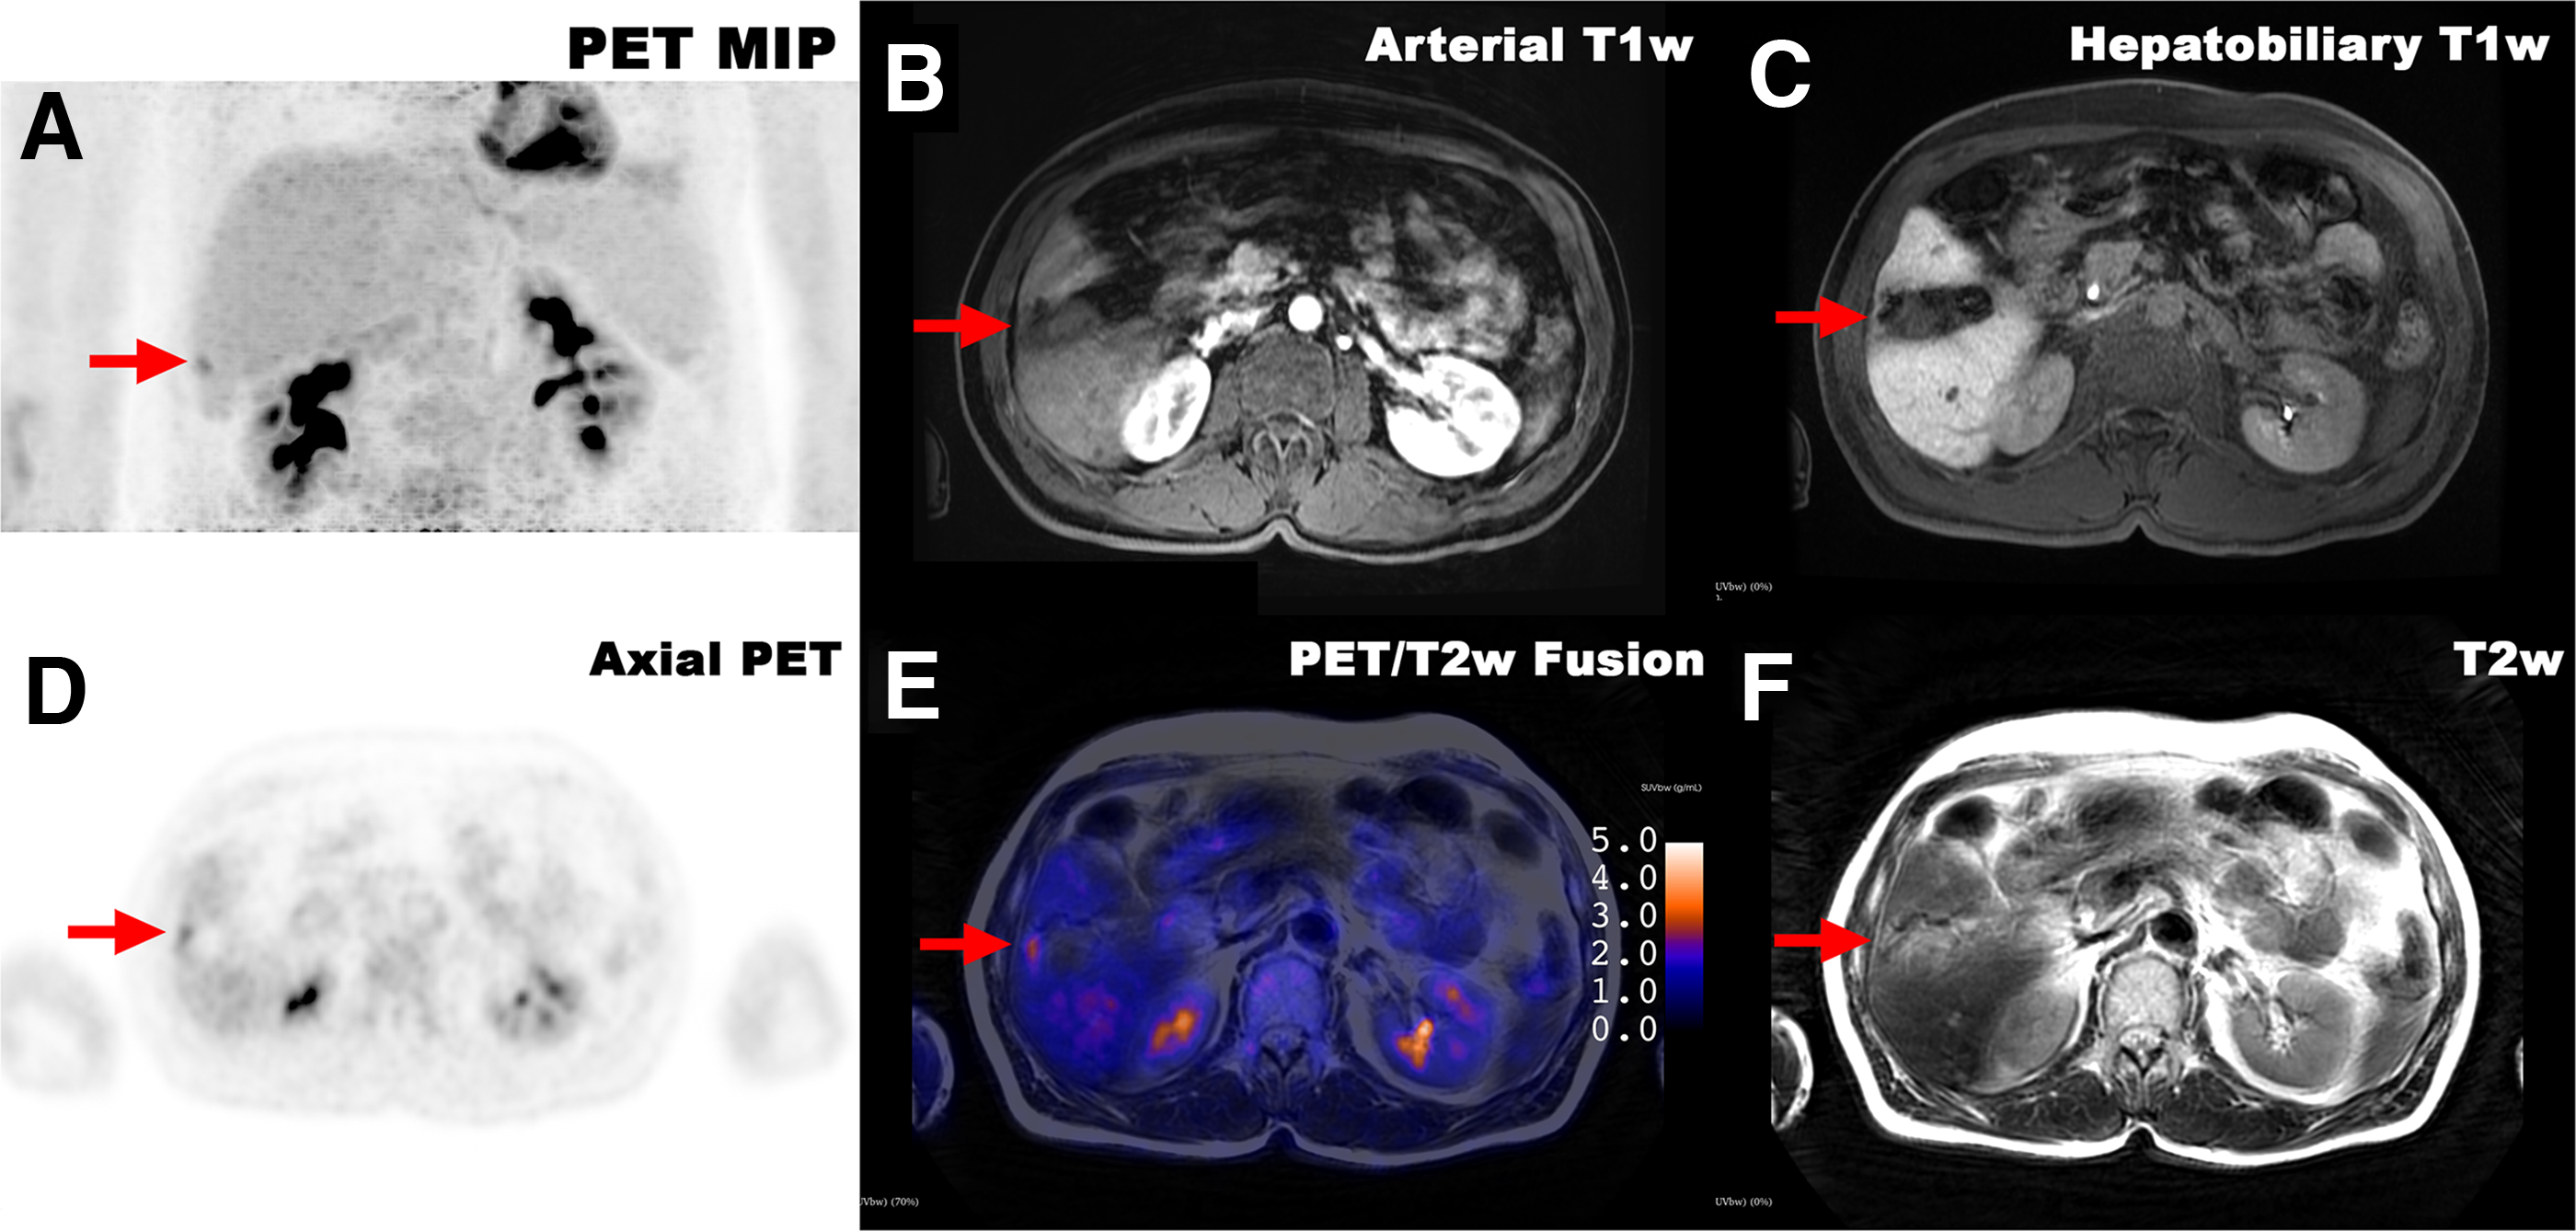
A 61-year-old male patient with the previous diagnosis of chronic Hepatitis B infection and moderately differentiated HCC was imaged for restaging after suspicion of recurrence on CT imaging. Mildly increased focal uptake of 18F-FDG near operation site (red arrows) can be observed in PET MIP
Among the patients with positive MRI findings, 16 (84%) with infiltrative morphology had positive 18F-FDG PET lesions, whereas 38 (73%) with noninfiltrative morphology had positive 18F-FDG PET lesions (p = 0.209). In addition, 18F-FDG-avid portal venous thrombosis was observed in 15 (79%) patients (Fig. 3) and no increased uptake of 18F-FDG was observed in 4 patients with tumor thrombosis (Fig. 4).

A 60-year-old male patient with the previous diagnosis of chronic Hepatitis B infection was imaged for staging. Intense diffuse infiltrating T2 hyperintense, 18F-FDG-avid lesions (green arrows) with significant diffusion restriction and tumor thrombosis (red arrows) in main and lobar branches of portal vein can be observed in PET MIP

A 61-year-old male patient with the previous diagnosis of cryptogenic cirrhosis was imaged for staging. A massive HCC lesion with arterial enhancement
The median SUVpeak, tumor SUVmean, MTV, TLG, liver SUVmean, and TBR values of the patients with positive PET imaging were 5.98 g/mL (range: 2.26–39.73), 3.98 g/mL (range: 2.13–16.24), 64.92 cm3 (range: 2.5–959), 290 cm3 × g/mL (range: 5.3–15,570), 2.17 g/mL (range: 1.26–4.81), and 2.50 (range: 1.5–19.57), respectively (Table 1).
Among the infiltrative and noninfiltrative groups, statistically significant difference was observed in the distribution of SUVpeak (medians: 8.56 g/mL vs. 4.96 g/mL, p < 0.001), tumor SUVmean (medians: 4.47 g/mL vs. 3.64 g/mL, p = 0.004), MTV (medians: 197 cm3 vs. 31.9 cm3, p < 0.001), TLG (medians: 940 cm3 × g/mL vs. 95.4 cm3 × g/mL, p < 0.001), and TBR (medians: 3.38 vs. 2.21, p < 0.001). No statistically significant difference was observed in the distribution of liver SUVmean (medians: 2.31 g/mL vs. 2.14 g/mL, p = 0.589) between two groups (Fig. 5).

Boxplots of ADCmin
Finally, linear and logarithmic regression models were utilized to investigate the relationship between PET-derived variables and MRI/DWI-derived variables. A statistically significant proportional relationship was observed between SUVpeak and largest lesion diameter in the linear (R2: 0.341, p < 0.001) and logarithmic (R2: 0.315, p < 0.001) models. In addition, an inversely proportional relationship was observed between SUVpeak and ADCmin (linear R2: 0.154, p = 0.003, logarithmic R2: 0.182, p = 0.001) and tumor SUVmean and ADCmin (linear R2: 0.180, p = 0.001, logarithmic R2: 0.192, p < 0.001) (Fig. 6). However, no statistically significant relationship was observed between SUVpeak, tumor SUVmean, and ADCmean, ADCmax values.

Scatter plot with linear and logarithmic regression lines of ADCmin-SUVpeak
In linear regression analyses, statistically significant relationships were observed between serum AFP levels and tumor SUVpeak (R2 = 0.223, p < 0.001), TLG (R2 = 0.283, p < 0.001), MTV (R2 = 0.160, p = 0.004), tumor SUVmean (R2 = 0.145, p = 0.005), and TBR (R2 = 0.117, p = 0.006). However, no statistically significant relationship was observed between the PET-derived variables and serum albumin/bilirubin levels.
Discussion
Despite its widespread use in many solid tumors, 18F-FDG PET has several disadvantages in the imaging of HCC. The relationship between the degree of FDG uptake and tumor differentiation represents a major limitation of 18F-FDG PET in well-differentiated HCC. The presence of high levels of dephosphorylating enzyme and low-glucose transporter activity in well-differentiated HCC results in reduced uptake and retention of 18F-FDG. In contrast, poorly differentiated HCC subtypes exhibit weak enzyme activity, resulting in stronger FDG uptake. 8 Thus, from a different perspective, this heterogeneity in 18F-FDG uptake may assist in determining the grade and aggressiveness of HCC lesions in vivo. In fact, in a study by Wang T. et al., SUVmax and tumor size were found to be significantly different between microvascular invasion-positive and -negative HCC. 12
In the first part of their study, the authors explored the findings on MRI and DWI. As expected, patients with infiltrative HCC had higher rates of portal vein tumor thrombosis. While the infiltrative HCC subgroup showed a lower mean ADCmin value compared with noninfiltrative HCC, the difference between the two groups did not reach significance. Furthermore, the authors investigated the correlation between PET and MRI/DWI findings, and 18F-FDG PET demonstrated 77% sensitivity and 88% specificity. In the literature, FDG PET has a relatively low overall sensitivity, ranging from 36% to 70%, for HCC lesions, consistent with the findings in their study. 8 However, as observed in their study, 18F-FDG PET demonstrated high specificity and a low rate of FP findings. In this matter, the MRI and CT imaging are the gold standard in the detection of HCC lesions in the liver, and LI-RADS CT/MRI v2018 system is used for standardizing the evaluation of liver lesions. While this system does not incorporate FDG PET for diagnostic categorization, their findings suggest that FDG avidity—when present—may serve as ancillary evidence of aggressiveness (e.g., infiltrative morphology, macrovascular invasion) and could support risk stratification and treatment planning alongside LI-RADS assessments.
The infiltrative group exhibited higher SUV, MTV, and TLG values compared with the noninfiltrative group. Furthermore, most tumor thrombi in the portal vein (79%) had increased 18F-FDG uptake. In a study by Sun L. et al., which included 5 patients, 4 of them were found to have highly metabolic tumor thrombosis in the portal vein, further supporting the utility of 18F-FDG PET in detecting thrombotic tumoral lesions. 13 Furthermore, Zhou X. et al. showed that 18F-FDG uptake in HCC correlated with larger HCC lesions and accompanying tumor thrombosis, similar to their study.14,15 In this context, the significantly higher FDG metrics, the authors observed infiltrative HCC to likely reflect more aggressive phenotypes characterized by lower glucose-6-phosphatase activity, increased glycolytic flux (e.g., GLUT-1/hexokinase II), higher tumor burden, and a high prevalence of macrovascular invasion—all of which favor higher 18F-FDG retention.16,17 Consistently, the authors found that most portal venous tumor thrombi were 18F-FDG-avid, underscoring utility of 18F-FDG PET for differentiating tumor thrombus from the bland thrombus. However, between the histological subtypes of HCC, there are several differences in terms of gene mutation profiles, and how does 18F-FDG uptake vary between these subtypes should be evaluated further in the future studies. 18
Finally, in the comparison of DWI and 18F-PET imaging, a significant inverse relationship was observed between ADCmin and SUVpeak/SUVmean values. Similarly, Wang et al. also reported a significant correlation between ADC and SUVmax values. 19 However, in the studies by Boussouar et al. and Ahn et al., no significant correlation was found between ADC values and SUV values.20,21 While this may appear to contradict the findings in their study, it is important to note that those studies included only 28 and 21 patients, respectively. Despite this, their study indicates that a significant correlation was present between ADCmin and SUV values (R2: 0.182 and 0.192).
While most studies regarding 18F-FDG PET imaging in HCC utilize PET/CT, studies with integrated PET/MRI remain limited. In a pilot study by Hectors et al., 15 patients with HCC were imaged using multiparametric FDG PET/MRI, and several significant correlations were found between dynamic MRI parameters and FDG PET SUV values. 22 Lv J. et al. also investigated the role of 18F-FDG PET/MRI in the characterization of HCC lesions. They demonstrated that tumor SUVmax, SUVmean, and ADCmean values were predictive of CK19 status, which is associated with more aggressive tumor behavior. 23 Finally, Kong E. et al. also investigated the role of integrated 18F-FDG PET/MRI in hepatic tumors and showed that SUVmax is negatively correlated with ADC in hepatic tumors, similar to their findings. 24 However, it should be noted that their study included not only HCC tumors but also cholangiocellular carcinomas and metastases. Based on the findings of their study, it can be hypothesized that FDG PET may be more useful for infiltrative subtypes of HCC. For HCC lesions with nodular characteristics and no significant diffusion restriction, molecular imaging with other potential radiopharmaceuticals such as 68Ga PSMA and 18F-FCH could be considered.25,26
This study has a few limitations. First, the retrospective nature of the study may have impacted the results. Second, although the diagnosis of HCC does not always require tissue biopsy, not all patients had histopathological confirmation. Future prospective studies with larger patient cohorts, histopathological confirmation, and follow-up data may help to confirm and further elucidate the correlations between metabolic and morphological findings of HCC lesions.
Conclusions
Although the ability of 18F-FDG PET to detect HCC lesions is limited by variable uptake in HCC tumors, it can be valuable for evaluating tumor aggressiveness. In this study, higher 18F-FDG uptake is observed with infiltrative lesions compared with noninfiltrative lesions. In addition, most malignant tumor thrombi exhibited increased 18F-FDG uptake. A significant relationship was observed between SUV and ADCmin values. In conclusion, 18F-FDG PET/MRI imaging can aid in assessing tumor aggressiveness and differentiating between malignant and nonmalignant portal vein thrombosis.
Authors’ Contributions
All authors contributed to the study conception and design. Image interpretation, data collection, and analysis were performed by B.D., C.S., D.K.O., N.O.K., M.A., and E.D. Statistical analysis was done by B.D. The first draft of the article was written by B.D., and all authors commented on previous versions of the article. All authors read and approved the final article.
Footnotes
Funding Information
The authors declare that no funds, grants, or other support were received during the preparation of this article.
Data Availability
The datasets generated during and/or analyzed during the current study are available from the corresponding author on reasonable request.
Ethics Approval
This study was performed in line with the principles of the Declaration of Helsinki. Approval was granted by the Ethics Committee of Ankara University (No. İ05-390-24).
Disclosure Statement
The authors have no relevant financial or nonfinancial interests to disclose.