



Abstract
We analyze the effect of munificence on the development of a proactive environmental strategy (PES) and firm performance. In addition, we examine the moderating role of perceived munificence on the association between innovation capabilities and PES and between PES and firm performance. These relationships are tested in a sample consisting in 263 Spanish agricultural firms operating in three different geographical clusters. Our results broadly support our hypotheses and suggest that although perceived munificence favors the development of a PES, it is in hostile environments where PES generates competitive advantages.
It is too difficult to think nobly when one thinks only of earning a living.
Introduction
Proactive environmental strategies (PES) can be conceptualized as competitive capabilities featuring environmental “best” practices that anticipate and prepare for future changes in regulations and social trends (Aragon-Correa & Sharma, 2003). PES extend beyond legal and industry standards and continuously seek to improve, redesign and/or transform operations, processes, and products that prevent—rather than ameliorate—negative impacts on the natural environment (Aragon-Correa, 1998; Buysse & Verbeke, 2003; Hart, 1995; Russo & Fouts, 1997).
On the one hand, research on PES has primarily focused on how internal capabilities and external contingencies affect their development and implementation (e.g., Aragon-Correa & Sharma, 2003; Hart, 1995). For example, previous studies have described how innovation capabilities can support the development of PES (Christmann, 2000; Marcus & Fremeth, 2009; Porter & van der Linde, 1995).
On the other hand, the relationship between PES and superior performance (i.e., Does it pay to be green?) has been thoroughly discussed in previous theoretical and empirical studies. Indeed, this topic has been the subject of several literature reviews (e.g., Ambec & Lanoie, 2008; Marcus & Fremeth, 2009; Molina-Azorin, Claver-Cortes, Lopez-Gamero, & Tari, 2009) and meta-analyses (Albertini, 2013; Margolis & Walsh, 2003; Orlitzky, Schmidt, & Rynes, 2003). Although this literature reports a generally positive relationship between PES and superior performance, the empirical evidence remains inconsistent (Albertini, 2013), and some studies report a nonsignificant or even negative relationship (e.g., Cordeiro & Sarkis, 1997; Jaggi & Freedman, 1992; Yu, Ting, & Wu, 2009). Thus, certain scholars and practitioners have become skeptical of any type of “rule of riches” that suggests that firms always benefit from increasing investments into environmental proactivity (e.g., Berchicci & King, 2007). As a result, a more moderate position is gaining momentum and is shifting the focus to the question, “When does it pay to be green?” This contingent approach suggests that an improvement in PES may only be beneficial for certain types of firms or under certain circumstances (e.g., Aragon-Correa & Sharma, 2003; Bansal, 2005; Berchicci & King, 2007; Marcus & Fremeth, 2009). Seminal research on strategic management emphasizes that there is no one best way of managing a company. An optimal strategy in one context may be suboptimal when confronting different contingencies (e.g., Aldrich, 1979; Galbraith, 1973). External contextual factors frame the adoption of particular strategies by providing incentives and setting constraints for their implementation (Pfeffer & Salancik, 1978). Therefore, “superior organizational performance comes from the proper alignment of endogenous organizational design variables with exogenous context variables” (Aragon-Correa & Sharma, 2003, p. 74). In this study, we analyze two variables related to PES: innovation (an endogenous organizational variable) and munificence (an exogenous context variable).
Four decades have passed since munificence was recognized as a central variable of the general business environment that influences organizations (Staw & Szwajkowski, 1975). Munificence can be defined as the extent to which the general business environment can support or constrain the sustained growth of an organization (Aldrich, 1979; Dess & Beard, 1984). More specifically, munificence is determined by the scarcity or abundance of resources, the existence of growth opportunities, and the intensity of competition (e.g., Aldrich, 1979; Castrogiovanni, 1991; Miller & Friesen, 1983). Munificence and hostility have been regarded as opposite ends of a continuum (e.g., Aragon-Correa & Sharma, 2003). Munificent environments are rich in critical resources, offer long-term and rapid growth potential and feature weak-to-moderate competition (Dess & Beard, 1984; Tang, Kreiser, Marino, & Weaver, 2010). Conversely, firms in hostile environments face intense threats generated by intense competition, resource scarcity, and demand constraints (Covin & Slevin, 1989; Miller, 1987). Furthermore, perceptions of munificence in the general business environment may diverge from reality and may also vary among companies (Boyd, Dess, & Rasheed, 1993; Tang et al., 2010). Thus, even firms operating in the same industry may have different perceptions of the general business environment, and such differences may result in different organizational strategies and capabilities and in subsequent organizational outcomes (Rumelt, 1991). Consequently, the role of perceived munificence is important because this dimension strongly determines strategic decision making, the process of developing competitive capabilities, and the perceived chances of organizational survival (Miller & Friesen, 1983).
Perceived munificence may directly affect the development of PES. When a manager considers the general business environment to be highly munificent, the likelihood of perceiving environmental issues as opportunities rises, which in turn increases the likelihood of formulating PES (Sharma, 2000). Conversely, when a manager considers the environment to be hostile (i.e., low perceived munificence), firms might focus on survival, and managers may favor strategies that promise short-run superior returns as opposed to long-term environmental protection (Shepherd, Patzelt, & Baron, 2013).
In addition, previous studies suggest that perceived munificence also plays a moderating role between PES and performance and between other firm capabilities (i.e., innovation) and PES (Aragon-Correa & Sharma, 2003). However, the empirical evidence is scarce and inconclusive (Aragon-Correa & Sharma, 2003; Sharma, Aragon-Correa, & Rueda-Manzanares, 2007). For example, Russo and Fouts (1997) found that firms with a greater investment in pollution prevention practices enjoyed superior financial performance than their competitors in high-growth industries. Based on this finding, it might be argued that environmentally proactive firms perform better in munificent environments; however, Aragon-Correa and Sharma (2003) argue from a theoretical basis that a munificent business environment may obfuscate the competitive advantages derived from PES because competitors may obtain other types of advantages that are unrelated to environmental strategies.
Numerous previous studies highlight the role of innovation in the process of creating environmental competitive advantages (e.g., Bansal & Gao, 2006; Christmann, 2000; Marcus & Fremeth, 2009; Porter & van der Linde, 1995). This literature suggests that a PES requires support from innovation capabilities to generate competitive advantages (e.g., Christmann, 2000). For instance, a new safer and less polluting pesticide will have increased chances of enjoying market success if it is launched ahead of the most polluting competing options. The role of munificence in this relationship remains unexplored, although there is strong evidence that munificence alters the organizational outcomes of innovation (Miller & Friesen, 1983; Smith & Grimm, 1987). As a result, there is no consensus regarding this topic in the previous literature, and a major theoretical gap persists.
This study contributes to the organizations and the natural environment (O&NE) literature by increasing current knowledge on value creation through environmental proactivity. On the one hand, scholars adopting a resource and capabilities approach (e.g., Christmann, 2000; Hart, 1995; Russo & Fouts, 1997; Sharma & Vredenburg, 1998) have argued that superior environmentally based competitive advantages result when PES are supported by other competitive capabilities, such as superior innovation (e.g., Christmann, 2000; Porter & van der Linde, 1995). On the other hand, scholars also contend that this process is influenced by external contingencies, such as perceived munificence (Aragon-Correa & Sharma, 2003). We build on these two approaches to reconcile existing inconsistencies and explain how the proper alignment among innovation, PES, and munificence drives superior performance.
Therefore, the aim of this article is to fill this research gap regarding the role of munificence by studying the direct effect of perceived munificence on PES and the moderating role of perceived munificence in both the relationship between innovation and PES and the relationship between PES and performance. Addressing this research question helps close a research–practice gap in the O&NE field and has important practical implications. For example, firms tempted to cut spending on environmental practices to address hostile market conditions should be able to determine whether this decision improves or diminishes subsequent performance.
Theoretical Framework and Hypotheses
Aragon-Correa and Sharma (2003) developed a theoretical framework that explains how the dimensions of the general business environment (i.e., perceived uncertainty, complexity, and munificence) moderate the effects of internal capabilities on the development of PES and, simultaneously, how each of those dimensions moderates the link between a firm’s PES and its competitive advantages. However, the empirical evidence validating the theoretical framework has been limited (Sharma et al., 2007), and the moderating effect of perceived munificence on the link between PES and competitive advantage remains particularly unclear (Aragon-Correa & Sharma, 2003).
A cost–benefit approach may enrich this discussion. Developing a superior environmental strategy “should be considered as a form of strategic investment” (McWilliams, Siegel, & Wright, 2006, p. 4). Using the framework of the resource-based view, McWilliams and Siegel (2001) proposed a model to analyze the suitability of investments in “assets of social responsibility,” such as PES. Green investments must pay off and generate value—either through lower costs or through differentiation advantages—to obtain superior economic rents, that is, competitive advantages (Barney, 2001). When managers are confronted with the decision of whether to invest in a product or process that diminishes the environmental impact of the firm, they likely assess the costs and benefits of the investment. However, we contend that the assessment of the costs and benefits of PES might be altered by managers’ perceptions about munificence. Therefore, perceived munificence affects investment decisions in PES and the process of developing environmental competitive advantages. Figure 1 illustrates the proposed theoretical model.
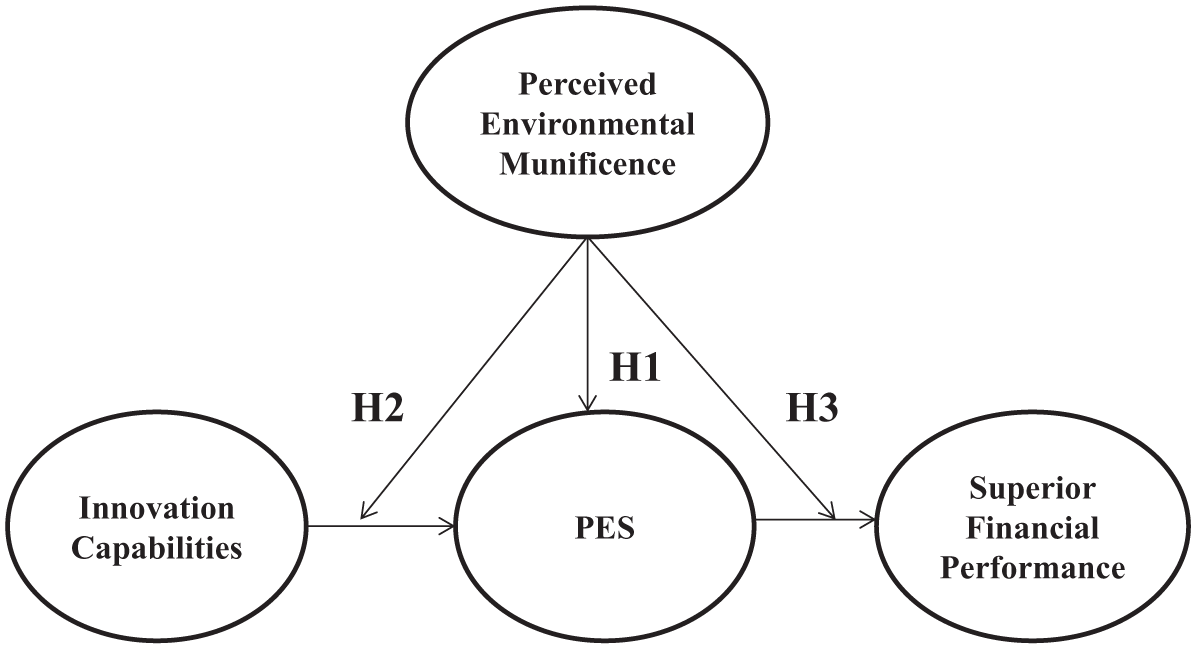
Theoretical model.
Perceived Munificence, PES, and Competitive Advantage
The O&NE literature has described corporate environmental strategies that range from conforming to regulations and standard industry practices to engaging in innovative and voluntary initiatives beyond such standards (Sharma, 2000). These two extremes are typically labeled reactive and proactive strategies (i.e., Aragon-Correa, 1998; Hunt & Auster, 1990). Reactive strategies consist of defensive approaches to environmental problems. Firms react to changes by instituting practices such as pollution measurement, end-of-pipe solutions, imitation of competing firms’ environmental initiatives and compliance with environmental regulations, and stakeholder requirements. Conversely, PES involve implementing environmental practices that anticipate and prepare for future changes in regulations and social trends, that extend beyond legal and industry standards and that continuously seek to improve, redesign or transform operations, processes, and products that prevent—instead of just ameliorate—negative environmental impact (Aragon-Correa, 1998; Buysse & Verbeke, 2003; Hart, 1995; Russo & Fouts, 1997).
Low perceived munificence (perceived hostility) reduces the degree of freedom for strategic decision making (Baum & Wally, 2003). When firms perceive the business environment as hostile, they are more likely to focus on core business activities that ensure firm survival (Miller & Friesen, 1983; Wiersema & Bantel, 1993). Managers might be tempted to cut expenses related to organizational processes that do not guarantee short-term financial outcomes, such as training regarding environmental issues, environmental life cycle assessment, and product redesign. As a consequence, environmental strategic postures will become more reactive.
Applying the cost–benefit model from McWilliams and Siegel (2001), hostility (low munificence) can reduce the number of firms that have the resources to invest in environmental practices as an integral component of a differentiation strategy. Therefore, it is more likely that managers simply do not have the resources required to invest in PES. In addition, because resources are more limited and sales are declining, the opportunity cost of investing in environmentally proactive practices (e.g., environmental training, pollution prevention) versus other alternatives is also higher. In these conditions, the relative cost of investing in PES is comparatively higher than in munificent environments.
Furthermore, there is evidence that perceived munificence moderates the effect of managers’ proenvironmental values on their assessments of environmentally harmful opportunities (Shepherd et al., 2013). In conditions of perceived hostility (i.e., low munificence), green personal values have a weaker effect on decision making, and environmentally damaging opportunities are considered more attractive. Therefore, the likelihood of maintaining and developing PES may decrease in these conditions.
By contrast, in environments that are perceived to be munificent (i.e., not hostile), managers will be less affected by resource constraints and stakeholders’ blockages (Castrogiovanni, 1991; Wiersema & Bantel, 1993). Under perceived munificence, companies have greater opportunity to extend beyond core activities (Castrogiovanni, 1991), and managers are more likely to be entrepreneurial and proactive in exploring new combinations of resources and developing more innovative projects (Rosenbusch, Rauch, & Bausch, 2013). Thus, perceived munificence leads to expectations that managers will allocate more resources to organizational learning and to generating dynamic capabilities, such as PES (Aragon-Correa & Sharma, 2003).
When the environment is considered munificent, it is more likely that investment in PES will be framed as an opportunity rather than a liability because firms anticipate high resource availability, market growth, and low competition. When the environment is conceived of as an opportunity, managers will be more likely to expect to achieve differentiation advantages from engaging in environmental protection, and these conditions will foster the adoption of PES (Aragon-Correa & Sharma, 2003; Menguc, Auh, & Ozanne, 2010; Russo & Fouts, 1997; Sharma, 2000). For example, Russo (2003) found that a munificent environment for independent power systems consisting of legal reforms, strong trade associations, and abundant natural capital fostered the rapid rise of the wind power industry in California. Therefore, we propose the following hypothesis:
The Contingent Effect of Perceived Munificence on the Link Between Innovation Capabilities and PES
Innovation is inherently related to proactive environmental management and pollution prevention (e.g., Sharma et al., 2007; Sharma & Vredenburg, 1998). PES typically consist of best practices and organizational routines that are linked to continuous improvement or reconfiguration of existing—and to the invention of new—products, processes, technologies, and business models (Hart, 1995; Sharma et al., 2007). In addition, innovation may enhance other abilities that are recognized as core elements of PES, such as proactivity, early timing and outperforming legal requirements, and market standards (Aguilera-Caracuel & Ortiz-de-Mandojana, 2013; Aragon-Correa, 1998). In this sense, innovation and PES can be regarded as complementary assets because innovation is required to gain competitive advantages through PES (Christmann, 2000).
The effectiveness of a firm’s approach to innovation has long been regarded as dependent on a variety of organizational and contextual variables (e.g., Damanpour, Szabat, & Evan, 1989; Miller & Friesen, 1983; Smith & Grimm, 1987). In particular, discretionary slack with respect to resources allows organizations to afford systematic experimentation and to bear the cost of implementing riskier innovations (e.g., Damanpour, 1991; Deeds & Decarolis, 1999). In munificent environments, resources are abundant and it is more likely that organizations will have some discretionary slack (e.g., Dess & Beard, 1984). Slack enables an organization “to experiment in relation to the environment, either through new product introductions or through innovations in management” (Bourgeois, 1981, p. 31). Thus, slack resources favor organizational innovation and problem-solving behaviors (Sharma, 2000) and will lower the perceived risk of adopting innovative environmental technologies and processes (Menguc et al., 2010; Russo & Fouts, 1997). In this context, organizations will be more likely to use their innovative capabilities to pursue complex and risky strategies—such as PES.
In addition, perceived munificence may affect the development of organizational structures that favor innovation effectiveness. In perceived hostile environments (scarcity), firms tend to formalize procedures, centralize strategic decision making, and reduce structural complexity (Yasai-Ardekani, 1989). Managers frequently respond to perceived hostility (i.e., low perceived munificence) by becoming more involved in routine decision making, establishing shorter lines of communication, and exercising more direct control. In this context, innovation capabilities might be translated less effectively into green practices. For example, if a firm in a hostile environment develops a process innovation aimed at reducing waste, it is less likely either that top management will ask for valuable insights from lower level employees who routinely operate the process or that lower level employees will spontaneously suggest ideas about—or improvements to—the process.
Conversely, managers tend to respond to perceived munificence by delegating decision making to and empowering lower level organizational units and specialists and by reducing procedural formalization to allow greater flexibility (Yasai-Ardekani, 1989). The cost of failures associated with loose control of strategic decisions is regarded as negligible compared with the benefits of being able to rapidly respond to environmental opportunities (i.e., early timing). Such core elements of organic organizations are essential when developing innovations for preventive solutions and PES (Aragon-Correa & Sharma, 2003; Russo & Fouts, 1997).
After conducting an extensive meta-analysis, Damanpour (1991) concluded that innovation capabilities are more effective when a firm engages in organic organizational approaches (low formalization, decentralized decision making, and structural complexity) as opposed to mechanized approaches. Similarly, Miller and Friesen (1983) found that conservative—as opposed to entrepreneurial—organizations obstruct innovativeness. Perceived munificence thus encourages a firm to align its organizational structure and innovation capabilities to improve environmental proactivity. Therefore, we propose the following hypothesis:
The Contingent Effect of Perceived Munificence on the Creation of Environmentally Based Competitive Advantages
The role of munificence in developing environmentally based competitive advantages appears to be intricate and multifaceted. Aragon-Correa and Sharma (2003) argued that, although munificent environments may enhance the potential of a firm to translate its PES into a superior performance, the competitive advantages derived from such a proactive strategy might be obstructed by other types of potential advantages (unrelated to environmental strategy) that competitors may gain in munificent environments.
This logic accords with the model proposed by McWilliams and Siegel (2001). Some companies may benefit (e.g., obtain competitive advantages) from engaging in proenvironmental practices even when these advantages do not necessarily translate into better performance than that of their competitors. Investments in environmental proactivity may not necessarily have a significant effect on profitability because (a) the company’s costs may also increase and (b) competitors may have other differentiation advantages that provide superior rents. For example, organic foods might have a differentiation advantage in the marketplace that drives some customers to prefer these foods to the nonorganic foods offered by competitors. However, this advantage might be obscured by other factors, such as considerably higher pricing, limited market supply, or limited distribution.
In munificent environments, firms are not required to exhibit competitive superiority, and survival is possible under a greater number of different alternatives, strategies, and organizational structures (e.g., Peteraf & Bergen, 2003). As a consequence, munificence increases the number of profitable strategic options and enhances organizational heterogeneity (Terjesen, Patel, & Covin, 2011). Therefore, munificence makes it more likely that weak PES can be compensated for by employing a different type of competitive advantage (Aragon-Correa & Sharma, 2003), and the effect of PES on performance is therefore less salient. For example, in a fast-growing market, a monopolistic firm will most likely show good financial results regardless of its environmental strategy.
Conversely, the relationship between PES and performance might be more prominent in low-munificence environments. Seminal studies in strategy suggest that companies with a more proactive, innovative, and entrepreneurial strategic posture frequently perform better in hostile environments (e.g., Covin & Slevin, 1989; Smith & Grimm, 1987), whereas “in benign environments, the relationship between an entrepreneurial strategic posture and firm performance may be much weaker and possibly negative” (Covin & Slevin, 1989, p. 77). Therefore, those companies with a proactive approach to environmental issues might have substantial potential to generate rents in hostile environments. As we previously argued (Hypothesis 1), perceived munificence facilitates the development of PES. However, because there is a general tendency to implement environmental practices in a perceived munificent business environment, implementing PES in a nonhostile environment might not provide unique competitive advantages to the same extent as it might in a hostile environment.
In addition, it may be more difficult to imitate PES in hostile environments. Resource scarcity may cause and/or prolong the effects of inadequate management of firm resources and may cause market opportunities to be missed (Sirmon, Hitt, & Ireland, 2007). In environments that are perceived to be hostile, managers of laggard firms may decide not to devote precious resources to complex environmental practices that are not directly linked to short-term survival, such as new green technologies, product or process environmental re-designs, environmental life cycle assessments, or environmental management-related training. As a consequence, firms are less likely to implement and maintain a proactive approach to sustainability in a hostile environment, which means that firms that do so will gain a more unique competitive advantage. Therefore, we propose the following hypothesis:
Method
Sample Selection and Data Collection
Our sample is the result of a combination of archival data and mail survey responses. Archival data were gathered from Sistema de Análisis de Balances Ibéricos (SABI). This database compiles information about firms’ economic activities, financial information, location, industrial sector, and other miscellaneous information that Spanish companies disclose annually in official and public registers. Survey data were obtained from a sample of companies with more than 10 employees operating in the food industry in three Spanish geographical clusters. Companies in the sample belonged to the following sectors: vegetable/fruit or wine production, barrel and bottle companies, packaging, agricultural machinery, pesticides, and seeds. We selected this research setting because green agricultural practices are particularly salient and valuable for consumers in this environment. Consequently, PES have an enhanced potential to be the source of competitive advantages in such a setting. In addition, despite the demonstrated significant growth of these clusters over the past 20 years, new business models and innovations—new products and processes—have flourished in the sector, which has raised competitive pressures Martinez-del-Rio, Cespedes-Lorente, and Carmona-Moreno (2012). Specifically, the geographical clusters analyzed in this study host firms characterized by conditions of munificence and hostility. The result is substantial heterogeneity among companies in the agricultural clusters in terms of their implementation of PES, their innovation activities, and their perceptions regarding the degree of munificence in their environment. Thus, this empirical setting is relevant and provides sufficient variability to examine the relationships proposed in this study.
In-depth interviews with seven managers were conducted as an initial step to pretest the questionnaire; the feedback obtained indicated that the questionnaire fit the empirical setting well, which ensured face and content validity. The final questionnaire was sent to a total of 895 CEOs of companies located within a radius of 50 km of a cluster’s focal point. Three mailing waves were launched between February and November, in 2005. The response rate was 266 (29.72%). However, due to incomplete questionnaires and the inability to find secondary data for two of the companies, the final sample consists of complete and valid data from 258 firms. Among these firms, 27.04% produced or processed grapes or wine, 9.44% were agricultural machinery manufacturers, 7.3% were seed producers, 6.87% were pesticide producers, and the remaining 13.73% belonged to other related sectors. We addressed the potential for nonresponse bias by collecting data on certain key attributes—such as the number of employees and return on total assets (ROA)—from the SABI database and compared the responses of our sample with those of nonrespondents. Our t tests revealed no significant differences in the mean size (t = .87) and the mean ROA (t = .93) between respondents and nonrespondents. In addition, we conducted Kolmogorov–Smirnov two-sample tests to confirm the representativeness of our sample. The findings for size and ROA suggested that the two samples (respondents vs. nonrespondents) were drawn from the same population (p = .20 and p = .22, respectively). We also did not find significant differences between the firms that responded to the survey early compared with those that responded late (see Table 1).
Statistical Significance in the Differences Among Early and Late Respondents.

Note. ROA = return on total assets; PES = proactive environmental strategies.
Despite our reliance on self-reported data to measure innovation capabilities, perceived munificence, and PES (first hierarchical regression analysis), several factors led us to rule out concerns about common method bias from our sample. First, Podsakoff, MacKenzie, Lee, and Podsakoff’s (2003) guidelines were followed during the survey design step and the information collection step. Second, it is difficult for interviewees to guess the direction of the relationships proposed (moderation) and to structure their responses accordingly. Finally, we conducted Harman’s one-factor test to empirically detect any possible common method bias. The factor analysis revealed the selection of more than one factor as the optimal solution (three factors emerged with eigenvalues >1), and no factor accounted for the majority of the variance (Factor 1 = 35.1%, Factor 2 = 15.5%, and Factor 3 = 8%). Moreover, the items tended to load on different factors, corresponding to each construct. The second moderated hierarchical regression analysis was not affected by the potential presence of common method variance because firm financial performance was collected from a secondary data source, SABI.
Measures
To ensure content validity, the measures used in the analyses were validated from a review of prior research; the constructs were drawn from previously accepted and validated scales. A detailed description of the items is included in Appendix A. The multi-industry and multicluster natures of the sample led us to standardize certain variables with the aim of avoiding problems of interpreting similar scores in different sectors (Hambrick, 1983). Consistent with Aragon-Correa (1998), we standardized firm financial performance, PES, and innovation capabilities measures by using the average and standard deviation of the sector in the region to avoid bias that might be caused by different situations in each sector and to make the scores comparable with one another.
Dependent Variables
Proactive environmental strategy
Following the scale developed by Aragon-Correa (1998), each manager was asked to evaluate the environmental practices of their firms in comparison with other companies in the sector on a 7-point Likert-type scale. A high score indicates a high degree of proactivity in a firm’s environmental strategy. An initial exploratory factor analysis (EFA) showed the unidimensionality of the construct (1 factor with an eigenvalue >1 that explained 62% of the variance). However, after conducting a confirmatory factor analysis (CFA) to test convergent validity, four items were found not to have significant factor loadings, and these items were thus removed from the scale as recommended for formative scales (Hair, Anderson, Tatham, & Black, 1999). The purified 10-item scale yielded a Cronbach’s alpha coefficient of .93, which indicates good reliability of the measurement, and the CFA showed construct independence, a good fit to the data and convergent validity (comparative fit index [CFI] = .98; root mean square error of approximation [RMSEA] = .06; factor loadings ranging from .74 to .86, which were significant at p < .05). Composite reliability (CR) test was computed to further assess convergent validity. The CR value was .90, which is well above the suggested cutoff point of .70 (Fornell & Larcker, 1981; Hair et al., 1999). PES was also used as an independent variable to predict firm financial performance.
Superior financial performance
A firm has a competitive advantage when it enjoys performance that is superior to current competitors in its industry. The dependent variable was represented by a three-item scale consisting of the average value of the ROA, profit margin, and economic profit for 2006 and 2007. This variable allows competitive advantages to be captured because standardized scores provide an indicator relative to competitors’ scores. Firms with values higher than 0 showed superior financial performance compared with the sector average. We conducted an EFA that confirmed the unidimensionality of the construct (with an explained variance of 87.20%). A CFA allowed us to confirm good internal consistency reliability (Cronbach’s alpha of .92) and convergent validity (CFI = .99; RMSEA = .02; factor loadings ranging from .88 to .97, which were significant at p < .05). Furthermore, the CR was .75, confirming convergent validity. Data were based on firms’ annual accounts for 2006 and 2007 that were gathered from the SABI database. The lag between the dependent and independent variables reduced the risk of reverse causality that is common in cross-sectional studies. In addition, the use of a secondary (different) data source also ruled out the potential presence of bias derived from common method measurement.
Independent Variables
Innovation capabilities
To operationalize the extent to which firms possess innovation capabilities that are superior to those of their competitors, we used the four-item measurement scale developed and validated by Covin and Slevin (1989). An EFA revealed the convergence of the four items in a one-factor solution (with an explained variance of 67.42%). The CFA ensured a satisfactory internal consistency reliability (Cronbach’s alpha of .84), a good fit to the data and convergent validity (CFI = .98; RMSEA = .02; factor loadings ranging from .74 to .87, which were significant at p < .05). In addition, we conducted a CR test that confirmed the convergent validity of the construct (.78).
Perceived munificence
Environmental dimensions were measured based on managerial perceptions about the general business environment. The previous literature has emphasized the importance of perceptions in the process of aligning organizations’ characteristics with their environmental context because perceived contextual dimensions can diverge from reality and unperceived events do not affect organizational actions and decisions (e.g., Boyd et al., 1993; Tang et al., 2010; Yasai-Ardekani, 1989). Organizations only generate responses to what they perceive. Therefore, perceived contextual factors should exert a stronger influence on a firm’s behaviors and outcomes because even objective environmental forces must be perceived and evaluated before they can affect managerial decision making (Rumelt, 1991). Accordingly, perceptual measures have been recommended to capture munificence (Aragon-Correa & Sharma, 2003; Boyd et al., 1993; Rumelt, 1991; Shepherd et al., 2013). Castrogiovanni (1991) indicated that munificence is a multidimensional construct that can be divided into three interrelated categories: capacity (the level of resources available to firms within a general business environment), growth/decline (the relative change in capacity), and opportunity/threat (the extent to which capacity is unexploited). Tan and Litsschert (1994) based their operationalization of perceived munificence on this definition with the development of the five-item 7-point Likert-type scale that we use in this study. An EFA confirmed the unidimensionality of the construct (one factor with an eigenvalue >1 that explained 63% of the variance). The CFA revealed good internal consistency reliability (Cronbach’s alpha of .61), a reasonable fit to the data and convergent validity (CFI = .80; RMSEA = .02; all factor loadings ranging from .50 to .71 at p < .05). CR measured .70, which assured convergent validity.
Control Variables
We also included a set of variables in the analyses to account for possible alternative explanations: other dimensions of the general business environment (perceived uncertainty and perceived complexity) and firm characteristics (size, prior financial performance, and CEO’s experience). Perceived uncertainty affects managers’ ability to understand why factors change, the probability of those changes and their implications for their organizations, which makes the identification of successful strategic options difficult. We adapted the scale of Tan and Litsschert (1994) and used a construct consisting of two items (7-point Likert-type scale). Perceived complexity is primarily defined as the proliferation and diversity of factors that have a potential influence on a firm (Miller & Friesen, 1983). Again, we used the measurement method from Tan and Litsschert (1994) for perceived complexity, which consists of two items (7-point Likert-type scale). Although CFA cannot be used to validate a two-item scale, Cronbach’s alpha provided acceptable values of .60 and .65 for perceived uncertainty and perceived complexity, respectively. Size was included as the natural log of the number of employees obtained from the SABI database. Consistent with previous studies (e.g., Aragon-Correa, Martin-Tapia, & Hurtado-Torres, 2013; Bansal, 2005), we used prior financial performance (the dependent variable for the years 2004 and 2005) to control for firm-specific structural factors affecting its financial performance. Finally, we added the reported experience of the CEO (in years) in such position because such experience might affect both dependent variables.
Divergent Validity
Three tests were sequentially conducted to assess divergent validity between each pair of factors (see Anderson & Gerbing, 1988). First, 95% confidence intervals of ±2 standard errors were constructed around the correlation estimate between the constructs and were checked if the value 1 fell within any of the intervals; none of the confidence intervals included the value 1, thus providing evidence of the divergent validity of the constructs. Second, chi-square difference tests were performed to compare the fit of constrained (correlation fixed at 1) and unconstrained (freely estimated correlation) nested models. In all cases, unconstrained CFA models fit the data significantly better than constrained models, which provided further support for divergent validity (see Appendix B). Finally, as shown in Table 2, construct intercorrelations were all below the threshold value of .85 that would signal problems of divergent validity (Anderson & Gerbing, 1988). Overall, the three tests were indicative of good divergent validity between the constructs.
Descriptive Statistics, Standard Deviations, and Correlations.

Note. PES = proactive environmental strategies.
p < .05. **p < .01. ***p < .001.
Taken together, the factors examined in this study have satisfactory internal consistency reliability and construct validity.
Results
Our hypotheses were tested using a moderated hierarchical regression analysis (Cohen & Cohen, 1983). We conducted this analysis in two steps. First, we examined the direct effect of perceived munificence on PES and its moderation effect on the relationship between innovation capabilities and PES. Second, we analyzed the direct impact of perceived munificence on a firm’s superior financial performance and the moderating effect of perceived munificence on the PES–financial performance link.
Table 2 provides some descriptive statistics and the correlations among the analyzed variables. Because the multi-item variables were operationalized in terms of the mean and standard deviation of their sector, the values of the mean and standard deviation are close to (but not equal to) 0 and 1, respectively. The correlation matrix shows low to moderate correlation among the variables, with all the correlation coefficients below acceptable threshold values (Hair et al., 1999). The highest coefficient was found between firm financial performance and prior financial performance (.611), which is reasonable because these variables are the same measurement that is taken at different points in time. The correlation matrix also demonstrates that perceived munificence and PES are significantly correlated (p < .01), which supports the argument that companies are more likely to adopt PES under perceived munificent environmental conditions. Multicollinearity was not considered a concern because the variation inflation factors in all models ranged from 1.011 to 1.289 and the tolerance indices ranged from .99 to .776, which are well below critical values. The Durbin–Watson test also supported the absence of multicollinearity in the data.
Table 3 displays the results obtained from predicting PES. Model 1 provides a baseline that includes all the control variables. Model 2 adds the main effects for innovation capabilities and perceived munificence, whereas Model 3 shows the moderating effect of perceived munificence. Among control variables, the size of the company is found to be positively related to PES. Model 2 confirms that perceived munificence has a significant positive effect on PES, which supports Hypothesis 1. In addition, we find that innovation capabilities and PES are marginally associated. Finally, Model 3 shows that the moderating effect of perceived munificence on innovation capabilities and PES is significant and positive. In addition, the increment in the variance explained (ΔR2 = .024%) is significant. Therefore, we find support for Hypothesis 2. Notably, after including the moderation effect in Model 3, the effect of innovation capabilities on PES becomes significant.
Regression Results on Proactive Environmental Strategies.

Note. Nonstandardized regression coefficients and standard errors in parentheses.
p < .10. *p < .05. **p < .01. ***p < .001.
Table 4 provides the results of the regression analysis with superior financial performance as the dependent variable. Again, the variables were introduced in different steps to check the variation in the percentage of variance explained. We entered control variables in Model 1, main effects in Model 2 and Model 3 and, finally, the interaction term between PES and perceived munificence in Model 4. With regard to control variables, prior financial performance is found to exert a positive influence on superior financial performance (p < .001). Model 2 reveals that perceived munificence has a positive and significant effect on superior financial performance. Model 3 shows that PES has a direct positive and significant effect on superior financial performance as well. Finally, Model 4 shows that perceived munificence has a significant negative effect on the relationship between PES and superior financial performance. The statistical significance of the increment in the variance explained (ΔR2 = 2.0%) also supports the importance of the moderating effect.
Regression Results on Superior Financial Performance.

Note. PES = proactive environmental strategies. Nonstandardized regression coefficients and standard errors in parentheses.
p < .10. *p < .05. **p < .01. ***p < .001.
Figure 2 illustrates the moderating effect of perceived munificence on the relationship between innovation capabilities and PES. Following Cohen and Cohen (1983), we represented innovation capabilities, measured in standard deviations from the mean, on the x-axis. Different levels of perceived munificence were captured: 1 standard deviation below the mean (low perceived munificence) and 1 standard deviation above the mean (high perceived munificence). The plot illustrates how perceived munificence changes the relationship between innovation capabilities and PES. For firms perceiving high munificence, higher scores on innovation capabilities translate into higher scores on PES. However, when perceived munificence is low (i.e., perceived hostility is high), higher scores on innovation capabilities do not translate into higher scores on PES; on the contrary, innovation capabilities and PES are not aligned, and higher scores on innovation capabilities are associated with lower scores on PES.

The moderating effect of perceived munificence on the link between innovation capabilities and PES.
Similarly, Figure 3 illustrates the moderating effect of perceived munificence on the relationship between PES and superior financial performance. Following the same methodology (Cohen & Cohen, 1983), we represented PES, measured in standard deviations from the mean, on the x-axis. The plot suggests that in environments perceived as hostile, high scores on PES enhance financial performance. However, in perceived munificent environments, PES do not affect financial performance. Therefore, because the effect of developing PES led to the highest financial performance in environments perceived as slightly munificent, Hypothesis 3 is supported.
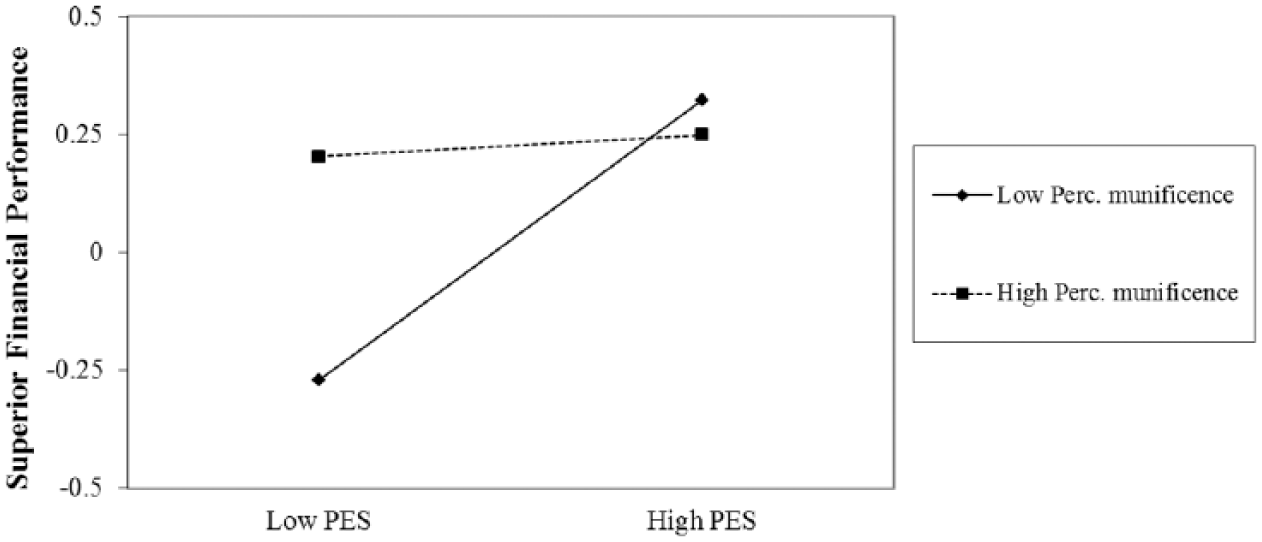
The moderating effect of perceived munificence on the link between PES and firm superior financial performance.
Discussion, Contributions, and Future Research
This article emphasizes the key role of perceived munificence in the adoption of PES and the development of green competitive advantages. First, we found that perceived munificence is positively related to the development of PES. These results suggest that when managers perceive the general business environment as hostile, they are less likely to adopt a PES. Second, our findings show that perceived munificence negatively moderates the relationship between a firm’s PES and subsequent financial performance; in other words, the competitive advantage of a PES will be lower in environments perceived as munificent. In hostile environments, there will be fewer companies developing PES because managers will frequently lack the necessary resources and the relative cost of maintaining complex practices that are not directly related to short-term survival (such as new green technologies or environmental management-related training) might be higher than in munificent environments. Thus, in such contexts, only a few companies will adopt a proactive approach to the natural environment. In addition, complex and dynamic capabilities—such as PES—are more difficult to imitate in hostile environments (Aragon-Correa & Sharma, 2003; Teece, Pisano, & Shuen, 1997). Consequently, the competitive advantage of proactive firms will be more sustainable. Our results are in accordance with seminal studies in strategy that found that proactive and innovative organizational approaches yield better results in hostile environments (e.g., Covin & Slevin, 1989; Smith & Grimm, 1987).
In addition, consistent with previous studies (e.g., Sharma & Vredenburg, 1998), our findings suggest that innovation capabilities are a significant antecedent for implementing PES. Thus, firms with superior innovation and continuous improvement capabilities will be more likely to develop advanced responses to environmental challenges. We found empirical support for the moderating role of perceived munificence in the relationship between innovation capabilities and PES, which confirms that perceived munificence affects the internal processes of value creation through environmental strategies (e.g., Aragon-Correa & Sharma, 2003; Rueda-Manzanares, Aragon-Correa, & Sharma, 2008).
This study makes several contributions to the literature. Overall, our results add to the understanding of the complex relationships among perceived munificence, PES, and financial performance (Aragon-Correa & Sharma, 2003). This study joins the growing research stream (e.g., Albertini, 2013; Aragon-Correa & Sharma, 2003; Bansal, 2005; Berchicci & King, 2007; Sharma, 2000) that suggests that although there is a general association between PES and superior performance, researchers and practitioners should be skeptical of any “rule of riches” that posits that every firm can benefit from additional investments in PES (e.g., Berchicci & King, 2007). We argue that a contextualized analysis of environmental proactivity and its effects on performance (i.e., when does it pay to be green?) is closer to reality. Our results seem to corroborate this argument. Whereas PES are significantly associated with subsequent superior performance in the correlation matrix, this relationship is significantly moderated by perceived munificence.
Our examination of the direct effects and moderating role of perceived munificence on generating strategic capabilities and organizational outcomes supplements recent studies that aim to provide insights into the specific means through which munificence affects organizations (Baum & Wally, 2003; Rosenbusch et al., 2013). Our study contributes to this literature by examining the moderating effect of one of the dimensions of the general business environment—munificence—on adopting PES and obtaining superior economic rents. Our findings confirm that strategic capabilities should match the general business environment to provide superior economic performance. Specifically, because we focus on PES, our research extends the literature on the O&NE interface and also supplements recent efforts to provide empirical evidence for the theoretical context-contingent resource-based view framework developed by (Aragon-Correa & Sharma, 2003; e.g., Aragon-Correa et al., 2013; Rueda-Manzanares et al., 2008; Sharma et al., 2007). We expand these studies by focusing on the interaction between perceived munificence and innovation capabilities to predict PES adoption. Such an examination is relevant and “essentially unexplored” (Aragon-Correa et al., 2013, p. 142).
Practical Implications
This article may help managers understand how the general business environment in which a company operates influences the strategic value of PES. Although additional studies may be required, our study shows that managers’ assessments of the costs and benefits associated with marginal investments in PES (e.g., McWilliams & Siegel, 2001; McWilliams et al., 2006; Shepherd et al., 2013) may be affected by their perceptions about the munificence of the environment (Shepherd et al., 2013). Our results suggest that when managers perceive hostility, they tend to adopt less proactive approaches to environmental issues and to cut investments in PES. Ironically, our results suggest that those firms that invest in environmental proactivity in hostile conditions outperform environmental laggards. This finding does not necessarily imply that managers act irrationally. Instead, in hostile environments, investment in environmental proactivity might be comparatively more expensive than in munificent environments, which yields a different cost–benefit analysis for PES investments. Managers may simply be obliged to prioritize activities that guarantee firm survival.
In addition, our results show that not only innovation capabilities but also perceived munificence ease the adoption of proactive approaches to sustainability and contribute to earning profits.
Limitations and Future Research Avenues
Our study has several limitations that should be acknowledged when interpreting its results; however, these limitations also offer opportunities for future research. Although this study employs objective data and a lead dependent variable (superior financial performance) in the analysis of the moderating role of perceived munificence in the PES–performance link, reverse causality cannot be conclusively ruled out because findings of the interaction effects of perceived munificence on the innovation–PES relationship are based on cross-sectional data. Given the dynamic nature of some of our variables, additional testing of causality is required, and future research should generate additional empirical evidence of the relationships proposed in this study based on longitudinal/panel data analyses.
Our findings are derived from the food industry in three Spanish geographical clusters. Future research should focus on other geographical clusters and industries to enhance the generalizability of our findings. However, the variety of clusters, business models, and sectors included in the sample provides some basis for generalization.
In addition to the opportunities for future studies resulting from these limitations, other related research directions might also be promising. First, we have examined the contingent effect of perceived munificence on the relationship between innovation capabilities and PES; future studies might address the role of other relevant capabilities—including organizational learning, cross-functional integration or shared vision—in developing PES and the role of munificence in these relationships. Second, studying the interplay between munificence and the other environmental dimensions, such as uncertainty and complexity, in strategic capability and competitive advantage might improve our knowledge regarding how the general business environment shapes organizational behaviors and outcomes. For example, companies operating in a munificent environment might obtain sustained competitive advantages when there are high levels of complexity because managers might find it difficult to identify the key factors that are strategically important for success. Sophisticated organizational capabilities are most suitable for complex situations because they confuse competitors and are more difficult to create, implement, and administer (Aragon-Correa & Sharma, 2003). In addition, complexity might also affect the willingness of managers to implement PES even when operating in a perceived munificent environment. Third, our data were collected before the economic crisis affected Spain. It would be interesting to compare our results with other studies carried out during more recent years to determine whether the theoretical relationships suggested in this study remain significant in the postcrisis general business environment. Finally, it would be interesting to complement the traditional variables that characterize the perceived business environment (i.e., munificence, complexity, and uncertainty) with a study of contextual variables that characterize the natural environment, such as firm motivations (e.g., Bansal & Roth, 2000; Martinez-del-Rio & Cespedes-Lorente, 2014) and the perceived dependence of the firm on biodiversity and ecosystem services (Starik & Kanashiro, 2013; Winn & Pogutz, 2013).
Conclusion
This study emphasizes the importance of perceived munificence in generating PES and in reaping the economic benefits of such a strategy. The development of a fine-grained understanding of the contextual factors driving the process of value creation through PES should be informative and help avoid extreme assumptions about the benefits of environmental management that might affect the terms of the debate between academics and practitioners. This understanding might also contribute to narrowing the research–practice gap in the field. We hope our results provide a basis for developing further knowledge about assessing when it pays (and does not pay) to implement environmental proactivity and, consequently, to take a step in this direction.
Footnotes
Appendix
Divergent Validity.
| Constrained model |
Unconstrained model |
|||||||||
|---|---|---|---|---|---|---|---|---|---|---|
| Models | χ2 (df) | p Value | SBχ2 (df) | p Value | χ2 (df) | p Value | SBχ2 (df) | p Value | Difference | p Value |
| PES and innovation capabilities | 287.43 (77) | .00 | 245.48 (77) | .00 | 176.66 (76) | .00 | 149.44 (76) | .00 | 65.18 | .00 |
| PES and superior financial performance | 218.25 (65) | .00 | 9.77 (65) | .00 | 141.07 (64) | .00 | 6.37 (64) | .00 | 152.28 | .00 |
| PES and environmental munificence | 317.43 (90) | .00 | 273.42 (90) | .00 | 213.34 (89) | .00 | 183.47 (89) | .00 | 183.45 | .00 |
| PES and uncertainty | 237.49 (65) | .00 | 194.54 (65) | .00 | 145.31 (64) | .00 | 119.84 (64) | .00 | 119.84 | .00 |
| PES and complexity | 210.19 (54) | .00 | 171.39 (54) | .00 | 121.14 (53) | .00 | 95.64 (53) | .00 | 34.60 | .00 |
| Environmental munificence and innovation capabilities | 160.72 (27) | .00 | 139.13 (27) | .00 | 109.63 (26) | .00 | 94.34 (26) | .00 | 44.86 | .00 |
| Environmental munificence and Superior financial performance | 139.47 (20) | .00 | 122.18 (20) | .00 | 83.76 (19) | .00 | 73.65 (19) | .00 | 59.59 | .00 |
| Environmental munificence and uncertainty | 151.00 (20) | .00 | 125.99 (20) | .00 | 82.65 (19) | .00 | 68.52 (19) | .00 | 61.43 | .00 |
| Environmental munificence and complexity | 181.23 (14) | .00 | 156.67 (14) | .00 | 87.48 (13) | .00 | 67.20 (13) | .00 | 42.26 | .00 |
| Innovation capabilities and Superior financial performance | 101.49 (14) | .00 | 0.84 (14) | .00 | 34.20 (13) | .00 | 0.30 (13) | .00 | 205.61 | .00 |
| Innovation capabilities and uncertainty | 97.73 (14) | .00 | 92.09 (14) | .00 | 24.27 (13) | .00 | 22.06 (13) | .00 | 50.88 | .00 |
| Innovation capabilities and complexity | 96.88 (9) | .00 | 93.62 (9) | .00 | 19.32 (8) | .00 | 18.70 (8) | .00 | 78.34 | .00 |
| Superior financial performance and uncertainty | 60.95 (9) | .00 | 62.95 (9) | .00 | 10.58 (8) | .00 | 13.71 (8) | .00 | 45.93 | .00 |
| Superior financial performance and complexity | 71.17 (5) | .00 | 83.26 (5) | .00 | 4.87 (4) | .00 | 4.15 (4) | .00 | 32.39 | .00 |
| Uncertainty and complexity | 25.87 (5) | .00 | 16.75 (5) | .00 | 10.57 (4) | .00 | 6.00 (4) | .00 | 11.14 | .00 |

Note. PES = proactive environmental strategies; SB = Satorra–Bentler scaled chi-square. Results are derived from the method of nested model comparisons—sequential chi-square difference tests—suggested by Anderson and Gerbing (1988) and calculated from the scaled chi-square of Satorra and Bentler (2001).This method consists of comparing a model with two scales (unconstrained model) with a nested model in which the correlation between the factors is constrained to unity. A significantly lower chi-square (p value <.05) shows that the variables are not correlated and confirms divergent validity, that is, each scale represents a single fundamental construct.
Acknowledgements
The authors would like to thank Mark Starik and two anonymous reviewers for his insightful and constructive comments during the review process.
Funding
The authors disclosed receipt of the following financial support for the research, authorship, and/or publication of this article: The authors benefited from discussion of this work at the AoM meeting in Philladephia and ACEDE congress in Castellon (Spain), where an earlier version of this work received the “best paper on strategy” award. Finally, the authors gratefully acknowledge financial support from the Spanish Ministry of Economy and Science and the European Regional Development Fund-ERDF/FEDER (National R&D Project ECO2011-24921) and the Ministry of Education (FPU Program).
Declaration of Conflicting Interests
The author(s) declared no potential conflicts of interest with respect to the research, authorship, and/or publication of this article.