
Abstract
Financial markets play a decisive role in the transition to a low-carbon economy. This study investigates the role of climate information presentation for climate-friendly investing among retail investors. We conduct a choice experiment in which we vary the presentation format of climate information by means of three label designs to test their influence on investment practices. We provide empirical evidence for the effectiveness of climate labeling as a potential nudge for climate-friendly investing. Furthermore, we find heterogeneity in the influence of climate information across different label designs and cognitive characteristics of investors. Intuitive (reflective) decision makers tend to place significantly more (less) weight on funds’ climate performance compared with financial performance—irrespective of a participant’s environmental preference.
Keywords
Introduction
There is wide international consensus that limiting global temperature increase to 2 °C above preindustrial levels is crucial to mitigate the most adverse effects of anthropogenic climate change (UNFCCC, 2015). As meeting the 2 °C threshold requires significant investment, a decisive role devolves on financial markets to finance the low-carbon transition (Campiglio, 2016; Covington, 2017; UNEP FI, 2009). In the financial sector, climate change is addressed through a broad range of sustainable investing (SI) practices, which combine financial objectives with nonfinancial concerns. While SI has gained importance in the market and academia alike, market growth is predominantly driven by institutional investors (Paetzold & Busch, 2014). In the European market, for example, only 3% of total SI assets under management are held by retail investors (Eurosif, 2014). Against the backdrop of this untapped potential, mobilizing retail investors for climate-friendly investment products represents a promising leverage point to channel more financial capital toward the global combat against climate change.
Individual choices often depend on how they are presented (Thaler & Sunstein, 2008). Building on Thaler and Sunstein’s (2003, 2008) seminal work on the concept of nudge, 1 Pilaj (2015) recently argued that modifying investors’ choice environment has great potential as a means by which to dismantle existing impediments to the adoption of SI practices. In the recent past, the concept of nudge has been increasingly discussed as an attractive policy tool (van Bavel, Herrmann, Esposito, & Proestakis, 2013; World Bank, 2015), and considerable evidence indicates that the implementation of nudges can advance more sustainable behavior (e.g., Allcott & Mullainathan, 2010; Costa & Kahn, 2013; Momsen & Stoerk, 2014). To the best of our knowledge, the promise of nudges has not been studied empirically in the realm of climate-friendly investing. However, such research is needed, as the available empirical evidence about the effectiveness of nudges is highly context dependent and of limited generalizability (Bao & Ho, 2015; Lehner, Mont, & Heiskanen, 2015).
This article therefore aims to shed light on how the presentation format of climate information influences investment decisions in the retail segment. We conduct an online choice experiment among European retail investors in which we systematically alter investors’ choice environment. Applying conjoint methodology, we examine the equity fund choices of 953 retail investors from six European countries who are provided with standard financial and climate performance information on investment alternatives. Specifically, we vary the presentation format of climate performance information to test the effectiveness of three distinct label designs to influence investment decisions. We further analyze the role of investors’ cognitive characteristics in the effectiveness of climate labeling.
We find that different climate label designs lead to variation in participants’ investment decisions, indicating that these designs differ in their effectiveness to nudge investors toward more climate-friendly investments. Among the three label designs, we find that the star rating label yields the highest emphasis on climate performance information in investors’ decision making. We further find that climate labeling is more (less) effective in promoting climate-friendly investing among intuitive (reflective) decision makers. An underlying mechanism of this finding seems to be the individual trading off between the fund’s climate performance and financial performance. Intuitive decision makers tend to place significantly more weight on funds’ climate performance compared with financial performance in our choice setting—irrespective of a participant’s environmental preference.
This article contributes to the literature by subjecting the potential of climate-friendly nudges in the retail investment sector to a rigorous empirical test. First, we provide empirical evidence for the effectiveness of climate labeling as a potential nudge for climate-friendly investing. We thus identify a promising leverage point to promote climate-friendly investments in the retail segment and to redirect capital toward the transition to a low-carbon economy. Second, by revealing the importance of investors’ cognitive reflection abilities in the adaptation of SI practices, we establish the basis for novel segmentation analyses and future research. Furthermore, our results provide important practical insights by identifying an effective climate label design that is feasible for both mandatory and voluntary labeling.
Background and Hypothesis
One of the central concepts in many economic theories is the homo economicus, in which humans are modeled as rational and self-interested utility maximizers with perfect information processing capacities (Frank, 1987; Persky, 1995). Based on the homo economicus model, it is purely the prospect of superior risk-return relationships that inhibits investors from preferring SI to conventional investing (Beal, Goyen, & Phillips, 2005). Yet alternative explanations emerge if the homo economicus assumptions are relaxed. Behavioral economists, for instance, have long argued that embracing humans’ bounded rationality is critically important to understanding and explaining deviations between rational choice models and actual human behavior (Simon, 1955; Tversky & Kahneman, 1974).
A common cognitive model used to explain human behavior is the dual-process theory (e.g., Kahneman, 2003). According to dual process models, human decision making is based on two distinct modes of cognitive functioning, which are related to intuition (System 1) and reasoning (System 2) (Stanovich, 1999; Stanovich & West, 2000). System 1 is involved in fast, automatic, associative, emotional, and effortless actions, whereas System 2 operates slowly, neutrally, in a controlled and rule-governed way, and with effort (e.g., Epstein, 1994; Kahneman & Frederick, 2002). According to Kahneman and Frederick (2002, 2005), the two systems describe a continuum rather than discrete processes. Opportunities to promote behavior change via nudges are particularly likely to emerge when System 1 affects human decision making (Lehner et al., 2015).
Humans’ partial reliance on System 1 implies that the mere provision of information may suffice when it is intuitively appealing and salient. Against this backdrop, carefully designed labels are widely considered promising nudges (Lehner et al., 2015; Ölander & Thøgersen, 2014). Labels usually provide simplified and attention-grabbing information at the point of purchase and thereby alter people’s choice environment, which may in turn affect their behavior (Ölander & Thøgersen, 2014).
The promise of labeling may also hold true in the specific context of SI, as insufficient or overly complex information and inadequate information processing and transfer have been identified as major barriers to more engagement in SI (e.g., Benson & Humphrey, 2008; Hummels & Timmer, 2004; Rhodes, 2010; Schrader, 2006). In the investment context, however, labeling research is still fragmented and usually limited to standard financial information (e.g., Drescher, Roosen, & Marette, 2014; Hüsser, 2015). Rare exceptions exist in the form of studies on the impact of ethical or sustainability labels on investment decisions, but these do not address the issue of label design effects (e.g., Døskeland & Pedersen, 2016; Gutsche, Dai, & Zwergel, 2015). Nevertheless, ample evidence indicates that retail investors’ decision making is not only influenced by the content of available information, such as risk-return relationships but also by the way in which information is presented (e.g., Foster, Ng, & Wee, 2015; Kozup, Howlett, & Pagano, 2008; Maines & McDaniel, 2000). Furthermore, with respect to the effectiveness of labeling, design aspects such as label complexity, salience, and color have long been identified as key influencing factors in prior research (e.g., Banerjee & Solomon, 2003; Hieke & Taylor, 2012; Sacks, Rayner, & Swinburn, 2009; Teisl, 2003). Thus, the first part of the article explores whether the level of relative importance of climate performance information in the investment decision is associated with the design of the climate label used.
Moving beyond the general impact of climate label design, we explore whether the relative importance of the presented climate performance information is heterogeneous among retail investors. As pointed out by Lehner et al. (2015), most existing policy tools rest on the assumption that a prevalent lack of information must be overcome to allow for changes in behavior. The great majority of policy tools thus invoke System 2 (reflective) and not System 1 (intuitive). In contrast, labeling changes the choice environment of individuals by providing additional information; however, it does so in a simplified and condensed manner to minimize the cognitive effort of information acquisition and processing. In opposition to purely textual information, for instance, graphically salient and intuitively appealing labels thus tend to resonate with decision making dominated by System 1 (Lehner et al., 2015; Ölander & Thøgersen, 2014; Thaler & Sunstein, 2008). It is expected that the effectiveness of labeling can be influenced by participants’ cognitive dual processes; that is, labeling may be more effective in an intuitive cognitive mode. Considering heterogeneity in cognitive reflection ability across retail investors, our hypothesis is therefore as follows: The effectiveness of a climate label is higher for intuitive (System 1) decision makers than for reflective (System 2) decision makers.
Methodology
We conduct an online choice experiment, applying conjoint methodology to test our hypothesis. Introduced into marketing by Green and Rao (1971), conjoint analyses are increasingly used in the social sciences to examine how people make multidimensional choices and elicit their underlying preferences for specific attributes of objects, such as products and services (Green, Krieger, & Wind, 2000; Lohrke, Holloway, & Woolley, 2010). Participants’ stated preferences are derived from an observed series of their choices between, or ratings of, hypothetically described objects. Attributes that are considered important determinants of the specific decision under examination thereby vary with regard to their levels. This allows estimating part-worth utilities and weighing the relative importance of attributes for the specific choice or rating reflecting participants’ individual preferences.
Using the conjoint methodology has certain advantages. First, the conjoint approach offers a direct assessment of participants’ underlying preferences and judgments, increasing internal validity compared with post hoc methods, which collect data on self-reported preferences and decisions through surveys (Arnold & Feldman, 1981; Schwarz, 1999). This is especially important with regard to a potentially high social desirability bias when participants receive climate performance information. Second, conjoint analyses generate results that are more robust when participants lack sufficient insight into their own decision processes to report them accurately (Bertrand & Mullainathan, 2001), which can be the case for investment decisions in capital markets. By testing several attribute-level combinations, we are able to observe participants’ willingness to invest in a climate-friendly manner. We collect data on how they deal with trade-offs in reaching their decision, such as trading off the financial performance of an equity fund against its climate performance.
Experimental Design and Variables
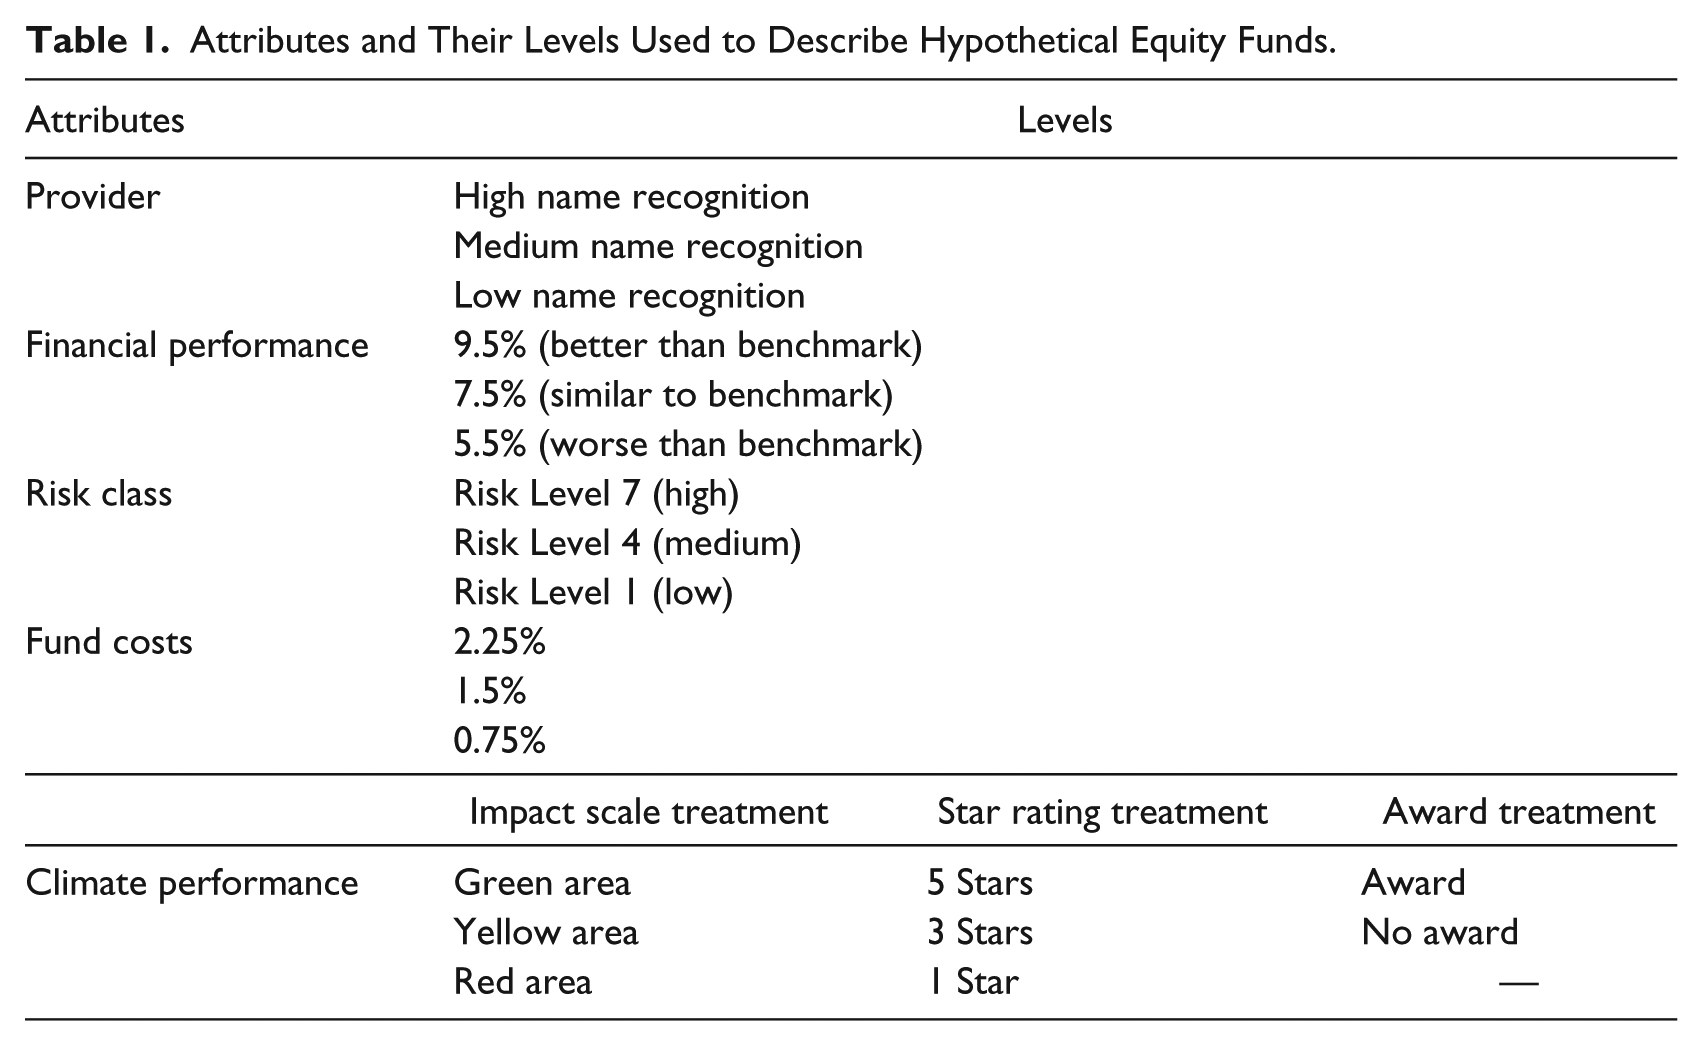
We use a factorial experimental design to examine participants’ hypothetical investment choices. Correspondingly, we vary five characteristics of equity funds within subjects: the fund provider, financial performance, risk class, fund costs, and climate performance. The attributes that constitute the conjoint task and the levels of each are shown in Table 1. Both the fund attributes and the corresponding levels were developed in cooperation with fund market experts. 2 The ordering of presented equity fund attributes is fixed. The first four conventional fund attributes follow the common order used in information documents, such as Key Investor Information Documents (KIID), and climate performance is added as a further attribute. Climate performance represents the contribution of the fund’s investment strategy to global climate change mitigation (see Appendix A for detailed information). The choice scenarios presented to participants apply a randomized choice-based conjoint setting. Each choice task includes three randomly drawn equity fund options and a “none” option.
Attributes and Their Levels Used to Describe Hypothetical Equity Funds.
To manipulate our key variable of interest, we vary the way in which the climate performance information is presented between subjects. We test three different climate label designs: a climate award, a star rating, and an impact scale. These three designs were identified in the wider literature on label designs as well as by considering popular designs used in practice, such as the Morningstar rating, eco-labels for consumer goods, and awards of different kinds (e.g., “eco-awards”; e.g., Døskeland & Pedersen, 2016; Drescher et al., 2014; Heinzle & Wüstenhagen, 2012). Figure 1 displays the three different label designs. The impact scale design displays funds’ climate performance information negatively (red), neutrally (yellow), or positively (green) and covers all investment funds. 3 The star rating design, in contrast, only provides neutral or positive information, covering all investment funds with average or better-than-average climate performance. 4 The award design presents positive climate performance information (awarded) and covers only a portion of all investment funds. 5 Participants are randomly assigned to one of the three label design treatment conditions.
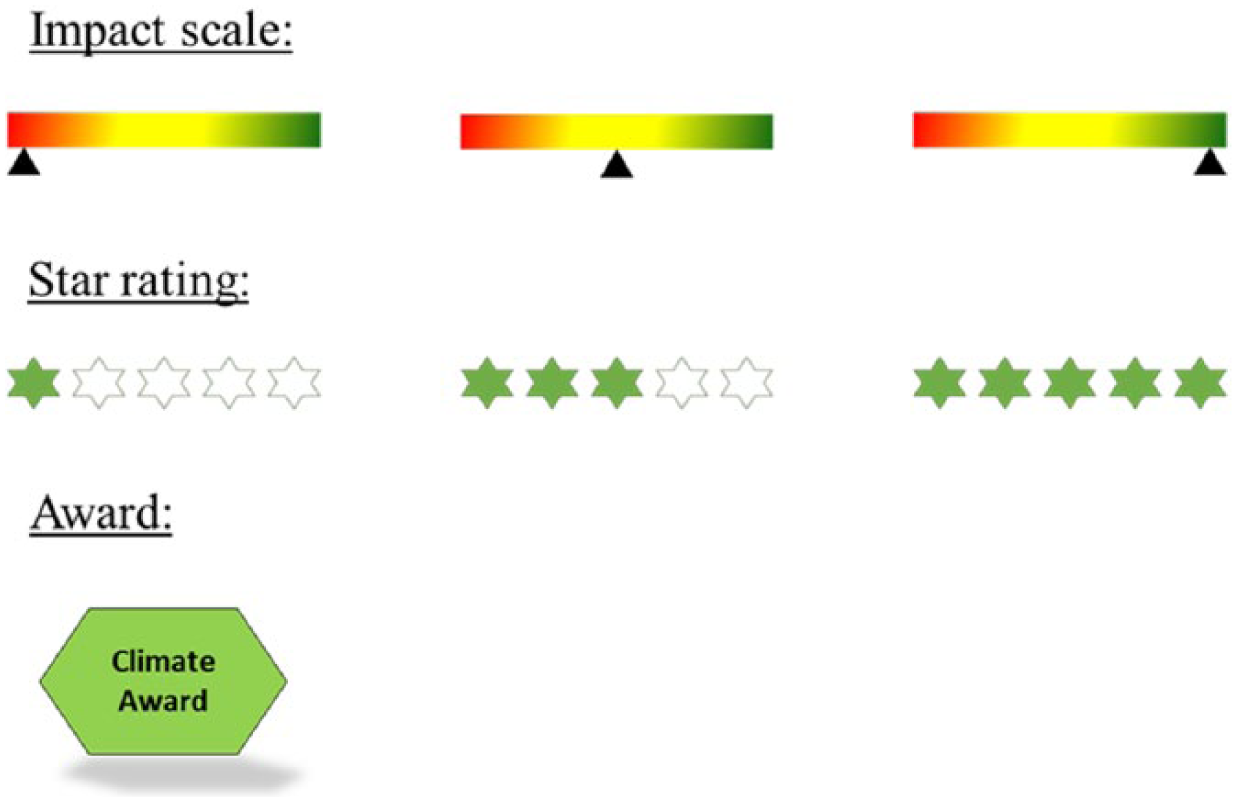
Label designs.
We also collect data on participants’ cognitive reflection abilities (Frederick, 2005) and common confounding variables in the investment context, such as risk preferences (Dohmen et al., 2011), financial literacy (van Rooij, Lusardi, & Alessie, 2011), prior proenvironmental investment behavior, and sociodemographic characteristics. Appendix B displays the composition of subsamples by country and treatment condition. Participants are roughly evenly distributed over the different countries and treatments.
Sample
We base our study on a sample of 953 retail investors from six European countries with large conventional funds and sustainable investment markets: Germany, France, the United Kingdom, Italy, Sweden, and Switzerland. A professional panel provider, Lightspeed GMI Germany, administered recruitment and access to the participants. The sample consists of participants who, at the time of the experiment, owned company shares directly or indirectly through a mutual fund, pension plan, or other retirement fund in the respective countries. The sample composition is based on regional and demographic characteristics of the respective population. 6 Table 2 presents the descriptive statistics of the full sample. Approximately 39% of the participants are female. The average age is 47 years, with ages ranging from 18 to 85 years. The median cognitive reflection score is 1. Approximately 71% of the participants are in a relationship, and 24% of them indicate that environmental issues have already influenced their investment decisions in the past.
Summary Statistics.

Note. This table contains the summary statistics of the participants. Age is participants’ age, measured in years; Female is a dummy variable that is equal to one if a participant is female; Share ownership is a dummy variable that is equal to one if a participant owns equity shares, including shares held directly or indirectly through a mutual fund, pension plan, or other retirement fund; Living standard is a participant’s self-assessed standard of living, measured on a scale from 1 (highest) to 6 (lowest); In a relationship is a dummy variable that is equal to one if a participant is married or in a relationship; Cognitive reflection score represents a participant’s number of correct answers in the cognitive reflection test, and the score ranges from 0 (no correct answer in the cognitive reflection test) to 3 (correct answers to all three questions in the cognitive reflection test); Environmental preference is a dummy variable that is equal to one if environmental issues have already influenced a participant’s investment decisions in the past.
Experimental Protocol
The survey experiment was conducted online in April 2016. After an introduction to the study, participants completed their conjoint tasks. Participants were presented with a hypothetical situation in which they were invited to consider equity fund profiles as investment opportunities. They were provided with 12 different choice sets, one at a time, each describing three equity funds based on random attribute-level combinations. Participants were then asked which of the three funds, if any, they would most likely choose if they were to consider investing in a fund. The choice task was followed by a questionnaire with the cognitive reflection test and control questions. After finishing the questionnaire, participants were debriefed and remunerated for participating in the study. The experimental session lasted about 15 minutes for each participant. The survey experiment was programmed and conducted with the Sawtooth Software module SSI Web 8. The online sessions were organized and administrated by Lightspeed GMI, Germany. Survey instructions in English are provided in Appendix A.
Results
In this section, we first outline how the presentation format of climate information influences investment decisions. We analyze the role of climate performance information in investors’ fund choices and whether the tested label designs affect investment decisions differently (see section “Relative Importance of Climate Performance Information”). Subsequently, we present results regarding heterogeneity in investors’ behavior, focusing on cognitive reflection abilities as an important determinant (see section “Cognitive Reflection and Heterogeneity in Behavior”).
Relative Importance of Climate Performance Information
Table 3 displays the computed relative importance values of each attribute using the hierarchical Bayes estimation method. Importance values are based on estimated individual-level part-worth utilities. The relative importance values for each attribute are calculated by taking the difference between the highest and lowest part-worth utility estimated for the levels of each attribute and scaling the sum total differences of all attributes to 100%. The relative importance values for each attribute are calculated for participants individually and then averaged across the sample. Thus, each relative importance value indicates the respective attribute’s contribution to the average participant’s choice. The estimation results are provided separately for each label design. The results reveal that common financial market information is of the highest importance for retail investment decisions across the various label design treatments. This includes information representing the weighing of risk and return according to standard finance theories: the funds’ risk class, costs, and financial performance. Taken together, the relative importance of risk class, financial performance, and costs total roughly 73% for the award subsample, 67% for the impact scale subsample, and 63% for the star rating subsample. The fund provider, varied by name recognition, is less important for retail investors’ choices; its relative importance amounts to 16%, 15%, and 14% in the respective subsamples.
Relative Importance of Attributes Across Different Climate Label Designs.
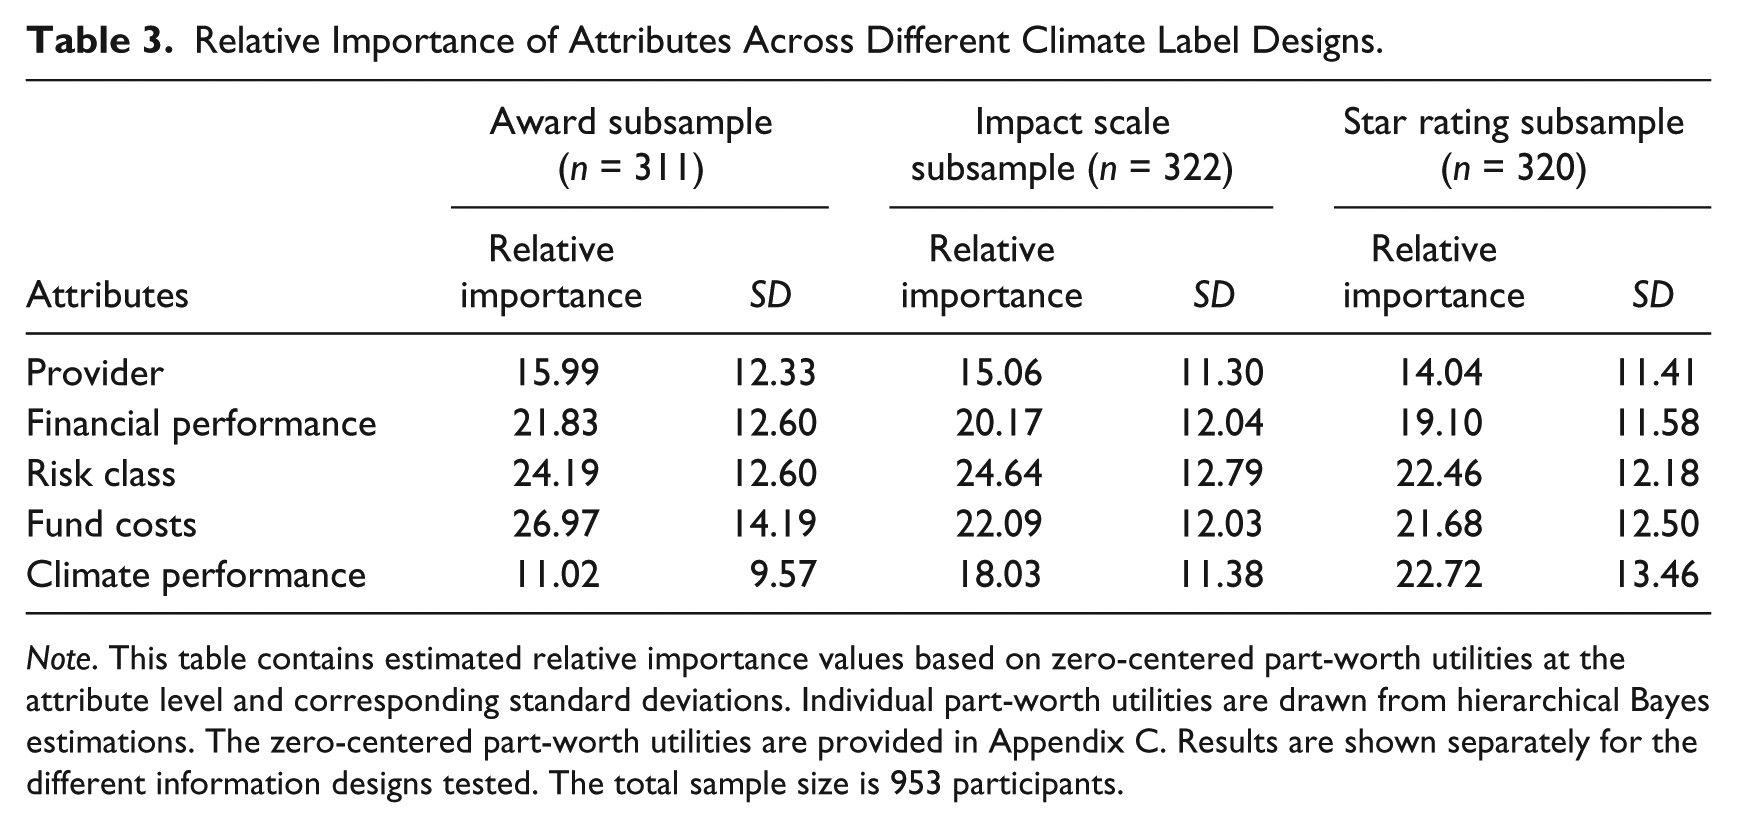
Note. This table contains estimated relative importance values based on zero-centered part-worth utilities at the attribute level and corresponding standard deviations. Individual part-worth utilities are drawn from hierarchical Bayes estimations. The zero-centered part-worth utilities are provided in Appendix C. Results are shown separately for the different information designs tested. The total sample size is 953 participants.
The relative importance of the climate performance attribute differs strongly among the three label design conditions and reaches a remarkably high level in the star rating subsample. The estimation results indicate a relative importance for climate performance of 11% for the average participant presented with a climate award and 18% for the average participant provided with a climate impact scale. When a star rating of the funds’ climate performance is shown to participants, the relative importance increases to 23%. A comparison of the estimation values across the investment attributes indicates that in the star rating label condition, climate performance seems to be of considerably higher importance for individuals’ investment choices than financial performance (19%) and around the same importance as risk class (22%) and fund costs (22%).
Different climate label designs lead to variation in the relative importance of climate performance for participants’ choices and can lead to shifts in the importance rank of the considered fund attributes. Building on the findings by Hainmueller, Hangartner, and Yamamoto (2015), we interpret our results derived from hypothetical choices to be predictors of actual behavior in the retail investment context. Correspondingly, we argue that in practice, different climate label designs would lead to variation in real-world investment decisions and so would differ in their potential to influence climate-friendly investing. In particular, among the three popular label designs tested, a star rating label would yield the highest emphasis on climate performance information in investors’ decision making.
Cognitive Reflection and Heterogeneity in Behavior
In this section, we turn to heterogeneity in the observed effects of the climate label on individual investment decisions. In particular, we investigate whether heterogeneity in cognitive reflection abilities leads to systematic differences in the relative importance of climate performance information across individuals. 7
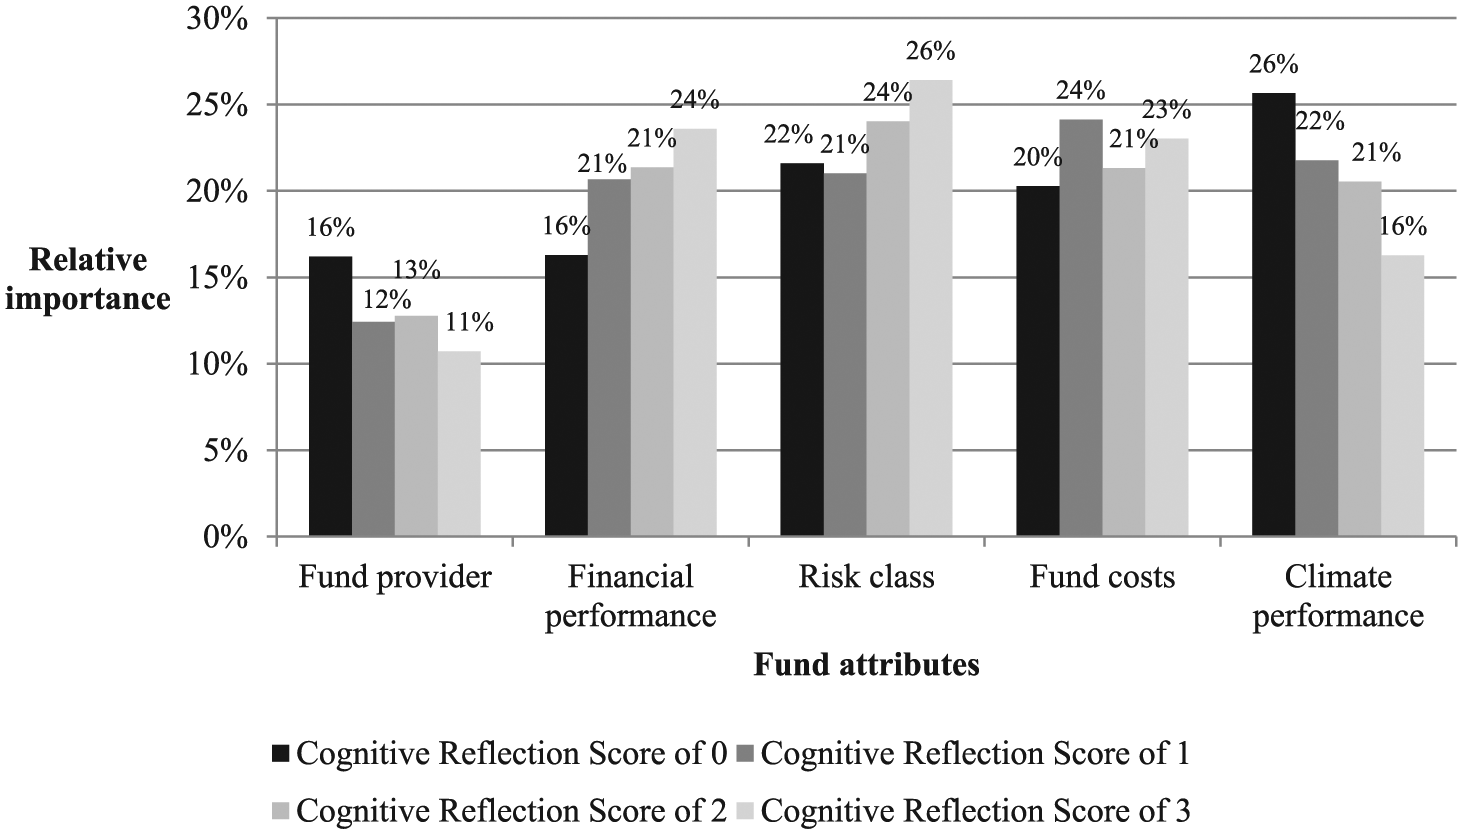
Figure 2 shows the attributes’ relative importance values categorized by individuals’ measured cognitive reflection score when participants are provided with a star rating climate label. The individual cognitive reflection score indicates the participant’s total number of correct answers in the cognitive reflection test (Frederick, 2005). The cognitive reflection test is designed to assess participants’ cognitive dual processes. It evaluates individuals’ ability to suppress an intuitive and wrong System 1 answer in favor of a reflective and correct System 2 answer (see Frederick, 2005 for further details). The standard test includes three questions to assess participants’ cognitive reflection capabilities. Thus, the possible score ranges from 0 (no question answered correctly; i.e., a markedly intuitive System 1 decision maker) to 3 (all questions answered correctly; i.e., a markedly reflective System 2 decision maker).
Relative importance of attributes by investors’ cognitive reflection scores.
Figure 2 reveals substantial heterogeneity in the observed relative importance values across participants with different cognitive reflection abilities. First, the relative importance of financial performance information seems to increase with cognitive reflection abilities; that is, higher cognitive reflection scores are associated with a higher relative importance of financial performance information in individuals’ investment choices. Second, the relative importance of climate performance information seems to be negatively associated with cognitive reflection abilities and decreases with higher cognitive reflection scores.
Table 4 reports in greater detail on the attributes’ relative importance values categorized by individuals’ cognitive reflection scores. On average, participants with a score of 0 ascribe a relative importance of 16% to financial performance in their decision making, whereas financial performance holds a relative importance value of 24% for participants with a score of 3. The importance of climate performance seems to be higher for participants with lower cognitive reflection scores. This is in line with our hypothesis. The climate label tends to be most effective in increasing the importance of climate performance for the average individual with a cognitive reflection score of 0 (26%), followed by participants with scores of 1 (22%) and 2 (21%). Individuals who have a strong ability to suppress intuitive decision making seem to be less affected (lowest relative importance score of 16%).
Relative Importance of Attributes by Investors’ Cognitive Reflection Scores.
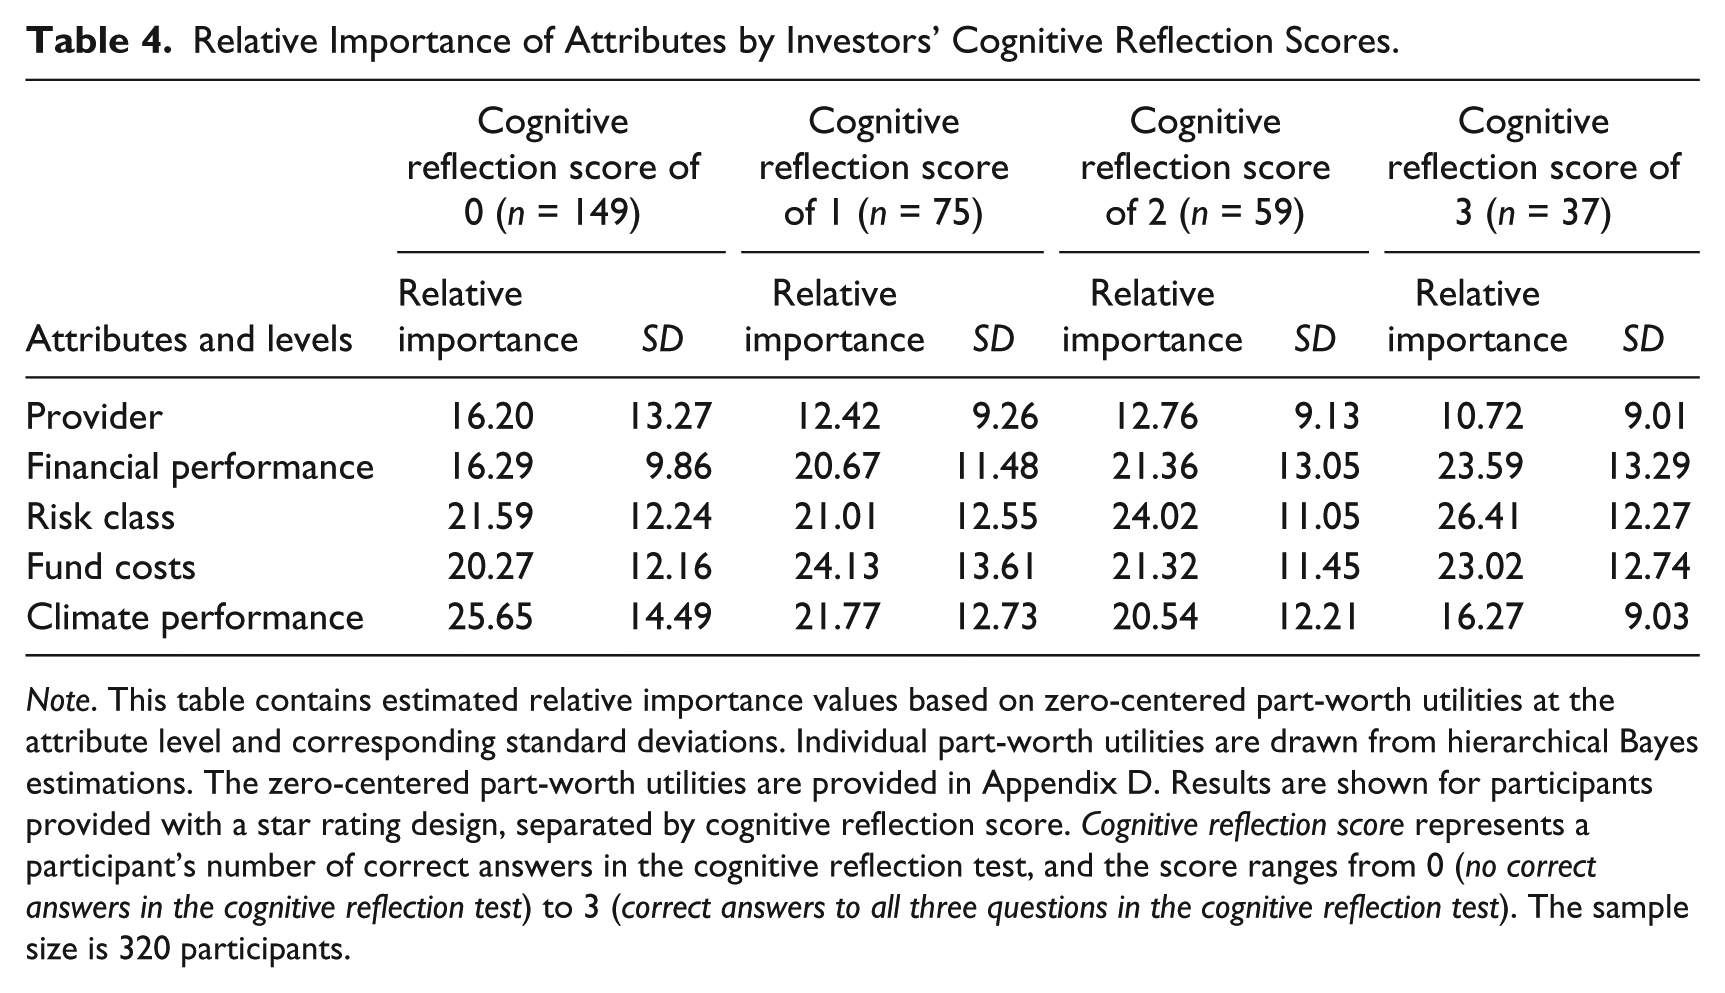
Note. This table contains estimated relative importance values based on zero-centered part-worth utilities at the attribute level and corresponding standard deviations. Individual part-worth utilities are drawn from hierarchical Bayes estimations. The zero-centered part-worth utilities are provided in Appendix D. Results are shown for participants provided with a star rating design, separated by cognitive reflection score. Cognitive reflection score represents a participant’s number of correct answers in the cognitive reflection test, and the score ranges from 0 (no correct answers in the cognitive reflection test) to 3 (correct answers to all three questions in the cognitive reflection test). The sample size is 320 participants.
The SI literature relies on the dual nature of investor motives to argue that investors weigh their desire for financial returns and nonwealth returns (Beal et al., 2005; Renneboog, Ter Horst, & Zhang, 2011; Statman, 2004). The varying relative importance values of financial and climate performance information for different levels of cognitive reflection ability in our data might stem from this mechanism. Thus, we test whether the difference between the relative importance of climate performance and of monetary fund information (financial performance, risk class, costs, and provider) differs significantly across investors’ cognitive reflection scores. Table 5 reports the mean values of the difference between the relative importance of the respective attributes, standard deviations, and Kruskal–Wallis test statistics. The results reveal that investor segments distinguished according to their cognitive reflection scores show significantly different relationships between the relative importance of climate performance and of financial performance, risk class, and fund costs, respectively, at the 1% level. A positive difference in relative importance reflects a dominance of climate performance information, a difference of around zero indicates equal weighting, and a negative difference demonstrates a dominance of the monetary attribute information in investors’ decision making. The findings document heterogeneity in these differences across investors’ cognitive reflection abilities. The estimations reveal positive differences for low cognitive reflection abilities (score of 0) and negative differences for high cognitive reflection abilities (scores of 2 and 3) between the relative importance of climate performance and monetary fund information.
Differences Between the Relative Importance of Attributes by Investors’ Cognitive Reflection Scores.
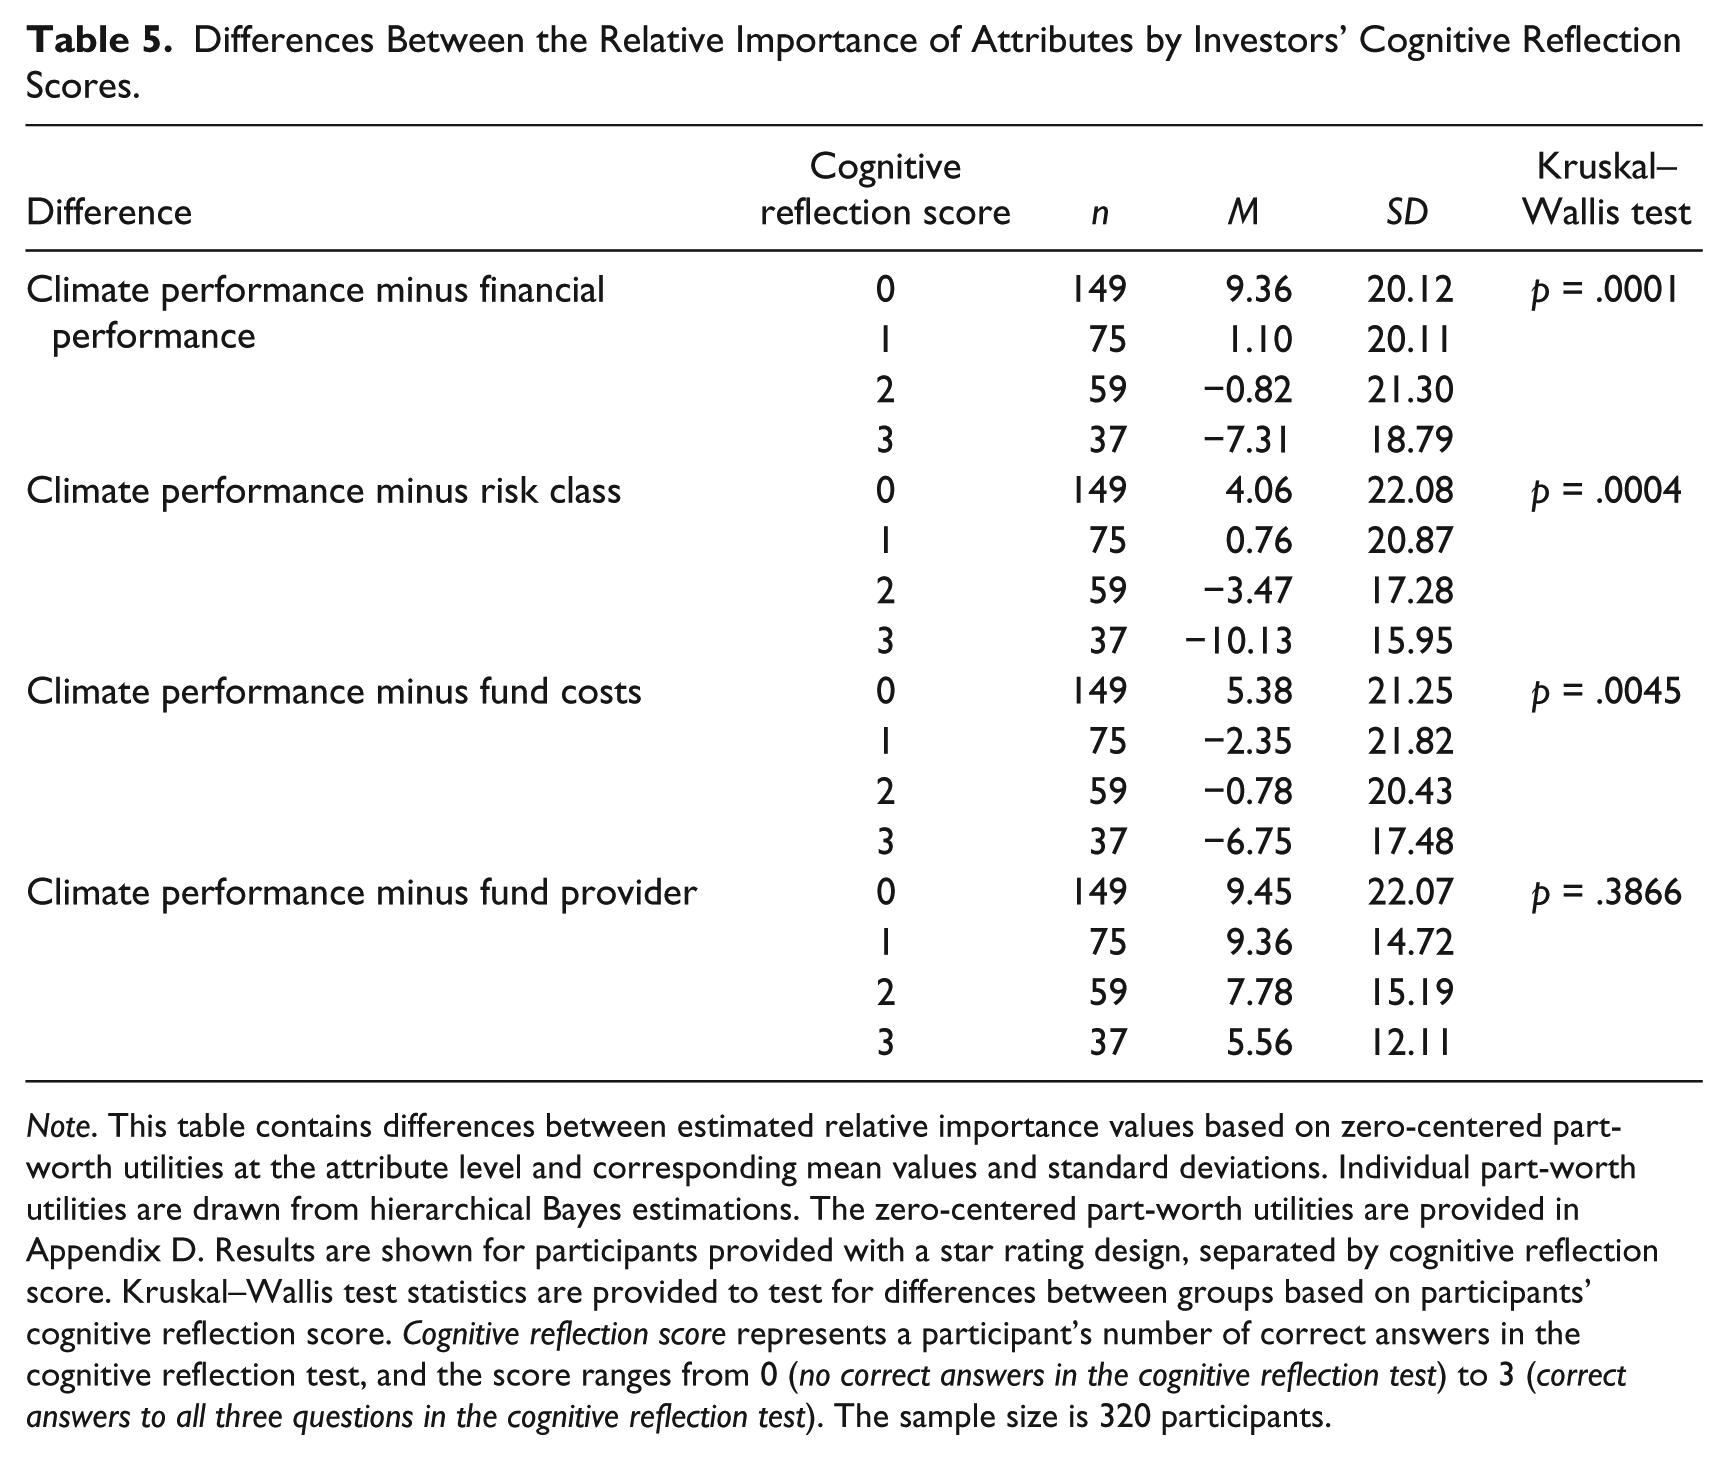
Note. This table contains differences between estimated relative importance values based on zero-centered part-worth utilities at the attribute level and corresponding mean values and standard deviations. Individual part-worth utilities are drawn from hierarchical Bayes estimations. The zero-centered part-worth utilities are provided in Appendix D. Results are shown for participants provided with a star rating design, separated by cognitive reflection score. Kruskal–Wallis test statistics are provided to test for differences between groups based on participants’ cognitive reflection score. Cognitive reflection score represents a participant’s number of correct answers in the cognitive reflection test, and the score ranges from 0 (no correct answers in the cognitive reflection test) to 3 (correct answers to all three questions in the cognitive reflection test). The sample size is 320 participants.
The strongest heterogeneity across investors’ cognitive reflection scores seems to exist in the individual trading off between the fund’s climate performance and financial performance, which represents the largest difference in relative importance (from 9.36 to −7.31). Table 6 displays the results of an ordinary least square regression in which the dependent variable is the difference between an investor’s individual relative importance of climate performance and financial performance. The main explanatory variable is an investor’s intuitive choice score, which is a transposed variable of the participant’s cognitive reflection score for a more stringent interpretation of the estimation results. We control for participants’ risk preferences in general matters using a scale from 0 (lowest) to 10 (highest) (Dohmen et al., 2011), financial literacy via quiz-like questions (van Rooij et al., 2011), investment horizon, and self-stated environmental preferences. The coefficient on the intuitive choice variable is positive and significant at the 1% level, indicating that decision makers who are more intuitive show a significantly larger positive difference between the relative importance values (i.e., place significantly more weight on funds’ climate performance compared with financial performance; column 1). We further observe that participants who are more risk-tolerant and financially literate, as well as participants with longer investment horizons, place less weight on funds’ climate performance compared with financial performance. In addition, participants with environmental preferences place significantly more relative weight on climate performance. We also control for participants’ age, gender, living standard, 8 education, relationship status, occupation, and country (column 2). The inclusion of these sociodemographic variables does not change the conclusions drawn from our estimation results.
Difference Between the Relative Importance of Climate and Financial Attributes.
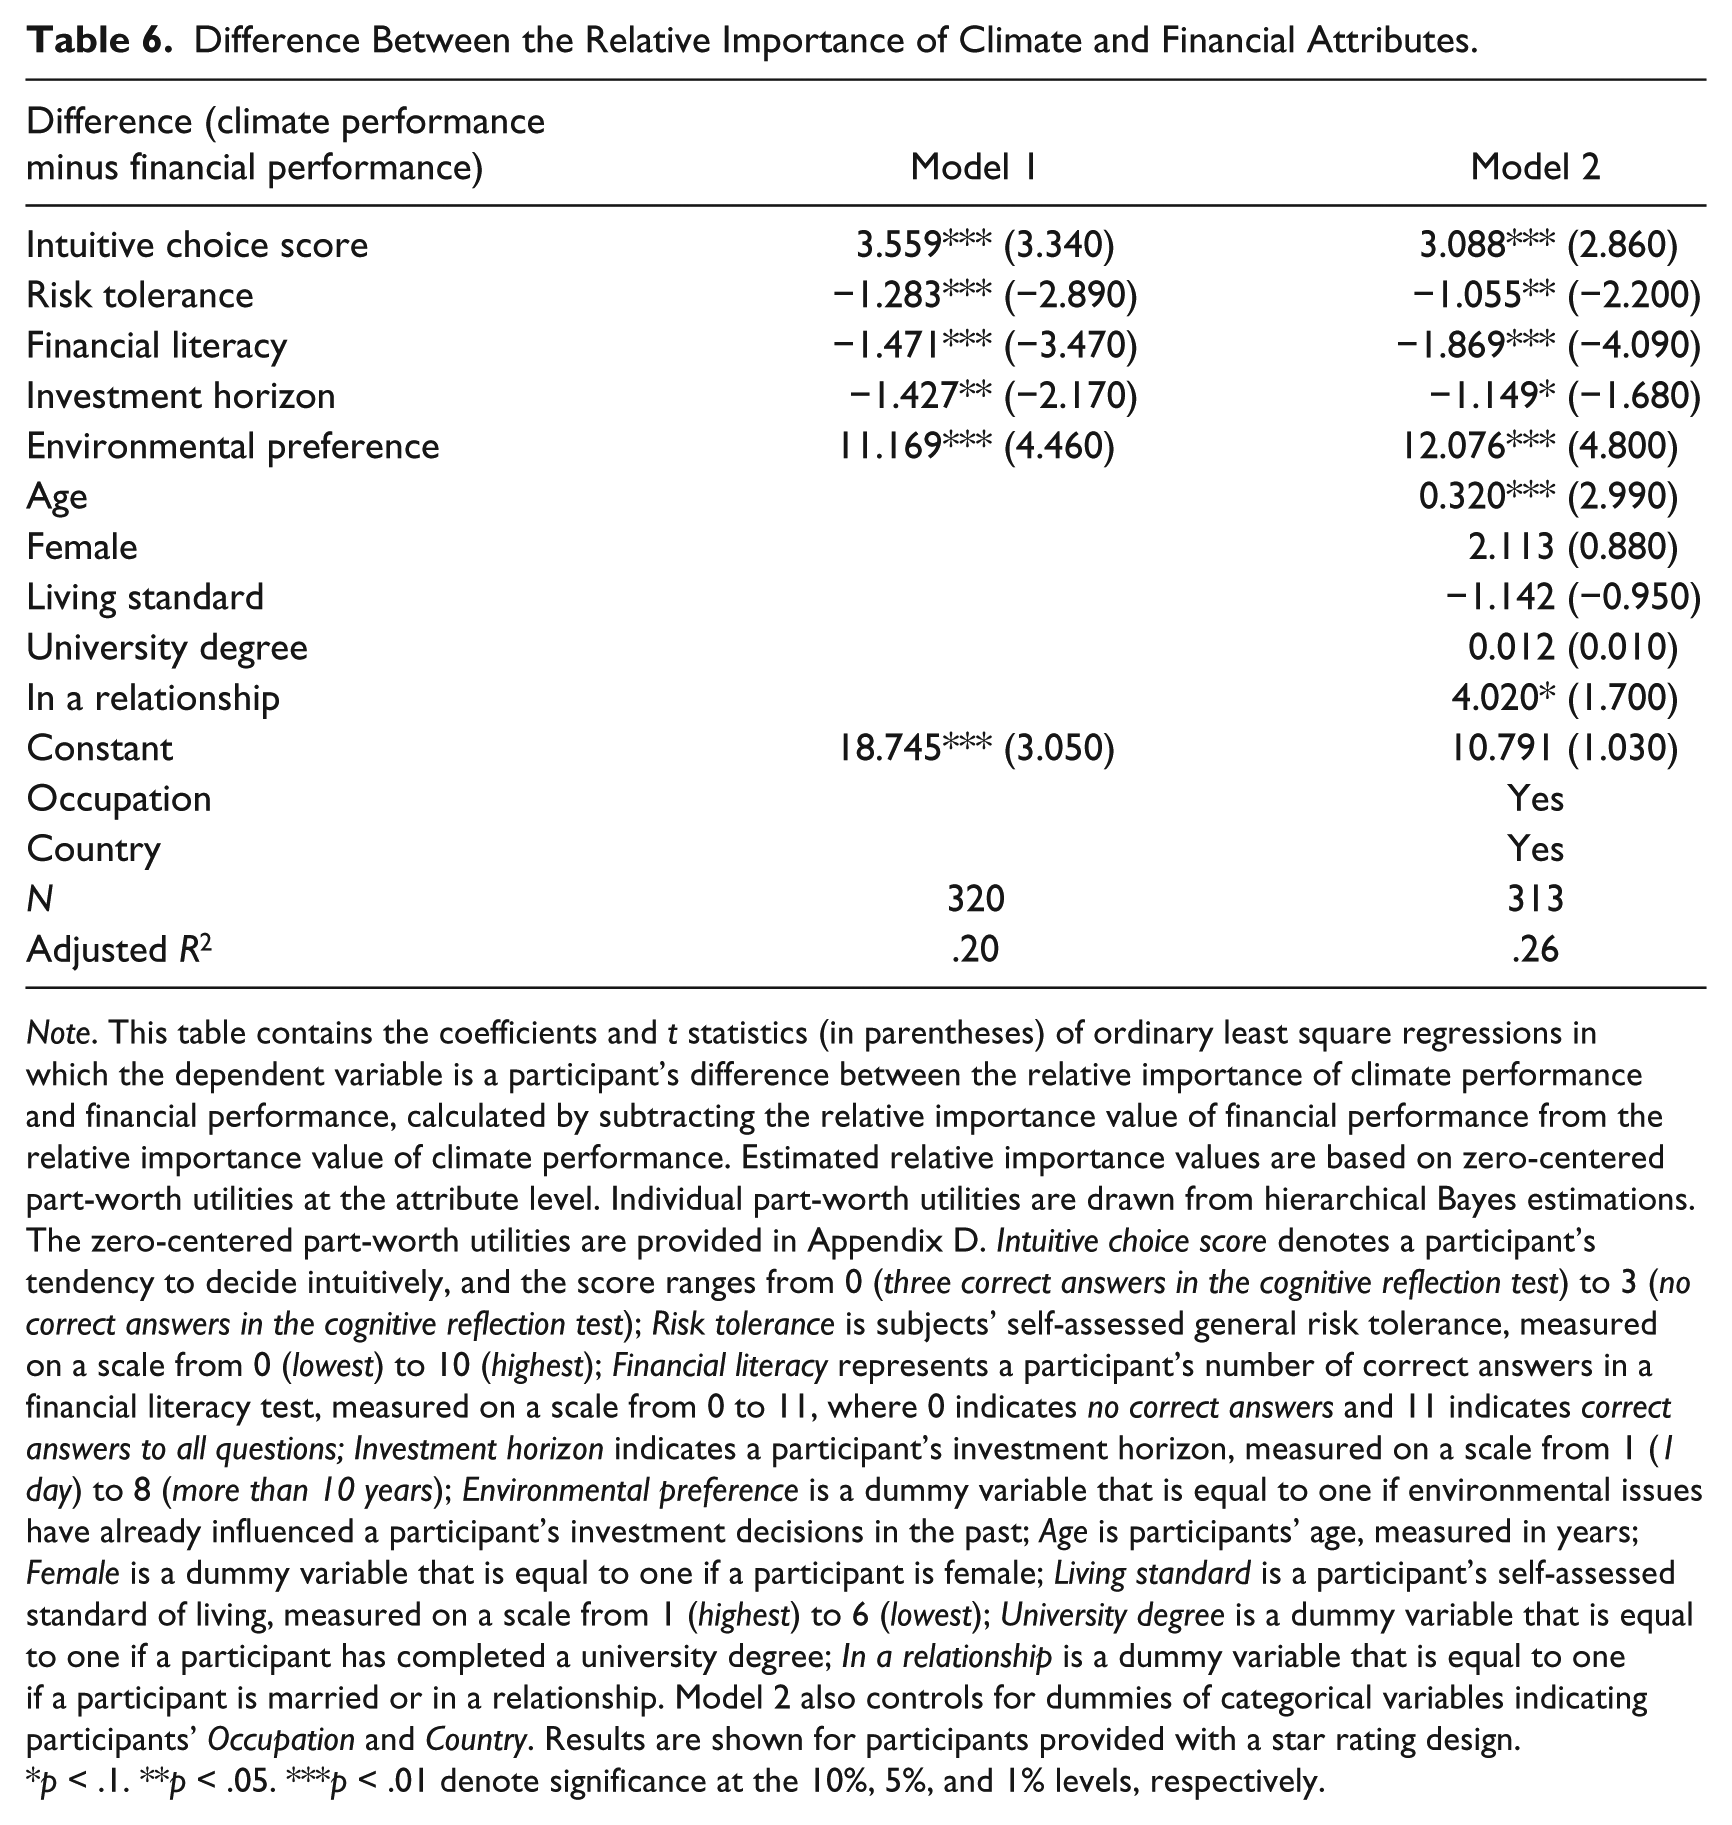
Note. This table contains the coefficients and t statistics (in parentheses) of ordinary least square regressions in which the dependent variable is a participant’s difference between the relative importance of climate performance and financial performance, calculated by subtracting the relative importance value of financial performance from the relative importance value of climate performance. Estimated relative importance values are based on zero-centered part-worth utilities at the attribute level. Individual part-worth utilities are drawn from hierarchical Bayes estimations. The zero-centered part-worth utilities are provided in Appendix D. Intuitive choice score denotes a participant’s tendency to decide intuitively, and the score ranges from 0 (three correct answers in the cognitive reflection test) to 3 (no correct answers in the cognitive reflection test); Risk tolerance is subjects’ self-assessed general risk tolerance, measured on a scale from 0 (lowest) to 10 (highest); Financial literacy represents a participant’s number of correct answers in a financial literacy test, measured on a scale from 0 to 11, where 0 indicates no correct answers and 11 indicates correct answers to all questions; Investment horizon indicates a participant’s investment horizon, measured on a scale from 1 (1 day) to 8 (more than 10 years); Environmental preference is a dummy variable that is equal to one if environmental issues have already influenced a participant’s investment decisions in the past; Age is participants’ age, measured in years; Female is a dummy variable that is equal to one if a participant is female; Living standard is a participant’s self-assessed standard of living, measured on a scale from 1 (highest) to 6 (lowest); University degree is a dummy variable that is equal to one if a participant has completed a university degree; In a relationship is a dummy variable that is equal to one if a participant is married or in a relationship. Model 2 also controls for dummies of categorical variables indicating participants’ Occupation and Country. Results are shown for participants provided with a star rating design.
p < .1. **p < .05. ***p < .01 denote significance at the 10%, 5%, and 1% levels, respectively.
Interestingly, the findings indicate that individuals who do not yet invest in an environmentally friendly manner or have not even considered it nevertheless show higher relative importance of climate performance compared with financial performance if they are intuitive decision makers. This further underlines the important role of cognitive reflection ability in our choice context irrespective of a participant’s environmental preference. In support of this notion, participants’ cognitive reflection abilities and environmental preferences seem to be rather uncorrelated (see Appendix E).
Discussion and Conclusion
This study aimed to shed light on how the presentation format of climate information influences investment decisions in the retail segment. Our findings clearly reveal that labeling can be effective, not only providing great potential from a theoretical perspective but living up to its potential in rigorous empirical testing. Thus, we provide empirical evidence for the effectiveness of climate labeling as a potential nudge for climate-friendly investing.
While we identify climate labeling as a powerful nudge, ethical concerns have been raised against the concept of nudging (e.g., Hausman & Welch, 2010; Schnellenbach, 2012; Sunstein, 2015). One major concern put forth is the question of whether nudges implemented by private and public institutions with the intention of affecting people’s behavior also respect people’s freedom of choice, as postulated by the concept of libertarian paternalism (Sunstein & Thaler, 2003). 9 With respect to our climate label nudges, we argue that they seek to appeal to, and activate, System 1 to affect people’s behavior, but they do not restrict investors’ decision making. In contrast to default settings, which also form a widely used nudging measure, labeling interventions still require people’s active choice (Sunstein & Reisch, 2014). Another potential criticism is that nudges are manipulative if they lack transparency (their motivation is hidden or concealed; Sunstein, 2015). However, labels represent a transparent disclosure of factual information (Lehner et al., 2015; Sunstein, 2015), and climate labels in particular do not conceal the motivation of invoking public concern.
As a second contribution, we reveal the importance of investors’ cognitive reflection abilities in the adaptation of SI practices and thereby establish the basis for novel segmentation analyses and future research. We find that investors’ cognitive characteristics are associated with the effectiveness of climate labeling as a potential nudge. More specifically, our findings indicate that climate labeling is particularly effective among intuitive decision makers and less effective among reflective decision makers. The segmentation of investors has long been of interest in the SI literature, especially in terms of identifying characteristics that distinguish sustainable from conventional investors. Moving beyond criteria commonly used for segmenting investors in the SI literature, such as past behavior, attitudes, or demographic characteristics, we make the case for clustering investors according to their cognitive reflection abilities.
By establishing the foundation for novel segmentation analyses in the SI literature, we provide the starting point for exciting future research on noise trading and bubble formation in financial markets. As argued by Orlitzky (2013), investors might experience difficulties with interpreting public corporate sustainability information accurately, due to two underlying forces. First, the link between reported sustainability information and firms’ economic fundamentals might still be unclear for market participants. Second, company managers have an incentive to report distorted sustainability information and may exaggerate the scope and scale of firms’ actual corporate sustainability. Noise trading and excess market volatility is therefore argued to increase among all listed companies and excess market valuations among companies that are widely considered as being sustainable. However, recent experimental asset market research shows that investors’ cognitive sophistication influences the occurrence of bubbles and crashes. In a study by Bosch-Rosa, Meissner, and Bosch-Domènech (2018), for instance, bubbles and crashes were only observed in experimental markets populated by subjects with low levels of cognitive sophistication. Excess market valuations of socially responsible firms may not only stem from the nature of companies’ sustainability disclosure, as argued by Orlitzky (2013), but also from the cognitive characteristics of sustainable investors.
Our results, like results from experimental studies on human decision making in general, are particularly vulnerable to the research method’s external validity. Yet a recent study by Hainmueller et al. (2015) provides an external validation test of vignette and conjoint analyses by making use of naturalization referendums in Switzerland as a natural experiment. They find that these survey experiments performed well in capturing the structural effects under examination. In particular, the study shows that the paired conjoint analysis with a nonstudent sample, like our study, precisely uncovers the relative importance patterns of the behavioral benchmark in the real world. 10
Given the external validity of conjoint methodology, this study also provides valuable practical insights. Our experiment shows that a star rating seems to work best as a nudge for investment decisions that are more climate-friendly. By identifying differences in effectiveness among the three label designs tested, we provide important insights to policy makers as well as other parties involved in the development and launch of climate labels. For instance, beginning in 2018, a new regulation on KIIDs for packaged retail and insurance-based investment products will take effect in the European Union (2014). The new regulation is aimed at improving the quality of information provided and increasing the comparability of investment products for European retail investors by means of a standardized, simple, and accessible KIID. While the revised KIID does not capture social or environmental goals or outcomes up to the present, the potential inclusion of such aspects is explicitly mentioned in the legislative act. Furthermore, it is emphasized that “the Commission thoroughly considers developments relating to social and environmental investment products” (European Union, 2014, p. 5). Considering the possibility of upcoming regulative change, our analysis indicates that a star rating could be a promising way to communicate sustainability-related performance aspects in the KIID, at least for equity funds. In addition to the potential implications for mandatory labeling, this study may also provide practical support to existing and evolving voluntary labeling initiatives by identifying a feasible and effective label design option. For these initiatives, the impact scale is practically infeasible as funds are unlikely to implement a negative (red) rating by choice. Yet as the star rating clearly outperformed in our study, communicating negative climate performance information does not appear to form a prerequisite for promoting climate-friendly investments.
Finally, our study also points toward important future research avenues. Specifically, we believe that two aspects of the potential effects of nudging require further research. First, our current understanding of the long-term effects of nudging is still fragmented (Croson & Treich, 2014). Regarding this study’s findings, the question arises of whether labeling can nudge retail investors toward climate-friendly investments in the long run or whether this effect fades over time. Second, due to humans’ tendency for moral self-regulation and self-licensing (Merritt, Effron, & Monin, 2010; Sachdeva, Iliev, & Medin, 2009), nudges may backfire by triggering unintended spillover effects. For example, as outlined by Merritt et al. (2010), past good deeds (e.g., proenvironmental behavior) can liberate (license) people to engage in bad deeds (e.g., environmentally harmful behavior) if individuals sense that they have done “enough.” This raises the question of whether climate nudges in the investment context induce counterproductive climate effects in other behavioral domains of retail investors’ lives, such as purchasing a new car with high fuel consumption. We therefore encourage future scholarly inquiry to explore the long-term effects of nudges through longitudinal studies and build on research settings capturing more than one behavioral domain. Furthermore, future research could focus on investors’ underlying processes that occur between information input and the final investment decision. Methodologies for conducting decision-making research, such as conjoint analyses, are well suited to explore which aspects are most influential in determining decisions (Aiman-Smith, Scullen, & Barr, 2002; Oll, Hahn, Reimsbach, & Kotzian, 2016). However, conjoint analyses cannot provide comprehensive insights into the “black box” of underlying processes (Glaholt & Reingold, 2011). Scholars seeking to investigate this issue could, for instance, combine conjoint analyses with eye tracking (e.g., Meißner, Musalem, & Huber, 2016) or employ other process-tracing techniques, such as MouseLab or information display boards.
Footnotes
Appendix A
Appendix B
Subsample Statistics.
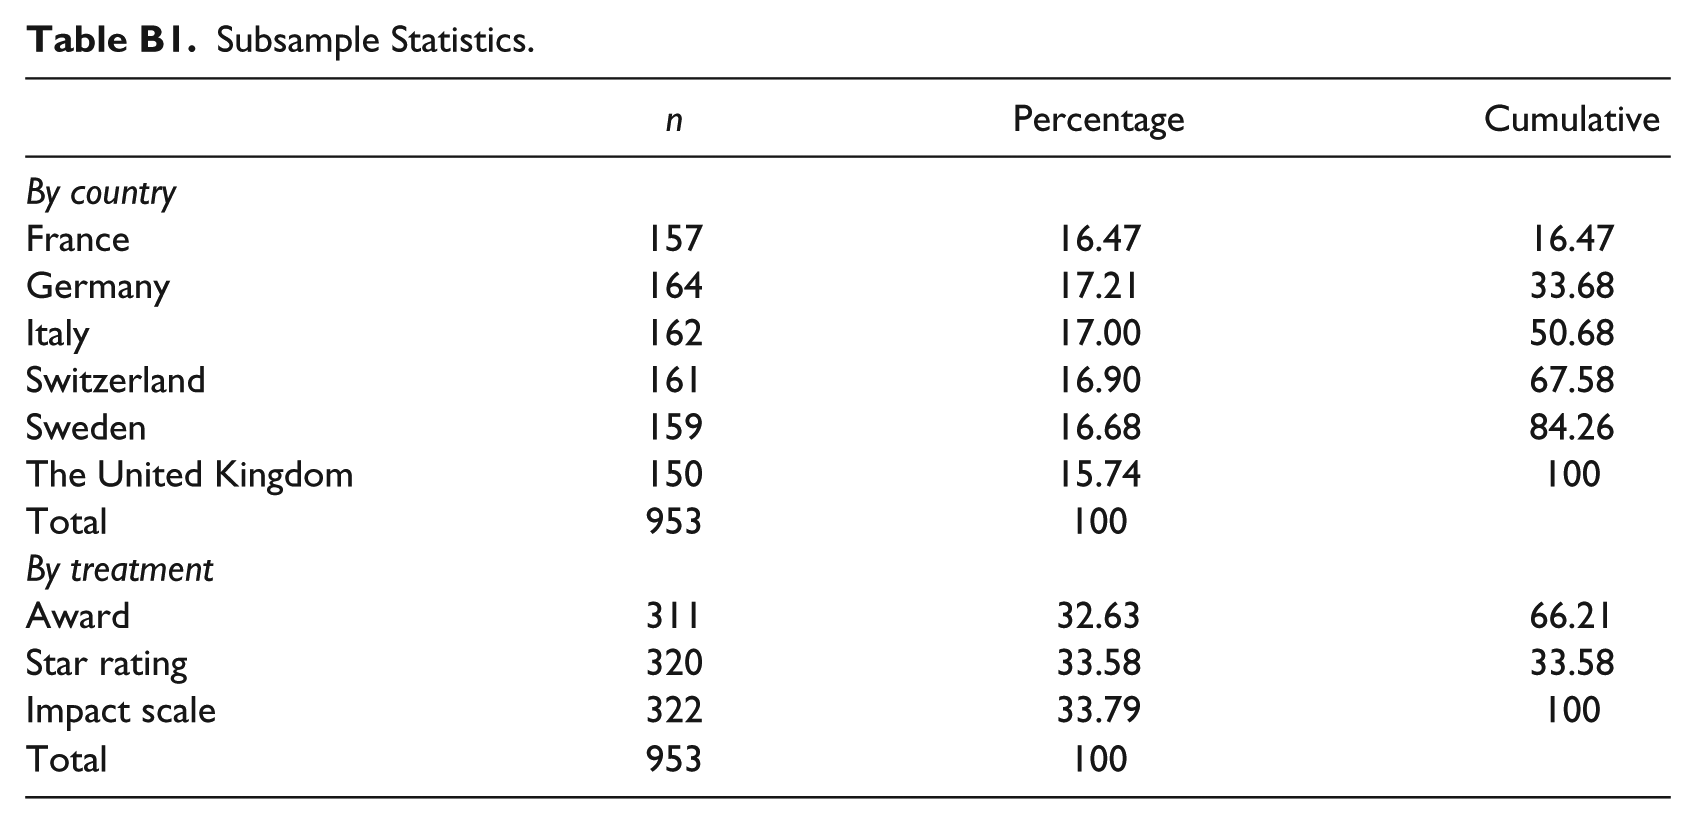
| n | Percentage | Cumulative | |
|---|---|---|---|
| By country | |||
| France | 157 | 16.47 | 16.47 |
| Germany | 164 | 17.21 | 33.68 |
| Italy | 162 | 17.00 | 50.68 |
| Switzerland | 161 | 16.90 | 67.58 |
| Sweden | 159 | 16.68 | 84.26 |
| The United Kingdom | 150 | 15.74 | 100 |
| Total | 953 | 100 | |
| By treatment | |||
| Award | 311 | 32.63 | 66.21 |
| Star rating | 320 | 33.58 | 33.58 |
| Impact scale | 322 | 33.79 | 100 |
| Total | 953 | 100 | |
Appendix C
Relative Importance Values and Average Utilities for the Star Label Design.
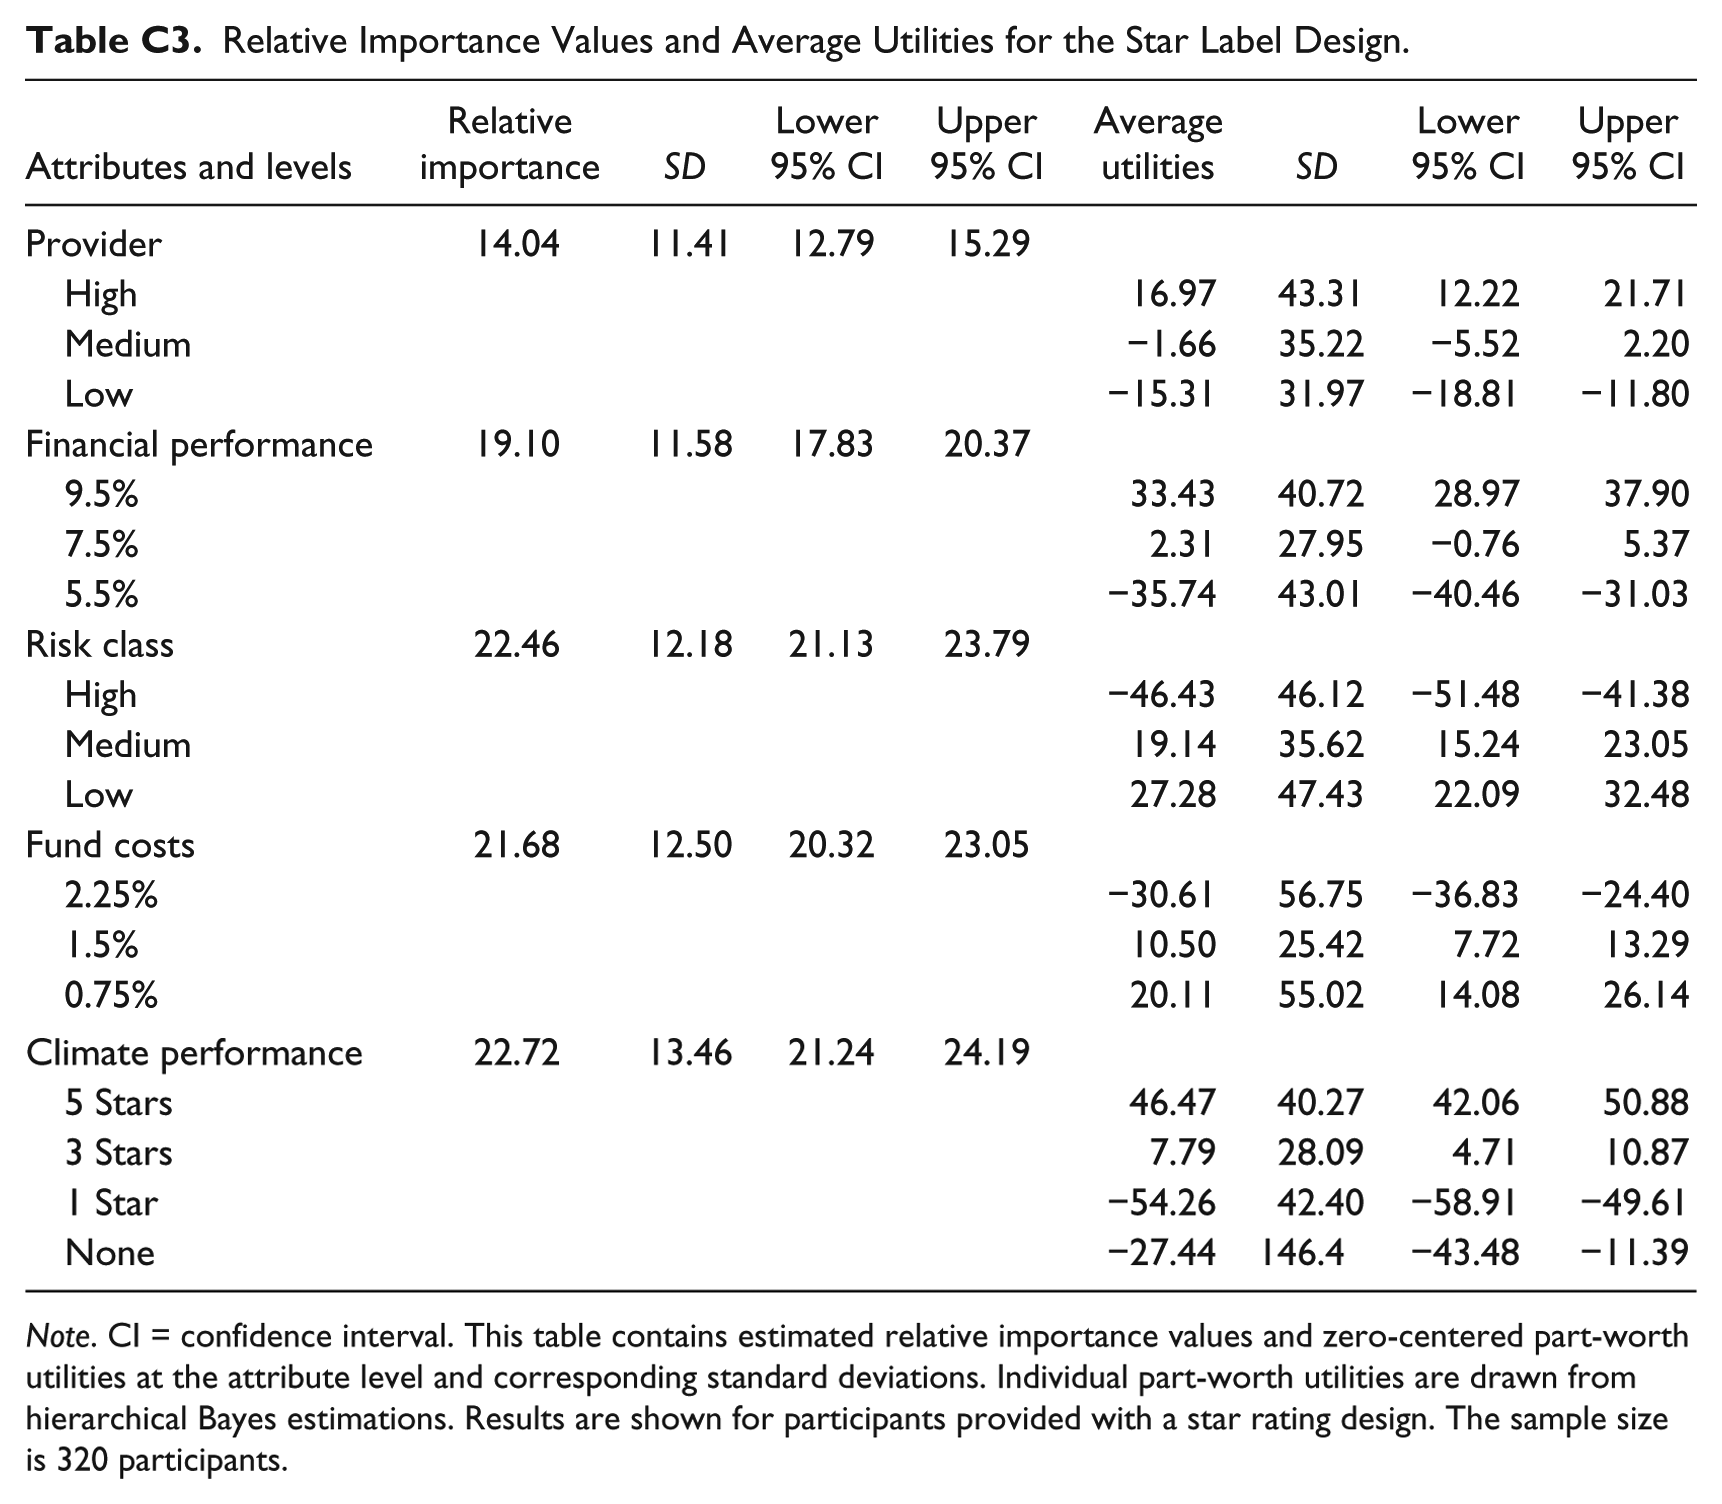
| Attributes and levels | Relative importance | SD | Lower 95% CI | Upper 95% CI | Average utilities | SD | Lower 95% CI | Upper 95% CI |
|---|---|---|---|---|---|---|---|---|
| Provider | 14.04 | 11.41 | 12.79 | 15.29 | ||||
| High | 16.97 | 43.31 | 12.22 | 21.71 | ||||
| Medium | −1.66 | 35.22 | −5.52 | 2.20 | ||||
| Low | −15.31 | 31.97 | −18.81 | −11.80 | ||||
| Financial performance | 19.10 | 11.58 | 17.83 | 20.37 | ||||
| 9.5% | 33.43 | 40.72 | 28.97 | 37.90 | ||||
| 7.5% | 2.31 | 27.95 | −0.76 | 5.37 | ||||
| 5.5% | −35.74 | 43.01 | −40.46 | −31.03 | ||||
| Risk class | 22.46 | 12.18 | 21.13 | 23.79 | ||||
| High | −46.43 | 46.12 | −51.48 | −41.38 | ||||
| Medium | 19.14 | 35.62 | 15.24 | 23.05 | ||||
| Low | 27.28 | 47.43 | 22.09 | 32.48 | ||||
| Fund costs | 21.68 | 12.50 | 20.32 | 23.05 | ||||
| 2.25% | −30.61 | 56.75 | −36.83 | −24.40 | ||||
| 1.5% | 10.50 | 25.42 | 7.72 | 13.29 | ||||
| 0.75% | 20.11 | 55.02 | 14.08 | 26.14 | ||||
| Climate performance | 22.72 | 13.46 | 21.24 | 24.19 | ||||
| 5 Stars | 46.47 | 40.27 | 42.06 | 50.88 | ||||
| 3 Stars | 7.79 | 28.09 | 4.71 | 10.87 | ||||
| 1 Star | −54.26 | 42.40 | −58.91 | −49.61 | ||||
| None | −27.44 | 146.4 | −43.48 | −11.39 |
Note. CI = confidence interval. This table contains estimated relative importance values and zero-centered part-worth utilities at the attribute level and corresponding standard deviations. Individual part-worth utilities are drawn from hierarchical Bayes estimations. Results are shown for participants provided with a star rating design. The sample size is 320 participants.
Appendix D
Relative Importance Values and Average Utilities by Investors’ Cognitive Reflection Scores.

| Attributes and levels | Cognitive reflection score of 0 |
Cognitive reflection score of 1 |
Cognitive reflection score of 2 |
Cognitive reflection score of 3 |
Cognitive reflection score of 0 |
Cognitive reflection score of 1 |
Cognitive reflection score of 2 |
Cognitive reflection score of 3 |
||||||||
|---|---|---|---|---|---|---|---|---|---|---|---|---|---|---|---|---|
| Rel. import. | SD | Rel. import. | SD | Rel. import. | SD | Rel. import. | SD | Av. util. | SD | Av. util. | SD | Av. util. | SD | Av. util. | SD | |
| Provider | 16.20 | 13.27 | 12.42 | 9.26 | 12.76 | 9.13 | 10.72 | 9.01 | ||||||||
| High | 18.36 | 49.37 | 21.43 | 34.88 | 7.57 | 40.44 | 17.3 | 35.71 | ||||||||
| Medium | 0.95 | 41.45 | −6.07 | 26.96 | 2.18 | 31.66 | −9.33 | 25.77 | ||||||||
| Low | −19.31 | 37.13 | −15.36 | 26.59 | −9.74 | 27.89 | −7.97 | 22.54 | ||||||||
| Financial performance | 16.29 | 9.86 | 20.67 | 11.48 | 21.36 | 13.05 | 23.59 | 13.29 | ||||||||
| 9.5% | 22.09 | 36.06 | 37.65 | 40.57 | 42.71 | 41.81 | 55.80 | 43.88 | ||||||||
| 7.5% | 3.25 | 28.61 | 2.61 | 28.46 | 2.73 | 27.37 | −2.75 | 25.56 | ||||||||
| 5.5% | −25.33 | 40.95 | −40.25 | 44.57 | −45.44 | 44.50 | −53.05 | 35.74 | ||||||||
| Risk class | 21.59 | 12.24 | 21.01 | 12.55 | 24.02 | 11.05 | 26.41 | 12.27 | ||||||||
| High | −40.11 | 49.12 | −40.91 | 44.33 | −57.44 | 40.33 | −65.51 | 38.33 | ||||||||
| Medium | 18.26 | 36.52 | 17.84 | 36.13 | 22.85 | 31.92 | 19.44 | 37.55 | ||||||||
| Low | 21.85 | 46.56 | 23.06 | 49.95 | 34.60 | 44.35 | 46.06 | 45.98 | ||||||||
| Fund costs | 20.27 | 12.16 | 24.13 | 13.61 | 21.32 | 11.45 | 23.02 | 12.74 | ||||||||
| 2.25% | −20.76 | 57.12 | −29.02 | 64.85 | −47.58 | 43.16 | −46.48 | 48.43 | ||||||||
| 1.5% | 10.82 | 25.28 | 9.00 | 27.23 | 15.29 | 23.24 | 4.63 | 25.08 | ||||||||
| 0.75% | 9.94 | 54.02 | 20.01 | 63.05 | 32.29 | 44.43 | 41.85 | 48.20 | ||||||||
| Climate performance | 25.65 | 14.49 | 21.77 | 12.73 | 20.54 | 12.21 | 16.27 | 9.03 | ||||||||
| 5 Stars | 54.38 | 43.29 | 40.46 | 39.45 | 43.75 | 36.13 | 31.12 | 27.78 | ||||||||
| 3 Stars | 10.06 | 28.18 | 7.56 | 31.97 | 3.18 | 25.16 | 6.45 | 23.39 | ||||||||
| 1 Star | −64.44 | 41.21 | −48.02 | 46.30 | −46.94 | 40.83 | −37.57 | 31.15 | ||||||||
| None | −42.15 | 159.88 | −36.13 | 153.16 | −2.26 | 106.26 | 9.29 | 122.26 | ||||||||
Note. Rel. import. = relative importance; Av. Util. = average utilities. This table contains estimated relative importance values and zero-centered part-worth utilities at the attribute level and corresponding standard deviations. Individual part-worth utilities are drawn from hierarchical Bayes estimations. Results are shown for participants provided with a star rating design separated by cognitive reflection score. Cognitive reflection score represents a participant’s number of correct answers in the cognitive reflection test, and the score ranges from 0 (no correct answers in the cognitive reflection test) to 3 (correct answers to all three questions in the cognitive reflection test). The sample size is 320 participants.
Appendix E
Correlation of Participants’ Cognitive Reflection Score and Environmental Preference.
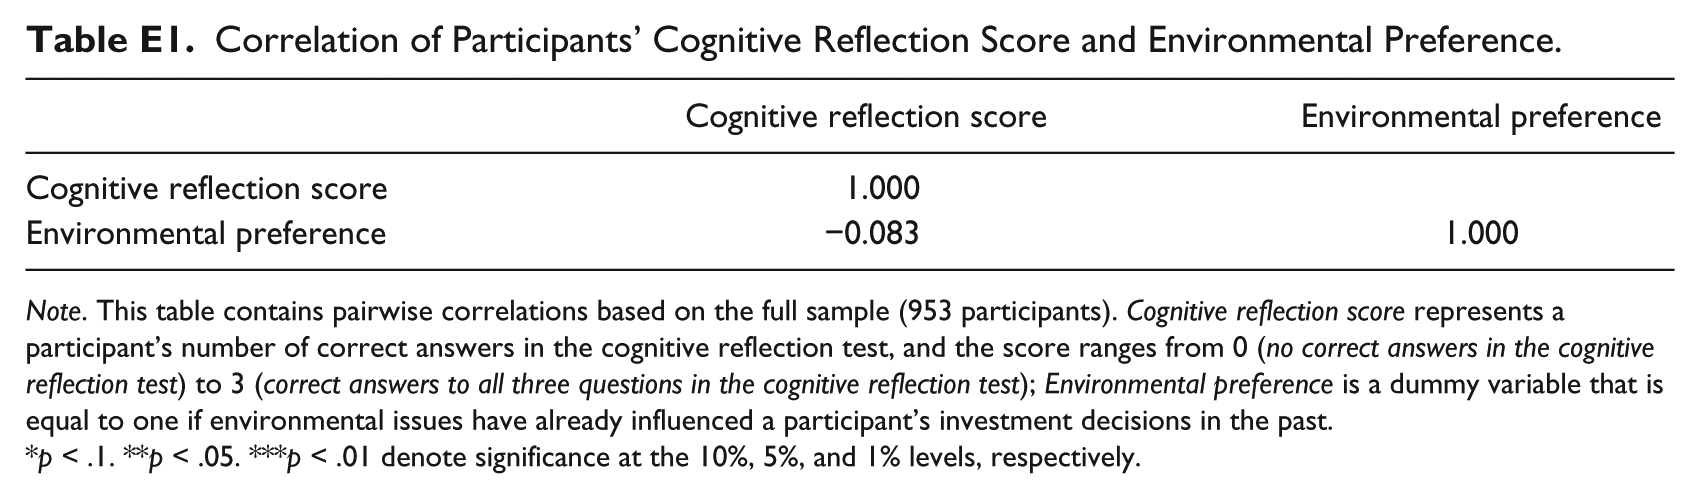
| Cognitive reflection score | Environmental preference | |
|---|---|---|
| Cognitive reflection score | 1.000 | |
| Environmental preference | −0.083 | 1.000 |
Note. This table contains pairwise correlations based on the full sample (953 participants). Cognitive reflection score represents a participant’s number of correct answers in the cognitive reflection test, and the score ranges from 0 (no correct answers in the cognitive reflection test) to 3 (correct answers to all three questions in the cognitive reflection test); Environmental preference is a dummy variable that is equal to one if environmental issues have already influenced a participant’s investment decisions in the past.
p < .1. **p < .05. ***p < .01 denote significance at the 10%, 5%, and 1% levels, respectively.
Declaration of Conflicting Interests
The author(s) declared no potential conflicts of interest with respect to the research, authorship, and/or publication of this article.
Funding
The author(s) disclosed receipt of the following financial support for the research, authorship, and/or publication of this article: Financial funding was provided by Climate-KIC, supported by the EIT, a body of the European Union.