
Abstract
The 17 UN Sustainable Development Goals (SDGs) have created a framework for environmental and social impacts, which institutional investors and corporations are using to guide resource allocation or highlight SDG-aligned investments already in place. We argue that the SDGs have clarified certain elements predominantly missing or implicit in many environmental, social, and governance (ESG) standards, specifically focusing on companies’ E and S externalities. Methodologically, we analyze how health care companies contribute to SDG 3 on health and well-being as a case, mapping the goal’s targets to the Sustainability Accounting Standard Board’s (SASB’s) 30 generic ESG issues and considering both financially material and immaterial ESG issues, based on SASB. Using an innovative data set, we highlight where private sector firms contribute to SDG impacts and where their financial priorities might lie. Where firms are either not contributing or perhaps unable to, we point to the need for public sector activities.
Keywords
Introduction
Amid the global profusion of environmental, social, and governance (ESG) standards and metrics, the 17 United Nations Sustainable Development Goals (SDGs) have created a high-level framework for environmental and social impacts, which many large institutional investors and an increasing number of companies state they are using to guide resource allocation decisions or highlight those already in place. Firms and investors are increasingly mapping what they do to the SDGs.
In this article, we argue that the SDGs have clarified certain elements that have been predominantly missing or implicit in many ESG standards and metrics, focusing on the environmental and social externalities created by companies. More specifically, the SDGs shed light on the positive and negative social impacts created by corporate behavior, while also clarifying areas that remain unaddressed, whether or not those are due to secondary or tertiary effects of such behavior. Additionally, where externalities are absent, these gaps are highlighted by some of the SDGs as well. At the same time, SDGs have made the evaluation of the existing profusion of ESG standards and metrics more complex. One way of evaluating different standards and metrics from an impact point of view is to measure the impact on SDGs in relation to firm-specific performance. To this end, we observe how well the 169 SDG targets (or sub-goals) of the 17 SDGs map to the Sustainability Accounting Standards Board (SASB) ESG categories, and then use data from Truvalue Labs’ 11-year database of the Russell 3000 companies to measure related ESG performance.
This approach enables both companies and investors to determine if environmental and social outcomes of a company’s operations and products are creating positive or negative externalities, or where there may exist specific gaps.
We focus on the health care sector as a case to evaluate the impact of companies in this sector in contributing to the SDGs. In particular, we consider ESG issues that are likely to be financially material to the health care sector according to SASB and how they relate to SDG Goal 3: good health and well-being and its targets. Issues that SASB did not identify as material are also evaluated. The analysis is limited to SASB’s universe of sustainability issues, consisting of 30 broadly defined general issue categories (GICs) of environmental and social issues. We use SASB’s original standards prior to its update in November 2018 (SASB, 2018).
The article is structured as follows. In the next section, we very briefly summarize the profusion and confusion of ESG standards and metrics. The subsequent section shows that while SDGs were initially motivated by and oriented toward the policy context, corporates, and investors adopted SDG goals as part of their business practices, both in terms of words and, to a lesser degree, actions. This is followed by a section that explains our methodology for analyzing ESG performance in the health care sector and for quantifying SDG impacts in that sector and the data and sample used in the analysis. The penultimate section presents an analysis of the data and discusses its implications. In the final section, we conclude and suggest directions for future research based on this limited case study.
The SDG Context: Profusion of ESG Standards and Metrics
Researchers have long noted that ESG rating—along related concepts such as socially responsible ratings, sustainable and responsible ratings, responsible investment—and ranking organizations, as well as indices, frequently rate the same corporation’s E, S, and G elements differently (Kerber & Flaherty, 2017). As Chiu (2010) noted in one study regarding company corporate social responsibility (CSR) reports, they are “selective, subjective and not comparable” (see also, Kostantonis & Serafeim, 2019; Pagano et al., 2018; Dorfleitner et al., 2015; Halbritter & Dorfleitner, 2015). In spite of this, ESG factors are seen as increasing central to mainstream investing. (Amel-Zadeh & Serafeim, 2018).
Windolph (2011) summarizes six generic problems: lack of standardization, resulting in a variety of approaches that must be mapped to each other but inevitably involves subjective judgments and some guess work; lack of transparency as there is typically not full disclosure of methods, criteria, threshold values, and levels; significant biases exist along at least three major dimensions; the generic problem is around tradeoffs—some raters are very granular; others more top level; some are both. A fifth generic problem is information credibility of information sources (often unknown, either in general or in specifics); and finally, the generic problem affecting some firms is the lack of independence, for example, MSCI licenses to some of those they rate, similar to the problem of the credit rating agency model (For an argument about ratings inflation based on conflict of interest, see Shackleton et al., 2019). Additionally, there is the issue of lack of timely reporting (often a year or more later) and the lack of standardization of categories and data sources (Boiral, 2013). 1
A number of studies have demonstrated the lack of correlations challenge, with some of the best focusing on a specific topic (Chatterji et al., 2016; Dorfleitner et al., 2015; Semenova & Hassel, 2015). Lack of correlation presents a challenge to all researchers: How to make sense of dichotomous data, a problem that runs throughout rater and ratings comparisons? 2 Without going into the methodological details, various techniques can begin to sort out these problems, starting with a joint probability of agreement followed by Pearson and Spearman correlations and concluding with pairwise tetrachoric correlations 3 among the six indexes.
Chatterji et al.’s (2016) analysis found pairwise tetrachoric correlations for 3 years among the six raters, with a mean correlation of 0.30 (about 2 standard deviations). However, this also included some negative correlations, meaning what one rater found responsible another found “irresponsible.” 4 After normalizing theorization differences as best they could, Chatterji et al.’s final exercise was to measure commensurability. They found it to be low, as measurement and methods themselves were different.
Methods, Metrics, and Data: The Takeaway
The above discussion illustrates the usefulness of standardization/theorization in improving convergence among raters and providing a common basis for interpretation for users. Investors being some of the primary users of such ratings and rankings, a focus on financial materiality (i.e., what is relevant for financial performance) provides an important avenue in cutting through the noise and profusion of metrics while also identifying overlap between societal stakeholder interests and interests of shareholders (in other words, identifying where companies today have incentives to act on environmental and social issues).
From an investor point of view, the growing influence of SASB has a public goods advantage, both in the United States and increasingly in other countries. SASB, an independent nonprofit organization, and not a rater or a ranker, has developed its sustainability accounting standards as a public good, accessible freely on its website, precisely to tackle the problem of standardization of ESG issues and related performance measures. If SASB’s set of specific materiality-based standards for ESG information (or similar standards by others who may come along) become widely accepted (or mandated), focus will subsequently be on data inputs into, and analyses of, these financially oriented materiality categories for what appears to be a more unified financial-investor client audience. In public goods standardization, information will increasingly come to the fore. SDGs, too, are public good categories. We describe their nature, intent, and use by investors and companies in the nest section. One point of contrast, or rather, complementarity, to note with the SASB standards is that the SDGs are focused on defining environmental and social impacts and externalities, whereas SASB standards emphasize environmental and social management, performance, or outcomes of company actions.
We recognize that the materiality approach has some limitations, particularly in achieving societal objectives as defined by the SDGs. Yet, contrasting those ESG issues relevant for the SDGs that are material to financial performance with those that are not material, can illuminate where there may be areas related to the SDGs where companies can indeed act; however, they may lack incentives, or their impact may be limited. This study’s mapping helps identify these limitations and provides direction for public policy or impact investors to nudge (or shove) companies in areas where they do not currently have incentives, or to develop public sector/nongovernmental organization (NGO) solutions where, even if companies do act, they will have limited impact. In this way, SASB’s identification of financially material ESG issues, viewed in the light of global environmental and social objectives outlined by the SDGs, can serve as a standard for deriving actionable insights for companies, investors, and the NGO and public sector.
In other words, use of SASB and the SDGs, both public goods and complementary in nature, covering both corporate performance and related externalities, can help resolve some of the theorization issues with ESG ratings and rankings discussed earlier. Through outlining specific metrics and technical protocols that describe how a company should measure and report on performance on the material ESG categories, SASB standards can also help get some of the way to improved commensurability. However, until such time as companies all adopt SASB standards and report exactly according to the technical protocols in a timely manner, a corollary to the standardization argument is the likelihood that the terrain of ratings and ranking competition will shift from theorization to commensurability. With these types of changes in both theorization and commensurability of ESG ratings and rankings, the field is open to a paradigm shift in how ESG is conceived, analyzed, and measured.
The Importance of the SDGs to the Private Sector
The 17 SDGs for 2030, adopted by the 193 countries of the UN General Assembly on September 15, 2015, have been described as “the closest thing the Earth has to a strategy” (Pricewaterhouse Coopers, 2017). They are about making the world a better place for this generation as well as future generations.
The SDGs succeed the eight Millennium Development Goals (MDGs) for 2015 that were adopted in 2000. Opinions vary on how successfully the MDGs were achieved with the common consensus being that “progress was made but not enough” (World Vision International, 2015). Some argue that the reason for this is that the private sector had no meaningful involvement in the development of the MDGs and that governments failed to provide the necessary funding support (Speri, 2013). Fortunately, the private sector had a much bigger role in developing the SDGs as it was called to actively participate in designing the agenda for global sustainable development together with political and civil society actors (Scheyvens et al., 2016) even if a significant funding gap remains. Estimates by the United Nations Conference on Trade and Development (UNCTAD) show that from 2015 to 2030 investments of US$ 5 to US$7 trillion each year will be required to meet the SDGs, with only a share of around 15% covered by public funds. This therefore leaves a gap of around US$ 6 trillion per year that will need to be financed with private capital, through companies and direct investments (Principles for Responsible Investment, 2017; UNCTAD, 2018).
A body of literature has been developed in the last few years on the role of the private sector for the SDGs. In their extensive review of the studies on the relationship between multinational enterprises (MNEs) and sustainability, Kolk et al. (2018) and Kourula et al. (2017) found that the greatest attention is devoted to poverty and inequality, probably because these are the dimensions of the SDGs where multinational corporations might have the most direct effect (Witte & Dilyard, 2017). Schönherr et al. (2018), analyzing the relationship between CSR and the SDGs, emphasize the role of SDGs as a framework for CSR activities so as to ensure their impact on the most salient issues for sustainable development. The authors emphasize the mutual benefits of such an approach, as engagement with the SDGs contributing to creating direct shareholder value—for example, by developing infrastructure or clean technologies—can also benefit MNEs by restoring trust in the private sector and creating legitimacy.
However, the SDG agenda per se represents an important opportunity for business, as it can create a “trillion dollar” opportunity (Hoek, 2018). Despite the fact that the SDGs were not created for companies nor for financial markets, as they are an intergovernmental initiative, a 2017 report by the Business and Sustainable Development Commission(BSDC) argues that companies should increasingly include the goals in their strategic agenda and not merely rely on them as part of their CSR initiatives (BSDC, 2017). This opportunity is not only related to the investment and risk taking required to make the SDGs work but also highlights the potential market that will be created if all targets are met (Van Tulder, 2018). A recent survey by the World Business Council for Sustainable Development (WBCSD) of 250 corporations across four continents found that 78% of companies have already undertaken efforts to prioritize the SDGs within their organization and 47% have managed to identify sustainability targets that are linked to SDGs. In doing so, 74% of respondents were motivated by opportunity to better focus sustainability strategies and most interestingly, as many as 66% saw opportunity to innovate and provide business solutions to societal problems. Notwithstanding these results, the survey reveals that integration challenges remain, as in only half of companies surveyed the responsibility for the SDGs sits at the CEO’s offices, therefore making the integration with corporate strategy more difficult (WBCSD, 2018). Moreover, the findings of a recent study by Mhlanga et al. (2018) reveal that among 76 of the world’s largest companies across different sectors the SDGs have not yet substantially determined any change in their approach to corporate sustainability and SDG priorities appear to mirror companies’ existing sustainability priorities instead of being shaped by a robust analysis of SDG-related business goals. Van Zanten and Van Tulder (2018) take a different approach and present survey results from 81 European and North American MNEs on their engagement with the SDGs. This study is the first and, to the extent of our knowledge, the only to be based on a survey that considers the engagement of companies on the SDGs at a target level. The authors find that MNEs primarily engage with internally actionable SDG targets, and that they engage with SDGs mainly to reduce negative externalities, therefore avoiding negative impacts on sustainable development, rather than engage with those SDGs targets that require “doing good.” The latter, being less internally actionable, would require a partnership for the Goals that is critical for a broader and more active involvement of the MNEs in the achievement of the SDGs (Van Zanten & Van Tulder, 2018).
Although momentum around the SDGs is strong, on an investors’ perspective the issue on how contributing to the Goals can help them fulfill beneficiaries’ expectations around risk-adjusted return is still open (Principles for Responsible Investment, 2018). Many investors see the SDGs not only as a useful framework for thinking about their portfolios, but also as useful for identifying system-level issues 5 that must be addressed concerning the “State of the World.” Very large asset owners and asset managers cannot diversify away from system-level risks such as climate change and rising inequality (Hawley & Lukomnik, 2018; Hawley & Williams, 2000). The system level is particularly important for those with a long-term horizon and some investors even see the SDGs as helping identify specific investment strategies, such as thematic strategies for renewable energy companies.
For companies, it has been claimed that even the world’s largest corporations can do little to effectively affect the state of the world on an individual basis and that at least a sector-level approach is necessary (BSDC, 2017). Nevertheless, while companies are increasingly recognizing the importance of a long-term perspective, they still feel pressure from shareholders to deliver returns, also in the short term. This poses a dilemma for companies: how can they support the SDGs while still delivering returns to shareholders? (see Donoher, 2018). While investors may be enthusiastic about the SDGs, most of the money devoted to achieving them will come from the resource allocation decisions made by the companies in which they invest. Thematic strategies, impact investing, and infrastructure investing are and will likely remain a small proportion of an investor’s total portfolio, most of which is and is likely to remain in public equity and public debt. And even if the incorporation of ESG factors in investment strategies is increasingly becoming the “new normal” (Bernow et al., 2017), traditional ESG integration 6 strategies do not explicitly take into account a portfolio’s impact on SDGs.
One solution to resolving this dilemma starts by recognizing that companies must pick and choose which of the SDGs, and which targets within each SDG, are most relevant to them given their industry and strategy. This can be achieved by first, identifying the environmental, social, and governance issues that are “financially material,” as they create value for shareholders and, second, by identifying which SDGs and targets are affected by these material issues. This approach provides a narrative about the relationship between the material ESG issues that investors care about and the SDGs targets and externalities to companies that the world cares about. Companies can use this in assessing and reporting how their value creation activities contribute to the SDGs. Investors can use this to evaluate the impact of their portfolios. Such an approach might also have implications for policy makers regarding remaining gaps in achieving the SDGs, which we discuss further below.
To the best of our knowledge, this is the first study linking companies’ efforts and investors’ interest in the SDGs with financial interests. Furthermore, this article builds on the authors’ earlier articles referenced below, to address some of the theorization and commensurability challenges with ESG ratings and rankings referenced earlier, by bringing together two public goods frameworks—SASB and the SDGs—and an innovative, transparent data set provided by Truvalue Labs.
Analyzing ESG Performance and SDG Impacts for the Health Care Sector
Methodology
To link SDG impact and financial performance we adopt the concept of materiality provided by the Sustainability Accounting Standard Board (SASB), that identifies those sustainability issues that are relevant not for multiple stakeholders but from an investor’s perspective. SASB is a San Francisco-based nonprofit organization established in 2011 and its mission is to develop measurement standards for reporting on ESG that are of the same relevance and reliability as accounting standards for financial information. In particular, SASB standards “provide investors with decision-useful information on the sustainability issues that are reasonably likely to materially affect near-, medium-, or long-term business value” (SASB, 2017a, p. 10). SASB’s definition of materiality is strictly linked to the audience it refers to (i.e., investors) that has its own unique needs, different from those of suppliers, customers, communities, interest groups, and other stakeholders. As investors demand reliable and comparable sustainability information with clear links to financial performance, SASB identifies the subset of sustainability issues that are reasonably likely to be material to them from a universe of 30 GICs organized in the five dimensions of environment, social capital, human capital, leadership and governance, and business model and innovation. As financial materiality of sustainability issues varies across industries (Eccles & Serafeim, 2013), in order to preserve a focus on financial materiality as well as to attain comparability among peers, SASB standards are industry specific. The results of SASB’s materiality process are summarized in their Materiality Map©.
It should be noted that SASB’s identification of financially material ESG issues per industry was based on its industry-specific research on evidence of financial impact and investor interest in these issues, together with input from its diverse and large stakeholder network, which included companies, investors, and third-party experts. 7 While its specific performance measures for each material issue might have the problem of geographical bias, due to SASB being U.S. based, the identification of materiality is based more on the industry’s operations and typical products and services, which may have less of a geographical bias as a result.8,9 Nonetheless, the geographical bias in some of the SASB metrics is less relevant for this article, which uses not the company self-disclosed data based on specific SASB metrics but rather third-party data sources using the Truvalue Labs data set described further below.
Following SASB’s guidance on industry-specific material sustainability issues, we thus develop a framework to evaluate company performance on a material ESG performance dimension and the SDGs impact dimension, focusing on the health care sector and SDG 3: “Ensure healthy lives and promote well-being for all at all ages.”
The peculiarity of our approach to the SDGs is the adoption of an investor’s perspective, in line with SASB’s definition of materiality, that is different from other studies that link corporate behavior to the SDGs. Among these, a recent work of Van Tulder (2018) presents an interesting framework providing an integrated approach (linking micro and macrolevels of analysis) for making corporate strategies effective for sustainable development. These aspects have not been taken into account in our study. Indeed, for the purpose of this article, we believe that mapping the SDGs to a SASB framework aids in resolving theorization and commensurability problems, particularly when combined with data transparency as can be facilitated by new technologies, specifically big data mining and analytics. Additionally, marrying SASB’s framework of 30 general issues and industry subsets of material issues to the SDGs can provide a powerful tool and starting point to focus on the most pertinent and influential environmental and social SDG issues by industry. Moreover, looking beyond material issues to what SASB considers as likely “immaterial” ones (i.e., nonfinancially relevant at industry level) and relating them to the SDGs could additionally help to identify areas where a company might have only marginal influence (for example, due to the nature of its products or activities), or where the issue is not a focus of its business because of the lack of related financial incentives or disincentives.
It is also important as what may be considered as “immaterial” today can become material in the future if and when important market actors (or in some formulations, nonmarket stakeholders as well) see an issue or development as financially significant (Eccles & Youmans, 2016; Roger & Serafeim, 2019; Hawley, 2016). In circumstances where “immaterial” or “not yet material” exists, a focus on public policy becomes evident. Of course, these are all cases where, at company level, an approach such as the one of Van Tulder (2018) is necessary in order to assess the degree and the dynamic of a possible integration between the company and the other actors active in the sustainable development arena.
The first step of our methodology relies on Betti et al. (2018) who develop a framework to assess the link between material ESG issues from an investor perspective and the potential impact on the SDGs. Based on the work of DeMates and Phadke (2017), the authors mapped the 30 SASB GICs to the specific targets for each SDG and, based on this mapping together with SASB’s assessment of which subset of GICs are material per industry, calculated a set of indices that measure the ability of each industry and each sector to affect the SDGs.
These previous mappings between the universe of 30 SASB GICs and 17 SDG goals and their 169 targets were not unique per industry; what was unique for each industry was SASB’s assessment of the subset of material GICs. Nevertheless, due to the breadth of the SDGs, each of them encapsulates several SASB categories and in several cases, only specific topics, often depending on industry, within a SASB general issue category may be relevant to that SDG rather than the broad conceptualization of the category. 10 Therefore, when analyzing individual sectors and industries, it is necessary to adjust the previous mappings, to take into account the specific activities, products, and topics applicable to those industries, as discussed by SASB in its individual industry standards.
In this article, the sector-adjusted mapping was created considering the specific industry and sector topics within each SASB general issue category. Two authors independently adjusted the Betti et al. (2018) mapping according to the specific relevance of the Health care sector’s topics for each target. In adjusting the mapping, they considered the language describing the SDG goal and its targets, comparing it to the language describing SASB’s industry-specific disclosure topics and metrics for industries of the health care sector.11,12 Table 1 provides the list of Targets of SDG 3 and Table 2 provides the results of our mapping adjusted for the health care sector.
Targets of Sustainable Development Goal (SDG) 3.

Mapping of SASB’s GICs to SDG 3 Targets Adjusted for the Health Care Sector.
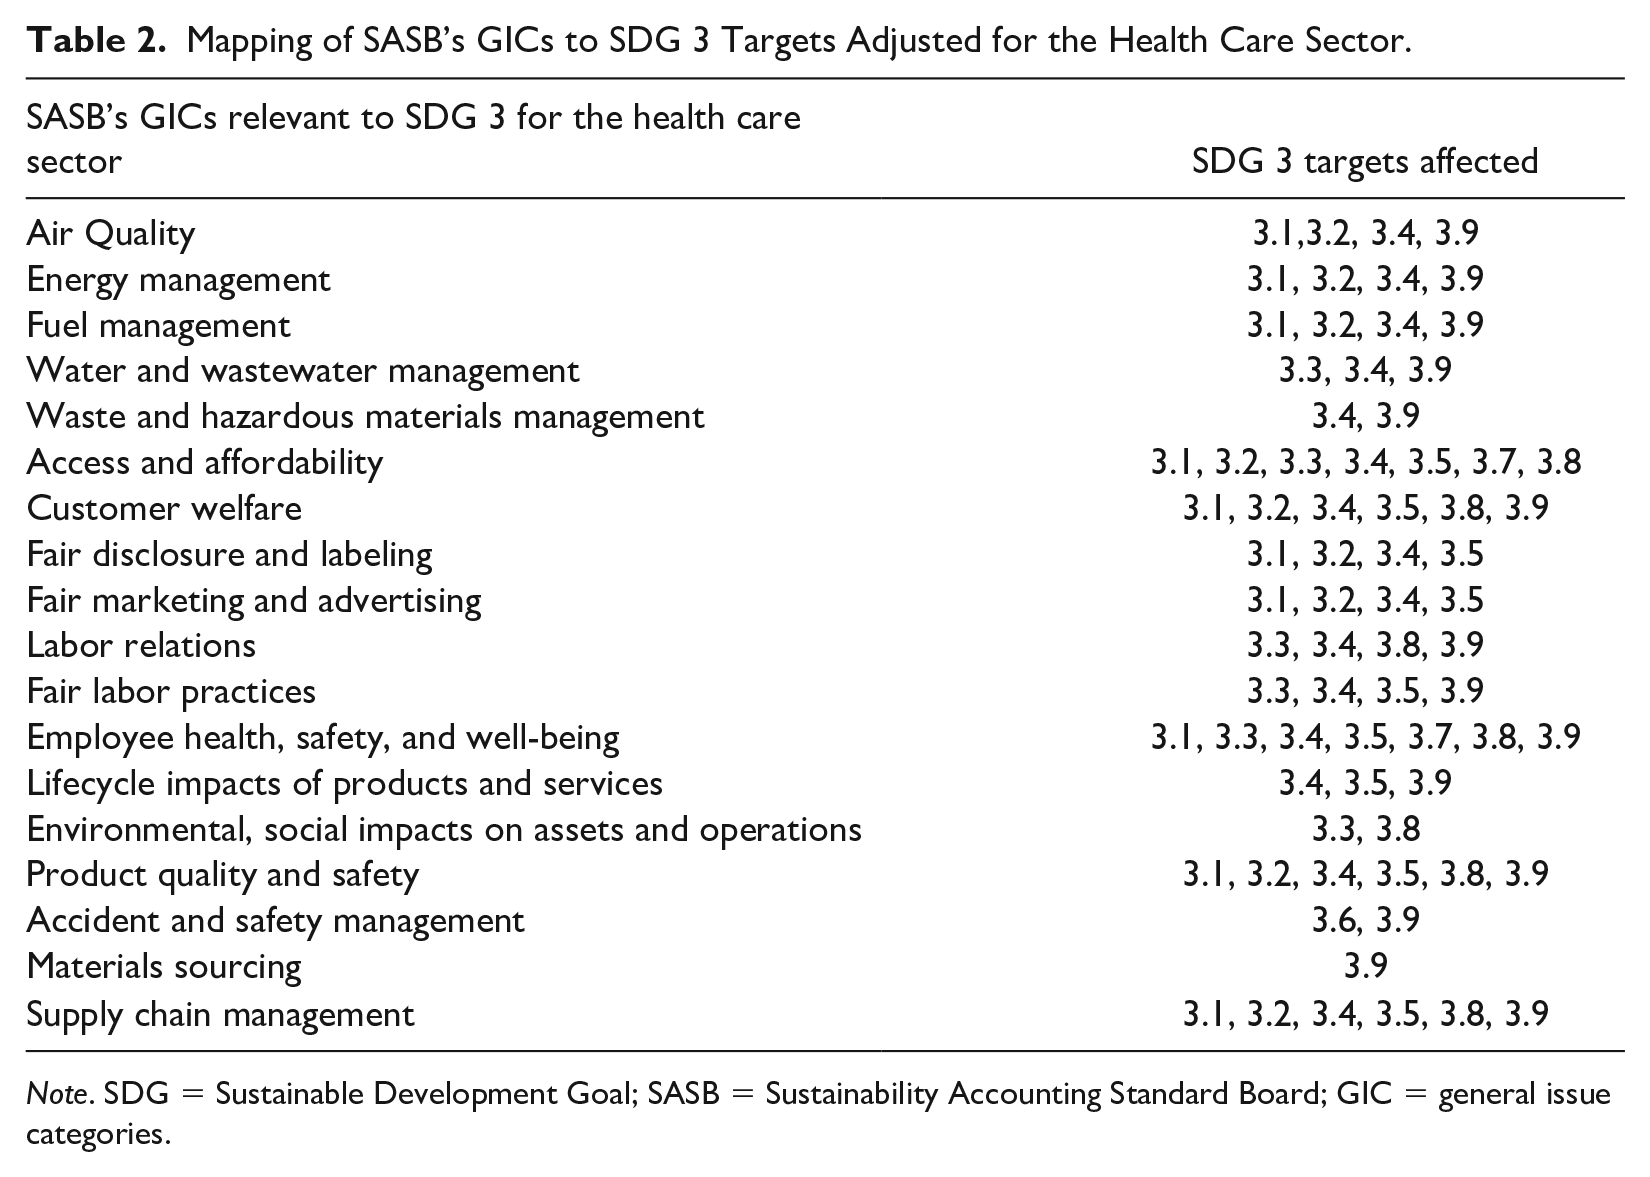
Note. SDG = Sustainable Development Goal; SASB = Sustainability Accounting Standard Board; GIC = general issue categories.
It should be noted that SASB’s standards were developed to measure investor-oriented material financial impacts from sustainability issues (SASB, 2017b) and not sustainability impacts per se. However, as discussed in Betti et al. (2018), if good metrics exist for company performance on their material issues, one could use these ESG measures as proxies for SDG impact: a firm’s negative and positive externalities.
The latest machine-learning and natural language-processing technologies are making possible the evaluation of company performance on material issues from third party perspectives and with greater frequency than traditional data even in the absence of market-wide adoption of specific SASB metrics. For this reason, we use data from Truvalue Labs to evaluate actual company performance on material ESG issues related to the SDGs.
Truvalue Labs’ Insight360 SASB edition utilizes the framework of SASB’s 30 general issue categories and the material subset for each industry, applying that lens to big data gathered and analyzed by artificial intelligence. As a result, Truvalue Labs also provides a composite score based on all 30 categories and a materiality composite score based on material categories. In our analysis, we use the Insight Score from Truvalue Labs, which is a measure of a company’s longer term ESG track record, equivalent to ratings provided by others but continuously updated based on an underlying Pulse Score, which captures events as they occur. One of the benefits of this data set is that it provides transparency into the data inputs, as each data point contributing to the category level or overall score is visible in the form of underlying source articles that discuss the ESG issue in question. Truvalue Labs’ algorithms consistently score underlying textual information describing positive or negative performance and behaviors (e.g., a discussion by a trade journal of a new treatment for a priority disease or a discussion by an NGO or media outlet of a catastrophic tailings dam failure). Given that the scores are based on data from global sources, once applied, algorithms are therefore consistent in scoring similar language in the same way and escape some of the analyst subjectivity involved in assessing and interpreting each data point for each company. Furthermore, the underlying information itself is not provided by the company being scored, but rather by independent third parties. These address some of the biases and challenges with other ESG ratings and rankings discussed in the SDG Context section.
Using the updated SASB-SDG mapping and updated indices from Betti et al. (2018) together with the Truvalue Labs Insight Scores mentioned above, we provide a framework for identifying specifically where private sector companies can make a meaningful contribution to the SDGs. The framework allows one to analyze where incentives are currently in place for companies to contribute to the SDGs, primarily in the form of material ESG factors as identified by SASB, and to identify gaps wherein policy intervention or investor engagement may be necessary to achieve the SDGs in the absence of such incentives. This framework also provides a useful way for companies to cut through the confusion around where SDGs fit into their existing and planned ESG activities and reporting, especially due to its industry-specific and materiality-focused approach. Additionally, it provides a transparent manner in which companies can be evaluated for their ESG and SDG performance.
To our knowledge this study is the first to use the methodology along with noncorporate-self-disclosed third-party behavioral data to begin to understand how individual firms’ actions affect specific SDG targets and where those might lead to material financial impacts. A number of practitioner studies (e.g., KPMG, 2018; Pricewaterhouse Coopers, 2018; Robeco, 2018) have developed tools of their own, but all rely either on proprietary data, nontransparent data and/or self-reported, unaudited corporate disclosures. Similarly, the UN Global Sustainability Index Institute (UNGSII), established to assist and track implementation of the SDGs, relies entirely on corporate self-reported data (UNGSII, 2018). The Global Reporting Initiative (GRI) has established a useful set of metrics for pro forma SDG self-reporting, but as of this writing there is as yet no data on the website (GRI, 2018). While in varying degrees all these are useful, none in and of themselves can be relied on as unbiased data. Additionally, methods are not disclosed or fully disclosed. We take a cue for this study from a 2015 report by the OECD, which wrote in relation to the SDG data problem: Even in this era of “big data,” no country, not even among OECD members, has all the data it needs to monitor the SDGs. New resources must be tapped to fill the gaps, and an unprecedented and sustained international effort will be needed to develop the new information required. (OECD, 2015, p. 17)
Data and Sample
Our analysis of how ESG performance measures relate to SDG impacts is based on a sample of U.S.-headquartered companies of the health care sector included in the Russell 3000 and scored by Truvalue Labs from January 2007 to February 2018. According to SASB’s Sustainable Industry Classification System, the industries included in the health care sector are those of Biotechnology, Pharmaceuticals, Health Care Distributors, Health Care Delivery, Managed Care, Drug Retailers, and Medical Equipment.
The original sample included 545 firms. Nevertheless, as in Malinak et al. (2018), we ensure statistically robust information quality by applying a volume filter and including in our analysis only those firms in the top 40% by article volume (i.e., the number of ESG-relevant data points for that company on any given day), resulting in a final sample of 307 firms.
The distribution of the sample among the different industries of the health care sector (Table 3) shows that our sample is quite unbalanced: around 80% of the sample, represented by only three industries (medical equipment, biotechnology, and pharmaceuticals) out of seven, accounts for 34% of total market capitalization, yet only 5% of total revenues in the sample. Moreover, despite the very low number of companies in the Drug Retailers industry (only 2), it accounts for almost 40% of market capitalization and revenues.
Sample Distribution: Health Care Sector Companies in the Russell 3000.
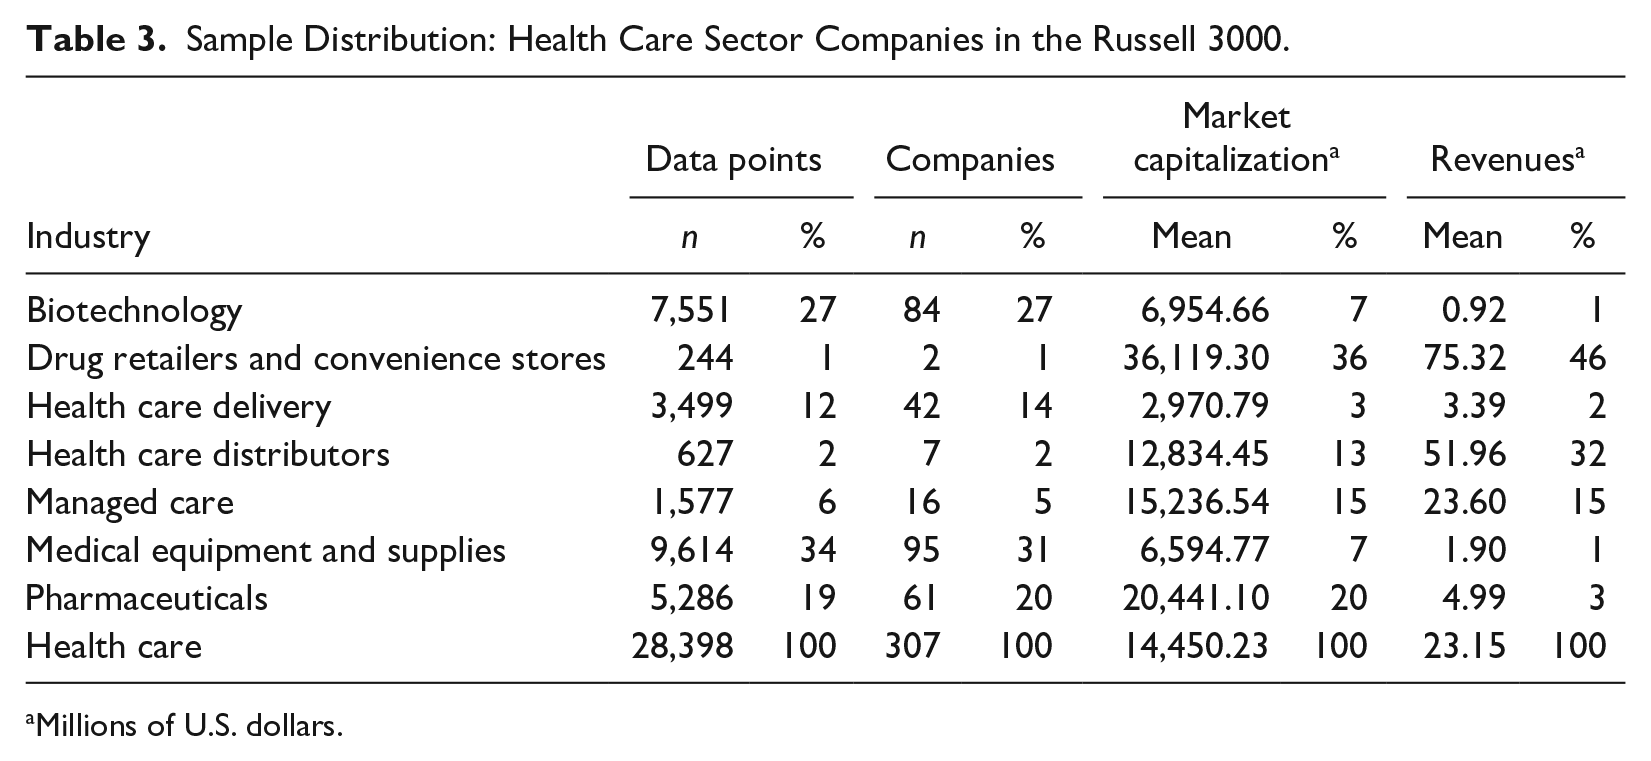
Millions of U.S. dollars.
While we use companies in the Russell 3000 for our case study, the analysis could be conducted also on a global universe of securities. We discuss earlier in the article SASB’s global applicability, and the SDGs are themselves global in nature.
The ESG performance score we used in our analysis of the data sample is a material ESG score, based on Truvalue Labs’ Insight scores for each company, considering only the material issues per company as defined by SASB’s Materiality Map. Descriptive statistics are presented in Table 4.
Material ESG Performance Scores.
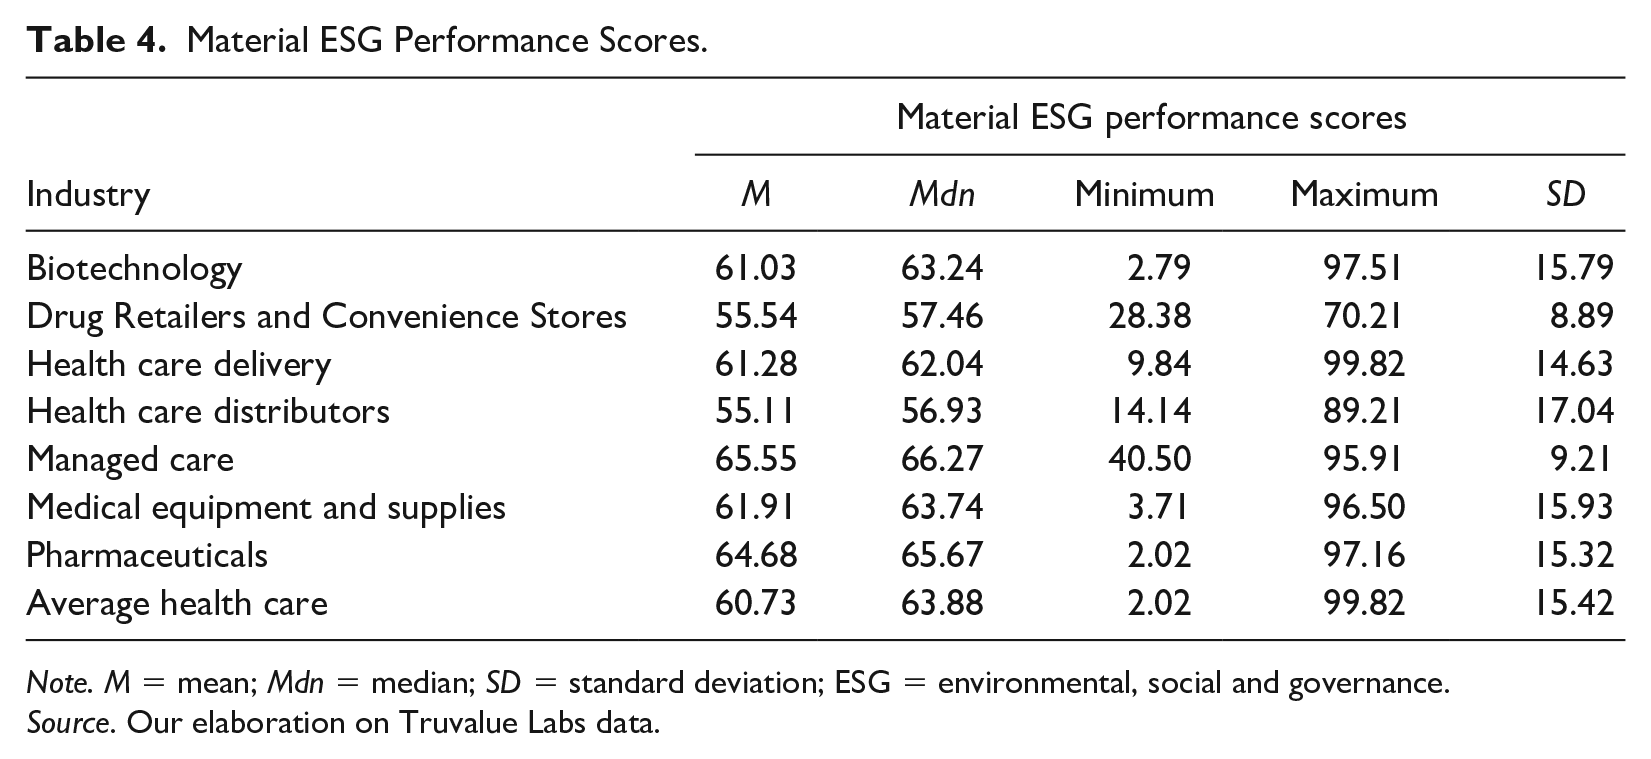
Note. M = mean; Mdn = median; SD = standard deviation; ESG = environmental, social and governance.
Source. Our elaboration on Truvalue Labs data.
Analysis and Discussion
Considering only performance on material ESG issues, all industries in the health care sector display positive performance on average, represented by mean scores higher than 50. However, Table 4 shows that score distributions within industries vary significantly, with a minimum performance score of 2.02 in the pharmaceuticals industry and a maximum performance score of 99.82 in the Health Care Delivery industry. This indicates potential for investors to select top performing companies on material ESG issues and engage with or exclude bottom performers within an industry or sector.
By themselves, unadjusted, the material ESG performance scores do not identify what impact a company is having on a particular or all SDGs and their targets. To understand the link between ESG performance and progress toward the SDGs, we consider the ESG performance scores only for those material issues that are relevant for a particular SDG, and analyze those in the context of the industry- and sector-based SDG impact indexes formulated in Betti et al. (2018), where the potential SDG impact of an industry is a function of the number of its material issues (out of SASB’s universal list of 30) and of which SDGs they are relevant to.
To assess the scope of impact that an industry and a sector can have across all the SDGs when considering only its material sustainability issues, we use the Average Industry SDG Target Impact Index (AISTII), and the Average Sector SDG Target Impact Index (ASSTII). These represent the average, at the industry and sector level respectively, of the potential impact that each industry (sector) can have on the overall SDGs and their targets, measuring the industry (sector) ability to affect the SDGs through its material issues.
As in Betti et al. (2018), the AISTII (ASSTII) is the ratio between the number of industry (sector) material sustainability issues affecting all the targets of all SDGs and the number of SASB’s general issues (GICs) affecting all the targets of all SDGs.
In other words, the denominator represents the maximum (theoretical) impact of an industry (sector) if all SASB’s general issues that are relevant for all SDGs were material to it. As the value of the indexes varies from 0 (i.e., not one of SASB’s issues affecting the SDGs is material for the industry) to 100 (i.e., all SASB’s issues affecting the SDGs are material for the industry), an AISTII (ASSTII) lower than 50 means that the majority of the SDG impact of an industry (sector) comes from nonmaterial ESG issues, as identified by SASB.
We see from Table 5 that this is the case for all health care sector industries other than Biotechnology and Pharmaceuticals, which is also reflected in the ASSTII for the health care sector being lower than 50.
Average Industry SDG Target Impact Index (AISTII) and Average Sector SDG Target Impact Index (ASSTII) for the Health Care Sector.
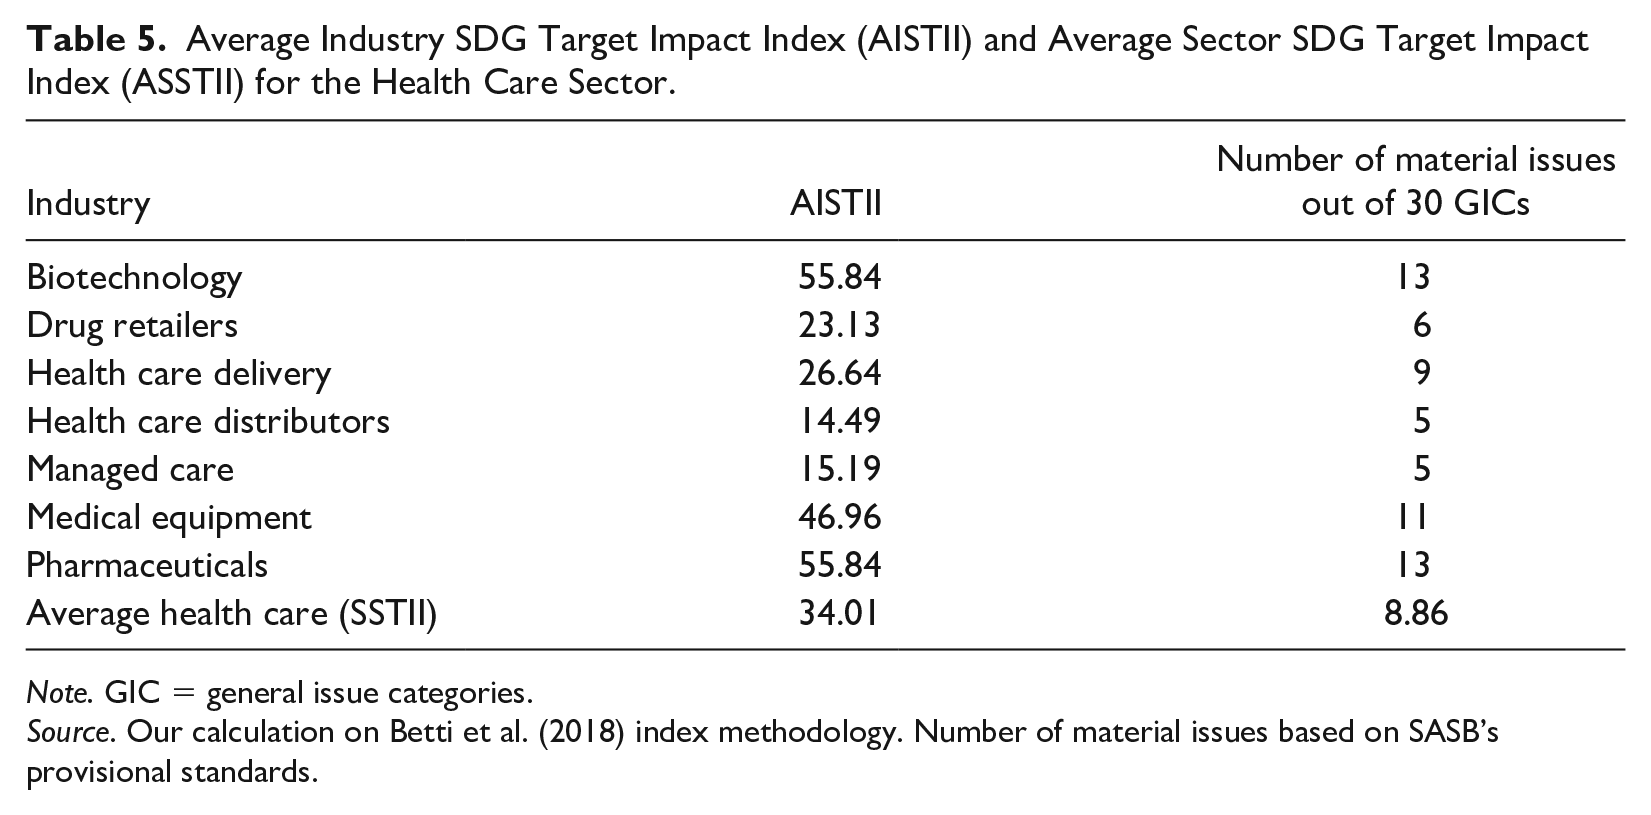
Note. GIC = general issue categories.
Source. Our calculation on Betti et al. (2018) index methodology. Number of material issues based on SASB’s provisional standards.
Table 5 represents impacts across all 17 SDGs, so the ASSTII of 34.01 for the health care sector means that while material issues account for a not insignificant share of the potential impact on the SDGs, the sector primarily affects the SDGs through its nonmaterial (or not yet material) issues. This makes intuitive sense too, since only one SDG (SDG 3) out of the 17 SDGs relates explicitly to health care products and services. Biotechnology and Pharmaceuticals industries are likely to have more of an impact from their material issues on different SDGs due to the manufacturing nature of their operations (vs. service providers such as managed care companies), and related environmental and social externalities. The relative magnitude of the AISTII in the table below is consistent with the relative number of material issues out of 30 GICs for each industry, as identified by SASB, reflecting the impact of the numerator in the above index calculation. We can disaggregate the analysis looking at potential SDG impact at the target level for a specific SDG.
As previously mentioned, we will focus on SDG 3 as it is generally considered the goal for which the health care sector has the biggest role in its achievement. This approach can help with more granular guidance for investors and policy makers on what is possible in terms of SDG targets through performance focused on material ESG issues. In this case, we will use, as a measure of the scope of impact on SDG 3, the Industry SDG Target Impact Index (ISTII) and the Sector SDG Target Impact Index (SSTII), and for each target of SDG 3, the Industry Target Impact Index (ITII) and the Sector Target Impact Index (STII), all calculated on the basis of our mapping adjusted for the health care sector.
According to Betti et al. (2018), for each SDG, the ISTII is the ratio between the number of industry material sustainability issues affecting all the targets of the SDG and the number of SASB’s general issues (GICs) affecting all the targets of the SDG (theoretical maximum scope of impact, as defined above), whereas the SSTII is calculated as the average of the ISTIIs within each sector.
At target level, for each Target in a given SDG, the ITII is calculated as the ratio between the industry material sustainability issues affecting the target and the number of all the SASB’s GICs affecting the target (theoretical maximum scope of impact, as defined above). Also in this case, the corresponding index at sector level, the STII, is calculated as the average of the ITIIs within the sector. This can be illustrated with a simple example at the most granular level. Table 2 shows that Target 3.1 (“By 2030, reduce the global maternal mortality ratio to less than 70 per 100,000 live births”) maps to 10 SASB GICs. However, only four of these are considered as likely to be material for the Drug Retailers industry, 13 for which the ITII for Target 3.1 equals 4/10 = 0.4*100 = 40. In other words, the industry influences Target 3.1 through its four material issues but could theoretically also affect the industry through the remaining six SASB GICs that are relevant for that Target but are not material to its financial performance. For drug retailers, these nonmaterial issues account for the majority of possible impact on Target 3.1.
All the aforementioned indices measure, at different levels of detail, the ability of an industry (sector) to contribute to the single SDG and Target when considering only its material, and therefore financially relevant, sustainability issues, and conversely, they indicate also the role of nonmaterial issues in contributing to the SDG and Target.
In Table 6, we consider the impact indices taking into account material ESG issues per industry as they map to the specific targets of SDG 3 (based on Table 2). Given the indexes calculation methodology, the value of all the aforementioned indexes ranges from 0 to 100. As with Table 5, an impact index lower than 50 implies that a majority of the impact on SDG 3 and its targets derives from the industry’s nonmaterial issues. The values in boldface in Table 6 indicate where this is the case.
SDG 3: Industry (Sector) SDG Target Impact Index (ISTII and SSTII) and Industry (Sector) Target Impact Index (ITII and STII). a
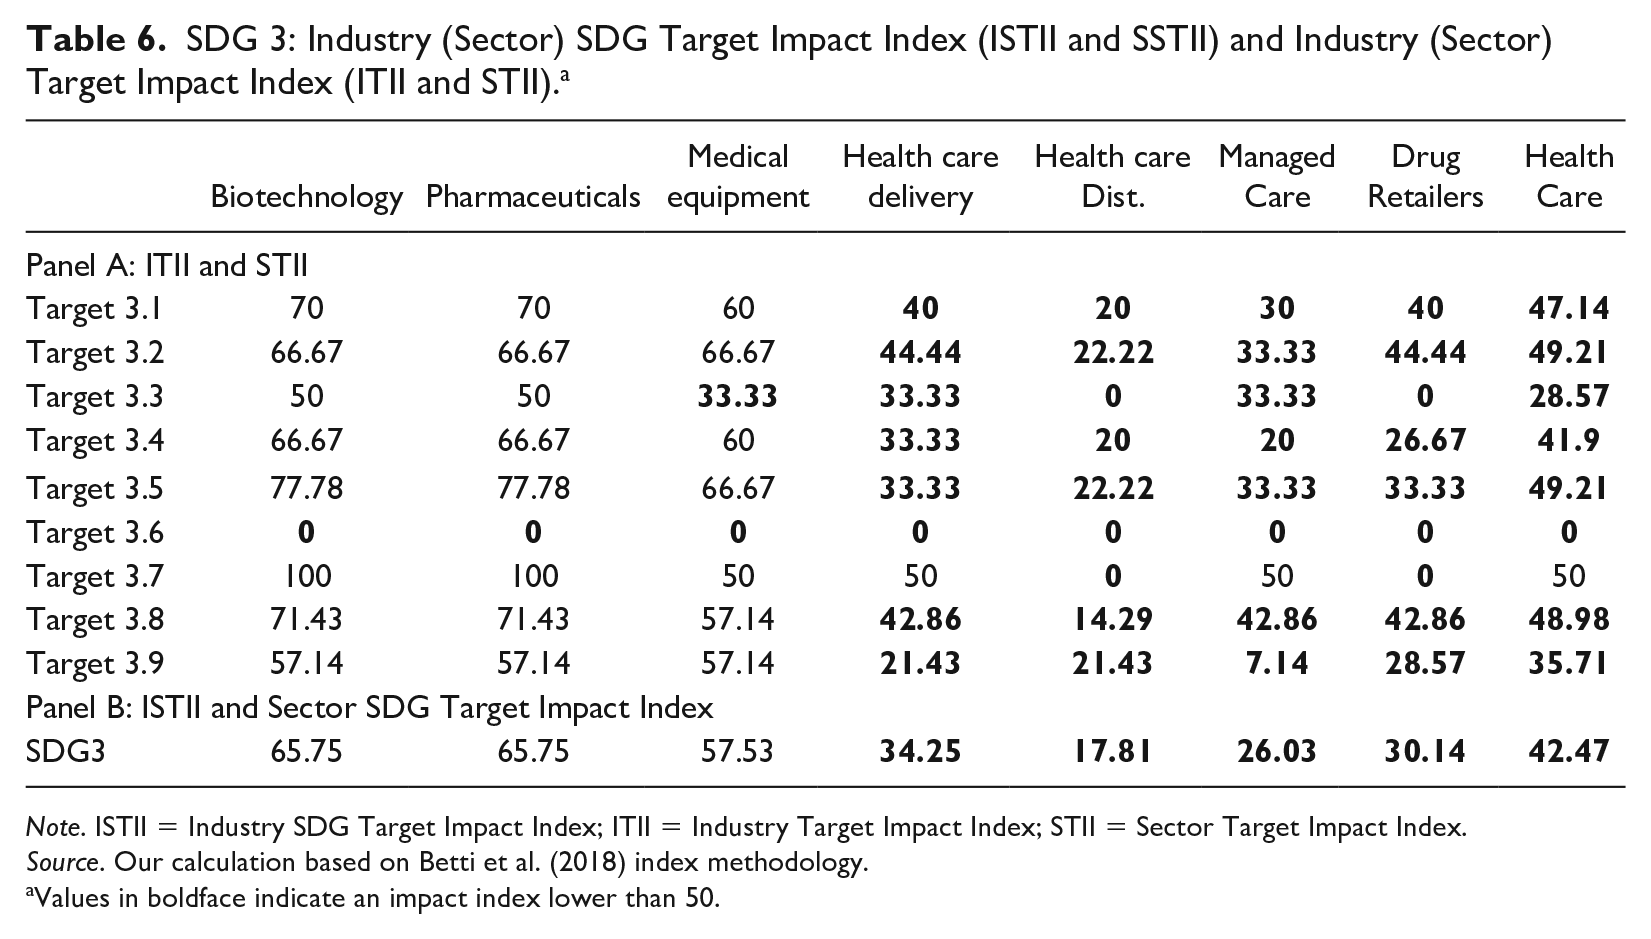
Note. ISTII = Industry SDG Target Impact Index; ITII = Industry Target Impact Index; STII = Sector Target Impact Index.
Source. Our calculation based on Betti et al. (2018) index methodology.
Values in boldface indicate an impact index lower than 50.
For example, taking Target 3.8 (“Achieve universal health coverage, including financial risk protection, access to quality essential health care services and access to safe, effective, quality and affordable essential medicines and vaccines for all”), SASB’s Access and Affordability category is the most directly pertinent to this target for the health care sector; other relevant ones, as shown in Table 2, include customer welfare (related to drug safety and quality of patient health outcomes), product quality & safety, supply chain management (as it relates to compromised or counterfeit drugs), employee health, safety, and well-being (to the extent that employers provide access to essential health care services), and environmental, social impacts on assets and operations (mostly for the health care delivery and managed care industries where climate change impacts influence their operations and the accessibility and quality of care).
If we consider the health care distributors industry, their target impact index for Target 3.8 is only 14.29 according to Table 6. This result depends on two variables, the number of SASB’s issues related to the target and the number of them that are financially material for the industry. In the case of Target 3.8, as stated before, it is affected by 7 SASB issues, among which only 1, product quality and safety, is considered material for the health care distributors industry. Access and affordability is not considered material to that industry according to SASB’s assessment of materiality. 14 Nonetheless, one can make the argument that the industry so far, not being consumer-facing nor being a producer of drugs or medical equipment, had managed to stay away from scrutiny about high health care costs, and the industry would likely attempt to maximize its short-term margins, which in fact would incentivize keeping costs high. However, as pushback against high prices across the health care value chain has intensified in recent months among both policy makers and voters, particularly in the United States, access and affordability could become material even for this industry. It is likely, however, to require concrete action from regulators, focused on this segment of the value chain.
In any case, while performance on access and affordability issues may not have a significant impact on a health care distributors’ bottom line, it certainly influences the achievement of Target 3.8. Table 6 shows that a vast majority of the impact on Target 3.8 for this essential component of drug and medical equipment supply chains comes therefore from the industry’s nonmaterial issues. Or another way to look at it is that for a health care distributor company, among all the ways in which it could affect Target 3.8 (i.e., the 7 SASB GICs related to that target) it is perhaps important to focus its efforts first and foremost on improving product quality and safety to have the most immediate and direct impact on financial value. The issue of product quality and safety is perhaps also the area where the industry has the most direct influence on ESG outcomes related to externalities represented by Target 3.8.
Table 6 shows that just half of the impact on Target 3.8 from the health care sector comes from health care industries’ nonmaterial issues. In fact, the same can be said in general of the entire sector and its impact on SDG 3 overall. Material issues account for only about 42% of the impact on SDG 3 (SDG 3 SSTII of 42.47). 15 Only in the case of biotechnology, pharmaceuticals, and medical equipment industries would focusing on improved performance on material ESG issues account for a majority of the industries’ possible impacts on SDG 3 externalities. This is perhaps again due to a combination of these industries being consumer facing, with fairly large operational impacts from manufacturing, and impacts from the use of their products, both positive and negative.
What does it mean for impact on an SDG or target to be mostly arising from an industry or sector’s nonmaterial issues? If one were to assume that all SASB ESG issues related to the target are of equal importance, and that the company can influence each ESG issue directly to the same extent, then it would mean that even if the sector were to perform very well on its material issues, it would have only a fraction of the impact on the target than it would otherwise have were it to focus on improving on both material and nonmaterial issues. From a public policy perspective then, it can be argued that companies should be provided with incentives to act even on their nonmaterial issues, for the achievement of the goals. Studies (Grewal et al., 2017; Khan et al., 2015) have shown, however, that focusing company investments on material ESG issues is important from the perspective of financial outperformance, and that investing in immaterial ESG issues can dilute the effectiveness of all investments, harming returns.
Health care companies are likely to focus their efforts to improve performance on their material ESG issues, because their incentive is the resulting improved financial performance. We cannot reasonably expect significant ESG improvement if companies view actions in these areas as nonmaterial. This is likely to be the case, especially due to the increasing focus on materiality in corporate ESG reporting and related investor engagement and decision making. This creates a gap between SDG expectations and company actions.
Table 6 indicates that a focus on materiality alone may not translate into progress through health care sector corporate action toward achieving SDG 3, especially some of its more specific targets. It should be noted of course that the assumption that all SASB ESG issues related to the target are of equal importance, and that the company can influence each ESG issue directly to the same extent, may not hold true. As discussed above in relation to the health care distributors industry, perhaps it is the material ESG issues that are of greater importance to achieving a goal or target and that in the case of certain nonmaterial issues the industry may have very limited impact even if it were to excel in improving performance. The latter might be the case, for example, with the SASB GIC of employee health, safety, and well-being for the health care distributors industry, which is not known to have significant problems in this area given the relatively lower risk in the nature of the work. This has not been explored in detail in this article but is perhaps an area for further research.
In any case, if one assumes that at least some nonmaterial issues need to be addressed to achieve a particular SDG or target, this has significant implications for policy makers and affect investors interested in achieving the SDG 3 goal and targets. Table 6 highlights specific industries and activity areas in which the public sector either needs to create incentives for the private sector to act or needs to fill the gaps through its own activities. It also highlights opportunities for impact investors for financing innovative companies and organizations that address those gaps.
For example, health care delivery, health care distributors, managed care providers, and drug retailers lack incentives today to conduct a majority of the activities that advance progress toward SDG 3, whereas for the other three industries, stronger incentives and payback already exist for addressing most of the targets of SDG 3. Going further, for health care distributors, policies might be required (financial incentives or disincentives created) for them to adjust their pricing and supply chain and logistics to make drugs and essential medical equipment more affordable and accessible.
When an industry’s material ESG issues do drive a majority of its potential impact on SDG targets, for instance when incentives are aligned, this does not automatically imply that progress will be made toward the SDG and overlapping targets. Companies must perform well on those issues for their activities to contribute toward achieving the SDG targets and as such, a measure of SDG-related performance is necessary to evaluate this progress.
We use Truvalue Labs’ ESG performance data to compare the potential impact index per industry and target shown in Table 6 against the actual performance of companies on directly related material ESG issues. This comparison helps identify industries, companies, and targets on which engagement from investors and policy makers to improve performance may be needed. The analysis below also assumes that for investors, the ESG issues that matter most in relation to the SDGs are still those that are likely also to be financially material.
As an example, we consider the pharmaceuticals industry and its relevance to Targets 3.3, 3.5, and 3.7 as they are targets covering a variety of evidently critical health issues and as they cover a spectrum of impact from the industry ranging from high to low, enabling drawing out useful insights on the relative impact of the pharmaceuticals industry. A similar analysis could be conducted for any combination of industry and targets. Target 3.3 relates to ending the epidemics of AIDS, tuberculosis, malaria and neglected tropical diseases and combating hepatitis, water-borne diseases and other communicable diseases; Target 3.5 relates to strengthening the prevention and treatment of substance abuse, including narcotic drug abuse and harmful use of alcohol; and Target 3.7 relates to ensuring universal access to sexual and reproductive health care services.
The industry has a high target impact index of 100 for Target 3.7 and a relatively low impact index for Target 3.3 of 50, with Target 3.5 between those two, at 77.8, as shown in Table 6. The higher the impact index, the stronger the potential of the pharmaceuticals industry to impact the target through performance on its material ESG issues versus its nonmaterial issues. How does the industry fare in meeting this potential?
Table 7 shows the material ESG issues for the pharmaceuticals industry that map to Targets 3.3, 3.5, and 3.7, using the methodology discussed earlier in this article. For comparison, we also include the target impact index for these targets for the pharmaceuticals industry.
Material ESG Issues for Targets 3.3, 3.5, and 3.7 for the Pharmaceuticals Industry.

Note. ESG = environmental, social and governance; SDG = Sustainable Development Goals; SASB = Sustainability Accounting Standard Board; GIC = general issue categories.
Table 7 shows that of all the activities (ESG issues) through which the pharmaceuticals industry could theoretically influence Target 3.7, all of them are financially material to the industry. Whereas for Target 3.3, half of the possible activities (ESG issues) that influence the target are material to financial performance, while the remaining half are nonmaterial. It should be clarified that this does not mean that the pharmaceuticals industry overall has a higher potential impact on Target 3.7 compared with Target 3.3, it just means that material issues play a more significant role than nonmaterial ones in addressing Target 3.7 than in addressing Target 3.3.
We considered a weighted average ESG materiality performance score for companies in the industry taking into account the above material ESG issues (categories) mapped to each target (and not all of the industry’s material ESG issues). This score is based on the issue category-level Insight scores as of December 31, 2017 provided by Truvalue Labs, weighted by the total historical volume per category (for 10 years of history) to calculate the target-specific material ESG performance scores for the pharmaceuticals industry. As stated above, the Insight score is indicative of longer term performance of companies in the industry on the ESG issues. This exercise could also be conducted for historical data as well as ongoing performance data to evaluate how performance has changed and is changing over time, and whether progress is being made or not.
As per TruValue Labs’ methodology, a value of the score greater than 50 indicates positive ESG performance. From Table 8, we can observe that the pharmaceuticals industry on average displays mild to moderate positive performance related to all three targets, with mean scores higher than 50. However, the table also shows that while the pharmaceuticals industry has a larger potential impact on Target 3.5 than on Target 3.3 through its material issues (ITII of 77.8 vs. 50, respectively), its material ESG performance on Target 3.5 is about 12 score points lower than on Target 3.3 on average (mean of 61.8 vs. 74.3, respectively). The same is true for top performing companies on each target. On the other hand, the industry’s performance in relation to Target 3.7 (access to sexual and reproductive health care services) is stronger than on the other two targets, matching the high potential for the industry’s material issues to affect that target (ITII of 100).
Comparison of Weighted ESG Materiality Performance Scores (for the Subset of Material ESG Issues Overlapping With Each Target) With the Target Impact Index for the Pharmaceuticals Industry.
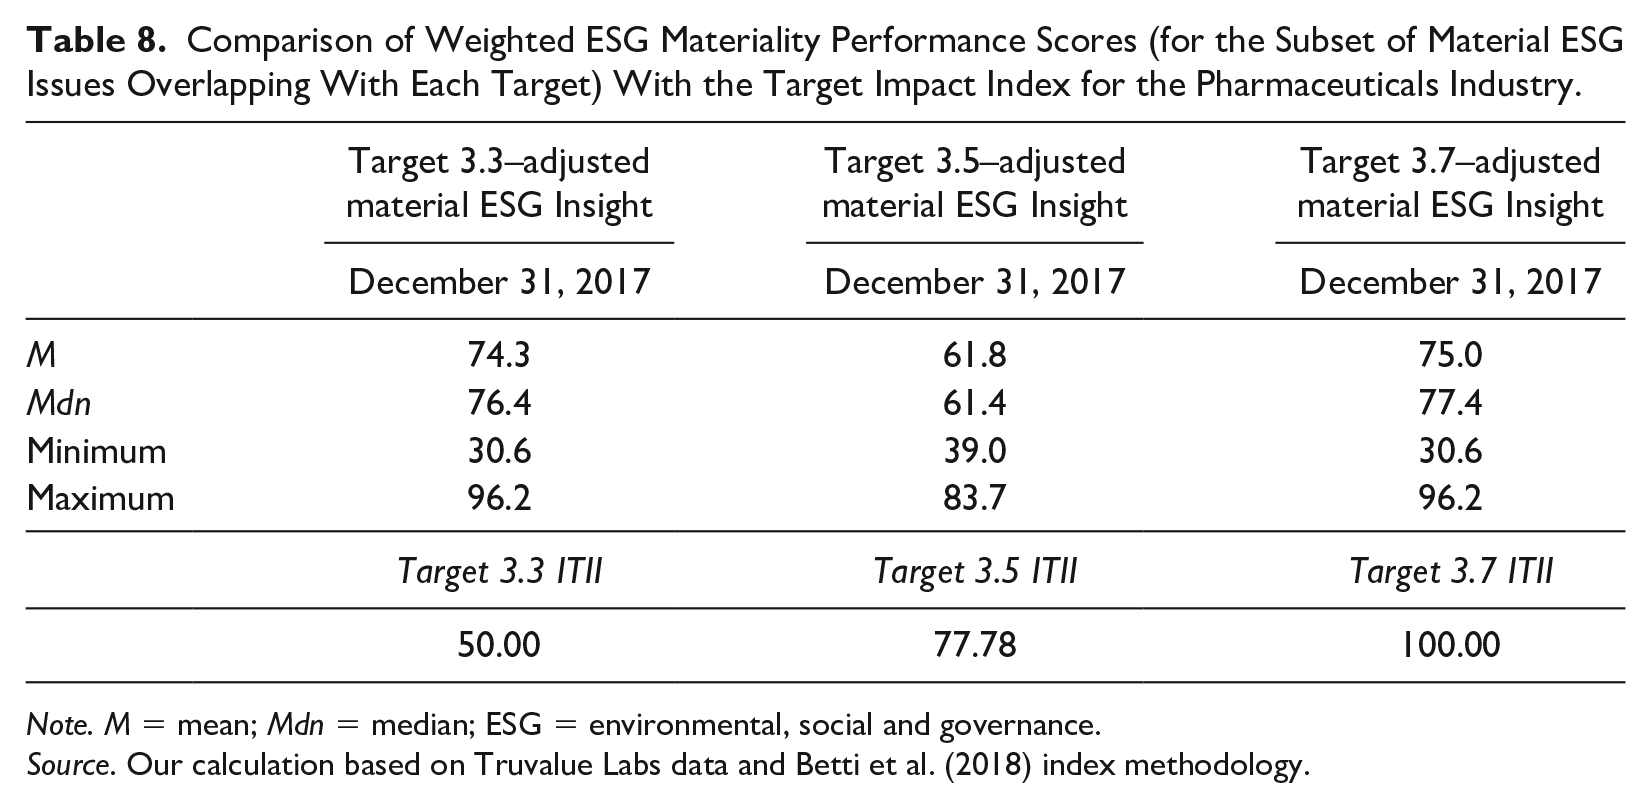
Note. M = mean; Mdn = median; ESG = environmental, social and governance.
Source. Our calculation based on Truvalue Labs data and Betti et al. (2018) index methodology.
Therefore, among these three targets for the pharmaceuticals industry, investors (or policy makers) that are interested in the SDGs would want to pay particular attention to Target 3.5 (“preventing and treating substance abuse”) relative to the others (assuming all targets are of equal importance), for their engagement with companies and improving the industry’s performance on it. The pharmaceuticals industry’s financially material ESG issues play a relatively significant role in affecting Target 3.5 more so than their role in affecting Target 3.3 (where nonmaterial issues play an equally important role). But despite this, its actual performance on the material issues influencing Target 3.5 is lower than on the material issues influencing Target 3.3, as the scores above suggest. Or put another way, pharmaceuticals companies are more on track with progress on Target 3.3 through their material issues than they are with Target 3.5, and as such, investor engagement on material issues related to Target 3.5 is important. This is evident from the multimillion dollar legal payouts recently that companies in the industry have faced in relation to the opioid crisis in the United States for negative performance on material ESG issues such as fair marketing and advertising. 16
For companies scoring lower than 50 (such as the company with the minimum ESG materiality performance score for Target 3.5 of 39), the implication is that their activities and products or services are creating negative externalities in relation to that target, since scores lower than 50 indicate negative performance on Truvalue Labs’ 0 to 100 scale. In other words, those companies are actively hindering progress toward that target.
A similar analysis could be conducted for every industry (or company) and target to identify areas in which to engage companies to improve their performance on issues that should already matter to their financial performance while contributing directly and significantly to the SDGs. At the same time, this analysis could also identify opportunities for investment in those companies and industries already performing well on material ESG issues that can have a large impact on particular targets or SDGs.
From an investor perspective, the following matrix (Figure 1) can represent a useful instrument to conceptualize asset allocation and portfolio analysis if not only the ESG materiality performance but also the scope of SDG impact of the portfolio is taken into account.
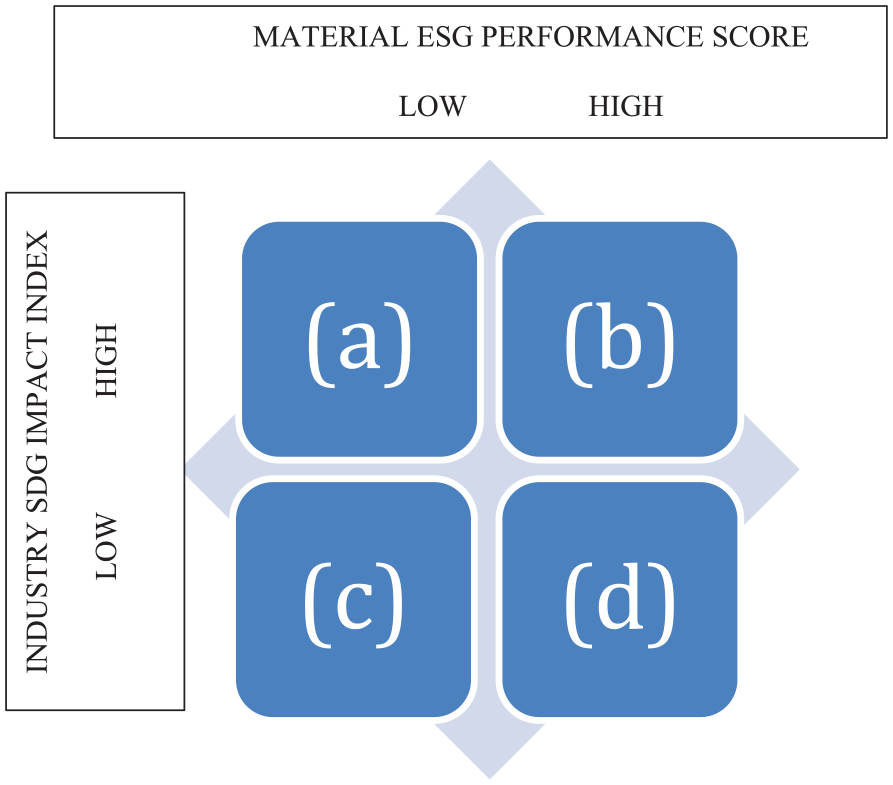
SDG-ESG materiality asset allocation matrix.
In Figure 1, a “low” material ESG performance score can be considered as representing negative or poor performance (scores lower than 50 in Truvalue Labs’ data set) and vice versa for a “high” material ESG performance score. The industry SDG impact index on the y-axis can represent the scope of impact across all SDGs, for a particular SDG or a particular target. “Low” impact index scores (lower than 50) indicate low scope of impact from material ESG issues, and vice versa for “high” scores.
Each region (a to d) in the matrix can be interpreted to represent investor asset allocation or government policy decisions in relation to the SDGs:
High-Low: Region (a) is of particular concern for investors—this represents a high-industry scope of impact from material ESG issues on a particular SDG or target but where companies are performing poorly on material ESG issues related to that SDG or target. This would be an area of engagement or elimination of companies or industries from an investor portfolio.
High-High: Companies falling in region (b) represent potential investment opportunities to drive SDG impacts while ensuring strong financial returns.
Low-Low: A low material ESG performance score when the scope of SDG impact from material ESG issues (Industry SDG Impact Index) is low indicates a lack of incentives as well as action on that SDG or target. While this may not be an area of concern for investors interested in the SDGs, it may indicate policy gaps in achieving that particular SDG (or its target).
Low-High: For a low-SDG impact index, a high material ESG performance score may not translate into significant progress toward the SDG or its target, again an area for policy concern.
By bringing together an ESG materiality standard and the SDG goals and targets, the matrix in Figure 1 provides one way to reduce confusion among companies and investors trying to support the SDGs while ensuring strong performance on ESG issues that matter to financial returns.
Conclusion: Beyond ESG in the Mist
This case study of the health care sector and SDG 3 and its targets, when mapped to material and nonmaterial ESG issues using SASB’s framework and populated with publicly available, therefore transparent, data and third-party data sources, provides a contrasting model to many if not most ESG theorizations, metrics, and measures currently available. Similarly, it presents a contrasting approach to those few studies of corporate behavior mapped to SDGs. It provides the ability to measure and evaluate potential SDG impact against firms’ and sectors’ ESG performance. In doing so, this article highlights where private sector firms can and have contributed to SDG impact, and where that is either not occurring or perhaps not possible, points to the need for public sector activities. Our methodology does not attempt to assess the absolute magnitude of impact of an industry on the targets of an SDG. This is a function of a number of variables including quantitative impact metrics (e.g., volume of carbon emissions and employee turnover) which, in turn, are a function of industry and company size. Rather, our methodology is designed to evaluate the extent to which issues that are financially material to an industry are relevant to the targets of the SDGs and assess whether companies are improving performance (or performing better than peers) on those issues. The virtue of this approach is that it broadens the view of companies regarding which SDGs and targets they can contribute to while improving their financial performance given the relationship between material ESG performance and financial performance.
Moreover, as our data are based on Truvalue Labs’ 10-year time series (updated daily going forward) such an approach enables tracking of progress, backsliding, or is constant over time. Finally, we suggest that two major problems of the profusion of ESG standards and metrics that to date are unfortunately replicated in SDG studies, are addressed: standardization and data transparency. To our knowledge, such an exercise has not been attempted previously. Tracking companies’ SDG impact with their SASB-based ESG performance in a meaningful and transparent manner enables mitigation of greenwashing and marketing hype in relation to the SDGs and ESG, while additionally facilitating the contextualization of companies’ ESG performance not only in terms of their firm-specific outputs but of their environmental and social (societal) impacts as well. We hope that this exploratory example will contribute to the increased linking of ESG standards to SDGs with the incorporation of transparent data and data sources to better understand the resulting performance and progress toward SDG goals, and the ability to track them over time. In this regard, such exercises contribute to solving the ESG standardization problem on a global level.
Yet we recognize that this is a limited case in two regards and future research needs to address both elements. The first aspect is to use similar but more developed approaches to the 15 other specific SDGs. We are aware that the approach we adopted in mapping SASB’s sustainability issues to the SDGs and targets does not take into account the nature and the dynamics of the connections between them, that indeed need to be better understood (Van Tulder, 2018). A second limitation is a “dichotomous variable approach,” both in the definition of material sustainability issues and in their impact on SDG targets. As for SASB’s standards, when an ESG issue is material for an industry, it can have a different degree of financial relevance in terms of how many value drivers it affects and the “strength” with which they are affected. This implies that the higher the financial relevance of the material sustainability issue, the higher is the incentive for a company to perform well on that issue. As for the impact of a material ESG issue, we treated it as equal if it is relevant to a target. Just how important a material issue is to a target could vary according to its nature. For example, Access and Affordability could be more important to achieving the success of Target 3.8 than other SASB issues impacting the target.
It must also be noted that in our analysis on the health care sector we do not distinguish the targets between internally and externally actionable by companies, neither between those that are aimed at “doing good” from those aimed at “avoiding harm,” as in Van Zanten and Van Tulder (2018), assuming that if a material sustainability issue is linked to a target, there is room for the private sector to contribute on the topic described by the target either by reducing negative externalities or providing a positive impact. While SASB standards address both positive and negative performance on ESG issues, they are not prescriptive about expecting companies to create new products or services to address sustainability (and therefore SDG) challenges, neither do they “reward” nor “penalize” companies for deriving revenues from certain industries. In that sense, the use of SASB standards may not completely capture upside opportunities from new products to address specific SDGs, which may be desirable from a public policy or “impact investing” perspective.
The second aspect is to examine correlations (and if possible, identify causal links and directions) between firms’ SDG impacts, ESG performance, and a variety of financial and nonfinancial (operational) firm-specific metrics. In pursuing these and perhaps other SDG and firm interactions, transparent and consistent data are of paramount importance. SDGs are a public good (as is the SASB standard): as such, their evaluations must also be based on publicly accessible granular sustainability data, generally parallel to publicly available financial data. Otherwise, we will still be confronting the overarching problem of ESG in the mist, not being able to clearly see and define all the ESG elements or relevant data.
Footnotes
Declaration of Conflicting Interests
The author(s) declared no potential conflicts of interest with respect to the research, authorship, and/or publication of this article.
Funding
The author(s) received no financial support for the research, authorship, and/or publication of this article.