




Abstract
Learning disabilities (LD) commonly occur in children who have ADHD. In his review of the presence of LDs in children with ADHD, Barkley (2006a) cited comorbid occurrence rates of 8% to 60% depending on the definition of LD as well as achievement areas that are measured. A recent large study investigated outpatient children with ADHD for LDs not only in reading and math but also in written expression. The researchers found that LDs (defined by predicted achievement) occurred in 71% of the children with ADHD (combined type), ranging from 26% for math, to 33% for reading, to 63% for written expression (Mayes & Calhoun, 2006).
Learning, attention, working memory, processing speed, and graphomotor weaknesses are likely to coexist and are found in the majority of children who have ADHD (Mayes & Calhoun, 2007b). The frequent comorbidity of ADHD and LD can be partly explained by the overlapping of some neuropsychological deficits that occur in both disorders, especially executive function (EF) skills like attention, working memory, and processing speed (Mayes, Calhoun, & Crowell, 1998). Deficits in EF are key components in current theories that attempt to explain ADHD (Barkley, 1997; Doyle et al., 2005; Martinussen, Hayden, Hogg-Johnson, & Tannock, 2005). Similarly, the importance of executive deficits in children with LD is becoming more appreciated (Semrud-Clikeman, 2005). Furthermore, children with both ADHD and LD may be more neuropsychologically impaired than children with either disorder separately (Willcutt et al., 2001). For example, children with both ADHD and LD have greater attention and learning problems than children with either ADHD or LD alone (Mayes, Calhoun, & Crowell, 1998).
As is also well-known, children with ADHD commonly have comorbid psychiatric disorders, averaging from 25% to 55% in clinic-referred ADHD children (Barkley, 2006b). More specifically, the average ranges for the comorbid disorders that occur most commonly in clinic-referred ADHD children are: anxiety disorders (25%–30%), major depressive disorder (25%–30%), oppositional-defiant disorder (ODD; 45%–55%), and conduct disorder (35%–45%; Barkley, 2006b). In contrast, the prevalence of psychiatric disorders in children with LDs is not as clear. This absence of knowledge has primarily occurred because studies of psychiatric disorders, particularly ADHD, have investigated for co-occurring LD, but studies of LD rarely use methodology to determine the presence of psychiatric disorders. However, Willcutt and Pennington (2000) have shown that while reading disability can be associated with a wide range of psychopathology, the most common association is with ADHD.
Thus, although we know that ADHD and LD commonly occur together and that each disorder separately is associated with a range of comorbid psychiatric disorders (especially ADHD), we know little about whether the co-occurrence of LD in a child with ADHD affects the presence or type of other psychiatric disorders, that is, the clinical importance of LD in children with ADHD beyond academic underachievement. Are children with the life burden of both ADHD and LD more likely to have additional psychopathology, as the severity of ADHD symptoms and/or cognitive deficits in childhood appears to predict at least poorer educational and employment outcome (Barkley, 2006c)? Furthermore, how are the neuropsychological deficits of children with both ADHD and LD related to their psychopathology? Longitudinal work has suggested more independence of academic and psychopathological trajectories than may have originally been thought (Rapport, Scanlan, & Denney, 1999).
The goal of this study therefore is to investigate differences in parent and teacher ratings of psychopathology between ADHD children with and without LDs. We anticipated that because of the comorbid state of ADHD plus LD, children with that combination would show an increase in psychopathology in the home and/or the school environment compared to children with only ADHD. We further wished to show any emergent relationships with psychopathology that were related to inherent neuropsychological characteristics of LDs, such as achievement or cognitive skills, especially working memory and processing.
Method
Participants and Procedure
The sample comprises 595 children with ADHD (6–16 years of age) with normal or above normal intelligence (IQs 80–144). For a period of more than 15 years they consecutively presented to an outpatient clinic of a university department of psychiatry for psychoeducational evaluation primarily because of attention and/or learning problems. Many of the children were participants in an earlier study of the frequency of LDs in psychiatric outpatient children (Mayes & Calhoun, 2006). Data were gathered retrospectively from their charts and did not require informed consent according to the university Institutional Review Board.
A total of 73% of the children (n = 437) were found to have a LD in at least one area of achievement: reading (39.1%), math (30.3%), and written expression (62.4%). Because the definition of LD is controversial, the Diagnostic and Statistical Manual of Mental Disorders, 4th ed. (DSM-IV; American Psychiatric Association, 1994, p. 50) definition of learning disorder was used that requires achievement to be “substantially below” what would be expected for the chronological age, measured IQ, or age-appropriate education of a child or adolescent. We operationalized this general definition of LD as follows. LD was defined as a test score below age level on the Wechsler Individual Achievement Test (WIAT or WIAT-II; Wechsler, 1992, 2001) and significantly lower than predicted based on the child’s Full Scale IQ (FSIQ) of the Wechsler Intelligence Scale for Children (WISC-III or WISC-IV IQ; Wechsler, 1991, 1997) using the tables in the WIAT and WIAT-II manuals. This definition is also consistent with the current Individuals With Disabilities Education Act (2006).
Children were evaluated in the diagnostic clinic with the following psychological test battery: (a) teacher and parent questionnaires and rating scales, (b) a computerized continuous performance test assessing impulsivity, inattention, and distractibility, (c) separate parent and child interviews, (d) observations of the child during testing, and (e) a review of the child’s developmental history, school transcripts from kindergarten to the present, and past evaluations. In addition, children were also administered IQ, achievement, and visual-motor tests as part of the general clinic assessment. Children on medication to treat ADHD (32.4% of the sample) did not take their medication on the day of psychological testing.
DSM-IV psychiatric diagnoses were then determined in the following manner and were agreed upon by two clinicians. All the above information was used by a clinic PhD licensed psychologist to confirm diagnoses already made by community clinicians. For previously undiagnosed children, the two clinic psychologists reviewed the complete information and agreed upon the DSM-IV diagnoses.
Pediatric Behavior Scale (PBS; Lindgren & Koeppl, 1987)
Mothers and teachers rated psychopathology in children on a 4-point scale from 0 = almost never or not at all a problem to 3 = very often or very much a problem on the 165-item PBS. The PBS yields scores on several psychopathology subscales, including the following 12 used in our study: (1) oppositional behavior, (2) aggression, (3) explosiveness, (4) attention deficit, (5) impulsivity, (6) hyperactivity, (7) anxiety, (8) depression, (9) low self-esteem, (10) variability (e.g., moodiness), (11) social isolation (e.g., hard time making friends, rejection by others, social withdrawal), and (12) inappropriate social behavior (e.g., acts too young for his or her age, poor social judgment). The total score on the ADHD scale (i.e., an ADHD Composite consisting of the attention deficit, impulsivity, and hyperactivity subscales) was used as a measure of ADHD severity in our study. T-scores for boys and girls are available for parent ratings based on the PBS normative sample (Lindgren & Koeppl, 1987). Internal consistency for the PBS subscale scores is high, with a median coefficient of .91 (Lindgren & Koeppl, 1987). Validity studies show that the PBS significantly differentiates between diagnostic groups, and the PBS has been used to diagnose and measure behavior, attention, and mood problems in several published studies (Max et al., 1998; Mayes & Calhoun, 2006, 2007b; Nichols et al., 2000; Wolraich et al., 1994).
IQ
All children were administered the WISC-III or WISC-IV, whichever test was current at the time the child was tested. In addition to FSIQ, the following index scores were investigated: verbal comprehension, perceptual reasoning, freedom from distractibility/working memory, and processing speed.
Academic achievement
The WIAT or WIAT II was used, whichever test was current at the time the child was tested. Specifically, the word reading, reading comprehension, numerical operations, and written expression subtests were administered. An achievement composite standard score was calculated by averaging the scores on these four subtests.
Neuropsychological tests
As part of the clinic evaluation, neuropsychological instruments were selected to measure key neuropsychological abilities: attention, response inhibition, working memory, processing speed, and graphomotor skills. These tests were the Gordon Diagnostic System (GDS, a continuous performance test; Gordon, 1983); the WISC-III/WISC-IV freedom from distractibility/working memory and processing speed indices; and the developmental test of visual-motor integration (VMI; Beery, 1997), which requires the child to copy geometric forms with a pencil. These tests have demonstrated their value in significantly differentiating neurological impairment among children with a variety of psychiatric disorders, especially distinguishing ADHD from non-ADHD disorders and controls (Mayes & Calhoun, 2007b). In our study, all reported test scores are standard scores with a mean of 100 and standard deviation of 15, and higher scores indicate better performance. An executive function composite score was created by averaging the scores on three neuropsychological measures that were measuring different skills: working memory, processing speed, and the GDS total score.
Data Analyses
Independent and dependent t tests, MANCOVA, ANCOVA, and Cohen’s d effect size were calculated to determine differences between groups. The significance of differences in variable frequencies between groups was calculated using chi-square. The sign test was applied to determine the significance of score patterns.
Pearson correlation coefficients and the effect size statistic r2 indicated the degree of relationship between variables and the proportion of explained variance. Stepwise linear regression analysis was used to determine the most powerful predictors of academic achievement using IQ, neuropsychological test scores, and parent and teacher ADHD severity ratings as predictor variables.
ADHD children with LD were found to be significantly younger than ADHD children without LD, so age was covaried in the LD analyses. A Bonferroni correction was used for all analyses when multiple comparisons were made. A p value of < .05 was used for statistical significance.
Data were complete for all study variables, except that a few children were missing scores on the teacher PBS (final n = 538), reading comprehension (n = 563), written expression (n = 521), GDS (n = 564), and VMI (n = 558).
Results
General Characteristics of the Total Sample of Children With ADHD
First, a summary of general characteristics for this total sample of outpatient youth with ADHD (n = 595) is provided. Demographically, their mean age was 9.4 (SD = 2.4 years). They were predominantly male (72.1%) and White (93.9%). Socioeconomically, 41.5% had a parent in a professional or managerial occupation. Cognitively, their mean WISC FSIQ was 105.8 (SD = 13.1). Their mean executive function composite score was 88.0 (SD = 11.3). Academically, their mean WIAT achievement composite standard score was 96.6 (SD = 11.8).
Their ADHD subtypes were 70.3% combined and 29.7% inattentive. Comorbidity for ODD, depressive disorder, and/or anxiety disorder occurred in 38.4%. The severity of their ADHD symptoms was indicated by mean T-scores on the parent PBS ADHD subscales: attention deficit 77.2 (SD = 14.1), impulsivity 70.9 (SD = 17.6), and hyperactivity 68.4 (SD = 17.5). A T-score of 70 or greater is at the upper 2 percentile of deviance or 2 standard deviations or more above the normal mean. The mean T-scores for the non-ADHD subscales ranged from 58.1 (SD = 13.5) for anxiety to 70.3 (SD = 20.6) for variability (moodiness). The majority (67.6%) were not being treated with medication for ADHD at the time of their evaluation.
For the total sample of children with ADHD, mean achievement standard scores (word reading = 97.0, reading comprehension = 99.1, numerical operations = 97.0, and written expression = 88.7) and neuropsychological scores (working memory = 93.7, processing speed = 97.6, GDS = 72.3, and VMI = 86.7) were all lower than the normal mean of 100. Furthermore, the 12 parent psychopathology T-scores (58.1–77.2) were all higher than the normal mean of 50. This pattern of lower than normal achievement and neuropsychological scores and higher than normal psychopathology scores is significant (sign test p < .0001).
LD Versus No LD Groups: Demographics and ADHD Characteristics
The ADHD children with LD did not differ significantly from the ADHD children without LD in gender, race, or parent occupation, χ2 = 1.8, 2.5, and 0.3, p > .18. The only significant demographic difference was in age. Children with LD were significantly younger (M = 9.2 years, SD = 2.4 years) than children without LD (M = 10.2 years, SD = 2.4 years), t = 4.5, p < .0001 (see Table 1).
LD (n = 437) Versus No LD (n = 158): Demographics and ADHD Characteristics

LD = learning disabilities. ODD = oppositional-defiant disorder. PBS = Pediatric Behavior Scale.
p < .01. **p < .0001.
Both the LD and No LD groups showed predominantly the combined type of ADHD, and comorbidity of non-ADHD disorders occurred in close to 40% for both groups. Majorities of the two groups had never been on medication for ADHD. No significant differences between the two groups were found for these ADHD characteristics, χ2 = 1.7–3.9, p > .05.
The LD group scored significantly higher than the No LD group on the composite teacher ADHD severity score, t = 2.7, p = .008. In contrast, parent PBS mean T-scores for the ADHD composite (75.6 and 76.8) did not differ significantly between the two groups, t = 1.1, p = .26.
LD Versus No LD Groups: Intelligence, Neuropsychological, and Achievement Scores
Table 2 shows that the LD and No LD groups of ADHD children did not differ significantly on FSIQ, t = 0.3, p = .76, for which both groups had mean scores of 106 (105.8 and 105.9, respectively). Although they did not significantly differ on the verbal comprehension and perceptual reasoning index scores (t = 0.2, p = .82, and t = 1.5, p = .12, respectively), the LD group was significantly lower than the No LD group on the two indices of executive functioning: working memory, t = 2.9, p = .004, d = 0.3, and processing speed, t = 3.2, p = .002, d = 0.3.
LD (n = 437) Versus No LD (n = 158): IQ, Neuropsychological, and Achievement Scores
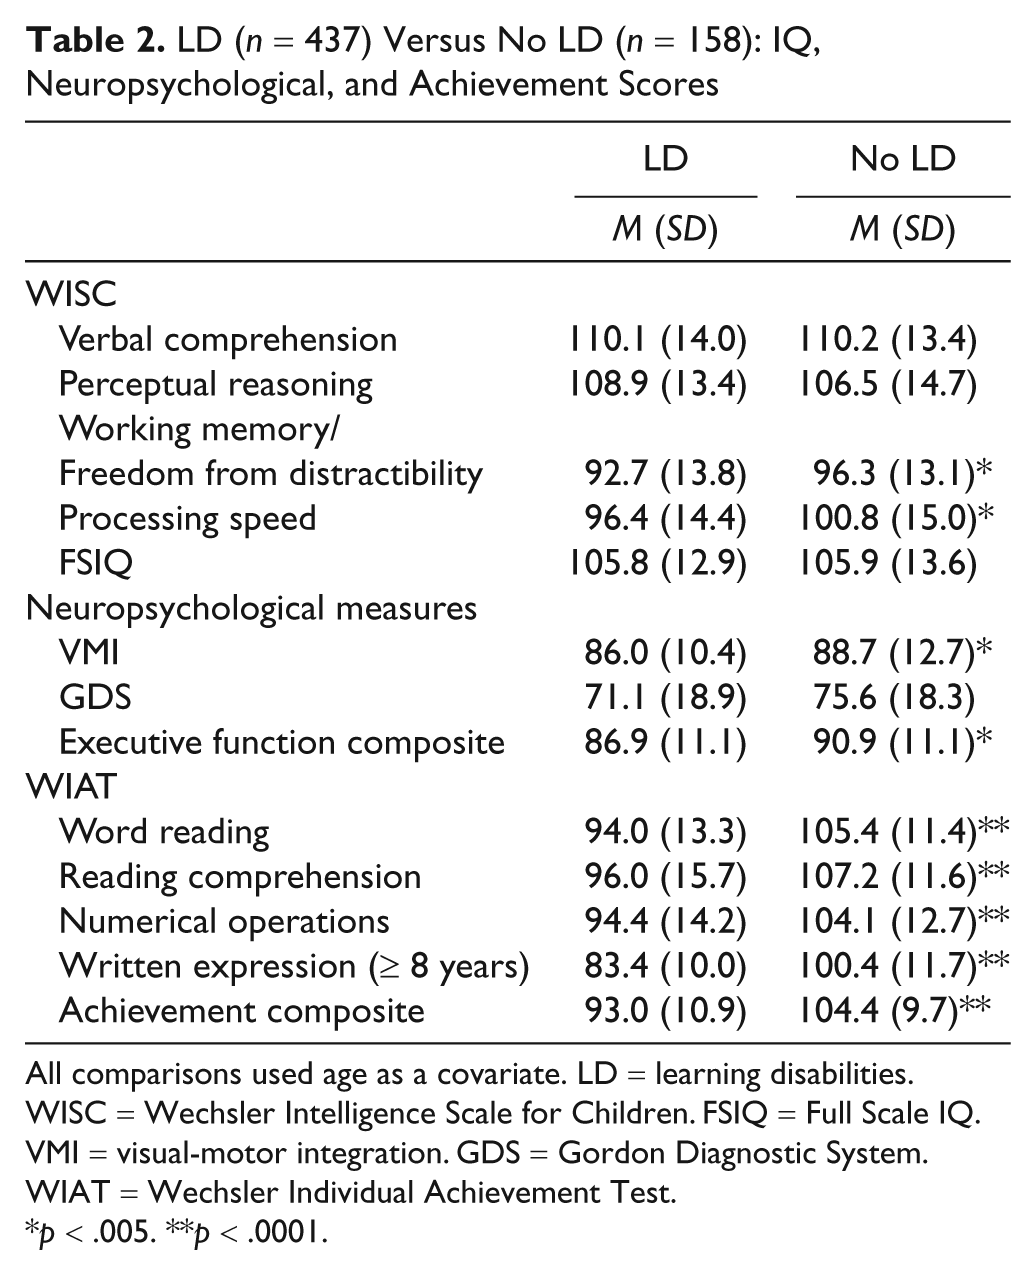
All comparisons used age as a covariate. LD = learning disabilities. WISC = Wechsler Intelligence Scale for Children. FSIQ = Full Scale IQ. VMI = visual-motor integration. GDS = Gordon Diagnostic System. WIAT = Wechsler Individual Achievement Test.
p < .005. **p < .0001.
No significant difference was found between the groups on the GDS, t = 1.8, p = .08, but the LD group was significantly lower on the VMI, t = 3.0, p = .002, d = 0.3. Mean scores for the executive function composite also showed that the LD group was significantly lower than the No LD group, t = 3.4, p = .001, d = 0.3.
As expected, the LD group scored significantly lower than the No LD group in all WIAT achievement areas. Compared to children without LD, children with LD had significantly lower scores, p < .05, on word reading, t = 9.3, d = 1.0, reading comprehension, t = 7.5, d = 0.8, numerical operations, t = 7.6, d = 0.7, and written expression, t = 16.7, d = 1.6.
LD Versus No LD Groups: Parent and Teacher PBS Psychopathology Ratings
The LD and No LD groups were compared for parent and teacher scores on 12 PBS psychopathology subscales, dividing the total raw score for a subscale by the number of items in that subscale to allow comparisons between both raters as well as among all subscales (see Table 3). First, interrater comparisons were conducted using the total sample. Correlations between mother and teacher scores on the 12 subscales were significant, r = .18 to .47, p < .0001, explained variance 3%–22%, but mothers rated children significantly higher than did teachers on all subscales, t = 3.5–15.4, p < .05, d = 0.1–0.7.
LD (n = 437) Versus no LD (n = 158): Parent and Teacher PBS Raw Scores
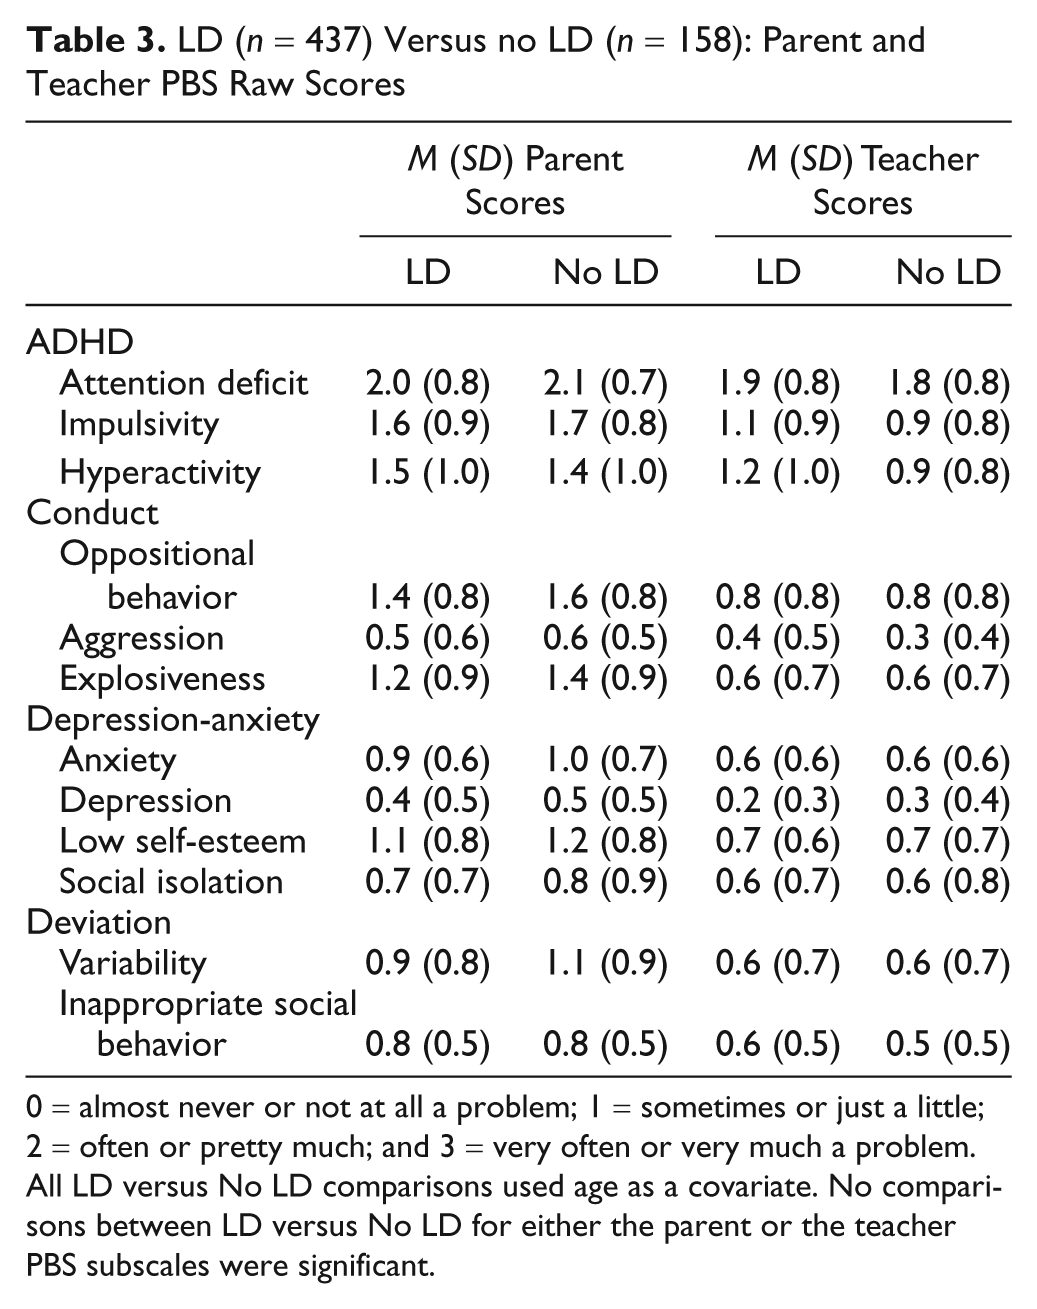
0 = almost never or not at all a problem; 1 = sometimes or just a little; 2 = often or pretty much; and 3 = very often or very much a problem. All LD versus No LD comparisons used age as a covariate. No comparisons between LD versus No LD for either the parent or the teacher PBS subscales were significant.
Next, intrarater comparisons were examined for LD versus No LD differences. No significant differences were found between the groups on any subscale for either parents or teachers (F = 1.2, p = .27, d < 0.1 and F = 1.3, p = .19, d < 0.3).
Mean T-scores were also available and examined for the parent PBS. In the LD group the range was from 57.5 (SD = 13.1) for anxiety to 78.6 (SD = 14.4) for attention deficit. The impulsivity mean T-score was also greater than 70 (M = 70.4, SD = 18.2). The findings were similar for the No LD group. The range was from 59.8 (SD = 14.3) for anxiety to 78.8 (SD = 13.3) for attention deficit, with impulsivity also greater than 70 (M = 72.3, SD = 15.8).
Relationships Between Cognitive/Achievement and Psychopathology Scores
The preceding analyses have investigated the relationship between LD status and several variables. A final step was to further examine the relationships between the cognitive/achievement and psychopathology scores in the total sample. First, as shown in Table 4, the cognitive/achievement test scores (IQ, EF composite, VMI, and achievement composite) were all significantly and positively correlated with each other (median r = .52, explained variance = 27.0%).
Correlations Between Cognitive/Achievement Scores (FSIQ, EF Composite, VMI, and Achievement Composite)
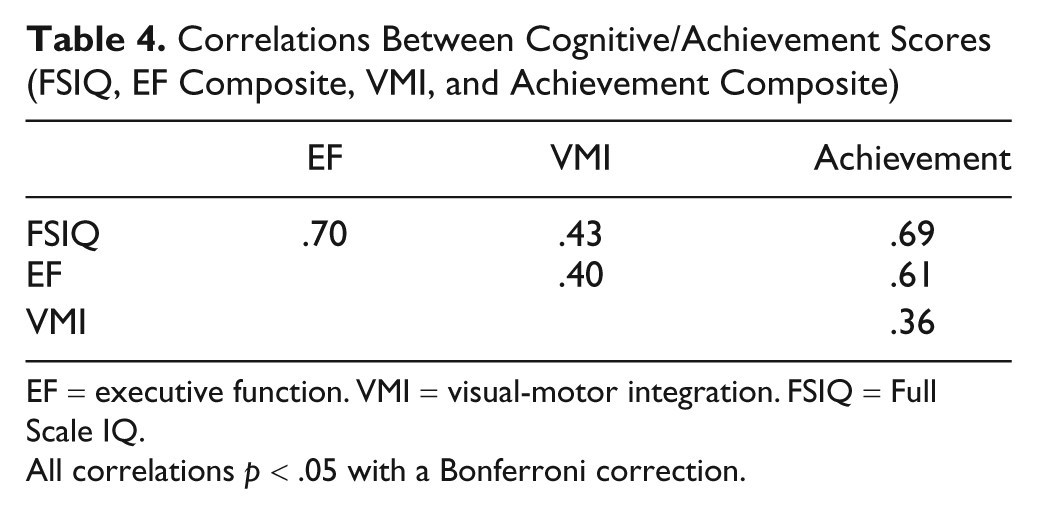
EF = executive function. VMI = visual-motor integration. FSIQ = Full Scale IQ.
All correlations p < .05 with a Bonferroni correction.
In contrast, most correlations between the cognitive/achievement scores and the parent and teacher PBS psychopathology scores (see Table 5) were not significant at .05 (median r = .12, explained variance = 1.4%). Some significant but weak correlations (all negative and <−.23) were found between the cognitive/achievement scores and the teacher PBS ratings, in particular between EF and all teacher general domains.
Correlations Between Cognitive/Achievement Scores and Parent and Teacher PBS Psychopathology Scores
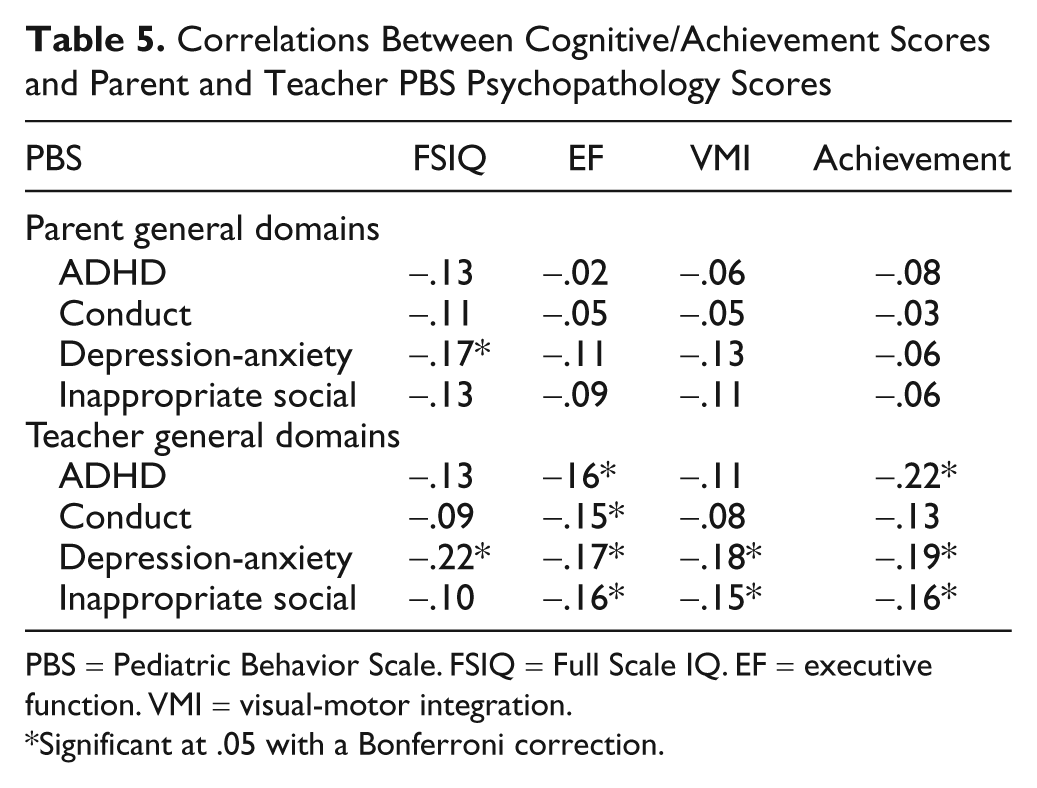
PBS = Pediatric Behavior Scale. FSIQ = Full Scale IQ. EF = executive function. VMI = visual-motor integration.
Significant at .05 with a Bonferroni correction.
Finally, Table 6 shows that almost all of the parent and teacher PBS psychopathology scores were significantly correlated with each other (median r = .33, explained variance = 10.9%). Correlations were stronger within the same rater than between different raters (because of common source variance).
Correlations Between Parent and Teacher PBS General Domain Scores
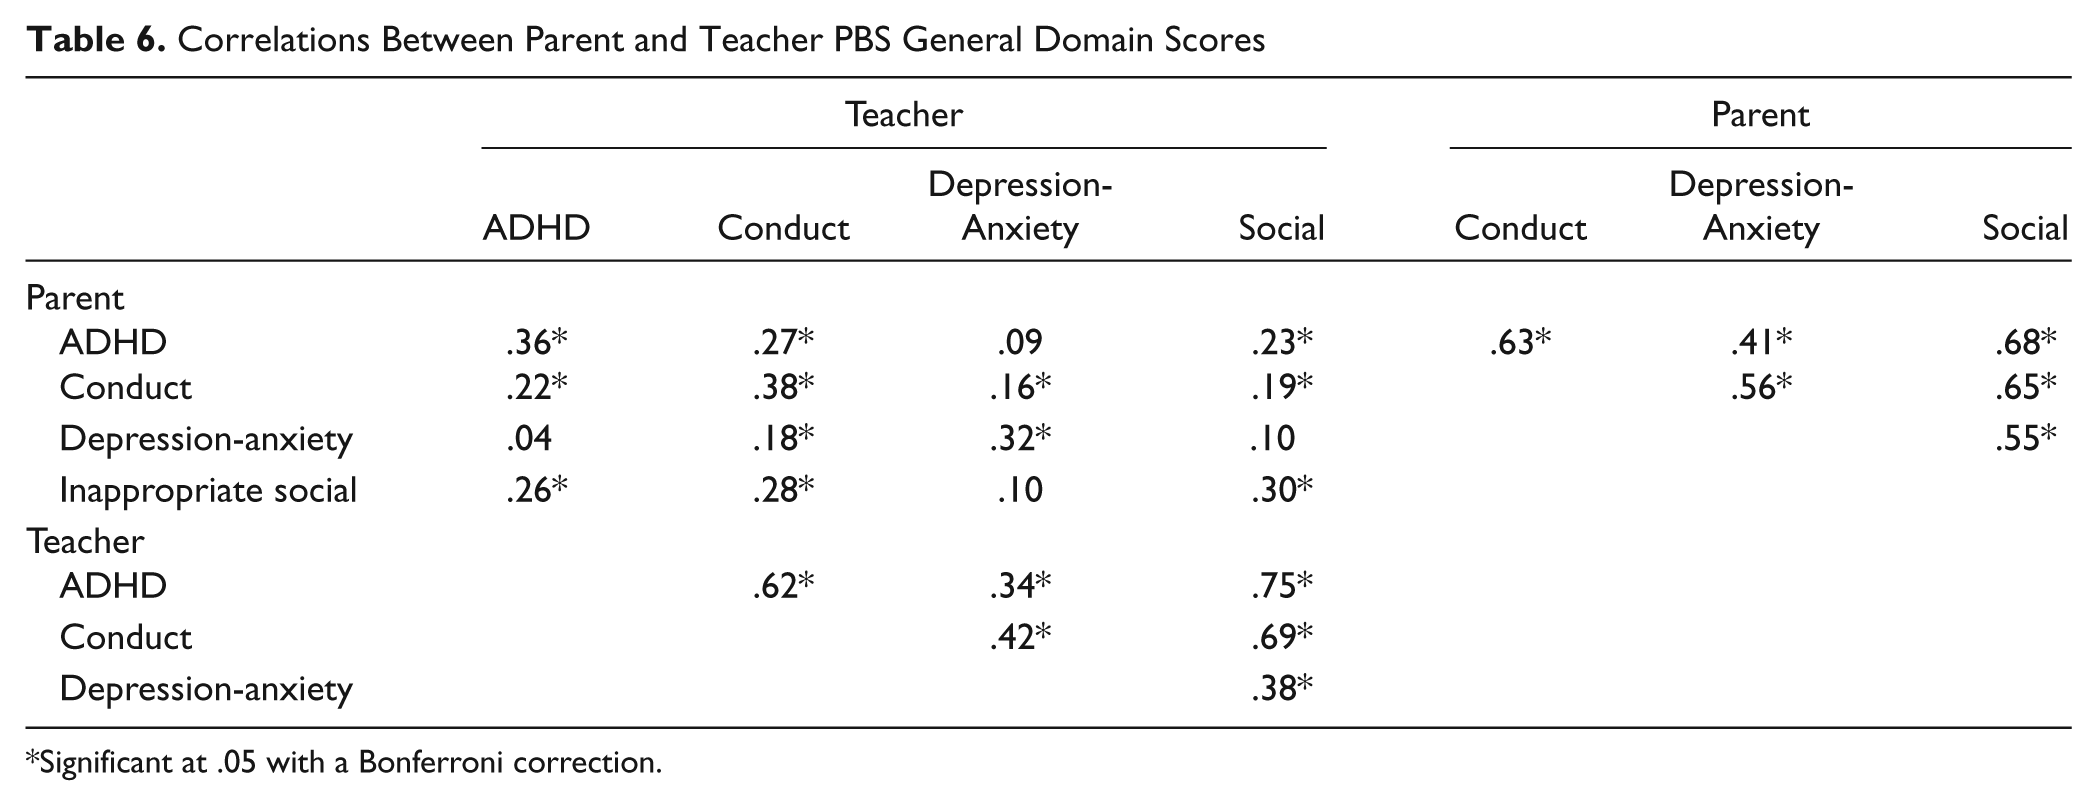
Significant at .05 with a Bonferroni correction.
Predictors of Achievement
FSIQ, the EF composite, the VMI, and parent and teacher ADHD composite ratings were entered in stepwise linear regression analysis to determine the most powerful predictors of the achievement composite score. IQ was the single strongest predictor, R = .67, t = 10.1, p < .0001, explaining 44% of the variance. Explained variance significantly increased to 48%, R = .69, with the addition of the EF composite, t = 4.8, p < .0001. The third strongest predictor was the teacher ADHD Composite, t = 3.6, p < .0001, which when combined with IQ and the EF composite explained 49% of the variance, R = .70. The parent ADHD composite and the VMI did not contribute significantly beyond the other variables to the prediction of achievement.
Discussion
To summarize, the psychopathology of ADHD children with LD differed very little from ADHD children without LD; that is, the presence of LD did not significantly increase the degree of psychopathology in these ADHD outpatient children. The groups did not differ significantly according to either parent or teacher ratings on important types of non-ADHD psychopathology such as oppositional behavior, aggression, explosiveness, anxiety, depression, moodiness, and inappropriate social behavior. Diagnostically, the two groups did not differ significantly in types of ADHD or the occurrence of non-ADHD comorbid psychiatric disorders.
However, the ADHD/LD children did differ significantly from the non-LD children with ADHD on specific neuropsychological measures, beyond the global differences on the achievement measures that were expected due to LD group definition. The ADHD/LD children scored significantly lower on the WISC indices of working memory and processing speed, as well as on the composite of EF and the measure of VMI. They did not differ significantly on the verbal and performance indices of IQ.
Finally, the cognitive/achievement test scores (FSIQ, EF composite, VMI, and achievement composite) were all significantly correlated with each other, and almost all of the parent and teacher PBS psychopathology scores were also significantly correlated with each other. In contrast, most correlations between the cognitive/achievement scores and the PBS psychopathology scores were not significant, with a median explained variance of only 1.4%. This primary relationship among cognitive/achievement measures was further demonstrated by the finding of IQ and EF as the strongest significant predictors of achievement, with a small contribution by teacher ratings of ADHD.
The lack of significant differences in psychopathology between the ADHD children with and without LD is generally consistent with findings from two studies of ADHD children with and without reading disorders (RD; Bental & Tirosh, 2007; Rucklidge & Tannock, 2002). In both of these past studies, the RD and non-RD groups of ADHD children were not found to significantly differ in types of ADHD or ADHD symptoms as rated by parents and teachers. Rucklidge and Tannock (2002) also did not find significant differences in diagnosed rates of non-ADHD psychiatric disorders or in overall impairment as rated by parents or teachers.
The cognitive/neuropsychological findings for the current report are also generally similar to the two preceding investigations. Bental and Tirosh (2007) found no significant differences between the ADHD only and the ADHD/RD groups on verbal or performance IQ scores, but the ADHD/RD group did score significantly lower on measures of working memory and rapid naming. Rucklidge and Tannock (2002) found their ADHD/RD group to be significantly lower than the ADHD only group on verbal IQ but not on performance or FSIQ. In addition, although their two groups did not differ significantly on WISC-III processing speed, the comorbid group scored significantly lower on freedom from distractibility (working memory).
In addition to the similarities between the current and the past two studies noted earlier, Biederman and his colleagues (Biederman et al., 2004) have found the converse to be true. That is, ADHD children with defined EF deficits were found to have significantly worse academic dysfunction, including increased LDs, compared to ADHD children without such deficits. Also, no significant differences were shown in psychiatric comorbidity between the ADHD children with and without EF deficits.
Thus, when studying the interrelationships of IQ, EF, achievement (or LD), and psychopathology in children with ADHD, a main emergent finding is that the severity of the core deficits in EF appears to be more associated with academic competence than with psychopathology in ADHD children. This result is consistent with the effect that EF skills may have on other components of intelligence such as verbal and performance (or visual spatial) skills (Anderson, 2001; Schuck & Crinella, 2005). That is, more impaired EF skills lead to more disrupted achievement and overall cognition. More specifically, Shaywitz and Shaywitz (2008) have begun to emphasize this point in their ongoing study of reading disability. In addition to decoding words efficiently, they note, which children must also read fluently and automatically that involves EF skills like attention. Consequently, disrupted EF skills, with or without other established non-EF deficits, may increase the likelihood of a reading disability (as well as, quite probably, other areas of learning).
Limitations
The ADHD participants in this study were somewhat unique from general outpatient ADHD children, which may have increased their LD rates. First, they had presented to a clinic designed to provide a comprehensive psychoeducational evaluation for youth with primarily attention and/or learning problems. Second, to correct an important omission of most past literature (Mayes & Calhoun, 2007a), they were assessed for LDs in all three LD areas of DSM-IV (APA, 1994), i.e., not only reading and math but also written expression. Indeed, LD in written expression showed the highest rate of LD (62.4%) and likely indicates the need to also test for LD in this achievement area to ascertain the true LD profile for a child with ADHD (Mayes & Calhoun, 2007a). In addition groupwise, another comparison group may have proven advantageous. Pure LD children rarely present to an outpatient psychiatric clinic. Therefore, an LD group with comorbid non-ADHD psychiatric disorders (such as anxiety, depressive, and oppositional-conduct disorders) could be used. LDs in such outpatient children are not common compared with ADHD children (Mayes & Calhoun, 2006), but their findings should prove interesting, in particular their degree of executive dysfunction.
The measures of EF in this study were only the two WISC indices and the GDS. Additional EF instruments could prove helpful in expanding the range of EFs that are assessed (Biederman et al., 2004) to further pinpoint which EF skills are most affected. Similarly, more micro-assessment of the specific skills that underlie the various LDs may identify cognitive deficits that were not measured with the WISC verbal and performance IQs, which more targeted studies have begun to identify (Bental & Tirosh, 2007; Rucklidge & Tannock, 2002). Also, focusing on specific LDs rather than combining several LDs may have produced more non-EF cognitive findings. Finally, other parent and teacher measures of psychopathology that have been more frequently used in the study of ADHD children could be used to validate the results for the PBS in this study, although the findings for the ADHD subscales of the PBS appear consistent with other ADHD instruments.
Clinical Implications
In this study, the absence of any strong relationship between cognitive/achievement deficits and psychopathology as observed by parent and teachers reminds clinicians to investigate for learning issues in all children with ADHD irrespective of their degree or type of psychopathology. More than 70% (73.4%) of the ADHD participants in this outpatient clinic setting had a comorbid LD (most commonly in the often overlooked achievement area of written expression) but were not distinguishable on either parent or teacher ratings of psychopathology. Furthermore, do not expect increased psychopathology to be noted by teachers rather than parents in ADHD children who also have LD, as in general parents rated their ADHD children significantly higher than did their teachers irrespective of the presence of LD. Clinicians who work in outpatient or more intensive treatment settings may want to assume the presence of LD in ADHD children until proven otherwise.
Practically, when clinicians examine IQ profiles for ADHD children, this study also indicates the worse that deficits in EF are for ADHD children, the more likely they are to also have accompanying LDs. The EF indices of the WISC (Working Memory and Processing Speed) were from 13 to 17 points lower than the means for the WISC verbal and performance indices in ADHD children with LD, that is, indicating frequent significant differences among indices. When these indices show this much separation in children with ADHD, clinicians should become especially suspicious of accompanying LDs and make sure that adequate achievement testing is obtained. Perhaps with future replication of the findings of this article, ADHD evaluation guidelines that do not now include more routine assessment of EF and LD will further emphasize that need as a recommendation (American Academy of Child and Adolescent Psychiatry, 2007).
The findings further emphasize the importance of clinicians using the full WISC battery (or another IQ test with equivalent subtests) when working with ADHD children. Use of an abbreviated version that only examined verbal and performance skills would have missed the low EF skills in ADHD children that must be addressed not only in children with ADHD but also even more so in those children with both ADHD and LD. In addition, an abbreviated IQ test that only focuses on verbal and performance skills could produce misleading inflated FSIQ scores, as would have happened in this study where verbal and performance scores were substantially higher in both ADHD children with and without LD. Researchers should also be aware of this limitation of abbreviated IQ tests when studying children who have ADHD and/or LD. The type of IQ test can produce quite different IQ results (especially FSIQ) for children with ADHD; that is, ADHD children tested with IQ tests that include EF subtests will likely show lower FSIQs than ADHD children tested with IQ measures that do not include EF subtests.
The results also emphasize the caution that researchers must use when investigating neuropsychological deficits that may occur in children with non-ADHD disorders. For example, those children with comorbid ADHD should be excluded because of the known EF deficits in ADHD, which may confound the findings. In addition, this study shows that comorbid LD should also be excluded because of EF deficits, in addition to other deficits that research has established for different LDs such as deficits in language skills in children with reading and/or written expression disorders (Vellutino, Fletcher, Snowling, & Scanlon, 2004).
Footnotes
The authors declared no potential conflicts of interests with respect to the authorship and/or publication of this article.
The authors received no financial support for the research and/or authorship of this article.