
Abstract
Over the past two decades there has been an increasing awareness among professionals in the arena of learning disabilities that the condition known as ADHD and the related attention deficit disorder (ADHD-PI) are not solely problems of childhood that are outgrown with the passing of adolescence. Originally, this assertion was made in large part because the hyperactive part of the disorder typically dissipated with entrance into adulthood. Recent evidence, however, suggests that ADHD extends beyond childhood and adolescence. Studies over the last 15 years indicate that 50% to 80% of children correctly diagnosed with ADHD continue to exhibit significant symptoms of the disorder into adulthood (Barkley, Fischer, Smallish, & Fletcher, 2002; Mannuzza, Gittelman-Klein, Bessler, Malloy, & LaPadula, 1993; Weiss & Hechtman, 1993; Wender, 1995). It is estimated that 5% of adults in America exhibit clinical levels of ADHD (Faraone & Biederman, 2005). In addition, ADHD symptoms occur on a continuum in the population, and there are million more who manifest subclinical levels of the disorder (Gordon & Murphy, 1998; Levy, Hay, McStephen, Wood, & Waldman, 1997).
The symptoms of adult ADHD vary, but generally include problems with concentration, staying on task, meeting deadlines, following a schedule, learning in academic/training settings, organizing, insensitivity to social cues, being hard to get along with, and experiencing an internal restlessness (Barkley, Murphy, & Fischer, 2008). It is clear that this list includes deficits that are likely to affect the performance of college students with ADHD. In fact, students diagnosed with ADHD (whether or not they are treated) are protected by the “other health impaired” (OHI) category of Individuals With Disabilities Education Act (IDEA), which states that educational institutions must provide them with extra time and quiet venues for taking examinations (Assistance to States for Education of Children With Disabilities and Early Intervention Program for Infants and Toddlers With Disabilities, 1999).
Surprisingly, relatively little research attention has been given to ADHD and academic performance among college students (exceptions are Burlison & Dwyer, in press; Spinella & Miley, 2003). Frazier and colleagues (Frazier, Youngstrom, Glutting, & Watkins, 2007) suggest that entering students should be screened for ADHD so those indicating a likelihood of the disorder can be counseled to pursue further assessment. Of course, such an effort would require a screening instrument that has an acceptable level of reliability and validity. It would also require information about the degree to which the predictive value of the instrument might be affected by participant variables such as general mental ability.
The purpose of the current study was to investigate both these issues by examining for a large sample of college students the reliability of three of the better known ADHD screening instruments and the degree to which the survey responses are predictive of self-reported diagnosis of ADHD and actual academic performance. Furthermore, measures of general mental ability were also obtained to assess the degree to which this construct may affect the usefulness of the screeners. The three screening instruments used in the current study were the Adult ADHD Self-Report Scale (ASRS; Kessler et al., 2005), the Conners’ Adult ADHD Rating Scales (Conners Erhardt, & Sparrow, 1999), and the Brown Attention Deficit Disorder (ADD) Scales (Brown, 1996). According to their authors, the purpose of these measures is to indicate the degree to which an individual is manifesting ADHD symptomology and may be diagnosable with the disorder.
Method
Participants
Participants included 111 student volunteers from a college course in introductory psychology who participated in the study to earn extra credit toward their final grade. Of the 111 participants, 64.9% were female, and the mean age was 19.83 (SD = 2.62). Their total course performance (based on three 1-hr, multiple-choice exams) was available for analysis, as were their ACT (a national college admissions examination) Composite scores, which ranged from 15 to 28.
Instruments
ASRS
The 18 items (5-point Likert-type scale) in the ASRS were derived from the 18 symptoms included in the Diagnostic and Statistical Manual of Mental Disorders (4th ed.; DSM-IV; American Psychiatric Association, 1994) for diagnosing ADHD. The authors found 6 of the 18 items to be the most predictive of ADHD, and these 6 questions comprise the short form of the screener (ASRS-S) developed by Kessler et al. (2005).
Conners’ Adult ADHD Rating Scale–Self-Report: Long Version (CAARS)
This scale is a 66-item (4-point Likert-type scale) instrument used to screen for symptoms of attention deficit, hyperactivity, and impulsivity in adults; it addresses all of the criteria listed in the DSM-IV for ADHD. The scale (Conners et al., 1999) comprises eight subscales—A: inattention/memory problems, B: hyperactivity/restlessness, C: impulsivity/emotional lability, D: problems with self-concept, E: DSM-IV inattentive symptoms, F: DSM-IV hyperactive-impulsive symptoms, G: DSM-IV ADHD symptoms total (Subscales E and F are summed together to form a composite scale), and H: ADHD index. In accordance with the manual, the age and gender of the participants is factored into the final score, which is reported as a percentile.
Brown ADD Scales
This instrument (Brown, 1996) contains 40 items for which the respondent is asked to indicate on a 4-point Likert-type scale how much he or she believes that the described feeling or behavior has been a problem in the past 6 months (i.e., almost daily, twice a week, once a week or less, never). According to the authors, the overall total score indicates the likelihood that the individual would be diagnosed with ADHD. The scale was designed as an interview questionnaire, and the instructions were modified slightly for the current study for use as a self-report questionnaire.
As a measure of academic aptitude and general mental ability, the participants’ ACT Composite scores were also available for analysis. In spite of the fact that ACT does not claim that the ACT college entrance exam is a measure of general intelligence (ACT 2007, 2010), there is empirical research to suggest that it is heavily g-loaded (Koenig, Frey, & Detterman, 2007).
The participants also completed the Wonderlic Personnel Test (Wonderlic Inc., 2000) as an additional measure of cognitive ability. The Wonderlic is a widely used test of general intelligence, the construct and criterion-based validity for which have been repeatedly established in the literature (e.g., Bell, Matthews, Lassiter, & Leverett, 2002; Dodrill, 1981, 1983; Dodrill & Warner, 1988; Wechsler, 1955).
The students’ total course performance, based on three multiple-choice hour exams, served as a measure academic performance. The total course performances correlated r(109) = .61, p < .05, with the participants’ overall grade point average, which was based on an average of 40 to 45 hr of completed course work that included the students’ introductory psychology grade. Thus, it should be pointed out that the obtained correlation is slightly inflated; however, it does indicate that the academic demands in the psychology course were similar to those demanded by the students’ college course work, in general.
Procedure
In seven sessions of 10 to 31 students each, the participants read and signed the Informed Consent Form. Then they were given instructions for the Wonderlic and worked on it for the 12-min prescribed time limit. Then they were given instructions on how to complete the three ADHD screeners. To eliminate the possibility of any order effects, the three screeners were inserted into individual packets in random order but consecutively numbered 1 through 3, and the students were instructed to complete the screeners in their numbered order. To not reveal the authors’ interest in ADHD, the students were given a demographic sheet to fill out after they had completed the three screeners. The information included gender, ethnicity, age, whether they had been diagnosed with ADHD, and, if so, whether they were currently taking medication for it. Each session lasted about 1 hr. After the sessions, the screeners, Wonderlic, and demographic data were entered into an electronic database. To this database were subsequently added the participants’ ACT Composite and their total course performance.
Results
Reliability of ADHD Screeners
As expected from the research literature, the results indicated that the distributions for each of the three screeners, as well as the CAARS subscales, were symmetrical and fairly normal. As a measure of internal consistency, Cronbach’s alpha scores were computed for the full ASRS and the shortened six-item ASRS-S, the Brown, and for each of the CAARS eight subscales and all eight scales combined. As can be seen in Table 1, the three full-scale screeners all possessed acceptable internal consistency, as did all eight of the CAARS subscales, whereas the alpha level of the short, six-item, form of the ASRS was below an acceptable level. The number of participants in Table 1 varies because there were 10 students who skipped one question and 5 students who skipped more than one but no more than four questions.
Cronbach’s Alpha Internal Consistency Scores for the ASRS, ASRS-S, Brown, the CAARS, and Its Eight Subscales.

Note: ASRS = Adult ADHD Self-Report Scale; ASRS-S = Adult ADHD Self-Report Scale Screener; CAARS = Conners’ Adult ADHD Rating Scale–Self-Report: Long Version.
Validity of ADHD Screeners
Identification of self-reported ADHD
We looked at those participants who self-reported having been diagnosed with ADHD to determine the three screeners’ performance with respect to identifying test sensitivity (i.e., true positives) and specificity (i.e., true negatives). In all, 14 of the 111 students (12.6%) self-identified themselves as having been diagnosed with ADHD. None of those 14 were registered with the university’s Student Disabilities Services office, so none of them were receiving any special accommodations for the hour exams. To calculate the sensitivity and specificity of the scales and subscales, these 111 students were dichotomized into “likely ADHD” or “not likely ADHD” groups based on the criteria determined by each of the scales’ authors. These results are presented in Table 2, along with Cohen’s kappa coefficients (Cohen, 1960). As can be seen in the table, the CAARS Subscale E (Inattention; example items: “I have trouble keeping my attention focused when working” and “I have trouble listening to what other people are saying”) produced the highest true sensitivity score, having correctly identified 50% of the 14 self-reported ADHD cases. The kappa coefficients confirmed that Subscale E was the best indicator of self-reported physician-diagnosed ADHD. According to Landis and Koch (1977), the kappa values in Table 2 from .00 to .20 would indicate at least “slight” agreement, whereas CAARS Subscales A, E, G (inattention/memory problems, DSM-IV inattentive symptoms, DSM-IV ADHD symptoms total) and ASRS short-form kappa values indicate “fair” agreement between the screeners and diagnoses. As can be seen, these particular subscales are characterized by a focus on problems with inattention. It should be pointed out that Subscale E had the highest rate of false positives, having identified 11 of the 97 non-self-reported cases as “ADHD likely.”
Kappa Measure of Agreement of Each Screener and Self-Reported Diagnoses of ADHD.
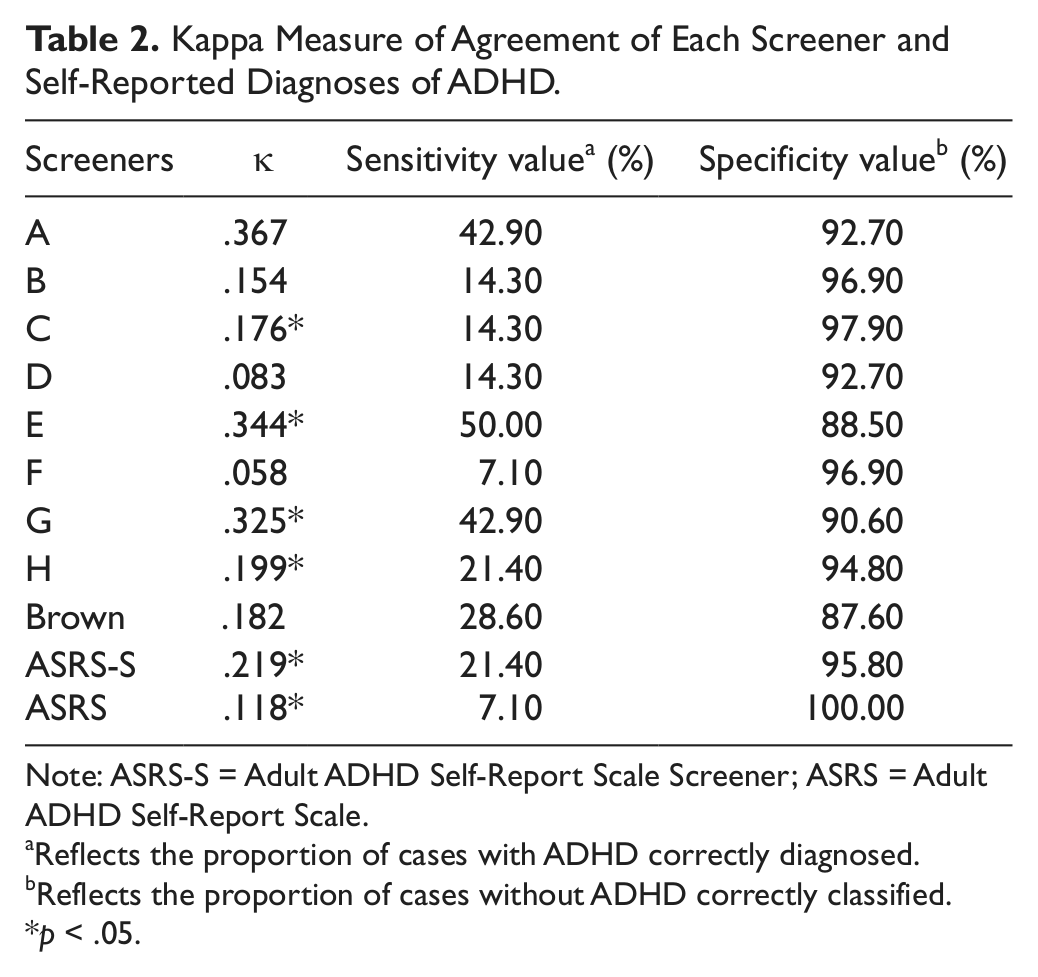
Note: ASRS-S = Adult ADHD Self-Report Scale Screener; ASRS = Adult ADHD Self-Report Scale.
Reflects the proportion of cases with ADHD correctly diagnosed.
Reflects the proportion of cases without ADHD correctly classified.
p < .05.
ADHD screener scores, general mental ability, and class performance
Table 3 presents a matrix of the Pearson correlations among the screeners, Wonderlic, ACT Composite, and total course performance. As can be expected, all screeners (including the ASRS-S and the CAARS subscales) correlated highly with each other. Also to be expected, the total course performance, ACT Composite, and the Wonderlic scores correlated with each other. However, the matrix shows that there are virtually no significant correlations between the screener scores and total course performance. The one exception was a significant correlation, r(109) = −.22, p = .02, between total course performance and the 12 items in CAARS Subscale B (hyperactivity/restlessness), which includes items such as “I like to be up and on the go rather than being in one place” and “I feel restless inside even if I am sitting still” (Conners et al., 1999).
Correlation Matrix of the Total Course Performance, ACT Composite, Wonderlic, and the Screeners.
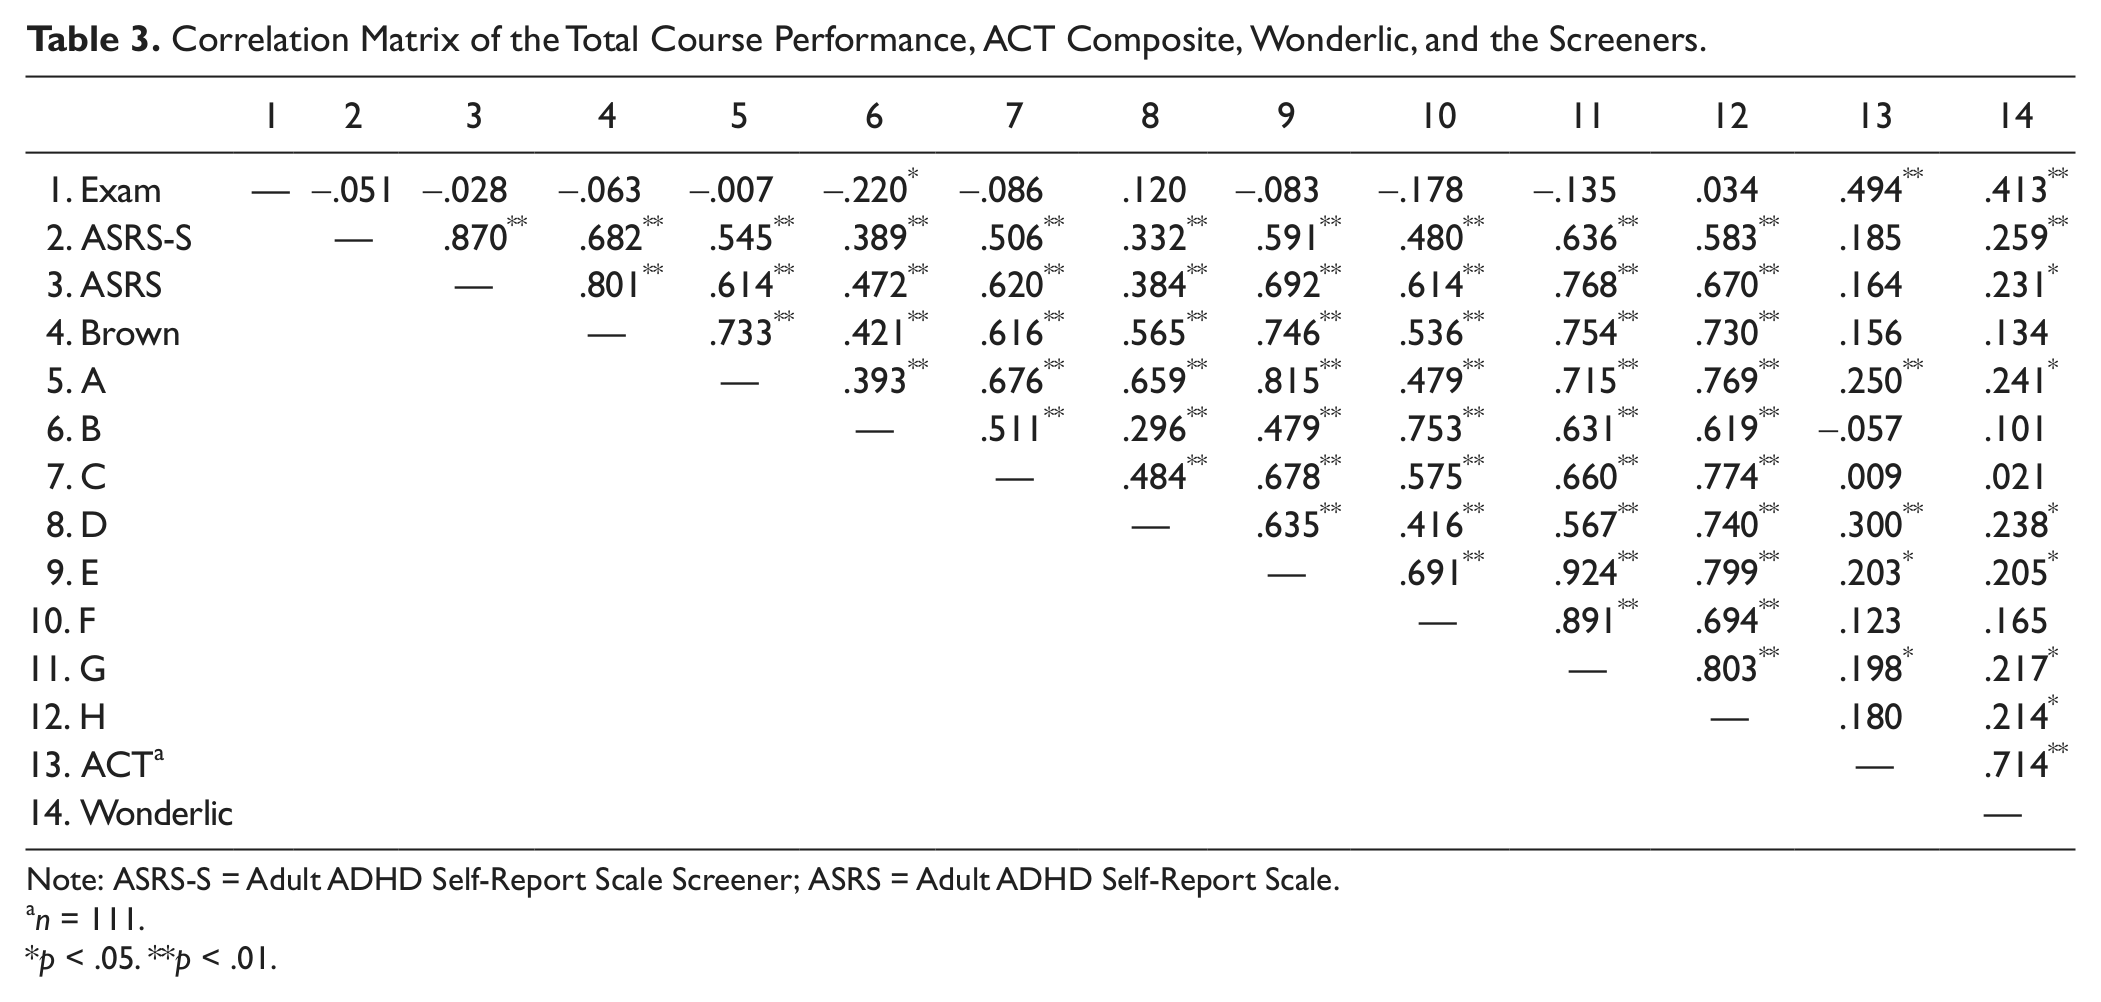
Note: ASRS-S = Adult ADHD Self-Report Scale Screener; ASRS = Adult ADHD Self-Report Scale.
n = 111.
p < .05. **p < .01.
As a follow-up to the previously-mentioned significant correlation between total course performance and the various screeners, we searched for the possibility of differential validity (ethnicity, gender) that might have been suppressing the observed relationship, but neither demographic was significant. A regression analysis was computed to predict total course performance from scores on CAARS Subscale B. For every point that a student increased on the CAARS Subscale B, the student’s total course performance dropped 0.31 percentile points. For example, for a 10-point increase in the CAARS Subscale B, a student’s grade could go from an 82% B to a 79% C, dropping a letter grade. With the CAARS final score reported as a percentage, the possible range is from 0 to 99. The CAARS Subscale B had a range from 17 to 78 with a mean of 48.86 (SD = 8.968). To account for individual differences of academic aptitude, ACT Composite was first regressed onto total course performance; then the relationship between CAARS Subscale B and total course performance was calculated, which still resulted in a significant relationship t(108) = −2.363, p = .020. The unstandardized weight of CAARS Subscale B dropped from −0.31 to −0.27.
With respect to any relationships between screener scores and measures of academic aptitude and general mental ability (i.e., ACT Composite and Wonderlic), Table 3 indicates four low but significant correlations for the CAARS subscales: A, D, E, and G (inattention/memory problems, problems with self-concept, DSM-IV inattentive symptoms, DSM-IV ADHD symptoms total). This last Subscale G represents a total of Subscales E and F, combined (i.e., inattentive symptoms and DSM-IV hyperactive-impulsive symptoms). The ASRS, both long and short version, and the CAARS Subscale H (ADHD index) displayed a relationship only with the Wonderlic and not with ACT Composite.
Discussion
With respect to the reliability of the three adult ADHD screeners evaluated in the current study, all were shown to have an acceptable level of internal consistency, except for the short form of the ASRS. In keeping with the literature asserting that ADHD symptomology occurs along a continuum (Gordon & Murphy, 1998; Levy et al., 1997), the scores of each of the measures produced frequency distributions that were fairly symmetrical and normal. The results indicated that, for a short screening instrument, the nine items comprising CAARS Subscale E (inattention) were the most successful at identifying self-reported cases of ADHD.
It is interesting that, of the three primary ADHD symptom clusters (inattention, impulsivity, hyperactivity), items involving inattention seemed to be the most predictive of an ADHD diagnosis, as indicated by the stronger kappa values for all three of the inattention CAARS subscales. It is possible that performance deficits involving attention problems are the most salient from the perspective of the adult ADHD sufferers, themselves. Such performance deficits would be especially noticeable in the college environment, where requirements for focusing on academic tasks exist in contexts that also present innumerable cues for distraction, especially for young adults. It is also possible that some medical practitioners may dismiss their patients’ impulsivity and hyperactivity and focus on their complaints related to attention deficits.
On initial consideration, it is also interesting that ADHD screener scores generally did not predict class performance in the current study. Furthermore, there is scant evidence in the literature that such correlations exist. Our data would lead one to wonder why ADHD is included in the IDEA. Have these students learned to compensate by developing strategies to overcome problems caused by their symptoms? Clearly, more data need to be collected on college students with ADHD to address this issue. The traditional academic compensation for ADHD-registered students is to offer them time-and-a-half in quiet locations to take exams. However, ADHD should impair academic achievement in multiple venues: deciding when to study, deciding how much to study, concentrating during the studying activities, focusing on lectures, and taking tests.
The one predictor of total course performance (r = −.22) in the current study was the 12-item CAARS Subscale B (hyperactivity/restlessness). Even after accounting for cognitive ability (by isolating its variance in our regression analyses), the students who reported more symptoms related to hyperactivity/restlessness performed worse than those with less symptoms. Although the screener scores generally did not predict total course performance, some of them did exhibit a weak but significant relationship with cognitive ability, as measured by the Wonderlic and/or ACT composite. This finding is inconsistent with previous research (e.g., Bridgett & Walker, 2006), which contends that the two constructs are independent.
Although there was no practical alternative, the use in this study of self-reports for identifying those with ADHD may introduce an inherent limitation in determining the screeners’ sensitivity. Given our emphasis on confidentiality, there was likely to be little incentive to intentionally lie about an ADHD diagnosis. However, with ADHD often being diagnosed at childhood, our participants had to recall further back in time, or most likely had to rely on what their parents had told them. In addition, some of the 11 false positives identified by the CAARS Subscale E may have actually manifested the disorder (unbeknownst to themselves), thus constraining any conclusions regarding the subscale’s specificity.
In summary, the results of this study suggest the potential value of the CAARS Subscale B in conjunction with the Subscale E as a short ADHD screening device for college students. Both showed acceptable internal reliability and criterion validity. Clearly, more work has to be done before a gold standard screener is available to implement the suggestion by Frazier et al. (2007) that all entering college students be screened for ADHD. It is very likely that ADHD is underdiagnosed in the college population. Furthermore, if our sample is any indication, many of those students with an ADHD diagnosis do not take advantage of the accommodations colleges have to offer.
Footnotes
Declaration of Conflicting Interests
The authors declared no potential conflicts of interest with respect to the research, authorship, and/or publication of this article.
Funding
The authors received no financial support for the research, authorship, and/or publication of this article.