
Abstract
ADHD is a neurobehavioral developmental disorder characterized by a persistent pattern of inattention and/or hyperactivity, as well as poor impulse control (American Psychiatric Association [APA], 1994). Meta-analytical studies have reported that the worldwide prevalence of ADHD is about 5.5% in children (Polanczyk, Lima, de Horta, Biederman, & Rohde, 2007) and 4.4% in adults (Kessler et al., 2006; U.S. sample).
The main theoretical explanation for ADHD symptomatology has been referred to executive function (EF) deficits with important weakness in planning, working memory, response inhibition, and vigilance (Willcutt, Doyle, Nigg, Faraone, & Pennington, 2005). Along with EF deficits, ADHD participants have difficulties in many general cognitive abilities such as memory, visuo-motor competencies, behavioral control, and social skills (Crawford, Kaplan, & Dewey, 2006; Seidman, Biederman, Monuteaux, Doyle, & Faraone, 2001). Castellanos and Tannock (2002) suggested that these deficits can be related to three main quantitative indices of disease risk (endophenotypes): a reduced delay gradient due to an impairment in rewarding circuitry, a strong intertrial and intraindividual variability may be related to deficits in temporal processing, and deficits in working memory.
ADHD is often coupled to academic difficulties or learning disabilities (LD; e.g., Barry, 2002; Faraone, Biederman, Monuteaux, Doyle, & Seidman, 2001; Mayes, Calhoun, & Crowell, 2000). The frequency of LD in children with ADHD has been estimated to vary from 15% to 44% for reading and from 31% to 60% for mathematics (Mayes & Calhoun, 2006). Most research about the comorbidity between ADHD and LD refers to reading disability (e.g., dyslexia). In contrast, mathematical disorders (MD) associated with ADHD have been much less often investigated despite their high association (Capano, Minden, Chen, Schachar, & Ickowicz, 2008). Research has shown that ADHD children often have arithmetic difficulties, are more rigid in strategy use, and have poor attentional control (Lucangeli & Cabrele, 2006). The most severe difficulties seem present when arithmetical reasoning and executive processes are required (e.g., Marzocchi, Lucangeli, De Meo, Fini, & Cornoldi, 2002), but difficulties may also concern basic number processing and calculation. For example, Zentall, Smith, Lee, and Wieczorek (1994) found that students with ADHD were slower and less accurate in number recognition and also in typing numbers. Kaufmann and Nuerk (2008) found that ADHD children, without LD and with a similar performance as controls in complex arithmetic, were nevertheless poorer in basic arithmetic tasks requiring attentional control, such as magnitude comparison (i.e., indicating which of two numbers is larger) or transcoding tasks (i.e., writing down in Arabic format a number like “32” orally displayed).
Some of ADHD deficits in accomplishing cognitive tasks and in academic achievement are due to their poor ability in selecting the best strategies to maximize their performance or achievement. Indeed, a strategy can be defined as “a procedure or a set of procedures for achieving a higher level goal or task” (Lemaire & Reder, 1999, p. 365). Differences in strategic aspects between ADHD and control children’s performance is plausible given previous findings showing that ADHD children have poorer strategic behaviors compared with control children (e.g., Cornoldi, Barbieri, Gaiani, & Zocchi, 1999; Sergeant, Geurts, & Oosterlaan, 2002). In particular, it has been found that ADHD children tend to adopt more superficial strategies, to repeat the same strategy across trials (O’Neill & Douglas, 1991, 1996), and to have less knowledge of optimal strategies (Hamlett, Pellegrini, & Conners, 1987). These difficulties seem to remain even when the best strategy to accomplish a task is directly suggested to ADHD children (Kofman, Larson, & Mostofsky, 2008). Nevertheless, Cornoldi et al. (1999) found that when sixth- to eighth-grade ADHD children were informed and assisted in the use of the appropriate memory strategy, ADHD children performed as well as controls. Instead, when they were not informed about appropriate strategies, ADHD had poorer memory performance. In line with these results, a recent study confirmed the effectiveness of cognitive strategy instructions in improving mathematical computation in ADHD children (Iseman & Naglieri, 2011).
One aspect of mathematical performance that has not been investigated in great detail in ADHD children concerns strategies. Children’s mathematical proficiency is known to crucially depend on strategic aspects of performance. Most proficient children use more and/or most efficient strategies, select the best available strategies on individual problems, and execute strategies most efficiently (see Siegler, 2007, for an overview).
In this article, we report a study that asks whether ADHD children are as good as control children at selecting the best strategy on individual items when they accomplish cognitive tasks. We ran the empirical study in the domain of arithmetic, but the results generalize to other cognitive domains (Campbell, 2005). As children use several strategies to accomplish cognitive tasks and as one crucial aspect of cognitive performance is children’s skill at selecting the best strategy on each item, we asked whether differences in cognitive performance between ADHD and control children lie in their skills at selecting the best strategy on each problem. Investigating ADHD’s skills at selecting the best strategy to solve arithmetic problems was expected to bring two sets of contributions. First, it was aimed at increasing our understanding of sources of differences in mathematical performance between ADHD and control children when ADHD children do not suffer from inefficient mathematics, domain-specific processes (e.g., insufficient knowledge of basic arithmetic facts). More generally, the present strategy approach was expected to highlight how ADHD children accomplish cognitive tasks and why they obtain poorer cognitive performance despite being skilled in a given cognitive domain. Second, it was hoped to further document the role of domain-general processes such as sustained or focused attention, shifting, or inhibition on mathematical performance. A number of previous studies have shown that children with mathematical difficulties tend to engage in fewer attending behaviors during mathematics instruction (Bryan, 1974; Hecht & Greenfield, 2001; McKinney & Speece, 1986). Also, previous works showed that children with poor working-memory capacities or with poor focused attention tend to have poorer mathematical performance (e.g., Barrouillet & Lépine, 2005; Geary, Hoard, Byrd-Craven, Nugent, & Numtee, 2007; Hitch & McAuley, 1991; Kail & Hall, 1999; LeFevre, DeStefano, Coleman, & Shanahan, 2005). Finally, data collected with neuropsychological tests of EFs suggest that EFs influence children’s mathematical performance and strategies (e.g., Bull, Johnston, & Roy, 1999; Bull & Scerif, 2001; Geary, Brown, & Samaranayake, 1991; Lemaire & Lecacheur, 2011; McKenzie, Bull, & Gray, 2003). Finding that ADHD children who are known to have EF problems (e.g., Barkley, 1997; Castellanos, Sonuga-Barke, Milham, & Tannock, 2006; Holmes et al., 2010; Martinussen, Hayden, Hogg-Johnson, & Tannock, 2005; Nigg, 2001) also have strategy selection problems would further suggest that one of the crucial roles of attention in children’s mathematical proficiency consists in how able they are to select the best strategy on each problem.
The present study compared ADHD and control children on strategic aspects of arithmetic performance. We tested one specific arithmetic activity, namely, computational estimation, as previous studies revealed that it is a good activity in which strategy differences across populations are unambiguous and easy to document. In computational estimation tasks, participants are asked to provide the best approximate sums (or products) to problems like 36 + 78 (or to problems like 36 × 78). Previous research showed that children of different ages use several types of strategies. Also, like in other domains, children’s performance is influenced by the type of strategies they use and the type of problems they solve (Baroody, 1989; Case & Sowder, 1990; Dowker, 1997; Dowker, Flood, Griffiths, Harriss, & Hook, 1996; LeFevre, Greenham, & Waheed, 1993; Lemaire & Lecacheur, 2002; Lemaire, Lecacheur, & Farioli, 2000; Levine, 1982; Reys, Rybolt, Bestgen, & Wyatt, 1982; Sowder & Markovits, 1990). The hypothesis under test was that an important source of differences in arithmetic performance between ADHD and control children concerns strategic aspects of this performance. More specifically, we tested group differences in strategy use asking whether ADHD and control children differ in strategy preferences and in best strategy selection. In other words, we tested the hypothesis that ADHD children would be less able than control children to select the best strategy on each problem. We made sure that both ADHD and control children knew the available strategies so as to control for potential differences in strategy repertoires. We tested younger children (fourth and fifth graders) to test the possibility that strategic differences exist very early in school-age children. Moreover, we also determined whether ADHD and control children base their best strategy selections on the same problem features.
Method
Participants
Participants were selected from state schools in Veneto region, North Italy, on the basis of the “SDAI” Rating Scale (ADHD Rating Scale for Teachers [Scala per i Disturbi di Attenzione/Iperattività per Insegnanti]; Cornoldi, Gardinale, Masi, & Pettenò, 1996). The SDAI Scale requires the teacher to rate the child frequency/intensity (4-point scale ranging from 0 = no problem to 3 = severe problem) of the nine symptoms of inattention and the nine symptoms for hyperactivity/impulsivity reported in the Diagnostic and Statistical Manual of Mental Disorders (4th ed.; DSM-IV; APA, 1994). The SDAI interrater reliability is .80 for the Inattention subscale and .74 for the Hyperactivity-Impulsivity subscale. The test–retest reliability is .83 and .81, for Inattention and Hyperactivity-Impulsivity, respectively (Marzocchi, Re, & Cornoldi, 2010). For each subscale, the cutoff is at 13.5 points, that is, 1.5 SD more than the standardized mean score. All the children included in the ADHD characteristic group obtained a score above the cutoff in at least one scale (Inattention or Hyperactivity-Impulsivity). Moreover, we administered the “COM” Scale (“Comorbidity Scale”; Marzocchi et al., 2010) to assess the comorbidity in ADHD. The questionnaire has thirty 4-point Likert-type scale (ranging from 0 = no problem to 3 = severe problems) items: five items for general cognitive and learning difficulties, one item for Tourette syndrome, four items for conduct disorder, five items for oppositional defiant disorder, five items for autistic behaviors, four items for depression, and six items for anxiety. The scale shows good psychometric properties such as an interrater reliability of .97. On the basis of the COM Rating Scale, all children scored less than 2 in general cognitive and learning difficulties, oppositional and aggressive behaviors, anxiety problems, and depressive behaviors. Among those items assessing learning difficulties, one specifically measures mathematical learning. Thus, the teacher reported that no child had a lower mathematical learning or achievement. The children in both groups did not present any other severe psychological problems, nor any physical or sensory deficits or a disability certification. ADHD characteristics children were not under medication.
The final sample included 19 children (14 boys, 5 girls; 9 fourth graders, 10 fifth graders) with ADHD characteristics (7 inattentive subtype, 6 hyperactive-impulsive subtype, 6 combined subtype). The ADHD characteristics (hereafter ADHD group for simplicity) group was compared with a control group. Children of the control group were 14 boys and 5 girls: in all, 10 of these control children were in fourth grade and nine were in fifth grade. The ADHD and control groups were matched for gender, age, written calculation skills assessed with a standardized test (AC-MT written calculation scores; Cornoldi, Lucangeli, & Bellina, 2002), and general knowledge (paper- and -pencil version of the Information subtest of Wechsler Intelligence Scale for Children–III [WISC-III]; Wechsler, 1991). The written calculation test was composed of eight problems: two addition, two subtraction, two multiplication, and two division problems. We chose to match children on the basis of this task because it involves a wide range of mathematical knowledge: number knowledge, mental strategies and procedures of calculation, and knowledge of arithmetic facts. Similarly, the Information subtest of the WISC-III was used as a control measure for general knowledge and IQ given the high correlation between the subtest and the Full Scale IQ (r = .62 for 10 years of age and r = .65 for 11 years of age). As expected, only levels of inattention and hyperactivity were significantly different between the two groups (Table 1).
Characteristics of ADHD and Control Participants.
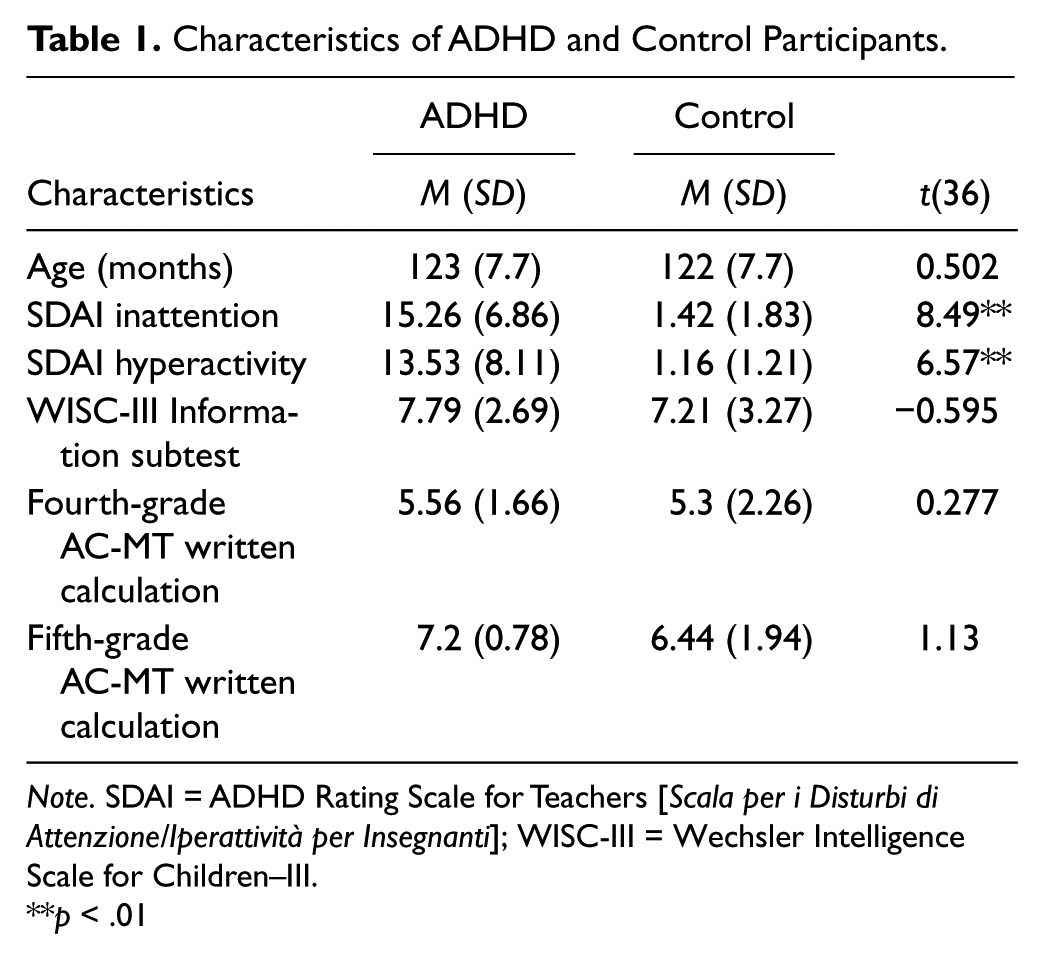
Note. SDAI = ADHD Rating Scale for Teachers [Scala per i Disturbi di Attenzione/Iperattività per Insegnanti]; WISC-III = Wechsler Intelligence Scale for Children–III.
*p < .01
Stimuli
Children were asked to select the best strategy to find estimates to two-digit addition problems like 36 + 78. On each problem, children could choose rounding-down (i.e., rounding both operands down to the closest smaller decades, like doing 40 + 60 to solve 42 + 67) or rounding-up strategies (i.e., rounding both operands up to the closest larger decades, like doing 50 + 70 to solve 42 + 67), as these strategies are known and spontaneously used by children as young as 7 years (e.g., LeFevre et al., 1993; Lemaire, Lecacheur, & Farioli, 2000; Lemaire & Lecacheur, 2002, 2011). The stimuli for the main computational estimation task were 100 two-digit addition problems (e.g., 54 + 29). Two types of problems were tested, so-called homogeneous problems (i.e., problems with unit digits of both operands either smaller or larger than 5 like in 43 + 62 or in 37 + 59) or heterogeneous problems (i.e., problems with unit digit of one operand smaller than 5 and unit digit of the other operand larger than 5 like in 43 + 68), as previous studies in computational estimation showed that size of unit digits influences children’s strategies and performance. Mixed-rounding strategy (i.e., rounding one operand down and the other up to the closest decades) was not allowed to increase difficulty of strategy selection, thereby maximizing group differences in mean percentage use of the best strategy. Indeed, we wanted to avoid that children systematically choose the rounding-down strategy on homogeneous, small-unit problems (e.g., 31 × 82), the rounding-up strategy on homogeneous, large-unit problems (e.g., 27 × 68), and the mixed-rounding strategy on heterogeneous problems (e.g., 28 × 74), something that children as young as 7 years are able to do.
Homogeneous and heterogeneous problems were matched on three important factors, the side of the larger operand, mean correct sums, and mean percentage deviations. The larger of the two operands was on the left position (e.g., 67 + 26) in half the problems and on the right position (e.g., 18 + 73) in the other problems. Moreover, mean correct sums were 68 for both types of problems (ranges were 44-86 for homogeneous problems and 42-82 for heterogeneous problems). Finally, for each homogeneous and heterogeneous problem estimated with rounding-down and rounding-up strategies, percentage deviations were calculated with the following formula: ([estimate sum − correct sum]/correct sum) × 100. For example, percentage deviations were 10.3% and 15.4% on 41 + 37 when using rounding-down and rounding-up strategy, respectively, and were 16.7% and 11.1% on 48 + 24 when using rounding-down and rounding-up strategy, respectively. Mean percentage deviations between correct sums and estimates for homogeneous problems were 15.0% (range = 4.1%-31.8%) and 15.2% (range = 3.9%-30.4%) when using rounding-down and rounding-up strategies, respectively. Similarly, mean percentage deviations between correct sums and estimates for heterogeneous problems were 15.2% (range = 9.1%-30.2%) and 15.1% (range = 9.8-25.0%) when using rounding-down and rounding-up strategies, respectively. Matching these percentage deviations was necessary because having one strategy with mean percentage deviations smaller on average than those of the other strategy might artifactually lead participants to use the former strategy most often. When one strategy was the best on a given problem, the estimate provided by that strategy was closer to the correct product by 10.1% on average (range = 3.9%
Finally, based on previous research in arithmetic (e.g., see Campbell, 2005, or Geary, 1994, for overviews in adults or children), problems were selected with the following constraints: (a) No operand had 0 or 5 as unit digits, (b) digits were not repeated in the same unit or decade positions across operands (like 64 + 24), (c) no digits were repeated within operands (e.g., 66 + 31), and (d) no reverse orders of operands were used (e.g., 47 + 32 was used, 32 + 47 was not).
Procedure
Before encountering the experimental problems, participants were told that they were going to do computational estimation. Computational estimation was explained as giving an approximate answer to an arithmetic problem that is as close as possible to the correct answer without actually calculating the correct answer. An example was worked out with participants who were told, “For example, if I have to estimate 28 + 41, I can do 20 + 40 and give 60 as an approximate solution to the problem. I can also do 30 + 50, or do anything else that yields an approximate answer.” Then, all participants were told,
You are going to see two sets of 50 two-digit addition problems each, with a break in-between. Your task is to tell me an approximate sum for each problem. To estimate the sums, you can use either rounding-up or rounding-down strategy, and no other strategies. Rounding-down means that you round each operand down to the closest smaller decades, like when you do 20 × 40 to estimate 26 × 42. Rounding-up strategy means that you round each operand up to the closest larger decades, for example when you do 30 × 50 to estimate 26 × 42. For each problem, I want you to try to find the best strategy that will give you the most exact sum. The most exact sum is the one that is the closest from the exact sum. [This was illustrated with a couple of examples.] However, be careful. Because I do not want you to give me the exact sum but an approximate sum, you will not have the time to calculate the exact sums, as your estimates should be stated very quickly.
Instructions also emphasized that participants should do only the initial rounding up or down and should do nothing more (i.e., adding or subtracting small amounts after calculating the sum of rounded operands). Before the experimental trials, participants were given 10 training problems that were similar to (but different from) experimental problems to familiarize themselves with the apparatus, procedure, and task. All individuals had no difficulties with either rounding-down or rounding-up strategies.
At the beginning of the practice trials, some participants wanted to use mixed-rounding strategy (i.e., rounding one operand down to the closest smaller decade and rounding the other operand up to the closest larger decade). After a few practice problems, all participants understood that this strategy was not allowed. At the end of this training, children had no difficulties with the instruction on trying to select the best strategy on each problem.
The experimental problems were presented in 48-point Arial font (black color) in the center of a 17-in. computer screen controlled by Notebook with a 1.6 GHz processor. Each trial began with a black fixation cross in the center of the screen waiting for the child to be ready. When the experimenter pressed the spacebar, the two + two–digit addition problems were displayed horizontally. The symbol and numbers were separated by spaces equal to the width of one character. Timing of each trial began when the problem appeared on the screen and ended when the experimenter pressed the spacebar of the computer keyboard, the latter event occurring as soon as possible after the participant’s responses. Children were asked to calculate out loud so that the experimenter could note which strategy was used on each problem. The experiment was controlled by E-Prime software.
The order of presentation of problems was sequential for each participant. Each participant was permitted a 5- to 10-min rest between two blocks of 50 problems each. The computational estimation task was accomplished in between 30 to 60 min, depending on participants’ age.
Results
Data analyses had three goals. First, we analyzed group differences in computational estimation performance for the purpose of comparing ADHD and control children skills at finding best estimates of two-digit addition problems and speed at achieving this end. The hypothesis that the two groups differ in performance predicts that ADHD children should provide less accurate estimates and should take more time. The second goal was to analyze group differences in strategy use. To achieve this end, we first compared strategy preferences in each group of children (i.e., Do children differ in mean percentage use of the rounding-down strategy?). Second, we tested group difference in best strategy selection. We expected that ADHD children would select the best strategy less often than control children. This was justified by the fact that ADHD’s attention problems might not enable them to analyze problem features as fully as control children. Such problem features are crucial to selecting the best strategy on each problem, as the larger the sum of unit digits in a problem, the more likely that the best strategy is the rounding-up strategy. Finally, we examined the bases on which children selected strategies on individual problems so as to know whether the two groups used the same problem features during strategy selection.
Results are reported in three main parts. Group differences in computational estimation performance are examined in the first part, and differences in strategy use are analyzed in the second part. The third part focuses on the determiners of best strategy selections. In all results, unless otherwise noted, differences are significant to at least p < .05.
Group Differences in Performance 1
To highlight the differences between ADHD and control children, we analyzed accuracy and speed of responses. Mean percentage deviations between estimates and correct sums were analyzed to determine whether the two groups differed in the accuracy of estimates they provided. Following previous works on computational estimation (e.g., LeFevre et al., 1993; Lemaire, Arnaud, & Lecacheur, 2004), the quality of estimates was assessed by calculating mean percentage deviations between estimates and correct sums. We calculated each participant’s percentage of deviation between estimates and correct sums with the following formula: │([(Participant’s response - Correct sum)/Correct sum]*100)│To illustrate, suppose a participant gave 80 as an estimatefor 43 + 56, that participant would be 19.2% ([(80-99)/99] × 100) away from the correct product. Mean solution times and percentage deviations (see Table 2) were analyzed with a mixed-design ANOVA, 2 (group: control, ADHD children) × 2 (problem type: homogeneous, heterogeneous problems), with group as a between-participant factor.
Mean Percentage Use of Rounding Down and of the Best Strategy on Each Problem, Mean Solution Times (ms), Percentage Deviations, and Percentage Errors.
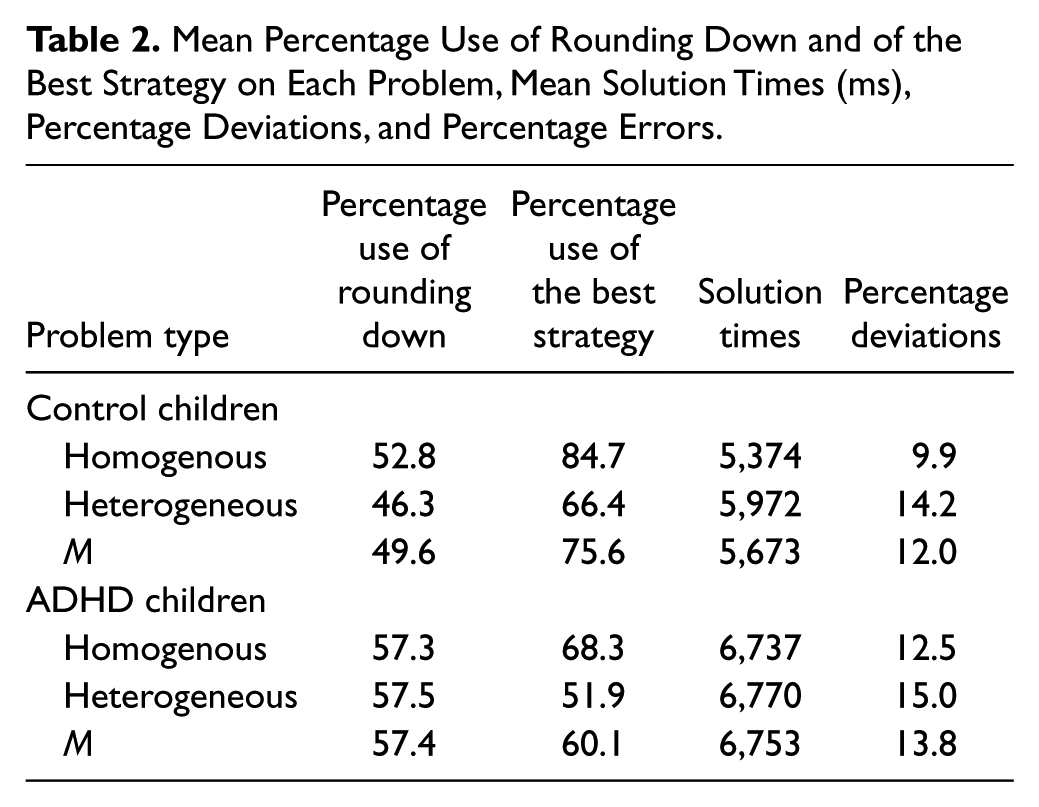
The main effect of the problem was significant on mean percentage deviations, F(1, 36) = 51.72, Mean square of error (MSe) = 4.24, p < .001, η p 2 = .590. Indeed, children provided better estimates when solving homogeneous problems (11%) than when solving heterogeneous problems (14%). Moreover, the main effect of group was significant, F(1, 36) = 9.64, MSe = 5.83, p = .004, η p 2 = .211, as control children (12%) provided better estimates than ADHD children (14%). The Group × Problem interaction was marginally significant, F(1, 36) = 3.61, MSe = 4.24, p = .07, η p 2 = .091. Although both groups of children provided better estimates on heterogeneous than on homogeneous problems, the heterogeneous–homogeneous difference was larger in control children, 4.3%, t(18) = 8.64, p < .001, than in ADHD children, 2.5%, t(18) = 3.11, p = .006.
Regarding solution times, the only effect that came out significant in analyses was the Group × Problem interaction effect, F(1, 36) = 6.36, MSe = 238,480, p = .016, η p 2 = .15. Control children were faster when solving homogeneous problems as compared with when solving heterogeneous problems (5,374 ms vs. 5,972 ms), t(18) = −4.34, p < .001. ADHD children took an equal amount of time to estimate homogeneous and heterogeneous problems (6,737 ms vs. 6,770 ms; t < 1).
Finally, we rerun these analyses on performance restricted to problems where children used the best strategy to more stringently test group differences in strategy execution. Analyses of mean percentage deviations on those problems for which children chose the best strategy revealed a main effect of problem, F(1, 36) = 1601.83, MSe = 0.254, p < .001, η p 2 = .978, but no main effect of group or Problem × Group interaction (Fs < 1). Mean percentage deviations were the same in control children (10.0%) and in ADHD children (10.1%). Corresponding analyses on solution times showed a significant main effect of problem, F (1, 36) = 4.68, MSe = 342,294, p = .037, η p 2 = .115. Although control children were faster (5,603 ms) than were children with ADHD (6,713 ms), effects of Group, F(1, 36) = 3.32, MSe = 342,294, p = .08, and Problem × Group interaction (F < 1) were not significant.
Group Differences in Strategy Use
Analyses of strategy use had two goals. First, we determined whether individuals accomplished this task with only one strategy or with both strategies and compared strategy use in each group on homogeneous and heterogeneous problems. Second, we examined group differences in selecting the best strategy on each problem.
As can be seen in Table 3, all individuals, but one ADHD child and one control child, used both the rounding-down and the rounding-up strategies. There were only one ADHD child and one control child who could be considered single-strategy users (i.e., participants who used one of the two strategies on more than 95% of problems).
Distributions of strategy use across participants and items.

Note. Each entry in the participant-based analyses represents the percentage of participants using the rounding-down strategy on less than 26%, between 26% and 50%, between 51% and 75%, and more than 75% of problems. For example, 68.3% of control children used the rounding-down strategy on between 26% and 50% of problems. Each entry in the problem-based analyses represents the percentage of items solved with the rounding-down strategy by less than 26% of participants, between 26% and 50% of participants, between 51% and 75%, and by more than 75% of participants. For example, 42% of problems were solved with the rounding-down strategy by between 26% and 50% of ADHD children.
Mean percentage use of the rounding-down strategy and mean percentage use of the best strategy (see Table 2) were analyzed with 2 (group: control, ADHD children) × 2 (problem type: homogeneous, heterogeneous), with group as a between-participant factor. Children used rounding down on 54% of trials, and used it more often on homogeneous problems than on heterogeneous problems (55% vs. 52%), F(1, 36) = 4.88, MSe = 189.74, p = .034, η p 2 = .12. Moreover, as the Group × Problem Type interaction showed, F(1, 36) = 5.55, MSe = 38.86, p = .024, η p 2 = .13, ADHD children used rounding down equally often on homogeneous and heterogeneous problems (57%, t < 1), whereas control children used it more often on homogeneous problems than on heterogeneous problems (53% vs. 46%), t(18) = −2.65, p = .016.
Analyses of mean percentage use of the best strategy on each problem showed main effects of group, F(1, 36) = 10.86, MSe = 418.8, p = .002, η p 2 = .23, and of problem type, F(1, 36) = 29.75, MSe = 192.65, p < .001, η p 2 = .45. Control children (76%) selected the best strategy on each problem more often than did ADHD children (60%), and both groups selected the best strategy more often while solving homogeneous problems (77%) than while solving heterogeneous problems (59%). We also run a discriminant analysis to check group assignment (grouping variable: ADHD, control) with mean percentage use of best strategy as an independent variable. The percentage use of best strategy was a significant predictor, λ = .768, χ(1) = 9.36, p = .002. In all, 6 out of 19 (31%) ADHD children were better categorized as obtaining a performance similar to the control group and 6 out of 19 control children a performance more similar to the ADHD group. Moreover, the newly obtained categorization significantly correlated with the SDAI Inattention subscale, rpb(36) = .41, p = .009, but not with the Hyperactivity subscale, rpb(36) = .26, p = .11. This result suggests that performance in strategy selection is mainly related to attentional resources, which are differently available in controls and ADHD characteristics children.
Group Differences in the Determiners of Best Strategy Selection
The goals of these analyses were to (a) examine correlations between mean percentage use of the best strategy on each problem and problem features in control and ADHD children and (b) determine which problem feature is the best predictor of mean percentage use of the best strategy and whether this predictor is the same in each group of children.
First, problem-based correlations in each group were calculated between mean percentages of the best strategy on each problem and the following problem features: (a) side of the larger operand (Left = 1; Right = 0), (b) sum of unit digits (e.g., 9 for 37 + 42), (c) relative strategy efficacy: mean percentage deviations between correct sums and estimates with rounding up – mean percentage deviations between correct sums and estimates with rounding down (e.g., 2.5% for 37 + 42), and (d) correct sums (e.g., 79 for 37 + 42). The correlation matrix is presented in Table 4.
Correlation Matrix for Problem Features and Percentage of Best Strategy Selection Separated for the Two Groups.

p < .05. **p < .01.
In control children, mean percentage use of the best strategy correlated only with relative strategy accuracy, r(98) = .54, p < .001, such that children selected the best strategy more and more often as difference in relative strategy accuracy increased. In ADHD children, mean percentage use of the best strategy correlated with relative strategy accuracy, r(98) = .38, p < .001, and with sum of unit digits, r(98) = .37, p < .001. ADHD children selected the best strategy more and more often as difference in relative strategy accuracy increased and more and more often as the sum of unit digits decreased.
These results were confirmed in stepwise regression analyses conducted separately in each group to determine which problem feature best predicts the mean percentages of use of the best strategy on each problem. Results showed that the best and unique predictor of control children’s use of the best strategy was relative strategy efficacy (R2 = .29). In ADHD children, the best predictor was also relative strategy efficacy, although it predicted smaller amount of variance as compared with control children (R2 = 14). Sum of unit digits accounted for 13% additional unique variance in ADHD children’s percentage use of the best strategy.
Finally, as shown in Figure 1, there was a significant correlation between children’s use of the best strategy on each problem and mean solution times in control children, r(98) = −.47, p < .001, but not in ADHD children, r(98) = −.05,p = .649.
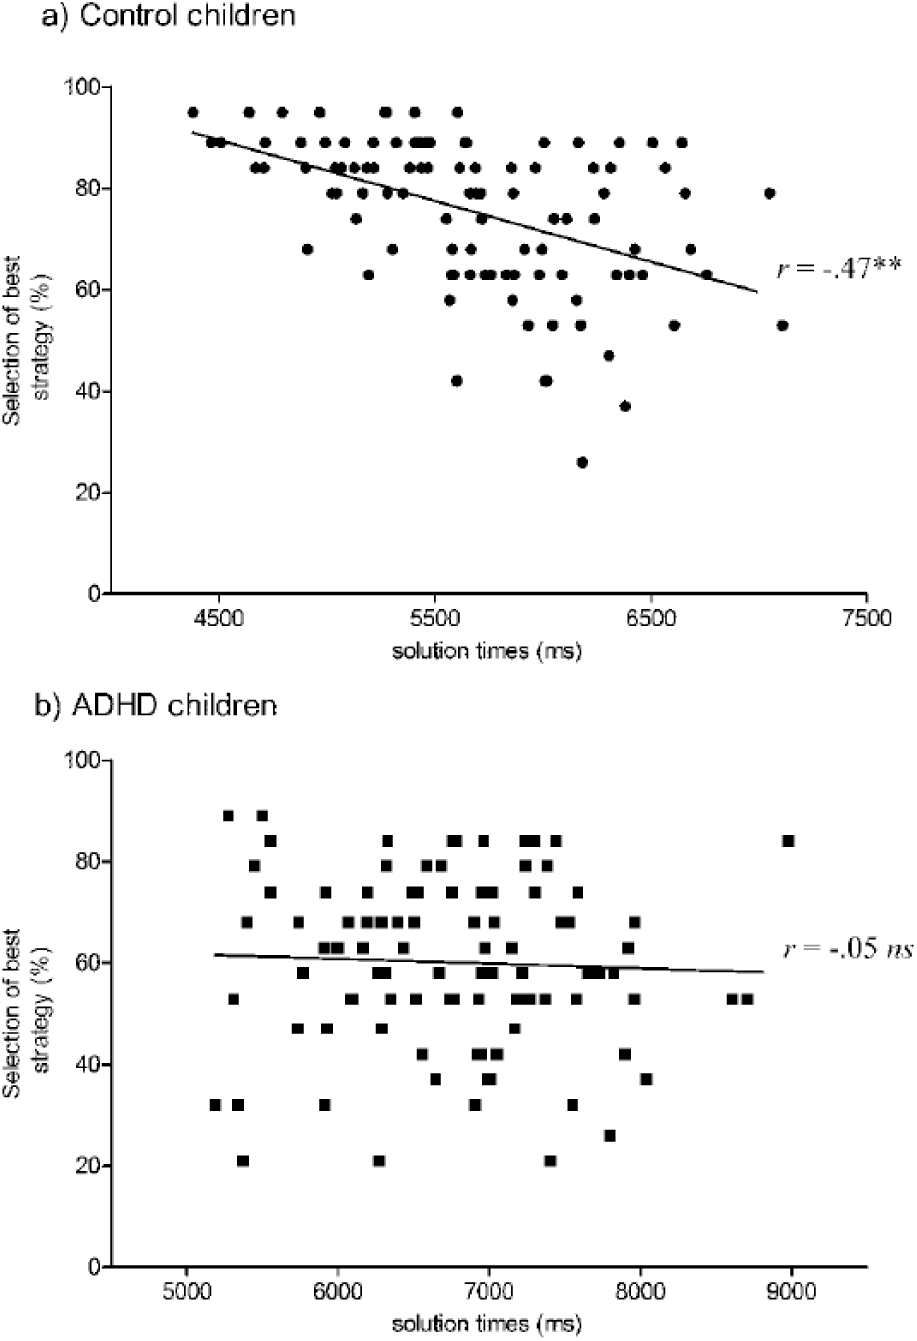
Correlations between children’s use of the best strategy and mean solution times on each problem.
General Discussion
This study on ADHD strategy selection used a strategy assessment method that allowed the identification of which strategy children chose among two available strategies on each problem. It rests on the idea that a better understanding of ADHD’s cognitive performance will be gained by investigating strategic aspects of children’s performance. The main results of the present arithmetic problem-solving experiment showed that ADHD children selected the best strategy on each problem less often than control children and that they based their strategy choices on different factors, despite comparable levels of math proficiency. Although children of our ADHD sample did not undergo a formal diagnosis of ADHD, performance on the selection of the best strategy validly discriminated between control and ADHD characteristics children. Moreover, this performance-based categorization significantly correlated with teacher’s report of inattentive behaviors suggesting the dimensional nature of the ADHD symptomatology, which can vary along a continuum between normal condition and disorder. These findings have important implications for understanding the sources of differences in cognitive performance between control and ADHD children and for investigating strategic aspects of ADHD’s cognitive performance.
Previous research has found differences between control and ADHD children’s arithmetic performance (e.g., Lucangeli & Cabrele, 2006). As ADHD children’s difficulties in mathematics are often correlated with general learning or mathematics difficulties, it is hard to isolate component processes specifically affected in ADHD children. By testing a group of ADHD children who had no specific math difficulties, we were able to observe that ADHD children were less able than controls to select the best strategy on each problem. These less-efficient strategy selections led ADHD children to provide poorer estimates than control children. This cannot be due to lower levels of calculation skills, because ADHD and control children obtained comparable performance on problems for which they had selected the best strategy. When performance was compared across all trials (i.e., including problems for which the best strategy was used and problems for which the best strategy was not used), ADHD children obtained poorer performance than did control children. Thus, poorer strategy selection is one source of the lower level of arithmetic performance in ADHD children.
The present findings on differences between ADHD and control children in strategy selection are consistent with previous findings showing that ADHD children are less likely to use efficient strategies when they are not guided to do so (Cornoldi et al., 1999; Hamlett et al., 1987; O’Neill & Douglas, 1991, 1996). This suggests that poor strategy selection may hold across several cognitive domains and may be a general feature of ADHD children’s cognition. Future research testing other cognitive domains, where strategic aspects have already been documented in children (e.g., reasoning, decision making, language processing, attention; see Siegler, 1996, for an overview), will determine how general difficulties in best strategy selection are in ADHD children.
Why did ADHD children select the best strategy less often than control children? One possibility that the present data rule out concerns differences between ADHD and control children’s systematicity of best strategy selection. ADHD children could have made poorer strategy selections because they were not systematic in their strategy selections, chose more or less randomly, or had selected a strategy with some rules for all problems or series of problems (e.g., using rounding down in the first block of problems and rounding up in the second block) before starting the experiment. On the contrary, both control and ADHD children selected strategies on a problem-by-problem basis and were relatively systematic in their strategy choices. Consistent with this, stepwise regression analyses predicting mean percentage use of the best strategy revealed that both groups of children differed on the type of predictors but not on the amounts of variance accounted for.
Two hypotheses can be proposed to explain why ADHD children selected the best strategy less often than control children. First, ADHD children have poorer memory associations between problems and strategies. Computational models of strategy selection (e.g., Lovett & Anderson’s, 1996, The Adaptive Control of Thought - Rational (ACT–R) model; Lovett & Schunn’s, 1999, Represent the task, Construct a set of action strategies consistent with the task representation, Choose from among those strategies according to their success rates, and Learn new success rates for the strategies based on experience (RCCL; pronounced “ReCyCLe”) model; Payne, Bettman, & Johnson’s, 1993, adaptive decision maker model; Rieskamp & Otto’s, 2006, Strategy Selection Learning (SSL) model; and Siegler & Araya’s, 2005, Strategy Choice and Discovery Simulation (SCADS)2 model) all assume that each problem is associated in memory with several strategies. They also assume that each problem is more strongly associated with one (usually the best) strategy that is most often selected. In other words, to solve a given problem, computational models assume that all available strategies in the repertoire become active, and the most efficient strategy is selected. They also share the assumption that all strategies have utilities in the sense of being associated to speed, accuracy, and cognitive effort or resources required for execution. These utilities vary with experience and influence strategy selection. In this context, ADHD children would be poorer at strategy selection because they have weaker associations between a given problem and the best strategy to solve it. In the present context of computational estimation, this would mean that ADHD children would have weaker associations between small-unit problems (e.g., 42 + 73) and rounding-down strategy and between large-unit problems (e.g., 67 + 48) and rounding-up strategy. The fact that, in contrast to control children, the percentage use of the best strategy did not vary with the type of problems in ADHD children is consistent with this possibility. That different sets of variables predicted ADHD and control children’s best strategy selection is also consistent with this hypothesis of poorer problem–best strategy associations in ADHD children. Poorer problem–best strategy associations would not enable ADHD children to systematically activate the best strategy while encoding arithmetic problems with sufficient strength. In turn, this would lead them to most often choose the alternative rounding-down strategy even when the rounding-up strategy was the best on individual problems. As argued elsewhere by several researchers (e.g., LeFevre et al., 1993; Lemaire & Lecacheur, 2002), rounding down is easier to execute than rounding up more or less independently of problem–strategy associations. Indeed, as compared with rounding up, when they use rounding down, participants do not need to encode units, do not have to calculate differences between unit digits and the closest larger decades, do not need to execute it with decade digits stored in working memory as decade digits are displayed on the computer screen, and add smaller numbers. Note that using rounding-down strategy was negatively correlated with mean percentage use of the best strategy, r(36) = −.37, p < .05, as children using the best strategy less often were those children who used the easier, rounding-down strategy most often. By testing children’s knowledge of which strategy is the best on each problem, without having to execute strategies (i.e., asking them to only select strategies on each problem), like Lemaire et al. (2004) did, future studies might more directly examine the role of problems–strategies associations on differences in best strategy selection between ADHD and control children.
The second, nonexclusive, possibility underlying ADHD children’s poorer strategy selection is less-efficient EF. Previous research reported impaired EFs in ADHD children (e.g., Barkley, 1997; Castellanos et al., 2006; Martinussen et al., 2005; Nigg, 2001; Sergeant et al., 2002). Moreover, recent findings showed that EFs influence strategy selections and mediate age-related differences in mean percentage use of the best strategy on each problem (Hodzik & Lemaire, 2011; Lemaire & Lecacheur, 2011). Impairment of EFs may affect strategy selection via a number of mechanisms, two of which could be strategy flexibility and attention during problem encoding. Lower levels of strategy flexibility might lead ADHD children to be poorer at selecting the best strategy on each problem if they use the same (easier) strategy more often than controls (which they did in this experiment) and/or if they repeat the same strategy across consecutive trials. As preliminary data, in the present experiment, we calculated mean percentage strategy repetitions (i.e., each problem was coded 1 if the participant repeated the same strategy on this problem as on the previous problem and 0 otherwise, excluding the first problem). ADHD children tended to repeat the same strategy across consecutive problems more often than control children (64% vs. 54%), t(36) = 1.82, p = .07. Another way for impaired EFs to influence strategy selection in ADHD is via poor problem feature encoding due to inattention during problem encoding. Inattention during problem encoding can lead ADHD to not (or to poorly) encode crucial problem features that guide the selection of the best strategy on each problem. For example, ADHD children might not process deeply enough size of unit digits while encoding operands. For a small-unit problem like 62 + 36, they might not process unit digits deeply enough (e.g., and note that the sum of unit digits is smaller than 10) so as to select the best, rounding-down strategy. This is important as adequately encoding distinctive problem characteristics is crucial to best strategy selections.
In conclusion, this work illustrates the usefulness of a strategy approach to further our understanding of sources of differences in cognitive performance between ADHD and control children. By finding that ADHD children were poorer than control children at selecting the best strategy on each problem, that each group based their strategy choices on different problem features, that both groups of children had comparable performance when they use the best strategy, and that ADHD had poorer performance because of poorer strategy selection, the present study points to the need to investigate in detail how ADHD children accomplish cognitive tasks (i.e., what strategy repertoire do they use in different cognitive tasks). These findings also point to the need to investigate other strategic aspects of cognitive performance (i.e., strategy execution and strategy selection) if we want to precisely describe and explain in mechanistic terms differences in cognitive performance between ADHD and control children.
Limitations
This study found that performance-based categorization in best strategy selection significantly correlated with teacher’s report of inattentive behaviors. Despite this evidence, the present lack of a formal clinical diagnosis for our ADHD group limits the full generalization of our findings to the ADHD clinical population. Indeed, it is possible that some of our ADHD children present a less severe symptomatology than formally diagnosed ADHD children. Thus, we cannot exclude that diagnosed ADHD children may show a different pattern of performance in the computational estimation task. The present findings suggest that formally diagnosed ADHD children may experience even greater difficulties in best strategy selection, a prediction that future research may test. The present findings also suggest potential interindividual differences among ADHD children, with higher level of ADHD leading to poorer strategy selections than less severe ADHD. Therefore, future research including a more formal diagnostic procedure with a larger sample might reveal interesting differences between ADHD subtypes. Different ADHD subtypes, correlated with different cognitive profiles, including different levels of efficiency of EFs, may be associated with varying levels of proficiency in best strategy selection. Future research could also directly test this hypothesis of the mediating role of poorer EFs in the differences between control and ADHD children’s strategy selection. As previous works found that individuals with ADHD have impairments in EFs like inhibition (e.g., Nigg, 2001; Pennington & Ozonoff, 1996), shifting (e.g., Oades & Christiansen, 2008; van Mourik, Oosterlaan, & Sergeant, 2005), and sustained attention or working memory (Pasini, Paloscia, Alessandrelli, Porfirio, & Curatolo, 2007; Solanto et al., 2007), three functions presumably involved in best strategy selection, future works might determine which specific EFs are crucial to explain ADHD children’s poorer strategy selection.
Finally, it would be of interest to determine whether ADHD is associated with poorer strategy selection in cognitive domains other than arithmetic problem solving. Indeed, in many cognitive domains, children’s performance is heavily determined by the type of strategy they choose, how they execute strategies, and their skills at selecting the best strategy on each item (see Siegler, 2007, for an overview). Poorer strategy selection in ADHD may be found in many cognitive domains and may correlate across cognitive domains, a series of predictions that future research will test.
Footnotes
Declaration of Conflicting Interests
The author(s) declared no potential conflicts of interest with respect to the research, authorship, and/or publication of this article.
Funding
The author(s) received no financial support for the research, authorship, and/or publication of this article.