
Abstract
Children with full blown or subtypes of ADHD (American Psychiatric Association, 1994) and “subthreshold” or “broader phenotype” ADHD (with symptoms not prominent enough to fulfill the diagnostic criteria; that is, similar but milder ADHD problems; American Academy of Pediatrics, 1997) have been found to be at risk for developmental delay, family dysfunction, lower overall cognitive functioning in terms of average results on standard measures of intelligence, and psychiatric comorbidity (Hoza, 2007; Loe & Feldman, 2007; Scahill et al., 1999; Warner-Rogers, Taylor, Taylor, & Sandberg, 2000).
Children with ADHD have difficulties in several scholastic domains, such as reading and mathematics, which are not merely accounted for by lower IQ scores (Gillberg et al., 2004; Spencer & Biederman, 2007). They perform poorer in school than typically developing controls, as evidenced by a higher frequency of grade repetitions, placements in special classes, and need of tutoring, as well as lower average grades in academic disciplines (Biederman et al., 1996; Loe & Feldman, 2007; Spencer & Biederman, 2007). Based on a review, Daley and Birchwood (2010) concluded that symptoms of inattention and hyperactivity-impulsivity in preschoolers are associated with impaired reading achievement in adolescence and poor long-term academic achievement. Early recognition of ADHD followed by effective interventions improves the educational and social outcomes of affected children (Biederman & Faraone, 2005; Jones, Daley, Hutchings, Bywater, & Eames, 2008; Kadesjö, 2002; Rasmussen & Gillberg, 2000). Screening instruments designed for the general population are crucial to identify children with ADHD, subthreshold ADHD, or symptoms of ADHD who are at risk for school failure, and thus in need of special educational support.
Screening of children at school entry as well as repeated health checkups throughout elementary school have been recommended as part of school health surveillance for early detection of developmental or behavioral problems (Hall & Elliman, 2003; Swedish National Board of Health and Welfare, 2004). In Sweden, however, no special method has been suggested (Swedish National Board of Health and Welfare, 2004).
The Conners 10-item scale (Conners, 1973, 1990a) is a commonly used screening instrument for hyperactive, inattentive, and impulsive behaviors in children (Rowe & Rowe, 1997; Ullmann, Sleator, & Sprague, 1985). An association of a diagnosis of ADHD (categorical approach) in Grade 4 (age 10 years) and poor academic outcome in Grade 9 (age 16 years) using the short Conners version has been previously reported in a Swedish population (Ek, Westerlund, Holmberg, & Fernell, 2011). Herein, ADHD was associated with lower mean grades, and attainment of the required learning outcomes in Swedish and English languages, as well as mathematics compared with children without ADHD. Nevertheless, dimensional ADHD research using the whole symptom range in the general population may provide further clarification of the relationship between hyperactivity, impulsivity, inattention in childhood, and a school outcome in later adolescence. In this study, we decided to assess the efficiency of a behavioral screening with the Conners 10-item scale (parent and teacher report) at ages 7 and 10 years to predict academic outcomes at age 16 years in a population-based cohort of Swedish first and fourth graders in a suburb of Stockholm. Because of economic constraints, there is a need of developing a brief screening instrument being efficient in the Swedish school context. Our aims were to examine the predictive power of total Conners score as well as individual items on the Conners 10-item scale to identify which items can serve as the screening questions for further difficulties in school performance at age 16 years.
Method
Participants
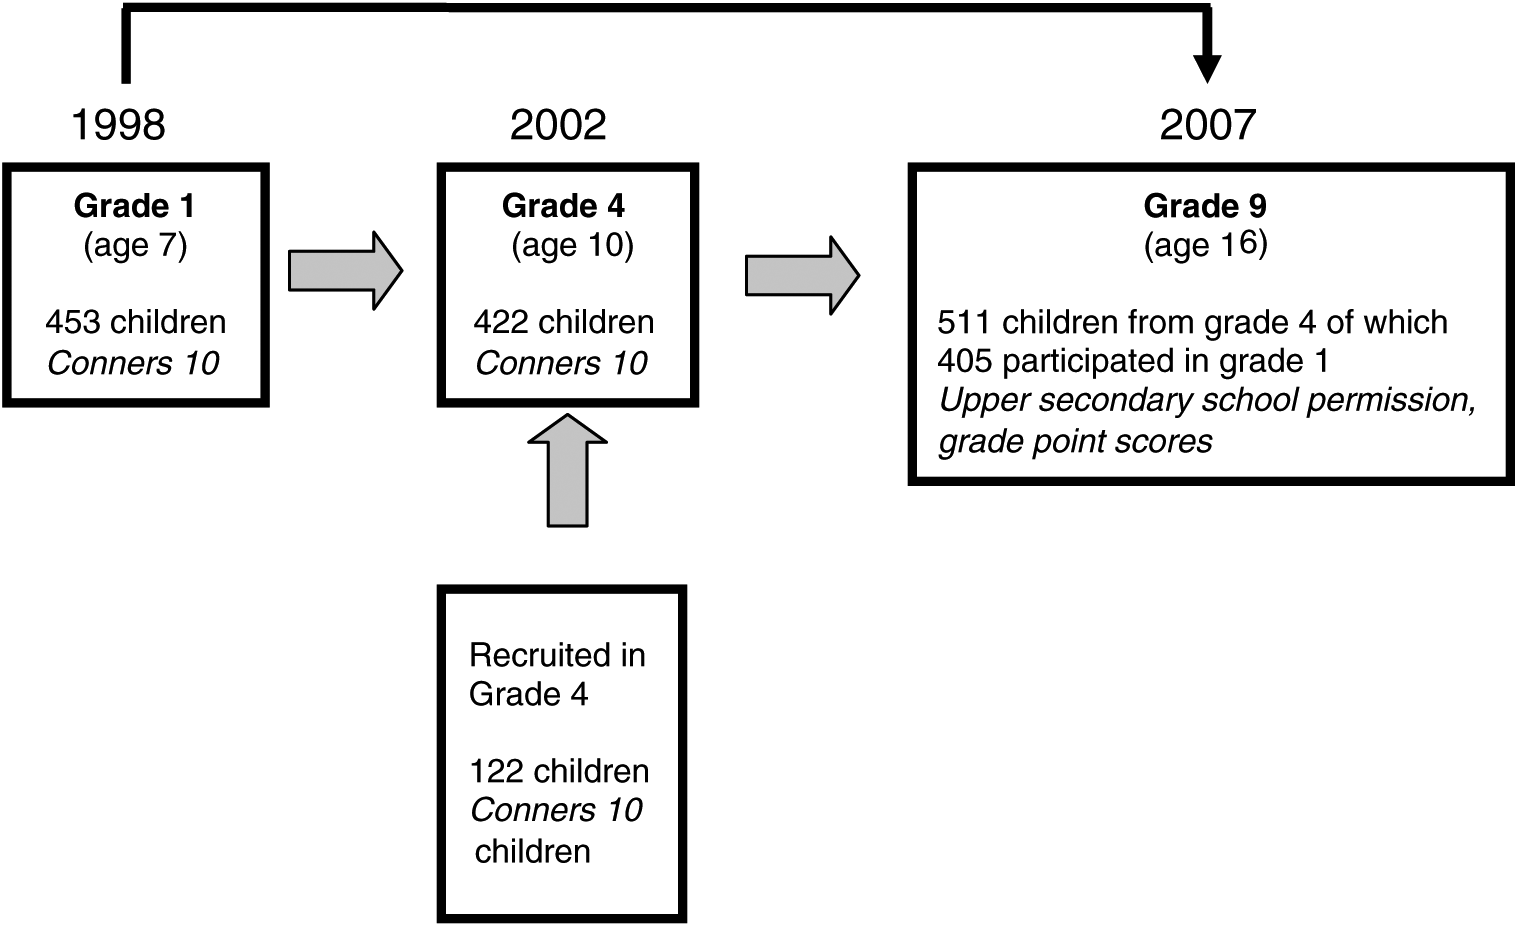
This study is based on three data collections in the 1991 birth cohort of Sigtuna, a municipality in Stockholm County, with a total population of approximately 36,000 inhabitants, and a moderately lower socioeconomic environment than the country of Sweden on average in terms of education, single parent households, and the proportion of individuals with immigrant background (Figure 1).
Cohorts and longitudinal assessments.
All schools in the municipality, including special education classes, participated in the data collection. The special education classes included children with intellectual disabilities, autistic spectrum disorders, and disruptive behavior problems. The school system in the municipality of Sigtuna is similar to the systems in most Swedish communities, with a preponderance of community-run schools with mainstream teaching methods. According to the National School Register (2010), 86.3% of children (n = 497) leaving compulsory school in Grade 9 in Sigtuna, June 2007, were qualified for further studies and the mean grade point average (mean value of all final grades in ninth grade) was 198.3, compared with 89.1% (n = 125,620) and 207.3, respectively, in the whole country.
The complete 1991 birth cohort in Sigtuna comprised 536 children when this study started. The data were collected in 1998 when the children entered first grade at age 7 years. The response rate from teachers and parents in first grade was 84.5% (n = 453 children). A second data collection was carried out among the complete cohort in 2002 when the children were in fourth grade. The waves were separate, so that nonresponders from Wave 1 in 1998 were still eligible for participation in 2002. Children moving into the cohort between first and fourth grades were also included in the total cohort in fourth grade (n = 591). In the second collection, data were obtained from teachers and parents of 92% (n = 544) of the cohort. A total of 79% (n = 422 children) of the entire population born in 1991 (204 girls, 218 boys) had even participated in Grade 1. At age 16 years, in Grade 9 (year 2007), final secondary school results for these children were obtained from the National Swedish School Register. Children for whom there was information from at least three data sources were included in the final study population: (a) the parent and (b) the teacher Conners ratings in Grade 1 or 4, and (c) the national register in Grade 9 (final grades).
Final grades at age 16 years were available for n = 511 (87%) of the total population (n = 591) in Grade 4. In 33 children participating in Grade 4, no grades were available: 11 children had moved and had not received grades that were traceable in the national register, 4 had retaken one grade and were in eighth grade, 7 had joined a school for the mildly mentally retarded (IQ < 70), 1 was already in upper secondary school, and 10 had failed to graduate. Of the total population of 536 first graders studied in 1998, it was possible to obtain grades for 405 (76%) in 2007.
Children rated by parents and teachers in first or fourth grade for whom no register data in ninth grade were available (nonparticipants; n = 17 at age 7 years and n = 33 at age 10 years) did not differ from participants by gender (χ2 = 0.02, p = .88, and χ2 = 1.20, p = .27, in the first and fourth grades, respectively) or sociodemographic factors (maternal country of birth dichotomized as born in Sweden or born abroad, χ2 = 0.08, p = .76, at age 7 years and χ2 = 0.98, p = .32, at age 10 years; maternal educational level dichotomized as 0-9 or ≥10 years of schooling, χ2 = 0.01, p = .93, in Grade 1). However, low maternal education tended to be more prevalent among children participating in the study in Grade 4 but with no traceable final grades at age 16 years (χ2 = 4.36, p = .037). Nonparticipants in the final study population were reported to have higher parental and teacher Conners scores in first grade (ANOVA, parental score: F = 7.1, p < .01; teacher score: F = 4.9, p < .05) and in fourth grade (ANOVA, parental score: F = 7.3, p < .01; teacher score: F = 4.9, p < .05).
Procedure and Instruments
Ethical approval for the study in first and fourth grades was granted by the Ethics Committee at Karolinska Institutet, Stockholm, and the follow-up study was approved by the Regional Ethics Committee in Uppsala. The study was launched within a routine school health framework. In Sweden, the school health surveillance program includes health visits to the school nurse at the local school for all children in first grade at 7 years and in fourth grade at 10 years of age (Swedish National Board of Health and Welfare, 2004). In the context of this routine health examination, a questionnaire including the Conners 10-item scale (Conners, 1973, 1990a) was administered by the School Health Services to all parents and the children’s main teacher. The parental version also included some questions about the sociodemographic characteristics of the household.
The Conners 10-item scale is a commonly used well-validated screening instrument for hyperactivity, impulsivity, and inattention (Conners, 1973, 1990b). It consists of 10 statements regarding the child’s behavior rated on a 4-point Likert-type scale: 0 = not at all true, 1 = just a little true, 2 = pretty much true, and 3 = very much true with a possible total score of 30 (Conners, 1990a). The scale is obtained from the 10 items constituting the Hyperactivity Index (HI) from the longer versions of the Conners scales (Goyette, Conners, & Ulrich, 1978) and is also known as the Abbreviated Conners Rating Scales for parents (CPRS-HI) and teachers (CTRS-HI; Conners, 1990a), and as the Abbreviated Symptom Questionnaire–Parent/Teacher (ASQ-P/T; Conners, 1973, 1990b). The reliability has been studied by Goyette et al. (1978). In a previous study of Swedish 7- to 9-year-old children, Gustafsson et al. (2008) reported a parent–teacher agreement of 0.44. The internal consistency, measured by Cronbach’s alpha, was found to be .76 for parent ratings (n = 233) and .92 for teacher ratings (n = 248). In the present study population in Grade 4, the parent–teacher agreement was 0.51 (Westerlund, Ek, Holmberg, Näswall, & Fernell, 2009). The Cronbach’s alpha for parent ratings was .90 (n = 509) and for teacher ratings was .94 (n = 509). These results demonstrate a sufficient intercultural validity of the instrument. A score of 10 or more has been recommended to identify possibly impairing ADHD symptoms in Swedish culture (Kadesjö & Gillberg, 1998; Landgren, Pettersson, Kjellman, & Gillberg, 1996), whereas a score of 15 or higher has been the standard for selecting children with ADHD at a level of clinical concern (Jones et al., 2008; Rowe & Rowe, 1997; Ullmann et al., 1985).
In Grade 9 (age 16 years) the children’s school outcome was obtained using their final school grades registered in the National School Register. The register is administered jointly by the Swedish National School Administration and Statistics Sweden. It encompasses information on each individual’s educational achievement, that is, grades by topic as well as final grade point scores for all students graduating from the 9th year. The data from the National School Register (2010) are of high quality, and summary statistics are published regularly. In Sweden, 9 years at school are compulsory (ages 7-16 years). After finishing compulsory school, students receive an admission qualification calculated from 16 topics. The grade for each topic is defined as a 0, 10, 15, or 20 score. Therefore, the maximum total final grade score is 320 and is used as a criterion of selection for upper secondary school permission. To be permitted to upper secondary school at the time of the present study, a student needed to have attained a certificate in three core topics: Swedish and English languages, and mathematics. The grading level in each school is under national supervision by the Swedish School Authority through national tests in key topics. The final grade scores (quantitative) and permission information for further studies (qualitative) were collected from the registry for all students included in this study.
Data Analyses
Main effects of single parent/teacher Conners items on final grade scores were computed using general linear models (ANOVA; Tables 1 and 2, left). Effects of these variables as well as total Conners scores (parent and teacher report) on permission to upper secondary school (Tables 1 and 2, right; Tables 3 and 4, left) were analyzed using chi-square tests. Relationships between parents’ and teachers’ ratings (total Conners score) were assessed using Spearman’s rank correlation. Discriminant validity (value for school outcome classification) was analyzed by a receiver operating characteristics (ROC) analysis for not being permitted to upper secondary school versus being permitted. Area under the curve (AUC) with p values, sensitivities, and specificities for a total score of ≥10 on the Conners scale were calculated (Figures 2 and 3). In addition to sensitivity and specificity, positive predictive values and likelihood ratios (LRs) of total Conners score ≥10 were assessed (Table 3). Prediction of school outcome by Conners ratings at ages 7 and 10 years was calculated using stepwise multiple linear (for final grade point scores; quantitative outcome) and logistic regression models (for permission to upper secondary school; qualitative outcome), respectively, with single parent/teacher Conners items (rated as 2 = pretty much true or 3 = very much true) entered as predictors. Sensitivity, specificity, positive predictive values, and LRs of best predictors on the Conners scale regarding qualification for upper secondary school were determined (Table 4). Sensitivity, specificity, positive predictive values, and LR results are expressed with a 95% confidence interval (CI). All statistical analyses were carried out using the SPSS 17.0 software package for Windows, and an alpha level of 5% was adopted for all analyses. Power (1-beta) for all analyses was high for large and medium effects (>.99) and fair for small effects (>.60).
Crude Rates of Grade Point Average and Being Permitted to Upper Secondary School at End of Grade 9 by Screen-Positive Results in First Grade According to Parents’ and Teachers’ Ratings on Conners 10-Item Scale.

Note: CI = confidence interval.
Items are rated on a Likert-type scale with four categories: 0 = not at all, 1 = just a little, 2 = pretty much, and 3 = very much. Scores of 2 or 3 are considered to be screen positive.
Overall grade point average: possible range = 0 to 320.
Not receiving passing grades in mathematics, Swedish, and English.
Each item rated as score 2 or 3.
ANOVA: *p < .05. **p < .01. ***p < .001.
Chi-square analysis: #p < .05. ##p < .01. ###p < .001.
Crude Rates of Grade Point Average and Being Permitted to Upper Secondary School at End of Grade 9 by Screen-Positive Results in Fourth Grade According to Parents’ and Teachers’ Ratings on Conners 10-Item Scale.
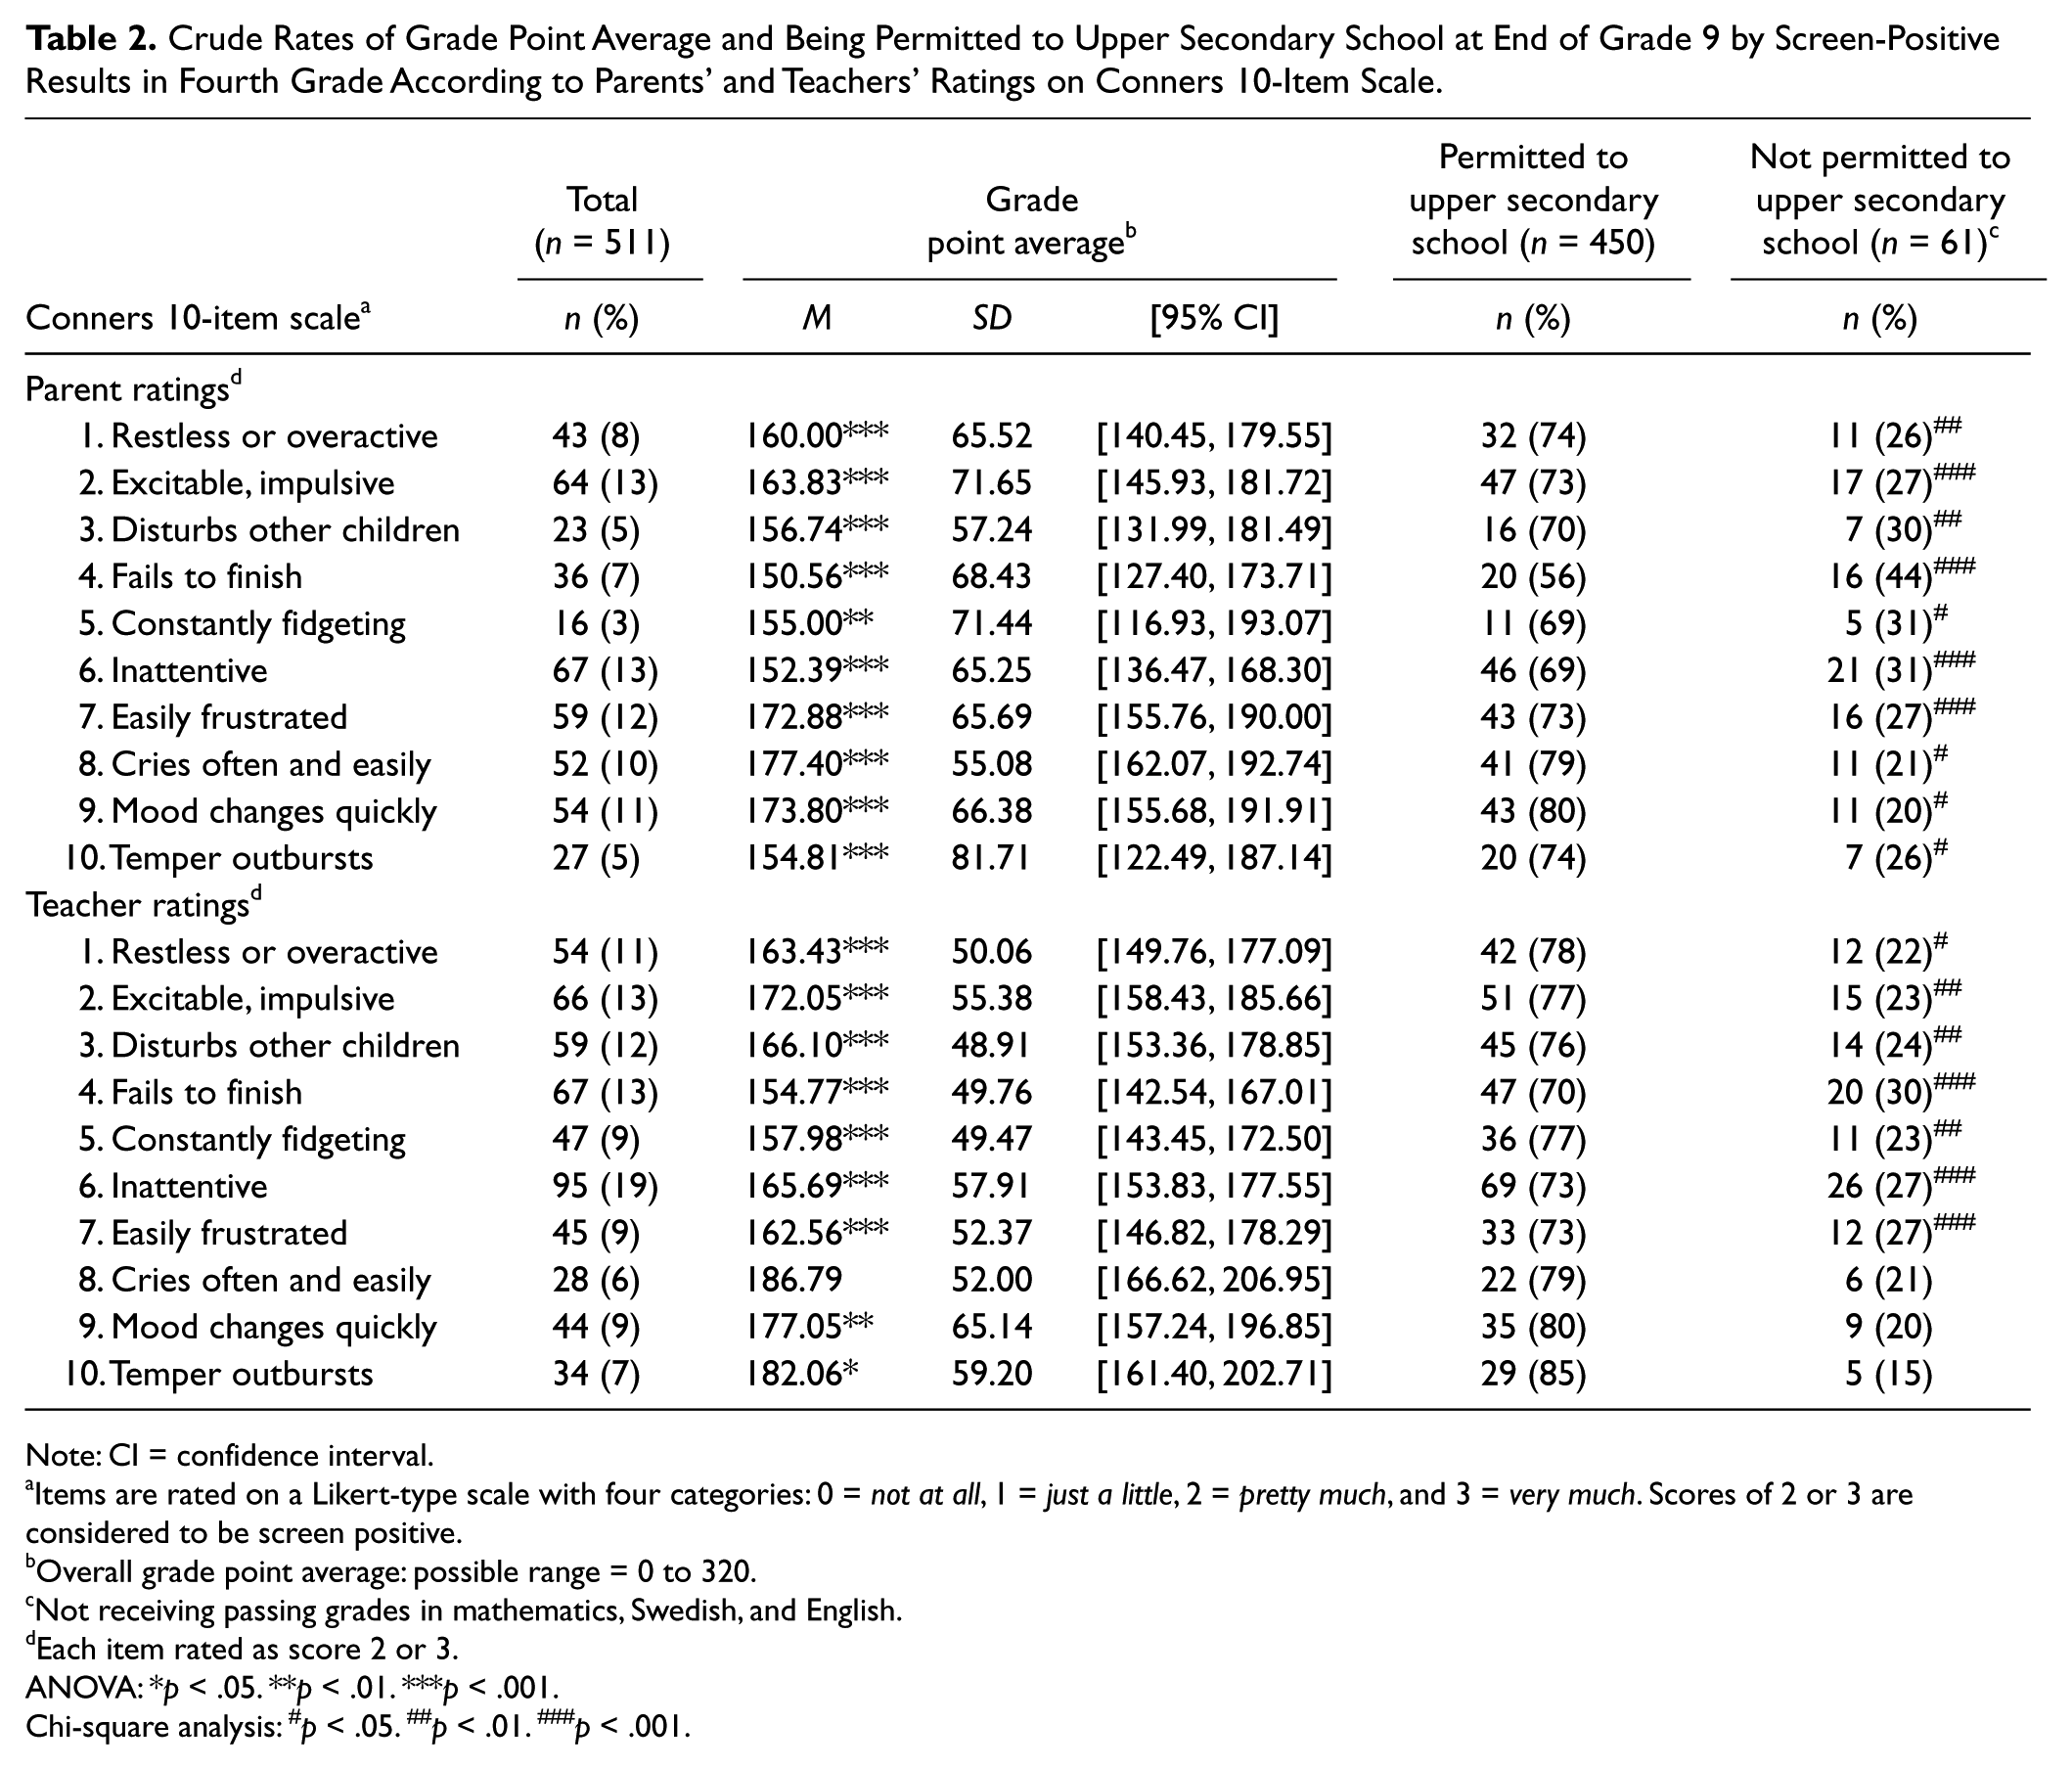
Note: CI = confidence interval.
Items are rated on a Likert-type scale with four categories: 0 = not at all, 1 = just a little, 2 = pretty much, and 3 = very much. Scores of 2 or 3 are considered to be screen positive.
Overall grade point average: possible range = 0 to 320.
Not receiving passing grades in mathematics, Swedish, and English.
Each item rated as score 2 or 3.
ANOVA: *p < .05. **p < .01. ***p < .001.
Chi-square analysis: #p < .05. ##p < .01. ###p < .001.
Crude Rates and Diagnostic Characteristics of Screen-Positive Results in First and Fourth Grades According to Parents’ and Teachers’ Ratings on Conners 10-Item Scale.
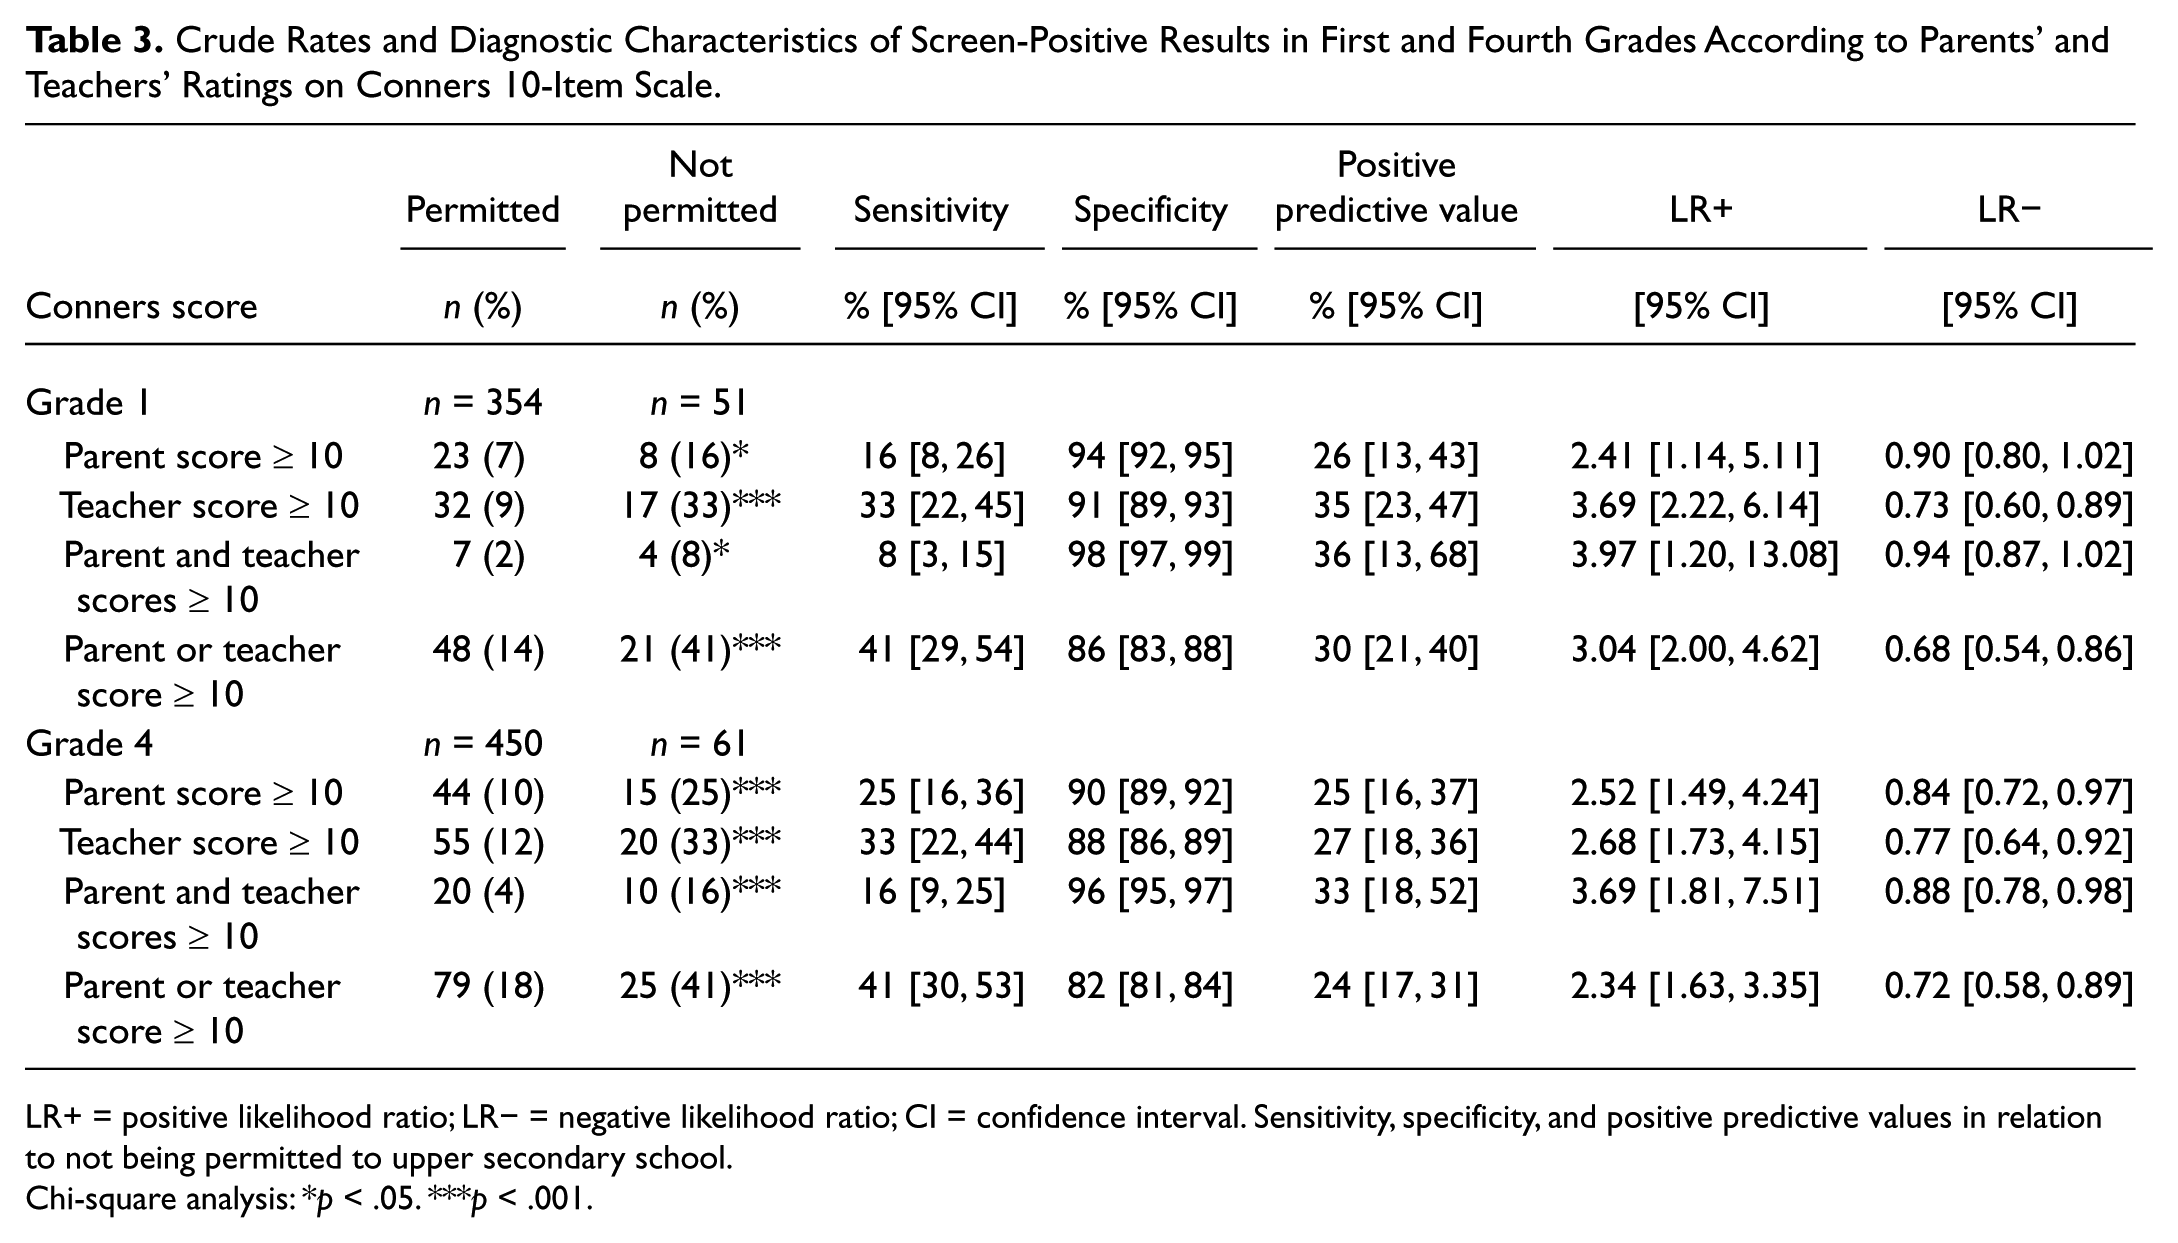
LR+ = positive likelihood ratio; LR− = negative likelihood ratio; CI = confidence interval. Sensitivity, specificity, and positive predictive values in relation to not being permitted to upper secondary school.
Chi-square analysis: *p < .05. ***p < .001.
Crude Rates and Diagnostic Characteristics of Screen-Positive Results in First and Fourth Grades According to Parents’ and Teachers’ Ratings on Discriminating Items on Conners 10-Item Scale.
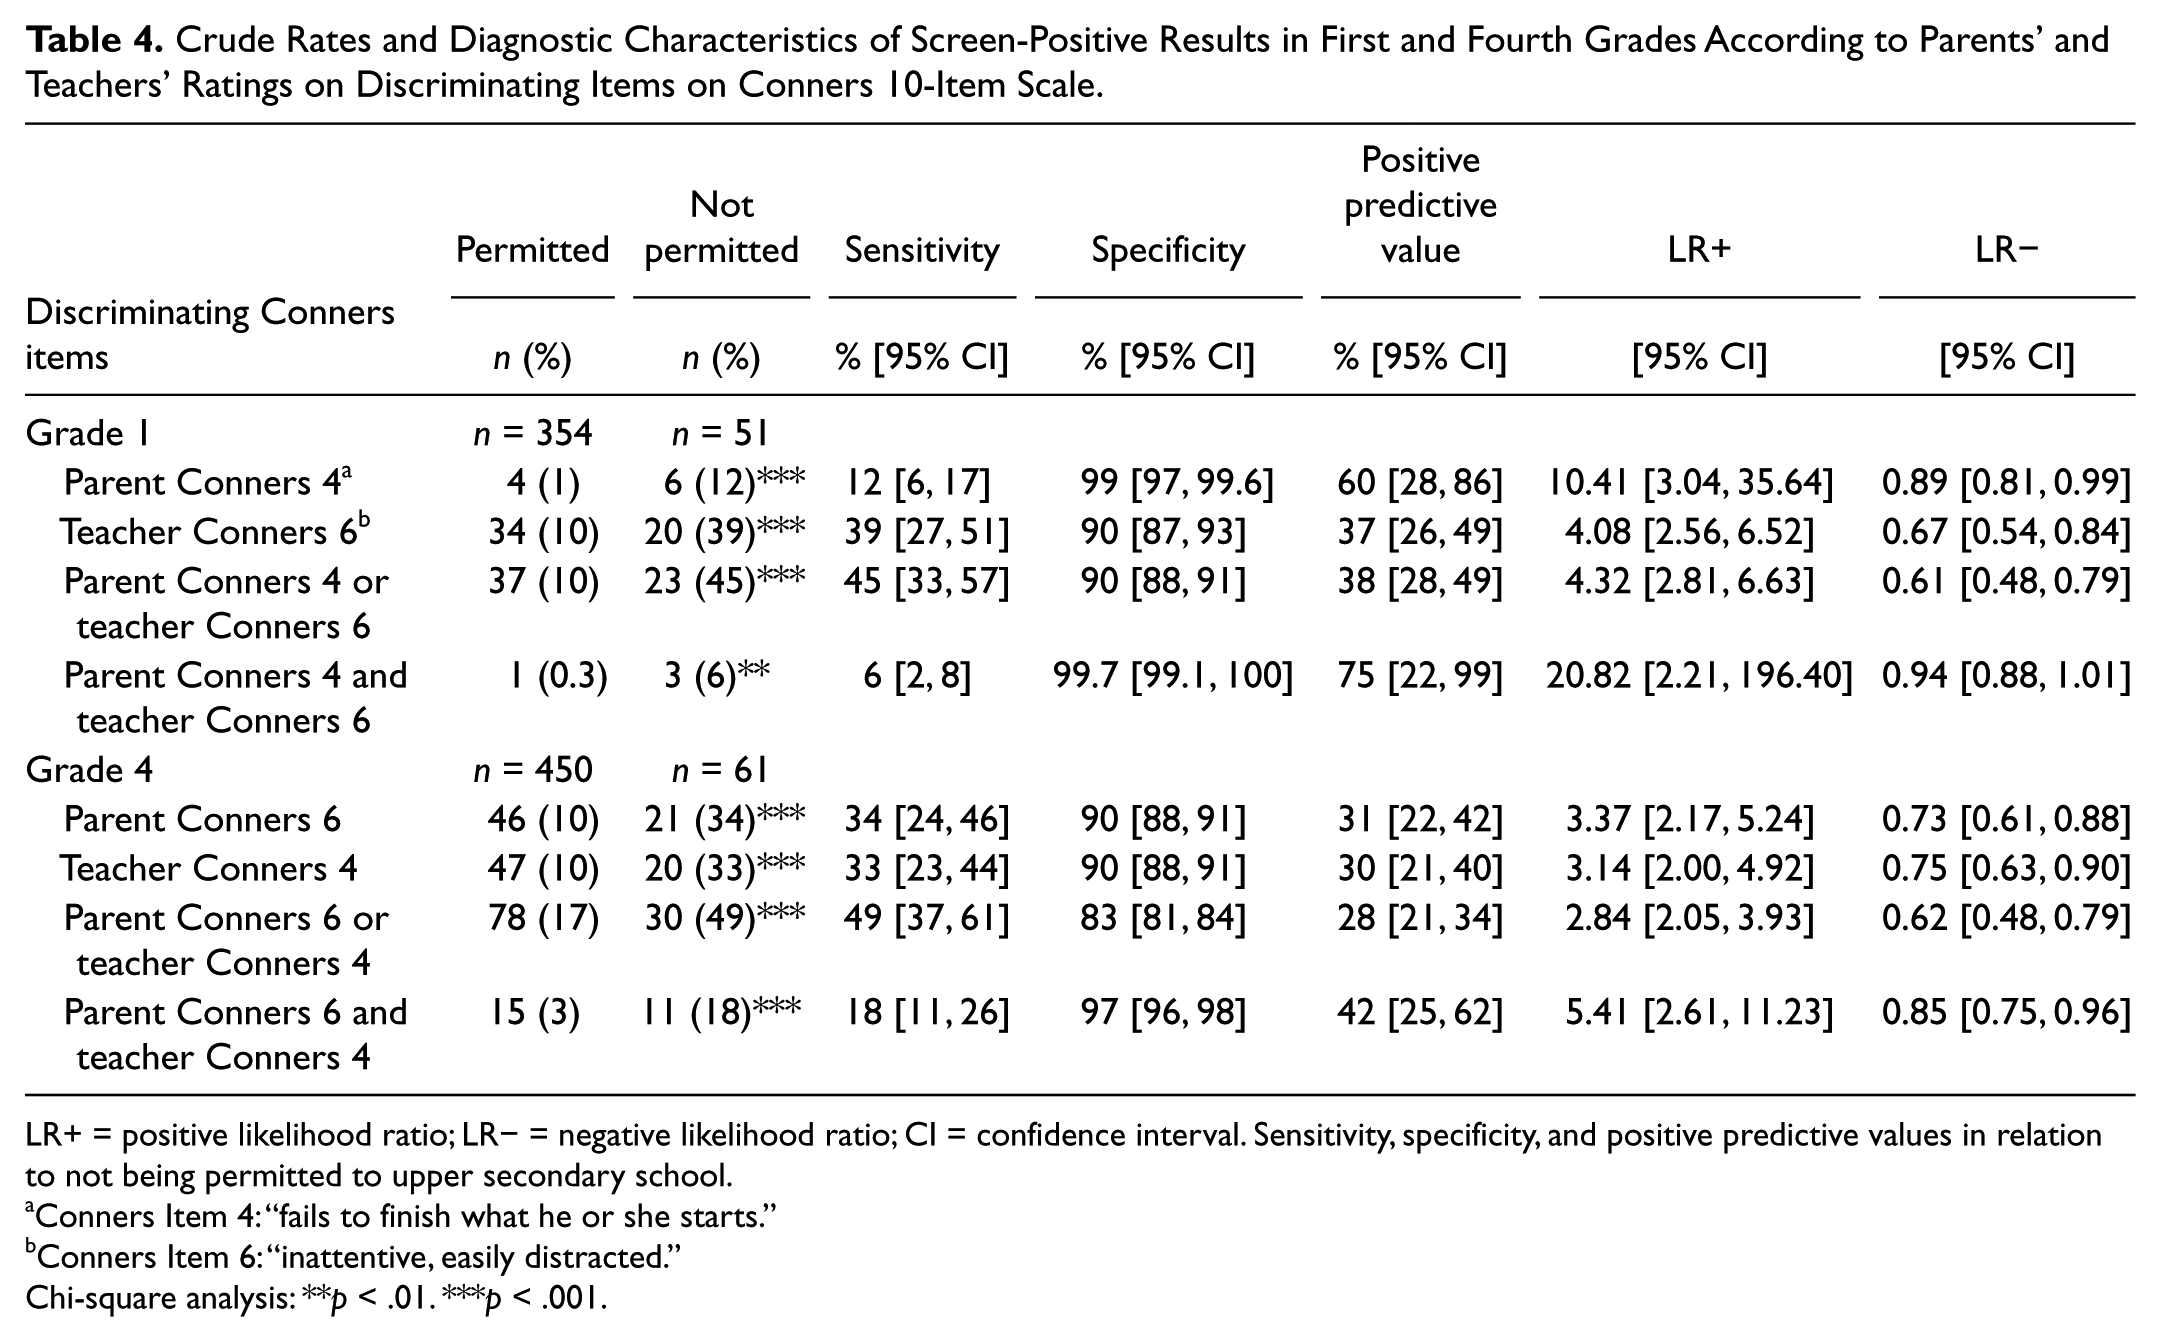
LR+ = positive likelihood ratio; LR− = negative likelihood ratio; CI = confidence interval. Sensitivity, specificity, and positive predictive values in relation to not being permitted to upper secondary school.
Conners Item 4: “fails to finish what he or she starts.”
Conners Item 6: “inattentive, easily distracted.”
Chi-square analysis: **p < .01. ***p < .001.
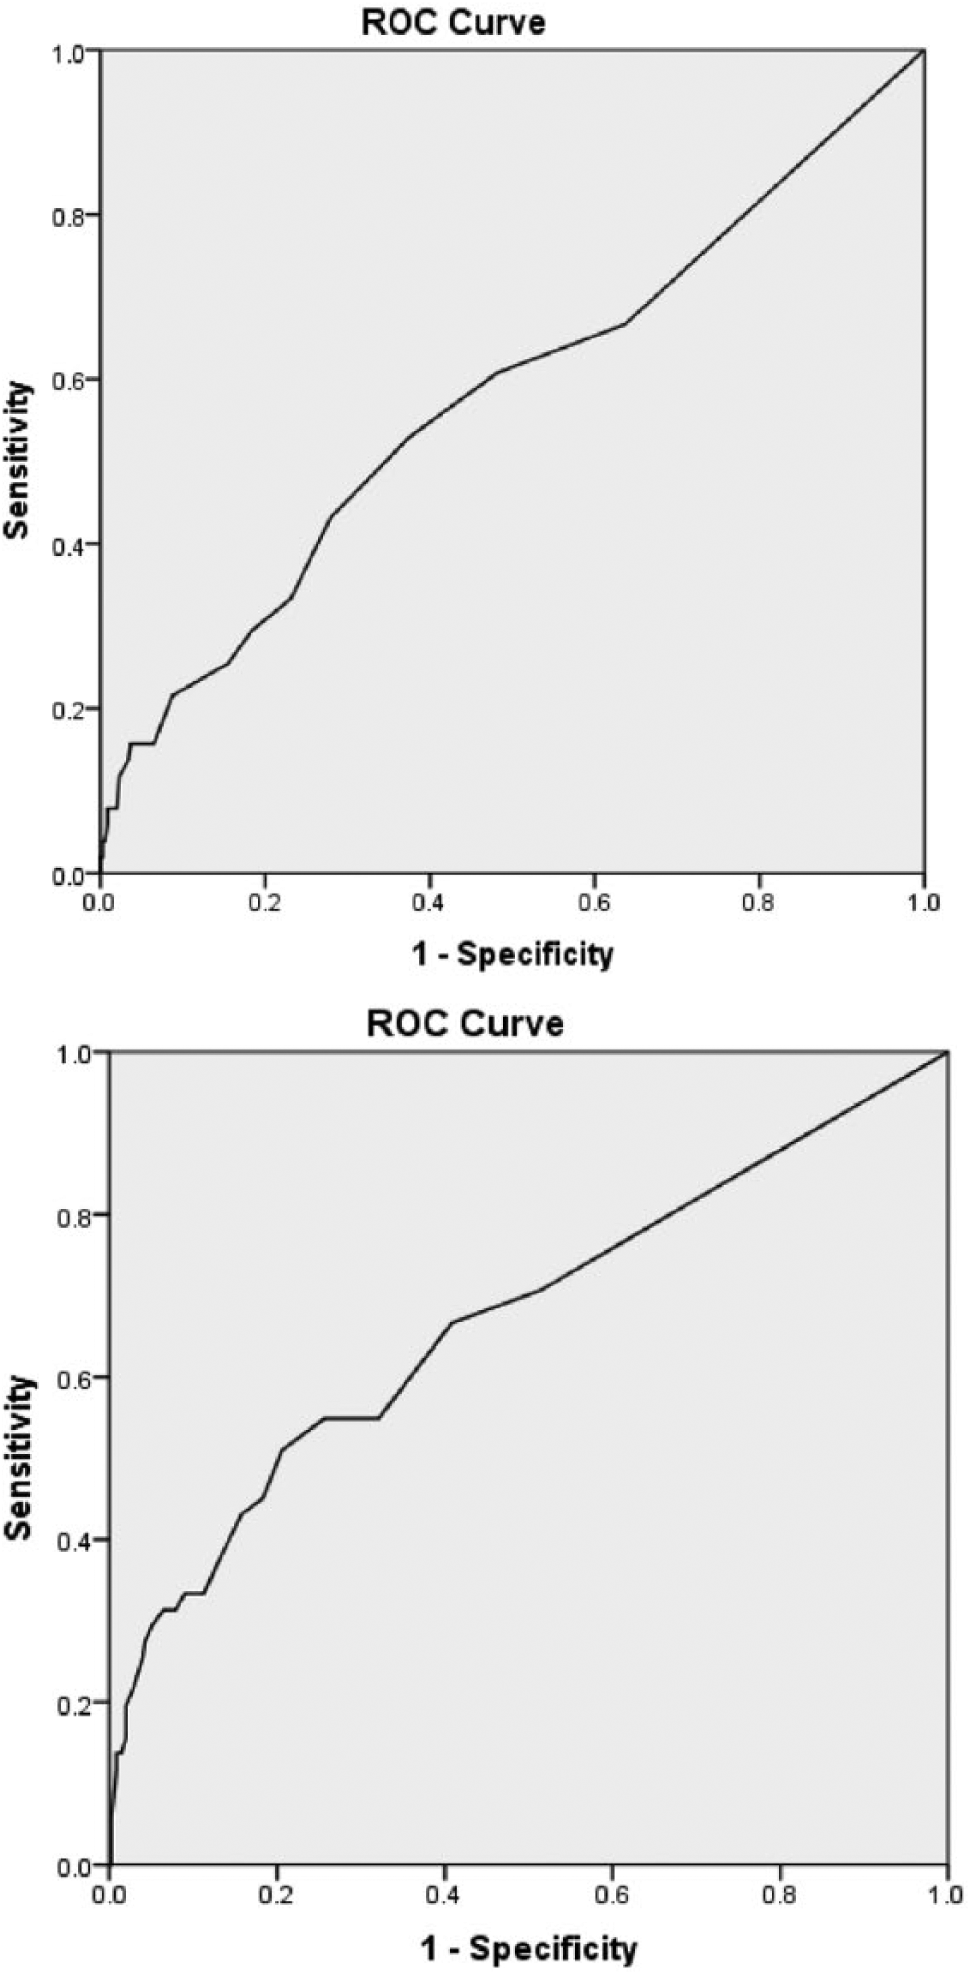
ROC curve of Conners’ ratings in first grade by parents (top) and teachers (bottom), n = 405, for being permitted to upper secondary school at end of Grade 9; AUC = .58 (p < .05) for parental ratings and .67 (p < .001) for teachers’ ratings.

ROC curve of Conners’ ratings in fourth grade by parents (top) and teachers (bottom), n = 511, for being permitted to upper secondary school at end of Grade 9; AUC = .68 (p < .001) for parental or teachers’ ratings.
Results
The prevalence of positive screening outcomes on each item on the Conners scale rated by parents and teachers in first and fourth grades is presented in Tables 1 and 2, respectively. Positive scores on all Conners items except Parent Items 8 to 10 in Grade 1 (Table 1) and Teacher Item 8 in Grade 4 (Table 2) were associated with overall lower mean grade. Most symptomatically rated items correlated with not being permitted to upper secondary school (Tables 1 and 2). The correlation between the parents’ and the teachers’ ratings was low (r = .22, p < .001) in Grade 1 and somewhat higher (r = .44, p < .001) in Grade 4.
The ROC analysis for the total parent or teacher Conners score in first grade yielded an AUC of .58 (p < .05) and .67 (p < .001), respectively (Figure 2). A total parent score of ≥10 has a sensitivity of 16% (95% CI = [8, 26]) and a specificity of 94% (95% CI = [92, 95]) for not being permitted to further studies; a cutoff score of 10 in teacher’s report had a sensitivity of 33% (95% CI = [22, 45]) and a specificity of 91% (95% CI = [89, 93]; Table 3). The positive likelihood ratio (LR+) was 2.41 (95% CI = [1.14, 5.11]) and 3.69 (95% CI = [2.22, 6.14]) for parent and teacher report, respectively (Table 3). In Grade 4, the AUC for parental or teachers’ report was .68 (p < .001; Figure 3). A parent total Conners score of ≥10 was associated with a sensitivity of 25% (95% CI = [16, 36]) and a specificity of 90% (95% CI = [89, 92]), and teacher total score ≥10 had a sensitivity of 33% (95% CI = [22, 44]) and a specificity of 88% (95% CI = [86, 89]; Table 3). Using a combination of parental or teacher score ≥10 increased the sensitivity slightly to 41% (95% CI = [30, 53]) at the cost of a lower specificity of 82% (95% CI = [81, 84]), and with a LR+ of 2.34 (95% CI = [1.63, 3.35]). A combination of parent and teacher score ≥10 was a slightly better predictor with a LR+ of 3.69 (95% CI = [1.81, 7.51]). The positive predictive value was 33%, that is, one third of the children reported to have a score of at least 10 in parental and teacher’s reports in Grade 4 was not qualified for further studies 5 years later (Table 3).
Stepwise linear regression models to examine the Conners 10-item parent and teacher version’s capacity in Grades 1 and 4 to predict outcome in terms of final grade scores at age 16 years revealed that (a) for the Conners scores in Grade 1 in the parent form, items 4 (“fails to finish what he or she starts”; β = −.22) and 3 (“disturbs other children”; β = −.12; R2 = .09; F = 18.7, df = 2, p < .0001), and (b) for the teacher form, items 4 (β = −.27) and 10 (“temper outbursts, explosive, and unpredictable behavior”; β = −.15; R2 = .13; F = 29.8, df = 2, p < .0001) explained a significant amount of variance. Entering all 10 Conners items into the model yielded no significant increment for neither parent (R2 = .11; F = 4.7, df = 10, p < .0001) nor teacher ratings (R2 = .14; F = 6.1, df = 10, p < .0001).
Regression analysis of Conners scores in Grade 4 on final grade scores in Grade 9 demonstrated that (c) for the parent form, items 6 (“being inattentive, easily distracted”; β = −.29) and 4 (β = −.13; R2 = .15; F = 45.1, df = 2, p < .0001), and (d) for the teacher form, Item 4 (β = −.37; R2 = .13; F = 78.8, df = 1, p < .0001) were the best predictors. As in Grade 1, entering all 10 Conners items in the regression model did not result in any significant increase of explained variance for neither parent (R2 = .16; F = 9.2, df = 10, p < .0001) nor teacher ratings (R2 = .15; F = 8.5, df = 10, p < .0001).
Stepwise logistic regression models to examine the Conners 10-item parent and teacher version’s capacity to predict outcome in terms for being permitted to upper secondary school at age 16 years showed that (e) parental Conners scores in Grade 1 for Item 4, Wald = 22.8, df = 1, p < .001, exp(B) = .31, and (f) teacher scores for Item 6, Wald = 30.4, df = 1, p < .001, exp(B) = .45, were of significant value. Logistic regressions for Conners items in Grade 4 yielded prognostic significance for Item 6, Wald = 28.5, df = 1, p < .001, exp(B) = .49, in the parent form and Item 4, Wald = 31.4, df = 1, p < .001, exp(B) = .50, in the teacher form.
The screening efficiency of the identified best discriminating Conners items (Items 4 and 6) in Grades 1 and 4 to predict upper secondary school permission (qualitative outcome) in Grade 9 is presented in Table 3. The predictive value of other items on the Conners scale is not reported as they did not result in any significant increase of explained variance of the qualitative outcome variable. A positive score (rated as 2 = pretty much true or 3 = very much true) on Item 4 in parental reports or on Item 6 in teacher’s reports at age 7 years identified 12% (95% CI = [6, 17]) or 39% (95% CI = [27, 51]), respectively, of children without upper secondary school competence at age 16 years (p < .001) with a specificity of 99% (95% CI = [97, 99.6]) for Parent Item 4 or 90% (95% CI = [87, 93]) for Teacher Item 6. These positive screening results provided a LR+ of 10.41 (95% CI = [3.04, 35.64]) for Parent Item 4 and a LR+ of 4.08 (95% CI = [2.56, 6.62]) for Teacher Item 6. The positive predictive value for Parent Item 4 was 60% (95% CI = [28, 86]); that is, almost two thirds of the children reported to have problems to finish tasks according to parental report in Grade 1 did not qualify for further academic studies 8 years later (Table 3). Among children being inattentive in teachers’ reports in first grade, 37% (95% CI = [26, 49]) did not reach criteria for upper secondary school permission at end of ninth grade.
At age 10 years, positive scores on Teacher Item 4 or Parent Item 6 yielded similar degrees of selectivity as at age 7 years with sensitivities of 33% to 34%, specificities of 90%, and positive predictive values of 30% to 31% (Table 3). The best predictor in Grade 4 was a combination of parent and teacher scores on Items 6 and 4, respectively, with a positive predictive value of 42% (95% CI = [25, 62]) and LR+ of 5.41 (95% CI = [2.61, 11.23]).
Discussion
This population-based study demonstrates an association between screen-positive results on the Conners 10-item scale in parental or teacher’s report at ages 7 and 10 years with academic outcome at age 16 years. Particularly, two items seem to be closely related to outcome, namely, Items 4 and 6, both indicative of inattention. Among children with a positive score on Item 6 in teacher’s report, 37% did not qualify for further academic studies 8 years later. The likelihood of not fulfilling criteria for permission to upper secondary school increased by four times in this group. The small sample size of children rated positive on Item 4 by parents in first grade (n = 10) makes it necessary to interpret the positive predictive value of 60% and LR+ of 10.4 with caution. The best predictor in Grade 4 was a combination of positive scores on Parent Item 6 and Teacher Item 4 with a positive predictive value of 42% and LR+ of 5.4.
Teacher report identified three times as many children not fulfilling the criteria for upper secondary school permission as parents did when a positive score on the best predicting Conners items was used as the cutoff in first grade (sensitivity 39% for Teacher Item 6 vs. 12% for Parent Item 4), whereas parent and teacher report in Grade 4 was comparable in identifying children with risk for negative outcome at age 16 years (sensitivity 33%-34% for Parent Item 6 and Teacher Item 4, respectively; Table 4). If a score of ≥10 on the total Conners 10-item scale was used as the cutoff in first grade, teachers identified twice as many children fulfilling the criteria for not being qualified for further studies after ninth grade as parents did (sensitivity 16% and 33%, respectively) while parents and teachers were equally poor in identifying children not being permitted to upper secondary school in Grade 4 (sensitivity 25%-33%; Table 3). Screening with 10 items instead of only 2 did not substantially improve the efficiency. Applying cutoff scores <10 improved the sensitivity to a small extent at the cost of a lower specificity.
Conners items measuring inattentiveness were found to be the best predictors of academic underachievement in ninth grade. These findings are in line with previous research reporting the inattention element of ADHD to be the most important factor associated with underachievement in reading and mathematics (Diamantopoulou, Rydell, Thorell, & Bohlin, 2007; Merrell & Tymms, 2001). Breslau et al. (2009) demonstrated in their longitudinal study that symptoms of inattention at age 6 years predicted mathematics and reading achievement at 17 years of age. Attention problems are likely to negatively influence children’s academic achievement beginning in the early grades (Barbaresi et al., 2007; Merrell & Tymms, 2001). Students who have difficulties focusing on classroom activities or completing homework assignments because of their attention problems are likely to be less efficient learners compared with their classmates without attention problems. Inefficient learning in the early grades may limit students’ ability to acquire basic skills that are necessary for developing higher level mathematics and reading skills (Breslau et al., 2009). Learning problems in lower grades may cause additional inattentive behavior and thereby further complicate the situation in school for students as they advance to the higher curricular demands of the later grades.
Our results stress the importance of early recognition of childhood symptoms of inattention because even young children with less severe forms of ADHD symptoms may also be at risk of educational underachievement. Considering evidence that attention problems influence children’s academic achievement negatively already in early grades, it may be of importance to start prevention during primary school to promote basic skills necessary for higher education as well as prevent negative interaction with peers and teachers, health complaints, and bullying (Holmberg & Hjern, 2006, 2008).
The success of intervention programs depends on the availability of an accurate early detection method that can be applied to the general population to identify at-risk children (Dwyer, Nicholson, & Battistutta, 2006). Implementing a short screening with two Conners items may be an economically realistic and empirically justified first step in detecting prevention needs in terms of social and educational support. According to our results, such screening seems to have a low false positive rate to identify children not being at risk of negative school outcome (high specificity). However, as a relatively high number was false negative (low sensitivity), the utility is compromised. The behavior, school achievement, and general adaptive level of an individual child are influenced by many different factors that change over time. In the present study, symptoms of inattention accounted only for a significant minority of school performance. Academic achievement is affected by environmental and biological factors (Polderman et al., 2011). Psychosocial factors such as parental stress and changing family, teacher and peer relationships influence the child’s educational achievement. Increased demands on the child’s cognitive capacity in the classroom interact closely with the maturing brain creating a dynamic context for the child’s behavior over time (Holmberg & Hjern, 2008). If screening for symptoms of inattention is carried out at the population level, it should be supplemented by a short clinical interview built into the routine school health program to improve sensitivity. Such a strategy has shown to be effective for identifying other behavior or cognitive problems (e.g., autism, conduct disorder, general or specific learning disabilities). The school nurse may interview parents and teachers when children are given borderline scores to enhance sensitivity and identify children in need of educational and diagnostic evaluation and support. Involving teachers in screening may also be a way to increase their awareness of ADHD symptoms (Holmberg, 2009; Merrell & Tymms, 2001). A combination of a short screening followed by an interview may be more cost-effective and merit further evaluation (Holmberg, 2009).
Another approach to early intervention for children with early inattentive problems is broadband actions targeting all children, not only those with pronounced inattentive behavior. Several different strategies may be considered in such interventions. School-focused interventions may include specific academic intervention strategies. Environmental modifications being offered to all students such as simple, clear repeated instruction and teaching methods offering division of content into smaller chunks of information and providing immediate feedback about school tasks as well as improved teaching materials may also benefit children with ADHD symptoms (Loe & Feldman, 2007).
This study indicates that not all or even most children with academic problems at age 16 years can be identified early through screening at age 7 or 10 years with a short symptom scale like the one developed by Conners. Thus, screening in school-aged children needs to be supplemented by additional strategies for identifying and subsequently supporting children who develop inattention problems, other ADHD symptoms, or other neuropsychiatric disabilities that may interfere with learning in the classroom. Such a strategy calls for close collaboration and communication between educators, who meet the children in the classroom every day, and the school health team (Holmberg, Sundelin, & Hjern, 2010).
Limitations
The present study suffers from some methodological limitations that need to be addressed. First, Sigtuna is a medium-sized municipality with a population with a slightly more disadvantaged socioeconomic situation according to the Register of the Total Population. Thus, considering the higher rates of ADHD in families with low socioeconomic status (Swedish National Board of Health and Welfare, 2009), somewhat higher rates of ADHD symptoms expressed as elevated Conners score compared with the national average should be expected in this study population. Second, the psychometric properties of the Conners 10-item scale have not been extensively studied in other cohorts of Swedish schoolchildren. We have no reason to assume, however, that the parents and teachers in this municipality evaluated children differently from other settings in Sweden. Third, we have used a simple regression model without controlling for other factors such as sex and sociodemographic data. Fourth, educational systems and school demands, mental health use and stimulant medication, and the prevalence of ADHD vary considerably between countries. This suggests that the results of this study may, to a certain extent, be specific for Swedish schoolchildren.
Conclusion
This population-based study demonstrates a strong association between certain parent and teacher reported inattention problems in young school-aged children and low school outcome at age 16 years. Our findings indicate that even a single symptom of ADHD can lead to a high risk of school failure and the need for educational support. Screening for one to two symptoms of inattention in first grade identifies 30% to 40% of participants at risk for later poor academic outcome. The specificity of symptoms for later school problems was high, sensitivity was low. Prediction was not improved by screening with all items in Conners 10-item scale. Therefore, early recognition of attention problems by screening with a short questionnaire should be supplemented by a short clinical interview which may be built into the routine school health program. Educational systems and school demands, mental health use and stimulant medication, as well as the frequency of diagnosed ADHD cases varies considerably between countries. This suggests that the results of this study may, to a certain extent, be specific for Swedish schoolchildren.
Footnotes
Acknowledgements
We wish to thank Professor Anders Hjern of CHESS, the Centre for Health Equity Studies at Stockholm University, for valuable assistance to gain access to data from the national register. We thank the school authorities of Sigtuna, the school nurses, and the teachers, without whose assistance the study could not have been completed.
Declaration of Conflicting Interests
The author(s) declared no potential conflicts of interest with respect to the research, authorship, and/or publication of this article.
Funding
The author(s) disclosed receipt of the following financial support for the research, authorship, and/or publication of this article: Financial support for this study has been provided by grants from the Swedish Society of Medicine, the First of May Flower Annual Campaign, the Foundation Claes Groschinsky’s Memory, the Medical Faculty Foundation for psychiatric and neurological research at Uppsala University, the Gillbergska Foundation, the Sunnerdahl Disability Foundation, and Sällskapet Barnavård.