



Abstract
Introduction
There is a lack of well-validated, objective, and easy-to-administer tests that separately assess all three core symptoms of ADHD (i.e., age-inadequate levels of inattention, hyperactivity, and impulsiveness), one of the most common and highly impairing childhood disorders (Polanczyk, de Lima, Horta, Biederman, & Rohde, 2007; Stein, Blum, & Barbaresi, 2011). During the past decades, guidelines for the assessment and diagnosis of ADHD have been developed (e.g., American Academy of Child & Adolescent Psychiatry, 2007; American Academy of Pediatrics, 2000; Taylor et al., 2004). They all recommend the use of a variety of methods and informational sources, including child behavior observation, parent and teacher rating scales, standardized clinical interviews for parents and children, and physical examinations. Although these sources play an important role in the diagnosis of ADHD, they have been criticized because of their subjective nature. Self-report and observer-rating scales as well as clinical interviews are vulnerable to both clinician and informant biases (Edwards et al., 2007). Moreover, findings of reduced reliability for monitoring symptoms over time (Rabiner et al., 2010) and influences of children’s gender, ethnicity, and socioeconomic status (SES) on symptom ratings (Bussing et al., 2008) have further supported objections against rating scale procedures. Therefore, objective and reliable laboratory-based measures of ADHD symptoms are highly desirable, and considerable effort has been put into the development and evaluation of more direct assessment methods of core ADHD symptoms.
Over the past 20 years, computer-administered neuropsychological attention tests have become a popular means for behavioral assessment of attention processes, providing a direct observational, norm-referenced measure (Hasson & Fine, 2012). The continuous performance test (CPT) is the most commonly used neuropsychological test for ADHD evaluation in both research and clinical settings (Ballard, 1996; Corkum & Siegel, 1993; Epstein et al., 2003; McGee, Clark, & Symons, 2000; Nichols & Waschbusch, 2004; Riccio, Waldrop, Reynolds, & Lowe, 2001). The CPT is a computer-based vigilance test that aims at assessing executive functions (EFs) like sustained attention as well as selective attention processes and behavioral inhibition. These EFs have been shown to be closely related to symptoms of ADHD (for a review, see Willcutt, Doyle, Nigg, Faraone, & Pennington, 2005). When performing a CPT, participants are generally requested to react as fast as possible to target stimuli by pressing a key and to refrain from pressing it for nontarget stimuli. Failure to respond to the target stimuli is usually interpreted as a result of inattention, while responses to nontarget stimuli are interpreted as results of impulsivity. It is important to note that the term CPT in fact refers to a test paradigm, with many different versions that vary in duration from 6 to 22 min, target-to-nontarget ratio, and other test features (Riccio et al., 2001).
Although CPTs have excellent face validity and a great intuitive appeal as an objective measure for ADHD symptoms, research concerning the diagnostic utility of CPTs for ADHD remains controversial (Barkley, 1991; Halperin et al., 1990; McGee et al., 2000). While a large number of studies have reported differences in CPT performance measures between ADHD children and healthy controls (for a review, see Nichols & Waschbusch, 2004), only few have been successful in finding those differences for ADHD children and other clinical groups (O’Brien et al., 1992). Forbes (1998) stated that a diagnostic instrument must be able to distinguish between clinical groups to be of clinical utility. As it is true for behavior rating scales, interviews, standardized observation methods, or any other diagnostic tool, CPTs by themselves up to today have not been shown to have sufficient discriminative validity to determine a diagnosis of ADHD. There is agreement on the fact, though, that the use of CPTs as part of a larger neuropsychological battery can improve diagnostic precision and may be highly important for the reduction of gender bias in the diagnostic process (Hasson & Fine, 2012). Moreover, CPTs provide a quick and relatively cost-effective laboratory-based measure with the potential of being suitable for medication monitoring (Gualtieri & Johnson, 2005; Riccio et al., 2001; Wehmeier, Dittmann, Banaschewski, & Schacht, 2012; Wehmeier et al., 2011).
The Quantified behavior Test (QbTest©; see description below) is a commercial neuropsychological test that combines the CPT paradigm with apparative measurement of motor activity (for similar measurement techniques, see Teicher, Ito, Glod, & Barber, 1996) and aims at assessing all three core ADHD symptoms (i.e., inattention, hyperactivity, and impulsivity) separately. Two different QbTest versions are provided targeting two different age groups. The first version can be used for children aged 6 to 12, and the second version can be applied for participants aged 12 to 60. As described above, standard CPTs appear to have an insufficient ability to discriminate between ADHD and other clinical conditions. Thus, additional use of motor assessment might enhance test validity because hyperactivity is a core symptom in many ADHD children and has been frequently neglected in neuropsychological attention tests so far. In addition, the QbTest may be helpful in reducing gender, age, and SES biases in the diagnostic process, which are often observed when applying rating scale measures, as described above.
Despite these potential advantages, neither the factorial validity (i.e., “Does the test capture the three core ADHD symptoms?”) nor its convergent validity with other measures (i.e., “Do the QbTest results correlate with corresponding questionnaire measures?”) has been investigated. This is particularly noteworthy, as the QbTest (6-12) 1 is being marketed and widely used as a diagnostic tool for ADHD (Vogt & Williams, 2011) and even for titration of stimulant medication by a growing number of practitioners in European and North American countries (Wehmeier et al., 2011; Wehmeier et al., 2012). Moreover, the test has been incorporated in numerous studies concerning different aspects of ADHD (Brocki, Tillman, & Bohlin, 2008; Günther, poster presentation; Oades, Dauvermann, Schimmelmann, Schwarz, & Myint, 2010; Scholtens, Diamantopoulou, Tillman, & Rydell, 2011; Vogt & Williams, 2011; Wehmeier et al., 2011; Wehmeier et al., 2012). As the factorial validity of the test has not yet been investigated, it remains unclear how the different QbTest variables (a total of 17) relate to one another and whether they reflect ADHD symptoms in children. Reporting and using a large number of measures is problematic because it will lead to an increase of Type I error (false positive, that is, risk of diagnosing a healthy child with ADHD) since repeated measurement of the same latent construct dramatically decreases the threshold for a significant finding. Using standard corrections to control for the many measures (e.g., Bonferroni correction) would lead to higher risk of committing a Type II error though (false negative, that is, risk of overlooking a child who does in fact have ADHD and could profit from adequate treatment) because it drastically raises the threshold for a significant finding. These methodological problems could be attenuated by integrating variables that presumably measure the same latent constructs with single factors.
Besides the methodological issues, reporting a multitude of measures is highly inefficient for clinical practice. For practitioners, it is much more convenient to have few main parameters to consider and interpret than to observe 10 or more variables from one single test. This is especially true for diagnoses in ADHD where already a multitude of different informational sources and measures must be applied and integrated (see Taylor et al., 2004).
Factor analysis (FA) is the methodological procedure of grouping variables together and reducing redundant information by producing factor scores that are easier to interpret and thus a major benefit for practitioners. The primary aim of this study, therefore, is to explore the factorial structure of the QbTest and its conceptual accordance with core ADHD symptoms.
In addition to the open question regarding factorial validity, it is unknown whether the symptom dimensions measured with the QbTest overlap with questionnaire-based measures. Particularly, it is unknown whether the specific measurement of motor activity as assessed with the motion-tracking system incorporated in the QbTest is related to parent or teacher ratings of hyperactive behavior. The secondary aim of the study, therefore, is to examine the concurrent and divergent validity of the evolving QbTest factors.
Method
Procedure and Participants
Two separate samples were used to (a) analyze the structure of the QbTest (Sample I) and (b) analyze concurrent and discriminant validity of the evolving factors (Sample II). Sample I consisted of 901 German children who were referred to a practice for Child and Adolescent Psychiatry and Psychotherapy for ADHD assessment. Assessment was based on diagnostic standards as formulated in the guidelines (see Taylor et al., 2004). Clinical and psychological assessments were performed by a multiprofessional team. As part of the assessment process, children also completed the QbTest. As Sample I consisted of convenience sampling in the private pediatric practice, some children who were presented in the practice had been previously examined for ADHD symptoms elsewhere. Irrespective of preexisting diagnostic results though, all children had to complete routine assessment to assure well-founded diagnosis. Children who received ADHD-specific medication were off medication for at least 24 hr prior to performing the QbTest. Assessment took place in the practice and was either performed by a senior physician (LL) or by well-trained medical staff. All children received pharmacological and/or psychological treatment after ADHD diagnosis was confirmed.
Sample II consisted of 102 strictly diagnosed German ADHD children who were diagnosed and treated for ADHD at the University Hospital of Child and Adolescent Psychiatry, Essen, and at the Department of Clinical Psychology and Psychotherapy at the University of Marburg. A standardized Diagnostic and Statistical Manual of Mental Disorders (4th ed., text rev.; DSM-IV-TR; American Psychiatric Association [APA], 2000)–based clinical interview with the parents (Parental Account of Childhood Symptoms [PACS]; Chen & Taylor, 2006; Delmo, Weiffenbach, Gabriel, Stadler, & Poustka, 2000/2001) and the Conners’ third Parent and Teacher Rating Scales (Conners, 2008), intelligence testing (Wechsler Intelligence Scale for Children–Fourth edition [WISC-IV], German version; Petermann & Wechsler, 2011; Sattler, 1992), and the QbTest were part of routine assessment. Part of Sample II (n = 32) additionally completed another laboratory test for attention assessment, the children’s test battery of attention assessment, with the subtests sustained attention, Go/No-Go, and divided attention (KITAP; Zimmermann, Gondan, & Fimm, 2002). Assessment was performed by well-trained medical staff, and again, all children received pharmacological and/or psychological treatment after ADHD diagnosis was confirmed.
Study protocols in accordance with the criteria of the Declaration of Helsinki were reviewed and approved by the local institutional review boards. Informed consent was obtained from all parents or guardians and children prior to the assessment, and their confidentiality was assured.
Deletion of univariate outliers in Sample I (3 SDs above mean in any of the relevant QbTest variables) left 829 cases for analysis. Because only one person with an age of 12 was available in the data set, this case was also excluded from further analysis for homogeneity of the sample. The final Sample I thus consisted of 828 cases: 588 males (M age = 8.5 years, SD = 1.6 years) and 240 females (M age = 8.5 years, SD = 1.5 years). According to Comrey and Lee (1992), this sample size is very good to excellent for exploratory factor analysis (EFA). Distribution of age and gender in the remaining sample did not significantly differ from the total sample. The gender distribution reflects the frequently reported distribution of gender in ADHD, with boys outnumbering girls about 3 to 1 (APA, 2000). Sample II consisted of 102 cases: 79 males (M age = 8.9 years, SD = 1.7 years) and 23 females (M age = 9 years, SD = 1.5 years). Table 1 presents the distribution of age and gender in the final Sample I and in Sample II.
Frequency Distribution of Sample I and Sample II by Age and Gender.

The Quantified Behavior Test for Children Aged 6 to 12 Years
The QbTest is a combined CPT and activity test for children aged 6 to 12 years (Ulberstad, 2012), which aims to assess all three core symptoms of ADHD in one test. 2 While performing a standardized CPT on a computer, the movements of the participant are recorded with an infrared camera following a reflective marker attached to a headband that the participant wears while performing the test. The infrared camera is placed about 1 m away from the participant, who is sitting in front of a computer screen. Participants are seated on a stool with no back support or armrest, to assure that they do not adopt a reclining posture. The QbTest CPT involves presentation of two different stimuli: a gray circle (target) and a gray circle with a cross (nontarget). The stimuli are presented on the screen for 100 ms per stimulus with an interstimulus interval (ISI) of 1,900 ms. The total number of stimuli presented in QbTest is 450 with an equal number of target and nontarget stimuli appearing in random order. Over the course of the test (15 min), participants are asked to press a button once in response to every target signal as fast as possible and to refrain from responding to nontargets. The test instructions thus emphasize both speed and accuracy. Participants’ activities during the test are recorded by reading the coordinates (X and Y) of the headband marker. The position of the marker is sampled 50 times per second, with a spatial resolution of 1/27 mm per camera unit (Ulberstad, 2012). QbTech© provides separate norms for boys and for girls, as well as for all age groups included in QbTest 6-12 (age groups are per year, that is, separate norms for ages 6, 7, 8, 9, 10, 11, and 12). According to the test manual (Ulberstad, 2012), normative data from a control group of healthy children are based on a total of n = 576, including n = 262 males and n = 314 females.
The QbTest reports a total of 17 parameters. Those can be divided into activity and CPT measures. The reported activity measures include 5 parameters: (a) Time Active, which reflects the percentage of time the subject has moved more than 1 cm/s; (b) Distance, which reflects the distance traveled by the reflective headband marker and is measured in meters; (c) the score Area, measured as the surface covered by the headband reflector during the test and is presented in square centimeters; (d) Total Number of Microevents that are small movements of the reflective marker that occur when a position change since the last microevent is greater than 1 mm; and (e) Motion Simplicity, a measure of complexity of the motion pattern that is being reported in percentage.
Twelve CPT measures are reported, including (f) Reaction Time (RT) as the average time of all correct responses. This score indicates latency in information processing and motor response speed. (g) The score Outliers represents RTs that are very slow compared with the overall RT performance during the test. (h) RT Variation (RTVar) is calculated by the standard deviation of the mean of correct response times. It is a measure of the participant’s inconsistency in response times. (i) The score Normalized Variation (NormVar) is the RTVar expressed in terms of RT. (j) The total number of missed targets is represented in the score Omission Errors, while the total number of false hits is depicted by (k) Commission Errors. (l) The score Normalized Commission Errors displays the proportion or ratio of commission errors to correct responses to the target stimulus. Too fast responses to a stimulus (less than 150 ms after presentation of the stimulus) are reported by the score (m) Anticipatory. When there is more than one button press per stimulus presentation, this is measured and reported by (n) Multiresponse. (o) D-Prime Modified (d′) is a measure of signal detectability. It reflects accuracy of target (signal) to nontarget (noise) discrimination and is calculated from commission and omission errors. (p) Longest Passivity is the maximum number of consecutive omission errors and gives information about the longest time the participant has been passive during the CPT. Finally, the total number of incorrect responses during the test is represented in the score (q) Error Rate that is calculated from commission errors plus omission errors divided by the total number of stimuli.
From all of the 17 above described QbTest parameters, 6 are secondary measures and measures of test involvement rather than providing direct performance information. Those secondary measures are calculated from performance information assessed by 1 of the 11 primary QbTest variables. Using those secondary variables for factor analysis would imply double counting the direct information contained in the primary variables. The secondary variables were thus excluded from further analyses (Variables 7, 9, 12, 15, 16, 17). Consequently, a total of 11 QbTest variables consisting of 5 activity measures and 6 CPT measures were included in the following analyses.
Statistical Analysis
Data reduction and analyses were carried out using the statistical package SPSS 19.0. Prior to analyses, all QbTest variables were examined for accuracy of data entry, missing values, and outliers. No missing values were found, and outliers were identified as being 3 SDs above mean for each of the QbTest variables.
As a first step, a series of EFA were performed for data reduction and to obtain the factor structure of the test. Variables were included in the factor analysis if the following criteria were met: (a) variables loaded significantly (>.30) on at least one factor and (b) conceptual coherence was evident. In case of double loadings (>.30 on more than one factor), variables were attributed to the factor with the highest existing factor loading for this variable as well as when conceptual coherence was given. The scree test and the number of eigenvalues above 1.0 were used to select the number of factors for extraction. Because it is unlikely that the underlying dimensions are totally unrelated, we did not restrain our analyses to varimax rotation, but used oblique rotation (δ = 0) instead. Also, each factor had to receive salient loadings (>.30) from more than one variable.
As a second step, Cronbach’s α was computed to report internal consistency for the emerging factors. Finally, influences of age and gender on the QbTest factors were analyzed with a MANOVA. Effect sizes for differences between gender and age groups were reported when appropriate and interpreted according to Cohen (1977; small: .01 ≥ η2, medium: .06 ≥ η2, and large: η2 ≥ .14).
To further validate the QbTest, a multitrait–multimethod (MTMM) approach was used in Sample II, comparing the established factors (e.g., Hyperactivity, Inattention, Impulsivity) with the results of another test for attention assessment (KITAP; Zimmermann et al., 2002) and the Conners’ third Parent and Teacher Rating Scales (Conners, 2008). Association of standardized KITAP results in the subtest sustained attention (comprising variables RT, Omission, and Commission errors) as well as standardized parent and teacher behavior ratings (Conners’ DSM-Inattention subscale and DSM-Hyperactivity/Impulsivity subscale) with the QbTest factors were examined. According to the MTMM approach, we would expect significant, positive correlations between variables or factors representing the same construct (e.g., inattention) measured with different methods (e.g., rating scale vs. attention test). A significant positive correlation between those same constructs would be regarded as an indicator of concurrent validity. However, no significant correlations would be expected between different constructs (e.g., inattention vs. peer problems) assessed with different methods (e.g., rating scale vs. attention test). A low correlation between different constructs would give information on discriminant validity of the QbTest factors. The Conners’ subscale Peer Relations as well as IQ scores from the German short version of the WISC-IV (Petermann & Wechsler, 2011; Sattler, 1992) were included in the correlational analysis for this reason. Except for the Inattention factor, we would expect the other QbTest factors not to be associated with either IQ or with the Conners’ subscale of Peer Relations. Since Attention is a precondition for cognitive testing, we would expect the Inattention factor to be negatively correlated with IQ, but not to be correlated with the Peer Relation subscale. Finally, Pearson correlations were computed and interpreted according to Cohen (1988; small: r ≥ .1, medium: r ≥ .3, and large: r ≥ .5).
Results
Exploratory Factor Analyses
The Kaiser–Mayer–Olkin Measure (KMO) of sampling adequacy was .74, indicating a good sampling adequacy (Kaiser, 1974). No QbTest variables were excluded from the analysis since only one variable showed low communality of .11 (see Table 2). According to Bühner (2006), this can be tolerated if the total sample size is high and conceptual coherence is given. The correlation matrix was subjected to principal axis factoring with oblique rotation, yielding a three-factor solution according to the scree test (factor eigenvalues: Factor 1 = 5.40, Factor 2 = 1.59, Factor 3 = 1.33).
Rotated Factor Loadings and Communality Values (h²) From a Principal Axis Factor Analysis of QbTest Variables Using Oblimin Rotation (N = 828).

Note. QbTest = quantified behavior test. Highest loadings are boldface.
Table 2 presents the factor loadings and communalities for the 11 QbTest variables as well as eigenvalues and percentages of explained variance for each factor in this analysis. The resulting three factors explained 76% of the total variance. The first factor accounted for 49.13% of the total variance with five QbTest variables conceptually related to motor activity/motion (i.e., Time Active, Distance, Area, Microevents, Motion Simplicity). The second factor explained 14.43% of the variance, with three variables conceptually related to inattention (i.e., Omission Errors, RT, RTVar). Finally, the third factor accounted for 12.11% of the total variance with variables conceptually related to impulsivity (i.e., Commission Errors, Multiresponse, Anticipatory). Thus, factor names were proposed according to ADHD core symptoms: Hyperactivity, Inattention, and Impulsiveness. Table 2 shows the rotated factor loadings and communality values of the QbTest.
Internal consistency of all three factors was acceptable with the following Cronbach’s alpha values: Hyperactivity (α = .95), Inattention (α = .76), and Impulsivity (α = .60). Correlations between factors were moderate (.18 ≥ r ≤ .48) with highest correlations occurring between Hyperactivity and Inattention (r = .48) and Hyperactivity and Impulsivity (r = .39).
Influences of Age and Gender
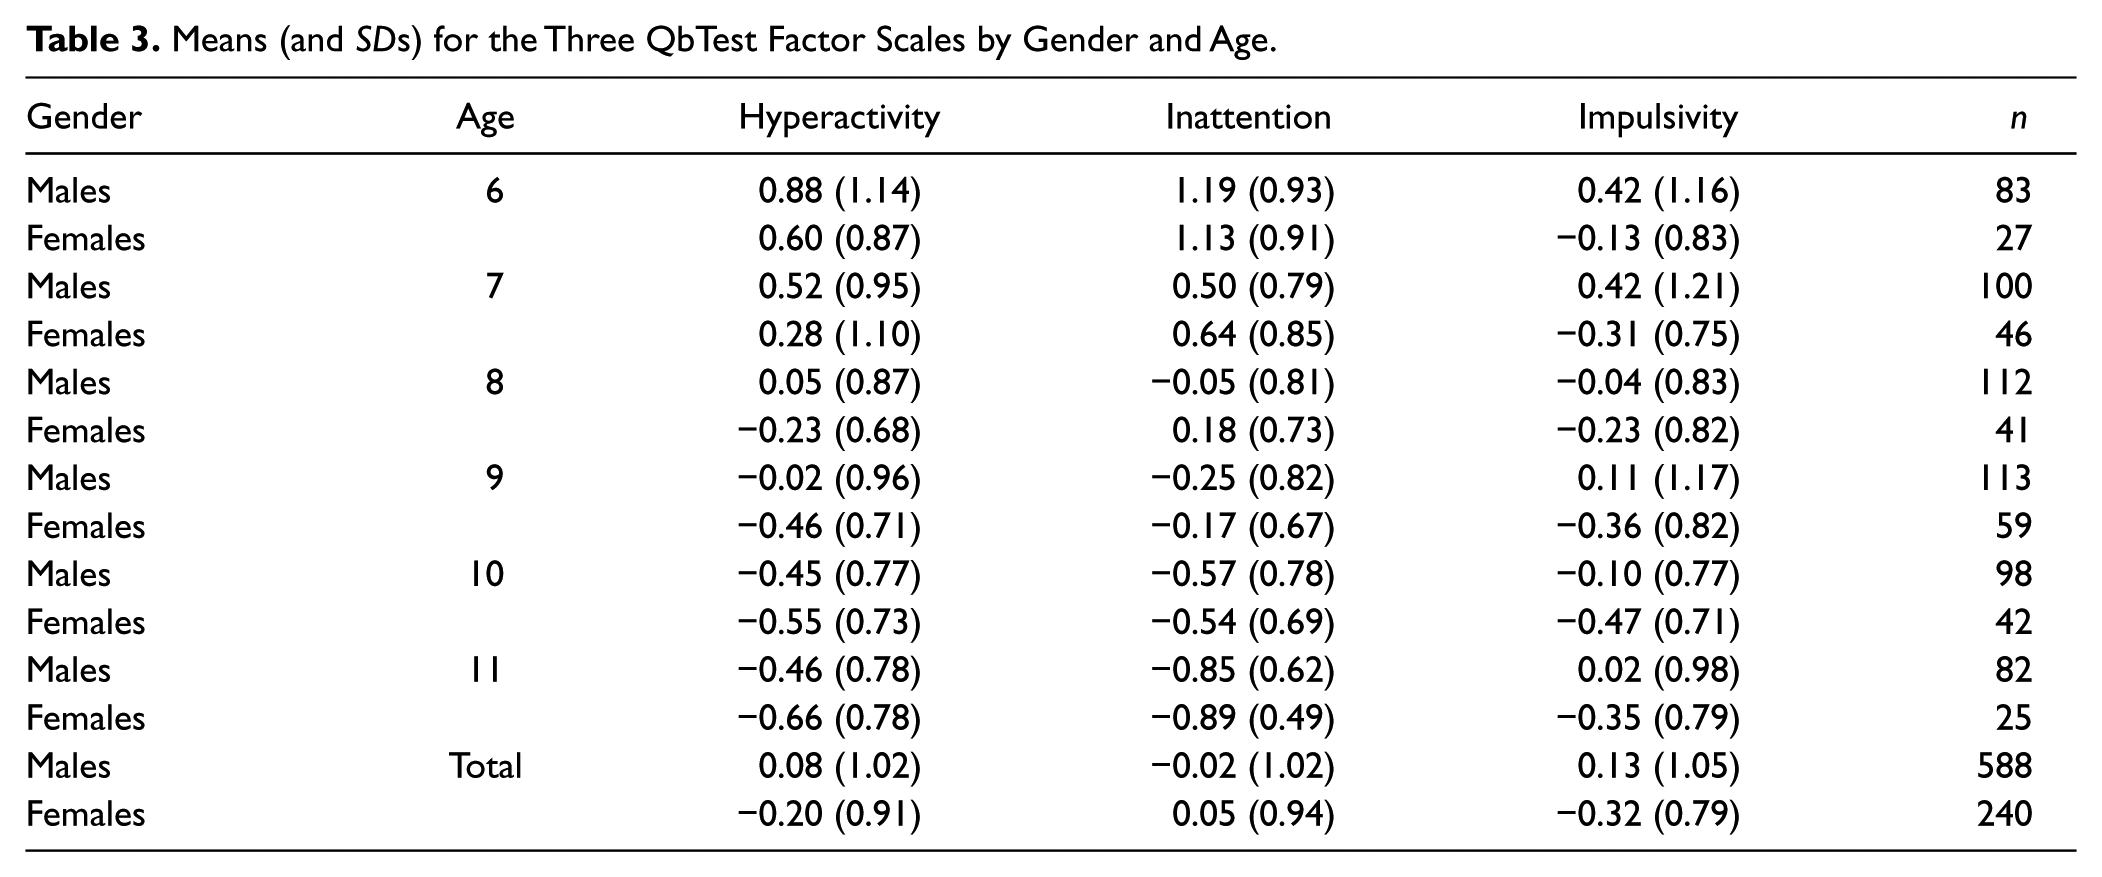
A MANOVA for the obtained three QbTest subscales resulted in significant main effects for gender, Wilks’s Lambda = .95, F(5, 814) = 14.49, p = .001, η2 = .051, and age, Wilks’s Lambda = .63, F(15, 2248) = 26.93, p = .001, η2 = .14, with medium to large effect sizes according to Cohen. Thus, interpretation of these subscales is dependent on age and gender influences. Means and standard deviations for the QbTest subscales are presented separately for gender and age groups in Table 3.
Means (and SDs) for the Three QbTest Factor Scales by Gender and Age.
Concurrent and Discriminant Validity of the QbTest Factors
Table 4 shows the Pearson correlations of the established QbTest factors with Conners’ parent and teacher ratings, KITAP results, and IQ. There was some evidence supporting convergent validity of the QbTest factors. First of all, there was a significant positive correlation between the QbTest factor Hyperactivity and teacher ratings of hyperactive behavior (r = .27**, p < .01) on the Conners’ DSM-Hyperactivity/Impulsivity subscale. Thus, the more motor activity was measured by the QbTest, the more children were rated as being hyperactive-impulsive in classroom situations by their teachers. Moreover, the QbTest factor Impulsivity was significantly correlated with low RT in the KITAP (r = −.42*, p < .05). Children who tended to react faster on the KITAP also scored high on the Impulsivity factor in the QbTest. Finally, as expected, the QbTest factor Inattention showed a significant negative correlation with IQ (r = −.27*, p < .05), meaning that children with higher IQ scores have lower scores on the QbTest Inattention factor. Despite those convergent correlations, however, there were no other significant correlations between KITAP variables and QbTest factors. Also, QbTest factors did not significantly correlate with Conners’ parent ratings of inattentive or hyperactive/impulsive behavior.
Multitrait–Multimethod (MTMM) Matrix for Sample II.

Note. MTMM = multitrait–multimethod; KITAP = Test of Attentional Performance for Children; WISC−IV = Wechsler Intelligence Scale for Children–Fourth edition; DSM = Diagnostic and Statistical Manual of Mental Disorders. Significant correlations indicating concurrent or discriminant validity are boldface.
n = 102. bn = 94. cn = 32. dn = 87.
p < .05 level (two−tailed). **p < .01 level (two−tailed).
Concerning discriminant validity, no significant correlations between QbTest factors Hyperactivity and Impulsivity and WISC-IV results were found that can be interpreted as an indicator of discriminant validity for those factors. Furthermore, as expected, Conners’ parent and teacher ratings of Peer Relations showed no significant correlation with any of the three QbTest factors.
Discussion
The QbTest is a behavioral assessment tool in ADHD. We explored the factor structure of the QbTest children’s version (6-12) in a large sample of German children referred for assessment of ADHD. An exploratory principal factor analysis yielded a three-factorial model that explained 76% of the total variance in the data. Validity analyses in a second sample of German ADHD children revealed mixed findings regarding the convergent and divergent validity of the established QbTest factors. Although the Hyperactivity factor was significantly correlated with teacher ratings of hyperactive behavior, the other two QbTest factors showed less overlap with rating measures as well as with another laboratory test for attention assessment. Since other CPTs do not separately assess the participant’s motor activity, the three emerging factors and initial evidence of their concurrent validity constitute a major advantage of the QbTest. Given that validity results are heterogeneous though, further studies exploring psychometric quality and clinical utility of the QbTest are needed.
The factor structure in the presented study shows that there is one factor explaining a large amount of variance and two more factors each explaining additional unique parts of variance. From this finding, we can conclude that a participant’s performance on the QbTest cannot be sufficiently described by one overall measure of performance, but instead all three factor scores must be considered. While the first factor, Hyperactivity, contained the five motor activity variables, including Time Active, Distance, Area, Microevents, and Motion Simplicity, the second factor, Inattention, consisted of the three variables Omission Errors, RT, and RT Variation, which have been frequently linked with inattention in other studies (McGee et al., 2000; Nichols & Waschbusch, 2004). The third factor, Impulsivity, contained the three variables Commission Errors, Multiresponse, and Anticipatory, which clearly show conceptual coherence with behavioral impulsivity. Particularly, commission errors have been used as an indicator for impulsivity in many studies applying CPTs (Egeland & Kovalik-Gran, 2010a, 2010b; McGee et al., 2000; Nichols & Waschbusch, 2004; Willcutt et al., 2005). Hyperactivity was the factor explaining the largest amount of variance in this sample. Apparently, the five motor activity variables that show extremely high factor loadings on Hyperactivity are best described in one single factor due to their high conceptual coherence. Variables constituting the Inattention and Impulsivity factor are more heterogeneous, as also shown in their lower factor loadings. Internal consistency values for all three factors were adequate to excellent. This overall result is satisfactory.
Results from the MTMM analyses yielded mixed findings for convergent and discriminant validity of the established QbTest factors. First of all, the QbTest factor Hyperactivity was significantly correlated with Conners’ teacher ratings of hyperactive/impulsive behavior, indicating convergent validity for this factor. There seems to be correspondence between hyperactive behavior as measured by the QbTest and hyperactive behavior rated by teachers. Since teacher ratings have been shown to be influenced by children’s gender, ethnicity, and SES (Bussing et al., 2008), and have low reliability when monitoring symptoms over time (Rabiner et al., 2010), a valid and reliable laboratory measure for hyperactive behavior would be a welcome addition to ADHD assessment methods. Existing laboratory measures of ADHD, including former CPT versions, have limited to no ability to assess unique hyperactivity symptoms. Therefore, the factor structure presented in this study and the accordance of QbTest Hyperactivity and teacher ratings of hyperactive behavior support the combined measurement of CPT performance and motor activity as implemented in the QbTest.
While convergent validity of the established QbTest factors was partially supported by the significant correlation of the Hyperactivity factor with Conners’ teacher ratings, no associations were found with Conners’ parent ratings of inattentive or hyperactive-impulsive behavior. This result is in line with previous research examining differences in parent versus teacher ability to detect ADHD behaviors, showing teacher ratings to be more accurate (Tripp, Schaughency, & Clarke, 2006).
Furthermore, the Inattention factor showed a significant negative correlation with IQ meaning that children with higher IQ results had lower inattention values. Since attention is the basic behavior necessary to perform well on almost any kind of cognitive test, this result was expected. The result is interesting because it raises the question whether highly inattentive children (i.e., score high on the Inattention factor) may be underestimated by intelligence testing. Moreover, it brings up the question whether children with a higher IQ might be able to compensate deficits on CPTs. Future studies should examine whether these children often end up as “false negatives,” meaning they show normal CPT results while they actually do fulfill diagnostic criteria for ADHD. Contrary to our expectations concerning the association with rating scale measures, the QbTest Inattention factor did not show significant correlations with either Conners’ parent or teacher ratings of inattentive behavior. Maybe, teachers are better able to detect externalizing behavior (i.e., hyperactivity) that is highly visible in classroom situations than internalizing behavior (i.e., inattention), that normally does not disturb classroom proceedings.
We hypothesized that QbTest factors would be associated with KITAP results indicating convergent validity for the three QbTest factors. Results from the MTMM however showed no significant, positive correlations between QbTest factors and KITAP variables. Perhaps the differing levels of aggregation (factors vs. single variables) influenced the correlations. Since KITAP only reports results on single variable level, it was not possible to explore correlations on factor/trait level.
Results regarding discriminant validity were promising since QbTest factors did not significantly correlate with either Conners’ parent or teacher ratings of peer problems. Also, as expected, the QbTest factors Impulsivity and Hyperactivity did not correlate with IQ in the WISC-IV.
Overall, results regarding the validity of the established QbTest factors were heterogeneous. Reports of low to nonexistent correlations between laboratory measures and behavior rating measures of ADHD symptomatology are not unusual. Previous studies examining the relationship of CPTs and behavior ratings for ADHD have repeatedly failed to find significant intercorrelations for parent as well as teacher ratings (DuPaul, 1991; Edwards et al., 2007). Among other investigators, Barkley (1991) has challenged the ecological validity of laboratory measures of ADHD symptoms primarily because of the low to moderate correlations CPT measures have been shown to have with ratings of behavior problems. Others who have studied activity levels in children engaged in a CPT have stated that the CPT setting in fact imitates a classroom situation in which children are for most of the time required to remain seated and to engage in a given task (Reichenbach, Halperin, Sharma, & Newcorn, 1992; Teicher et al., 1996). It has been speculated that one reason for those inconsistent findings might be low correspondence between ratings of behavior and constructs measured by CPTs (Edwards et al., 2007). Behavior ratings on one hand can be seen as an impression that is based on the accumulation of behavior in a certain period of time that occurs in real-life situations (i.e., classroom or home). CPTs on the other hand explore and report behavior in a very specific moment in a laboratory setting. It may be that low correlations repeatedly found for these measures can be explained by the fact that these very different methods simply measure different aspects of behavior. We would expect similar measures like two different CPT versions to show significant, positive correlations then. However, as described above, results from the MTMM showed no significant, positive correlations between QbTest factors and KITAP variables.
In a current study that is in preparation, the predictive value of the QbTest together with the other variables in this study (i.e., Conners’ Rating Scales, KITAP, IQ Scores) will be examined in a set of ADHD patients and healthy matched controls to further evaluate the diagnostic utility of the QbTest.
Additional results of this study are in accordance with key findings of the ADHD literature. First, as expected, gender significantly influenced ADHD symptom severity in Sample I. Moderating effects of gender on ADHD symptomatology have been repeatedly reported in the literature. Girls are more likely to be inattentive and show more internalizing problems but less disruptive behavior compared with boys and are therefore at risk of being under-identified (Berry, Shaywitz, & Shaywitz, 1985; Gershon, 2002). In addition, in a meta-analytic review, Hasson and Fine (2012) found gender to be a significant moderating factor when using CPTs for ADHD assessment with gender effects being more pronounced for impulsivity than for inattention. We replicated those findings from Hasson and Fine (2012), as in our study, gender effects were also most evident for the Hyperactivity and the Impulsiveness subscales and less so for the Inattention subscale. Behavioral assessment measures with separate norms for boys and girls may be an option to reduce gender bias in the diagnostic process.
Second, consistent with the literature (Brocki et al., 2008), age also affected ADHD symptom scores measured with the QbTest. Across all three subscales, QbTest scores decreased with age, highlighting the necessity of age-specific norms as provided by the QbTest.
While assessment of the factorial structure and its concurrent and discriminant validity is an essential first step in evaluating the overall validity of the QbTest, several further issues need to be addressed before the test can be regarded as a well-validated screening and/or diagnostic tool for childhood ADHD. In particular, further research needs to clarify whether the test adequately distinguishes between children with and without ADHD and between children with ADHD and other disorders such as anxiety, depression, and autism spectrum disorder. This is particularly important given the high comorbidity rates between ADHD and these disorders (APA, 2000). Also, it would be desirable for future studies to compare different ADHD subtypes with regard to their QbTest factor scores. As ADHD children constitute a highly heterogeneous group, a significant task for future research is to match different CPT versions with different ADHD subtypes. Altogether the factor-analytic and correlational results presented in this study may indicate that the QbTest is particularly fit to assess children from the predominantly hyperactive as well as the combined hyperactive/impulsive subtype. This will have to be further explored in subsequent psychometric studies on the QbTest. Finally, although some research on QbTest’s sensitivity to detect treatment effects is available (Vogt & Williams, 2011; Wehmeier et al., 2011; Wehmeier et al., 2012), further research regarding this topic is needed.
Limitations
Although the results presented in this study show initial evidence for the utility of the QbTest, some important limitations have to be considered. First, the sample used for factor analyses in this study lacks cases in the 12-year-old category, resulting in an age range that did not include all age groups the QbTest is targeting at. Moreover, since the sample analyzed here consisted of a convenience sample of children referred for ADHD assessment, the sample included children with a wide range of severity of ADHD symptoms. Also, information on the existing comorbidity as well as the ADHD subtype was not available for analysis.
Second, several variables in our factor analysis showed high loadings on more than one factor. The variable Omission Errors for instance loaded high on Inattention but also significantly on Hyperactivity. This variable does not seem to differentiate well between the two different symptom clusters. The variable Multiresponse also had a low communality value and showed moderate loadings on all three factors with the highest loading on Impulsivity. Although the question arises whether these two variables should be removed from the test, the variable Omission Errors is conceptually important and has been consistently interpreted as a measure of inattention in previous CPT research (Halperin, Wolf, Greenblatt, & Young, 1991; Nichols & Waschbusch, 2004). Omission errors have been shown to be related to aspects of attention but significantly less to hyperactive/impulsive behavior and thus comprise differential information (Egeland & Kovalik-Gran, 2010b). We therefore believe that the variable Omission errors should remain in the test, and its classification within the Inattention factor is justifiable. The low factor loadings of Multiresponse can be explained by limited variance of this variable. Since only the most impulsive children press more than one time to a given stimulus, this leads to a restriction of variance and thus low factor loadings. Despite those mathematical issues, the variable Multiresponse could be of clinical use to identify extreme cases of impulsivity and should therefore remain in the test as well.
Finally, a diagnosis is always made by a clinician who must interpret and integrate different diagnostic results. Therefore it is important to note that as far as construction and implementation of rigorously designed and reliable tests can help us avoid subjective biases in the diagnostic process, the role of subjective interpretation of test results must be considered.
Conclusion
The QbTest is a behavioral assessment tool for ADHD that is increasingly being used in research and clinical settings across many different Western countries. This study is the first to examine the factorial structure and validity of the QbTest. Overall, the results show that the single QbTest variables meaningfully group together and that there is initial evidence for concurrent validity of each of the three emerging factors. However, low correlations with the Conners’ Parent Rating Scales and another laboratory test for attention assessment point to the need for extended research on the psychometric quality of the QbTest. Also additional research needs to further clarify the underlying constructs captured by CPTs in general and whether QbTest may be particularly beneficial in the behavioral assessment of the predominantly hyperactive as well as the hyperactive/impulsive ADHD subtype.
Footnotes
Acknowledgements
We thank all children and their parents for participation. We also thank the anonymous reviewer for helpful and constructive comments on our manuscript.
Declaration of Conflicting Interests
The author(s) declared no potential conflicts of interest with respect to the research, authorship, and/or publication of this article.
Funding
The author(s) received no financial support for the research, authorship, and/or publication of this article.