



Abstract
ADHD is now recognized as a pervasive neurodevelopmental disorder that tends to persist well into adulthood and to be associated with a broad range of negative life outcomes (Faraone, Biederman, & Mick, 2006; Kooij et al., 2010). However, pointing to the need for efficient screening procedures, ADHD is also responsive to treatment (Hodgkins et al., 2012; Shaw et al., 2012). According to Diagnostic and Statistical Manual of Mental Disorders (4th ed.; DSM-IV; American Psychiatric Association [APA], 1994), ADHD encompasses a number of pervasive and impairing symptoms, including severe problems of inattention and/or hyperactivity and impulsivity. A metaregression performed in a set of 102 carefully selected international studies estimated the worldwide prevalence of ADHD to be 5.29% (95% confidence interval [CI] = [5.01, 5.56]; Polanczyk, Silva de Lima, Lessa Horta, Biederman, & Rohde, 2007). According to DSM-IV, three types of ADHD can be distinguished according to whether the predominant symptoms are characterized by inattention, hyperactivity-impulsivity, or both (APA, 1994).
Teachers can provide clinicians with important information regarding the child’s behavior and performance at school, like parents would do at home (Sayal & Goodman, 2009). Although it is common to observe discrepancies between observers when rating ADHD symptoms (e.g., parents and teachers; Rettew et al., 2011), this information is crucial to proper diagnostic procedures that require behavioral disturbances to be documented in more than one setting. Also, this information is useful to monitor the evolution of children diagnosed with ADHD during treatment. Such interprofessional communications could clearly be facilitated by the reliance on a validated, easy-to-use, behavioral observation rating scale for ADHD symptoms. Unfortunately, no such validated scale exists for French-speaking teachers, or professionals. Knowing that laypersons tend to lack information regarding ADHD, this creates a significant obstacle to research, communication, and practice in French-speaking countries. In fact, French is the official language in 32 countries and territories worldwide (Francophonie), including 5 European countries (France, Belgium, Switzerland, Monaco, and Luxembourg) and Canada, is one of the European institutions’ United Nations’ official languages, and remains the most often taught second language worldwide.
The ADHD Rating Scale–IV (ADHD-RS-IV) is the most commonly used measure of ADHD symptoms (DuPaul et al., 1997) and has already been successfully validated into many other languages (Döpfner et al., 2006; Magnusson, Smari, Gretarsdottir, & Pradardot, 1999; Szomlaiski et al., 2009; Zhang, Faries, Vowles, & Michelson, 2005). This instrument includes 18 items rated on a 4-point scale (0 = rarely or never to 3 = very often) and parallel versions exist for clinicians, teachers, and parents. Even-numbered items represent the 9 Inattention criteria of DSM-IV (e.g., “easily distracted”) and odd-numbered items represent the 9 Hyperactivity-Impulsivity criteria (e.g., “leaves seat”). The three symptoms of the DSM-IV specific to Impulsivity are numbered 14, 16, and 18 (“blurts out answers,” “difficult waiting turn,” and “interrupts,” respectively).
There have been several publications regarding the ADHD-RS psychometric properties rated by teachers (DuPaul et al., 1997), parents (DuPaul et al., 1998), or clinicians (Magnusson et al., 1999; Zhang et al., 2005). In these studies, Exploratory Factor Analyses (EFA) generally contrasted one- (ADHD), two- (Inattention and Hyperactivity-Impulsivity) or three- (Inattention, Hyperactivity, and Impulsivity) factor solutions (Döpfner et al., 2006; DuPaul et al., 1997; DuPaul et al., 1998). Additional studies rather tried to contrast the fit to the data of a priori solutions using confirmatory factor analyses (CFA), and these studies generally supported a two-factor structure (Inattention and Hyperactivity-Impulsivity) for the ADHD-RS in both clinical and community samples, and cross-culturally (Davis, Cheung, Takahashi, Shinoda, & Lindstrom, 2011; Gomez, Harvey, Quick, Scharer, & Harris, 1999; Martel, von Eye, & Nigg, 2010; Ohnishi, Okada, Tani, Nakajima, & Tsujii, 2010; Wolraich et al., 2003). The reported scale-score reliability coefficients (i.e., Cronbach’s α) of the resulting Inattention (.95) and the Hyperactivity-Impulsivity (.94) factors are generally high when rated by teachers (Gomez et al., 1999).
In psychiatric measurement, the main question is whether a primary dimension (e.g., depression, anxiety) does exist as a unitary disorder, including specificities (i.e., as represented by a bifactor model), or whether these specificities rather define distinct facets without a common core (i.e., represented by a classical CFA model). Recently, this key conceptual issue has been questioned for ADHD. First, ADHD has been found to represent a relatively stable condition across the life span that persists at least well into adulthood, although the specific manifestations of this condition may change over the course of development (Faraone, Biederman, & Mick, 2006). This suggests that there might be a generic (G) component of ADHD that lies at the core of this condition and is stable over time, with remaining specific (S) manifestations that fluctuates over time and contexts (Martel et al., 2010). This distinction is also consistent with the way ADHD is defined in the DSM-IV, with a core G set of ADHD manifestations leading to the main diagnosis, but specificities of individuals leading them to fit more closely to the Inattentive, Hyperactive-Impulsive, or Combined subtypes. Within the framework of CFA, a bifactor model (Holzinger & Swineford, 1937) whereby each item is simultaneously defined by one generic G ADHD factor and one subtype-specific S-factor (Hyperactivity-Impulsivity or Inattention) would be particularly well-suited to this possibility. More precisely, a bifactor model first analyses the total covariance among the items to extract a global G-factor underlying all items, and then models the residual covariance not explained by the G-factor through the specific S-factors.
The few studies that contrasted classical CFA models with bifactor models in studying ADHD symptoms generally supported a bifactor solution, including one ADHD G-factor and two specific (Inattention and Hyperactivity-Impulsivity) S-factors among (a) a mixed clinical-community population of children rated with the teacher version of the ADHD-RS and parental reports on other instruments (Martel et al., 2010), (b) among clinical (Toplak et al., 2009) or community (Normand, Flora, Toplak, & Tannock, 2012; Ullebø, Breivik, Gillberg, Lundervold, & Posserud, 2012) samples of children rated with other instruments, (c) among community samples of adults rated with other instruments (Caci, Oliveri, & Dollet, 2011). However, these studies are still few and deserve replication, particularly in large community samples where the screening utility of the ADHD-RS needs to be maximized. In particular, although they all supported bifactor solutions, these studies also report that both of the S-factors explained relatively little variance in ADHD ratings and systematically showed that at least one of the subtype-specific S-factor was weakly defined, calling into question the appropriateness of some diagnostic subtypes of ADHD. Unfortunately, these studies also disagreed as to whether it was the Inattention (Toplak et al., 2009), the Hyperactivity-Impulsivity (Toplak et al., 2009; Ullebø et al., 2012), or both (Martel et al., 2010) S-factors that posed problem, reinforcing the need for replication. In particular, two studies showed that the conclusions did not change based on the informant (parent vs. children), but rather according to the nature of the instrument, so that interview ratings resulted in an undefined Inattention S-factor, whereas questionnaire data resulted in an undefined Hyperactivity-Impulsivity factor (Toplak et al., 2009).
Another important issue that has yet to be systematically investigated has to do with the critical assumption that the various versions of the ADHD-RS measure the same trait in samples from distinct subpopulations among which the instrument will be used (e.g., gender groups, age groups). This property is known as measurement invariance and represents a prerequisite to valid comparisons regarding mean-level differences, variability differences, and predictive differences between the targeted subgroups (Meredith, 1993). In regard to ADHD measurement based on teacher ratings, this verification is particularly important. Indeed, as we previously noted, the specific manifestations of ADHD are known to differ as a function of age and genders (Barkley, Murphy, & Fischer, 2008; Faraone, Biederman, & Mick, 2006; Faraone, Biederman, Spencer, et al., 2006), while the generic assumption is that the common core of the ADHD construct remains the same. Teachers also tend to be more aware of boys disturbing behaviors in the classroom than of girls who tend to disturb differently. Thus, they may provide less reliable ratings of girls ADHD.
In summary, this article aims to investigate the psychometric properties of the ADHD-RS rated by teachers to conduct four specific verifications:
How well does the a priori two-factor structure of the ADHD-RS (mimicking the DSM-IV subtypes) fit the ratings provided by French teachers?
Will a bifactor model provide a better representation of ADHD-RS ratings by teachers, as suggested by some previous studies based on ADHD symptoms?
Is the ADHD-RS reliable when rated by French teachers?
Is the ADHD-RS measurement model invariant across genders, age groups, and gender by age groups?
Method
Participants and Material
This article uses data from the ChiP-ARD (Children and Parents With ADHD and Related Disorders) study, targeting French children and adolescents from the general population aged between 4 and 18 years old. The ChiP-ARD study was conducted in 20 kindergarten schools (pré-élémentaires or maternelles), 30 primary schools (élémentaires), and 14 secondary schools (colleges and lycées) from Southern France (Nice). The data were collected in spring 2010 and 2011, during two distinct (nonlongitudinal) waves of data collection. Overall, 262 teachers participated in the study (M age = 43.9; SD = 8.6; range = 24-61), 47 were males (17.94%). A letter was randomly drawn from the alphabet for each class and the teacher was asked to include 2 to 4 youths whose name began with this letter (or the next one if no name matched the random letter, and starting over at letter “A” if letter “Z” was reached). Parents had to return a signed consent form that was kept anonymous by teachers who allocated them upon reception an eight-digit unique identifier. Teachers thus provided ratings of 132 youths in kindergarten (64 girls, 48.49%), 349 youths in primary schools (174 girls, 49.86%), and 411 youths in secondary schools (220 girls, 53.53%). Overall, the sample comprised 892 youths, including 458 girls (51.35%), with a mean age of 10.59 (SD = 3.50) for girls and 10.18 (SD = 3.32) for boys, t(890) = 1.829, ns). This study received the support of the Commissioner of Education and the Department of Education, complied with normative ethical prescriptions for French medical research, and the procedures used to keep article-based and electronic data secured and anonymous were approved by the Commission Nationale Informatique et Liberté.
The French version of the teacher version of the ADHD-RS was developed through classical translation–back-translation procedures by members of the research team and the resulting back-translated English was compared with the original version for final adjustments by the main author of the original ADHD-RS (i.e., DuPaul).
Statistical Analyses
The main models were estimated with Mplus 6.12 (L. K. Muthén & Muthén, 2010), from polychoric correlation matrices using the robust weight least square estimator (WLSMV). WLSMV estimation has been found to outperform Maximum Likelihood with ordered-categorical items involving five or less answers categories such as those used in the present study (Beauducel & Herzberg, 2006; Finney & DiStefano, 2006; Flora & Curran, 2004; Forero, Maydeu-Olivares, & Gallardo-Pujol, 2009; B. O. Muthén, du Toit, & Spisic, 1997).
The fit of five a priori alternative models of teachers answers to the ADHD-RS instrument was contrasted: a one-factor ADHD model (M1), a model including two correlated factors (Inattention and Hyperactivity-Impulsivity: M2), a model including three correlated factors (Inattention, Hyperactivity, and Impulsivity: M3), a bifactor model including one ADHD G-factor and two specific S-factors (Inattention and Hyperactivity-Impulsivity: M4), and a bifactor model including one ADHD G-factor and three specific S-factors (Inattention, Hyperactivity, and Impulsivity: M5).
Measurement invariance tests across gender (male vs. females), age groups (defined as children younger than 12 years old vs. adolescents aged more than 12 years old), and combinations of gender and age groups were performed in a sequential strategy following Meredith recommendations (Meredith, 1993) as adapted for ordered-categorical items by Millsap and Tein (2004; see also Morin et al., 2011). The sequence of tests is as follows: (a) configural invariance, (b) metric/weak invariance (invariance of the factor loadings), (c) scalar/strong invariance (invariance of the loadings and thresholds), (d) strict invariance (invariance of the loadings, thresholds, and uniquenesses), (e) invariance of the latent variances (invariance of the loadings, thresholds, uniquenesses, and variances), and (f) latent means invariance (invariance of the loadings, thresholds, uniquenesses, variances, and latent means). It should be noted that, because bifactor models are specified as orthogonal, tests of the invariance of the latent covariances are precluded.
The fit of all models was evaluated using various indices (Hu & Bentler, 1999; Yu, 2002): the WLSMV chi-square statistic (χ2), the comparative fit index (CFI), the Tucker–Lewis Index (TLI), the root mean square error of approximation (RMSEA), and the 90% CI of the RMSEA. These fit indices are interpreted the same way as with ML/MLR estimation, with values greater than .95 for CFI and TLI are considered to be indicative of adequate model fit. Values smaller than .08 or .06 for the RMSEA support respectively acceptable and good model fit. To test for fit improvement, we used the MPlus DIFFTEST function (MDΔχ2; Asparouhov & Muthén, 2006; B. O. Muthén, 2004). As the chi-square itself, MDΔχ2 tends to be oversensitive to sample size and to minor model misspecifications. In this regard, and to take into account the overall number of MDΔχ2 tests used in this study, the significance level to identify noninvariance was fixed at .01 (Bollen, 1989; Morin, Madore, Morizot, Boudrias, & Tremblay, 2009; Rensvold & Cheung, 1998). It is also generally recommended to use additional indices to complement MDΔχ2 tests when comparing nested models (Chen, 2007; Cheung & Rensvold, 2002): a CFI diminution of .01 or less and a RMSEA augmentation of .015 or less between a model and the preceding model in the invariance hierarchy indicate that the measurement invariance hypothesis should not be rejected. A supplementary file was prepared to accompany this article in which annotated input codes used to implement these models in Mplus are provided (for the final bifactor model as well as for the full sequence of tests of invariance across gender groups). This file is available upon requests from the first and second authors.
Results
CFA and Reliability
The single-factor model (M1) showed the worst fit to the data (Table 1). Both the two-factor (M2) and three-factor (M3) models presented a satisfactory level of fit to the data (CFI and TLI > .95; RMSEA < .08), though the improvement in fit related to the addition of an Impulsivity factor remained well below the recommended value for differences in these indices. The estimated M3 correlation between the Hyperactivity and Impulsivity factors was also high enough (.813) to call into question their distinctiveness. In the M2 model, the estimated latent factor correlation between the Inattention and Hyperactivity-Impulsivity factors was more reasonable in size (.560), but still suggested the presence of a common core of ADHD symptoms, justifying the investigation of bifactor models.
Fit Indices for the CFA Models (WLSMV Estimator, N = 892).
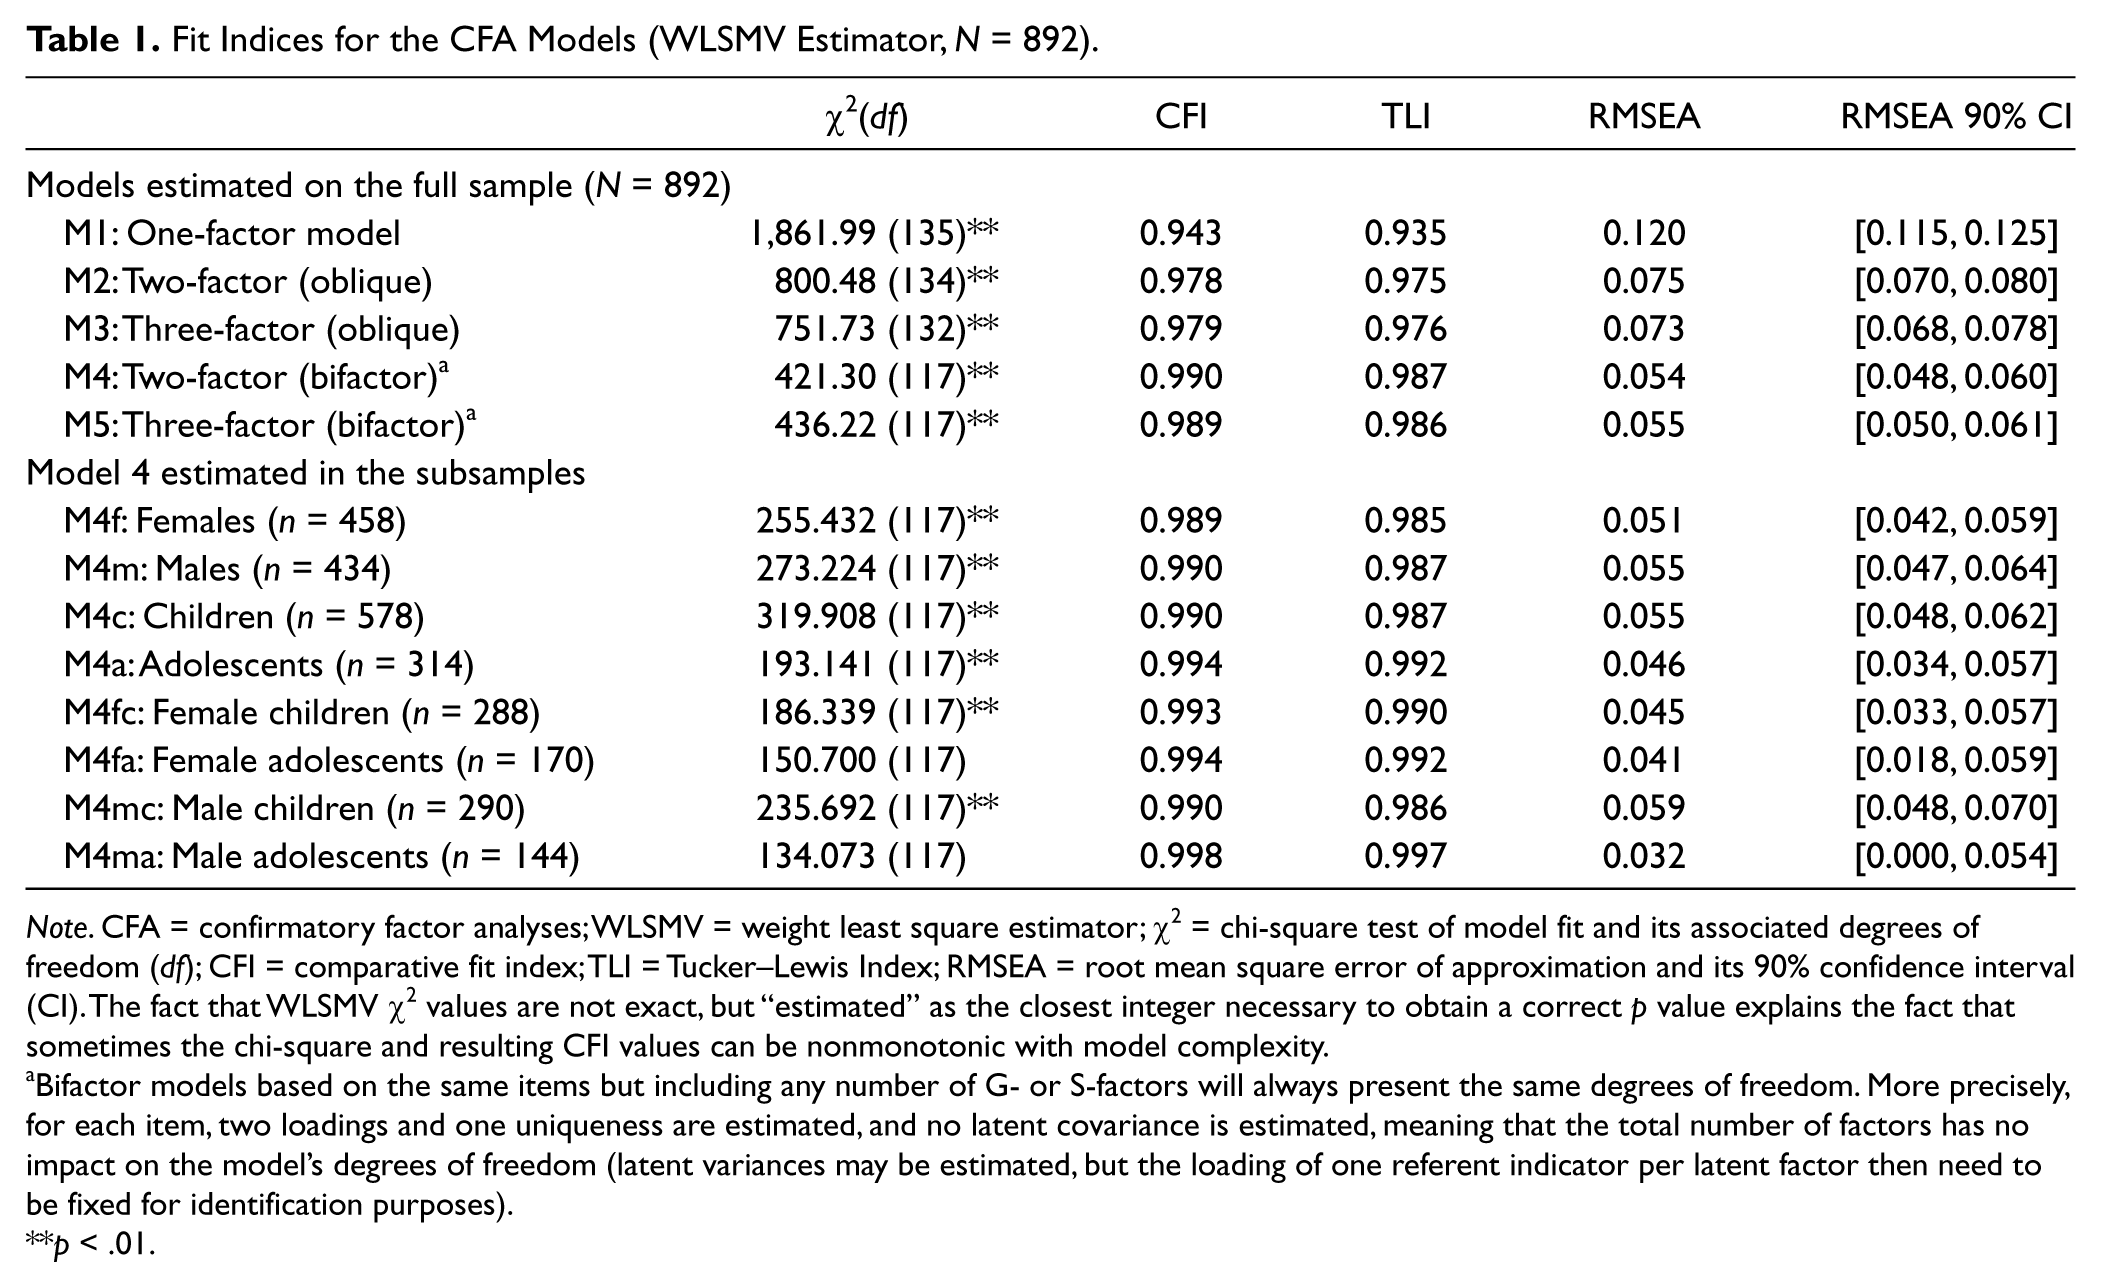
Note. CFA = confirmatory factor analyses; WLSMV = weight least square estimator; χ2 = chi-square test of model fit and its associated degrees of freedom (df); CFI = comparative fit index; TLI = Tucker–Lewis Index; RMSEA = root mean square error of approximation and its 90% confidence interval (CI). The fact that WLSMV χ2 values are not exact, but “estimated” as the closest integer necessary to obtain a correct p value explains the fact that sometimes the chi-square and resulting CFI values can be nonmonotonic with model complexity.
Bifactor models based on the same items but including any number of G- or S-factors will always present the same degrees of freedom. More precisely, for each item, two loadings and one uniqueness are estimated, and no latent covariance is estimated, meaning that the total number of factors has no impact on the model’s degrees of freedom (latent variances may be estimated, but the loading of one referent indicator per latent factor then need to be fixed for identification purposes).
p < .01.
Accordingly, the fit to the data of two a priori bifactor models was also estimated, one based on two specific S-factors and one global G-factor (M4) and one based on three S-factors and one G-factor (M5). The comparison once again supported the more parsimonious solution M4—showing that it presented a similar, yet slightly decreased (–.001 for CFI and TLI and +.001 for RMSEA), level of fit to the data. Because the bifactor Model M4 fitted data better than the more classical Model M2, this model was retained as the final model for this study. Interestingly, the fit of this model was also fully satisfactory (see the lower portion of Table 1) in all possible subgroups of participants based on gender (males vs. females), age groups (children vs. adolescents), and gender by age groups (female children or adolescents, and male children or adolescents) with CFI and TLI > .95 and RMSEA < .06.
Table 2 presents the parameters estimated for this final model (M4) and for the comparison model (M2). Both factors are well defined with items presenting very strong and significant factor loadings (λ = .802-.942) on their respective factors and a high level of communality (h2 = .643-.887), suggesting low level of measurement errors as reflected in items’ uniquenesses (δ = 1 – h2). These results are also observed for Model M4 because both models include the same specific factors. Furthermore, the standardized loadings on the ADHD G-factor in Model M4 are also moderately strong and significant (λ = .553-.937), suggesting a well-defined common core of ADHD symptoms. Finally, the standardized loadings are high on the specific Inattention factor (λ = .464-.726), albeit smaller than in M2 and very weak (Items 12, 14, 16, 18; λ = .284- .406), nonsignificant (Items 4, 6, 8, and 10), or even negative (Item 2, λ = –.168) on the specific Hyperactivity-Impulsivity factor. This shows that once the common core of ADHD symptoms is taken into account by the G-factor, there remains a substantial level of covariance in the items that is explained by a specific Inattention factor but not by a specific Hyperactivity-Impulsivity factor. Therefore, Hyperactivity-Impulsivity symptoms apparently mostly serve to define the ADHD G-factor. In fact, the standardized loadings are so low as to suggest that all of the specificity remaining in these items seems to be linked with unreliability in teachers’ ratings. This result calls into question the DSM-IV Hyperactive-Impulsive subtype.
Standardized Parameters Estimates for the Retained Two-Factor Correlated and Bifactor Models.
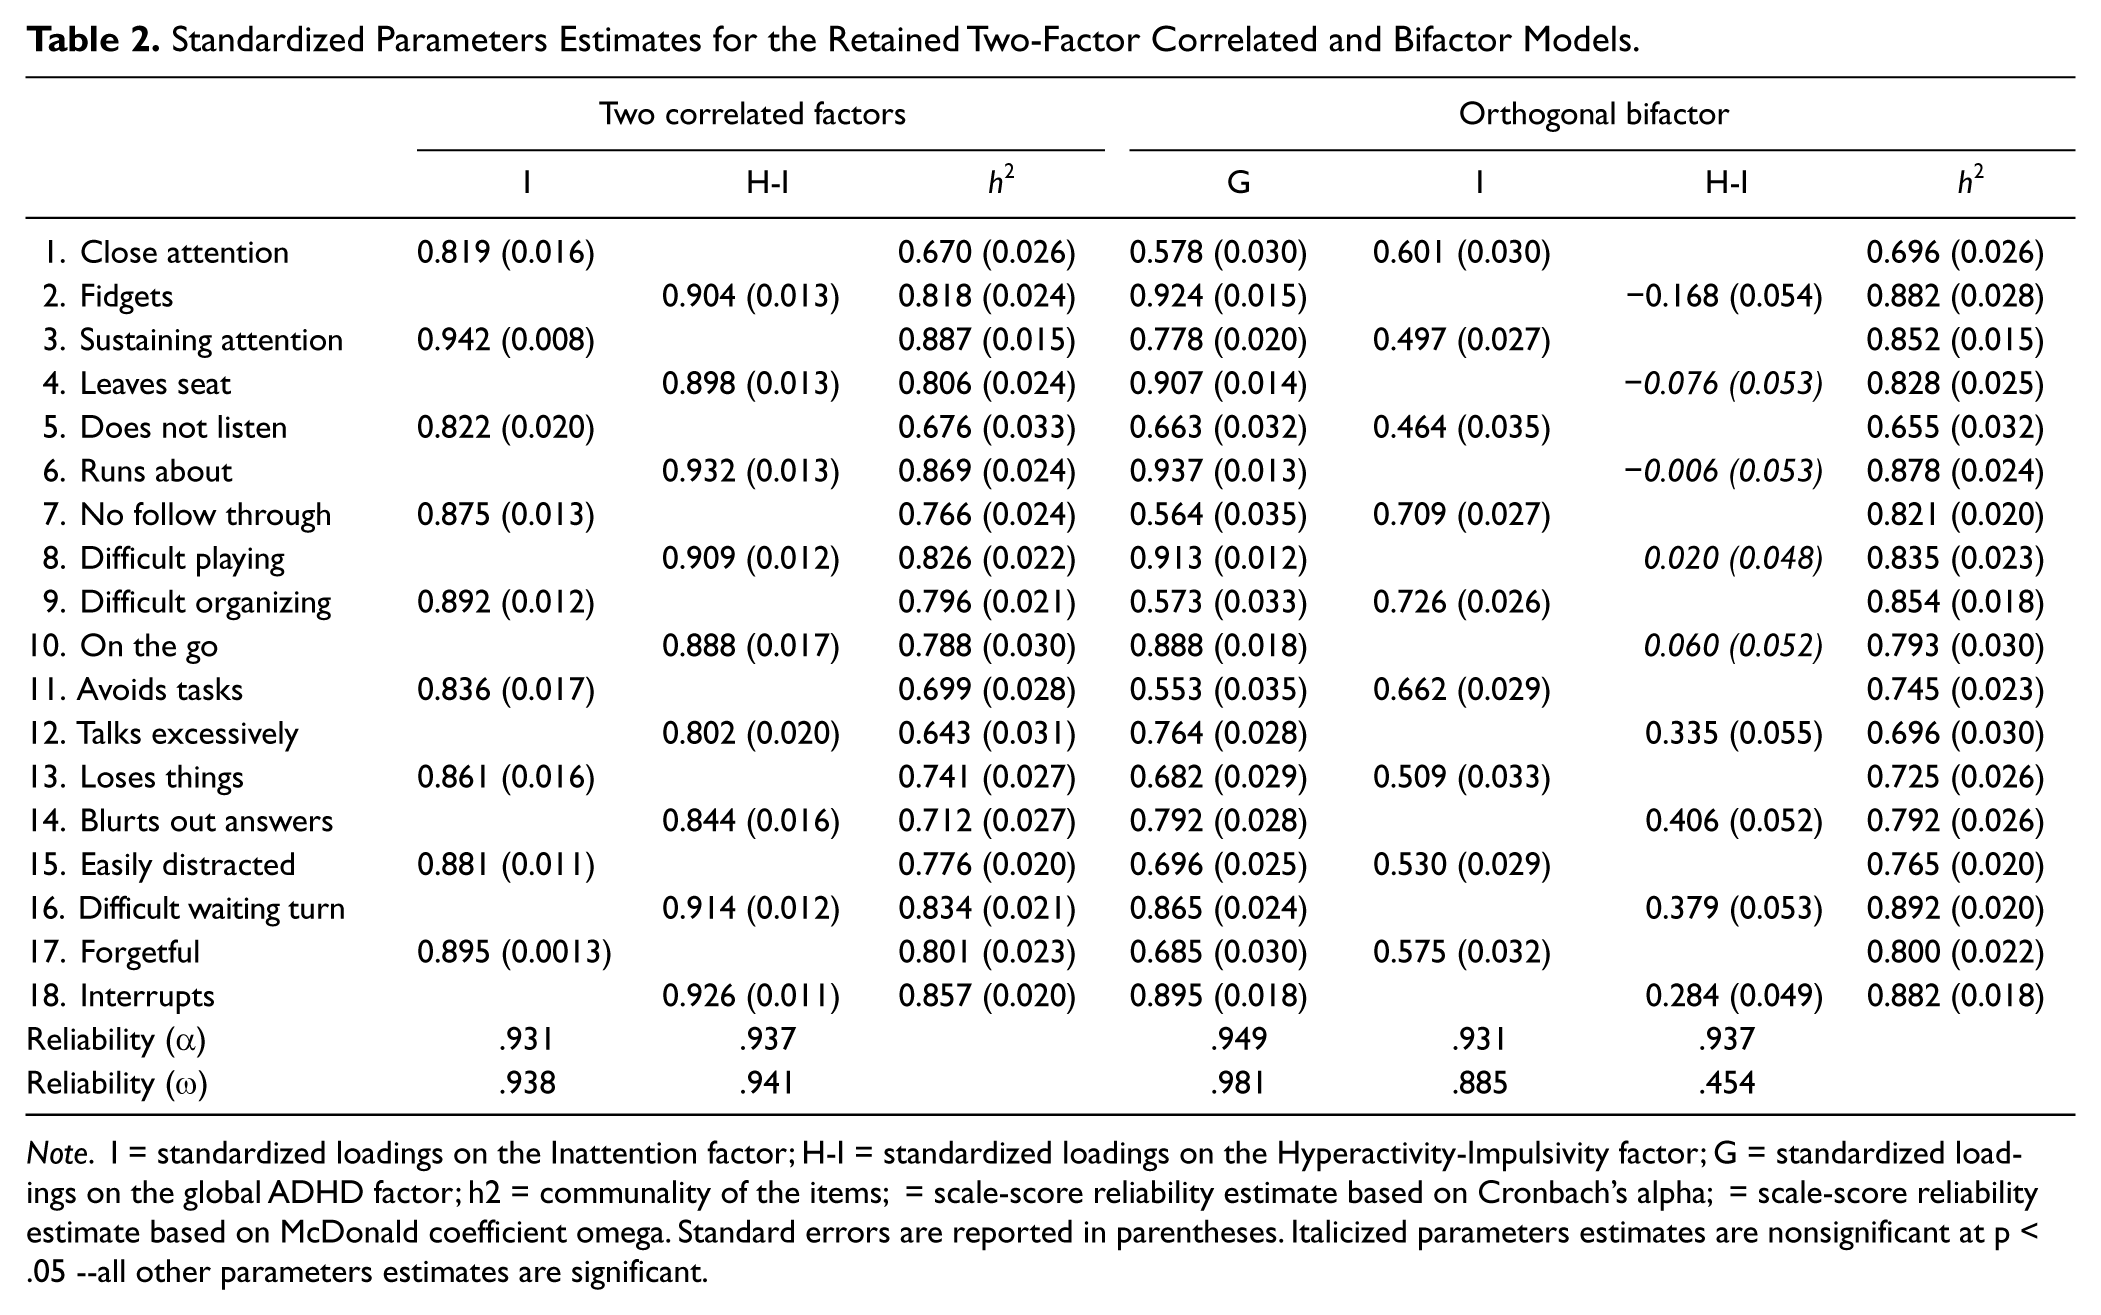
Note. I = standardized loadings on the Inattention factor; H-I = standardized loadings on the Hyperactivity-Impulsivity factor; G = standardized loadings on the global ADHD factor; h2 = communality of the items; = scale-score reliability estimate based on Cronbach’s alpha; = scale-score reliability estimate based on McDonald coefficient omega. Standard errors are reported in parentheses. Italicized parameters estimates are nonsignificant at p < .05 --all other parameters estimates are significant.
Looking at the scale-score reliability, Cronbach’s alpha coefficients appear to be quite high for all factors (.931-.949), and equivalent in both Models M2 and M4 (Table 2). This is due to the specific, and inadequate in this case, manner in which α computes composite reliability (Sijtsma, 2009). McDonald proposed an alternative model-based omega (ω) coefficient providing a more realistic estimate of scale-score reliability, especially when based on complex measurement model such as used in the present study (McDonald, 1970). Expectedly, coefficients ω converge with coefficients α in Model M2. However, when the specificities of the bifactor Model M4 are taken into account, coefficients ω revealed a very high level of reliability of the global ADHD ratings (ω = .981) when these are modeled while also taking into account the presence of S-factors. In accordance with the standardized model results, the scale-score reliability estimate of the Inattention S-factor remains fully satisfactory (ω = .885). However, the scale-score reliability estimate of the Hyperactivity-Impulsivity S-factor is much lower (ω = .454), confirming our previous interpretation that their specificity is mostly due to random noise (i.e., unreliability) in ratings of these symptoms by teachers—not in themselves, but once the common core of ADHD ratings (represented by the G-factor) are taken into account.
Measurement Invariance
Starting from the bifactor Model M4, systematic tests of measurement invariance were conducted according to gender, age, and gender by age groupings (Table 3). Interestingly, throughout the full sequence of invariance tests, all of the increasingly restrictive models estimated across all possible groupings of students provided a satisfactory level of fit to the data, with CFI and TLI > .95 and RMSEA < .06. The tests of metric/weak, scalar/strong, strict, and latent variance invariance across gender are fully supported. In many cases, the fit indices incorporating a control for model parsimony (i.e., TLI and RMSEA) improve when invariance constraints are added to the model; the more restricted model with strict invariance and invariance of the latent variances even shows a substantially higher degree of fit to the data than the baseline model (TLI = .998 vs. .987 and RMSEA = .022 vs. .053). Furthermore, when equality constraints are placed on the latent means, the MDΔχ2 is significant, the ΔRMSEA (.020) is greater than the recommended cutoff of .015, and the ΔCFI, ΔTLI are larger than in the other models. We thus systematically probed these differences (Table 4). When girls’ latent means are fixed to 0 for identification purposes, boys’ latent means (expressed as differences in SD units from girls’ means) are significantly higher on the ADHD G-factor (M = .483; SE = .089; p < .01), nonsignificantly different on the Inattention S-factor (M = .132; SE = .094; p > .05), and significantly lower on the Hyperactivity-Impulsivity S-factor (M = –.334; SE = .125; p < .01). This last result should be put into perspective of the nature of the bifactor model as showing that, once overall levels of ADHD are extracted from the ratings, girls’ present higher levels on the residual ratings related to the specific Hyperactivity-Impulsivity factor that was previously showed to be highly unreliable. This suggests that, for girls, Hyperactivity-Impulsivity ratings tend to have a greater tendency to be interpreted as something different from a generic ADHD syndrome.
Tests of Measurement Invariance for the Final Two-Factor Bifactor Model.
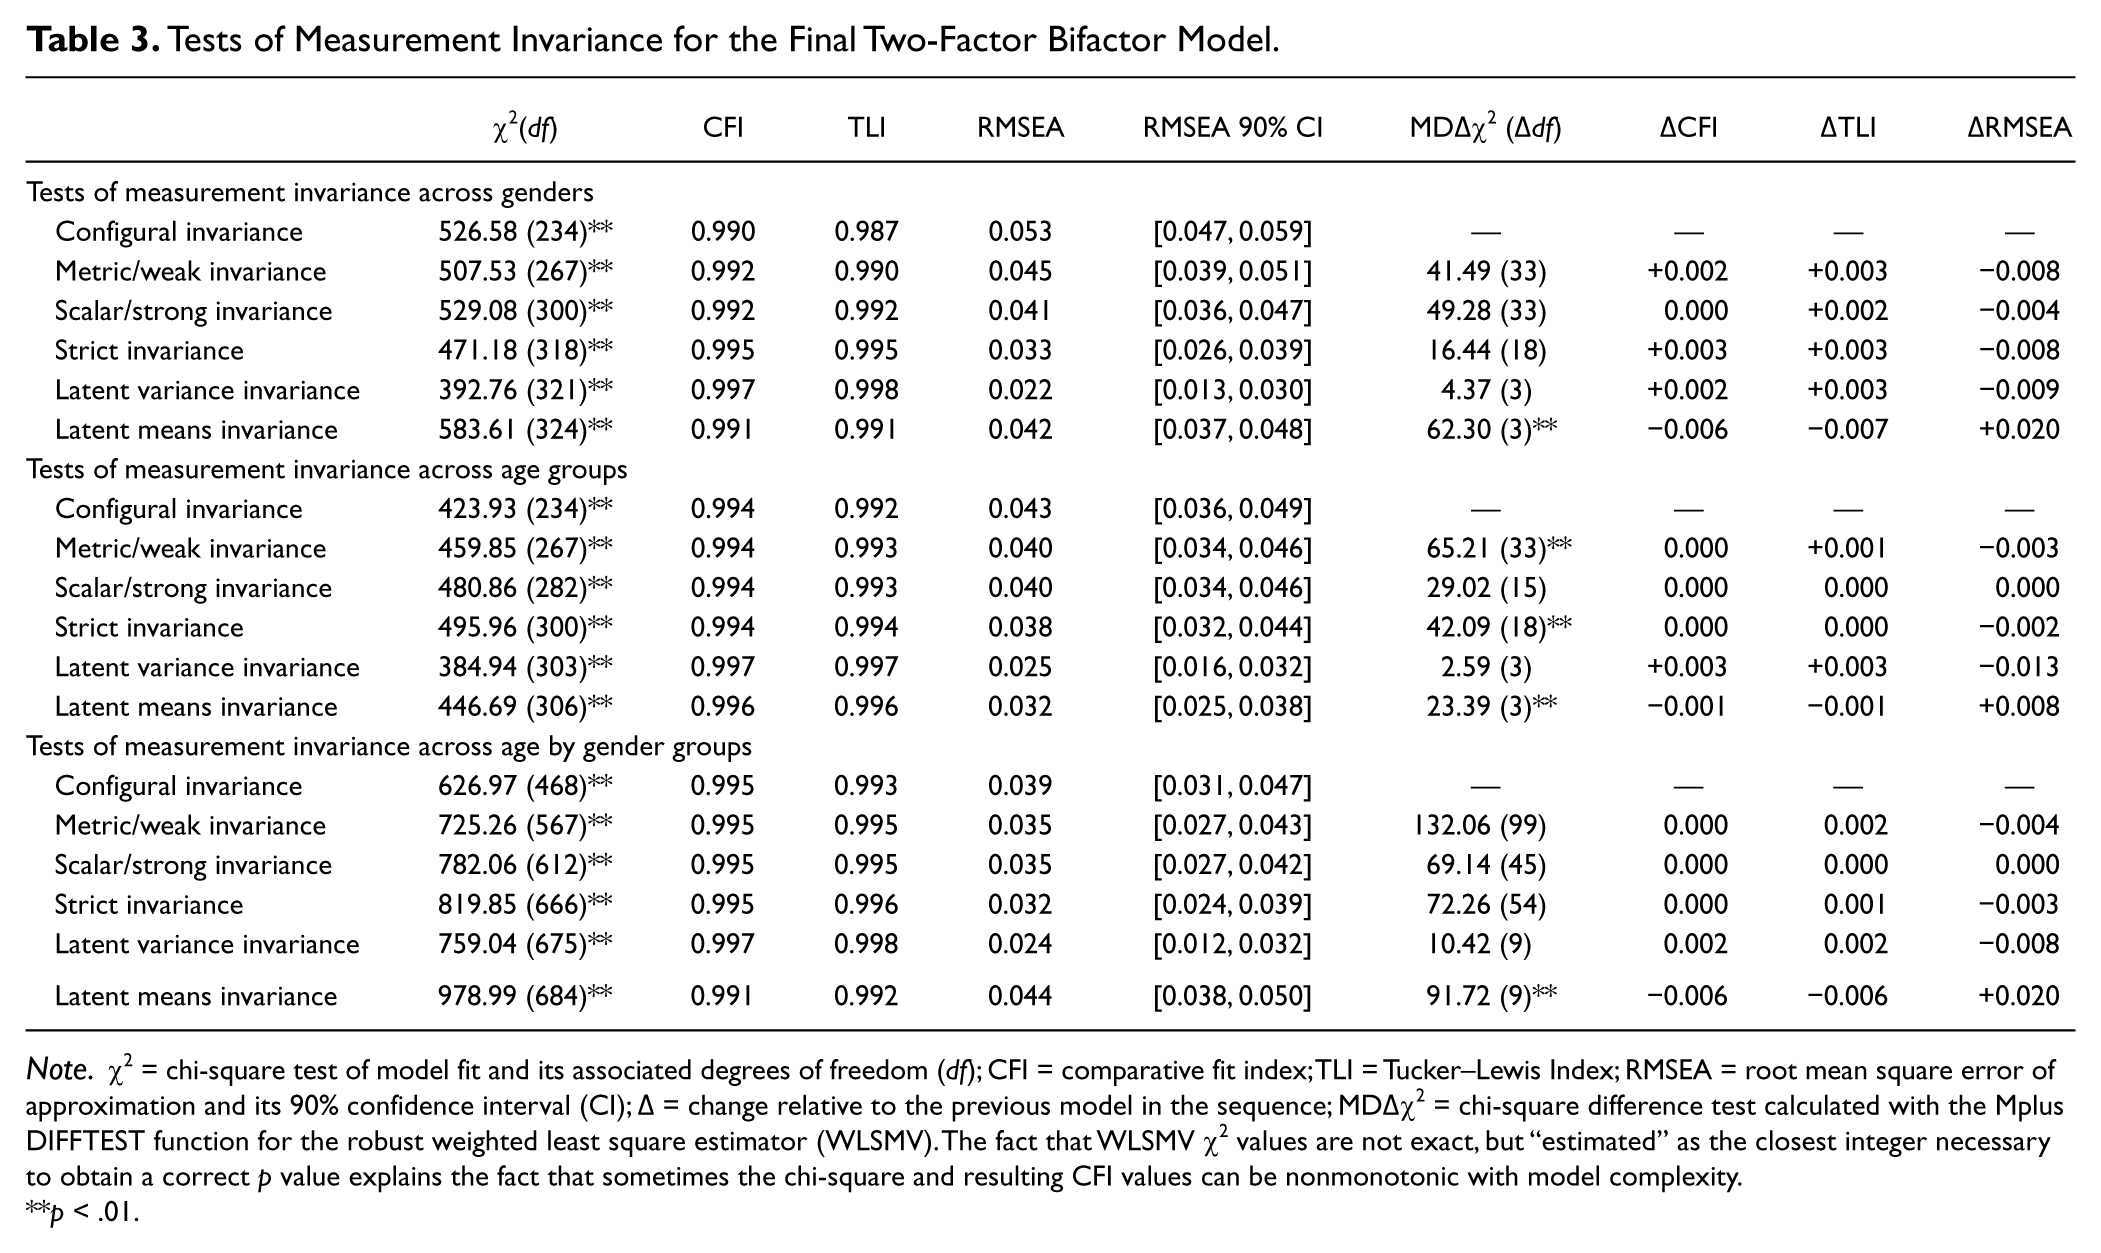
Note. χ2 = chi-square test of model fit and its associated degrees of freedom (df); CFI = comparative fit index; TLI = Tucker–Lewis Index; RMSEA = root mean square error of approximation and its 90% confidence interval (CI); Δ = change relative to the previous model in the sequence; MDΔχ2 = chi-square difference test calculated with the Mplus DIFFTEST function for the robust weighted least square estimator (WLSMV). The fact that WLSMV χ2 values are not exact, but “estimated” as the closest integer necessary to obtain a correct p value explains the fact that sometimes the chi-square and resulting CFI values can be nonmonotonic with model complexity.
p < .01.
Latent Mean Comparisons Across Groups Defined on the Basis of Gender and Age.

p < .05.***p < .001.
Before moving on to tests of measurement invariance according to age groups, and age by gender groups, the items had to be recoded from their original four-category answer scales (0-4) into a three-category answer scale through collapsing the two highest categories. Indeed, an important assumption of models based on ordered-categorical items is that the same number of answer categories is used in all groups, an assumption that is violated when there are empty cells due to one specific answer categories not being used in a specific group. Empty cells are common situation in analyses of ordered-categorical items that is classically solved by collapsing of adjacent answer categories (Lubke & Muthén, 2004; Morin et al., 2009; Reise, Morizot, & Hays, 2007). In the present study, empty cells were mostly linked to reduced sample sizes in some of the subgroups, causing some empty cells at the highest level (i.e., Answer Category 4) of the original answering scale. To ensure that no bias results from this procedure, all of the previous models were fully replicated with this new coding scheme and the results proved to be equivalent to those reported here.
The metric/weak, scalar/strong, strict, and latent variance invariance assumptions fully hold across age groups and age by gender groups. Although some of the MDΔχ2 tests come up as significant for the models based on age groups, they remained small in magnitude and not supported by the observed changes in fit indices, suggesting that their significance may simply reflect chi-square’s known oversensitivity to minor model misspecification and sample size. Examination of the modification indices associated with these models confirms this interpretation. However, once again the results suggest that it may be appropriate to look at age-related differences in the estimated factors (significant and large, in relation to the model degrees’ of freedom MDΔχ2 and higher than usual ΔRMSEA of .008, albeit still under the suggested cutoff score of .015). Compared with children’s, adolescents’ latent means are significantly lower on the ADHD G-factor (M = –.357; SE = .089; p < .01), nonsignificantly different on the Hyperactivity-Impulsivity S-factor (M = .181; SE = .128; p > .05), and significantly higher on the Inattention S-factor (M = .724; SE = .102; p < .01). While the measurement model underlying teachers responses to the ADHD-RS remains perfectly invariant (unbiased) in children and adolescents, our expectations that ADHD manifestations change with age are confirmed with regard to the generic ADHD and Inattention levels. Finally, when looking at mean-level differences based on gender by age group combinations, the results essentially replicate the previous results (Table 4). That is (a) levels on the Inattention S-factor tend to increase with age but are equivalent across gender groups, (b) levels on the Hyperactivity-Impulsivity S-factor tend to be lower for male children only but equivalent across the other groups, (c) levels on the ADHD G-factor tend not only to decrease with age but also to be higher for males.
Discussion
This article is the first to thoroughly assess the structure of the ADHD-RS in a large French community sample of youths rated by their teachers. We used CFA and state-of-the-art methodology to compare the fit to the data of alternative representations of ADHD symptoms. Our results provide a clear support to the superiority of the proposed two-factor bifactor model.
Interestingly, when separate factors (M3) or separate specific S-factors (M5) were estimated to differentiate Hyperactivity from Impulsivity symptoms, the resulting models did not provide a better fit to the data and suggest a very high correlation between these two factors. This result is in line with those from previous studies showing consistency across rating scales, settings, and culture (Amador-Campos, Forns-Santacana, Martorell-Balanzo, Guardia-Olmos, & Pero-Cebollero, 2005; Burns, Boe, Walsh, Sommers-Flanagan, & Teegarden, 2001; Wolraich et al., 2003). In fact, only two studies retained the three-factor structure, and both reported a very high factor correlation between these two factors (r = .64-.80; Gomez et al., 1999; Span, Earleywine, & Strybel, 2002).
The bifactor structure that we retained has received substantial support in the past 5 years (Martel et al., 2010; Martel, Roberts, Gremillion, von Eye, & Nigg, 2011; Toplak et al., 2009; Toplak et al., 2012; Ullebø et al., 2012) but is still not widely used. Also in line with the results from some of these preceding studies, we found that the items apparently all contribute to properly define a common core of generic ADHD symptoms, as well as a specific Inattention factor. However, we found that once the covariance between items is taken into account by the ADHD general factor, only the Inattention specific factor remains meaningful and most of the covariance modeled in the Hyperactivity-Impulsivity specific factor may be attributed to unreliability in teacher ratings. This result is in line with previous questionnaires studies of ADHD symptoms (Martel et al., 2010; Martel et al., 2011; Normand et al., 2012; Toplak et al., 2009; Ullebø et al., 2012) and calls into question the validity of the Hyperactive-Impulsive subtype.
A bifactor model suggests that there are distinct etiological influences that converge on the same core syndrome (Chen, West, & Sousa, 2006) with some remaining specificities. Thus, the bifactor model retained in the present study is in line with multiple-pathways conceptions of ADHD (Nigg, Goldsmith, & Sachek, 2004; Sonuga-Barke, 2002, 2005), at least regarding the development of a specific subtype of ADHD presenting elevated Inattention levels, but not necessarily elevated Hyperactivity-Impulsivity levels. More precisely, our results also show that Hyperactivity-Impulsivity and Inattentive symptoms merge together to define a global, general, condition of ADHD, whereas Inattentive symptoms may appear on their own accord, potentially linked to different causal pathways. For clinicians, this means, that patients can be placed on a continuum with regard to their total score on the ADHD-RS and that specific dimensional evaluations of inattention levels would provide valuable additional information. In these patients with marked Inattentive levels, hyperactivity could potentially become a comorbid condition, as suggested in recent deliberations related to the development of a novel “Inattentive (restrictive)” subtype for Diagnostic and Statistical Manual of Mental Disorders (5th ed.; DSM-V). However, fully validating this proposal would require moving to person-centered profile analyses (Martel et al., 2011). Similarly, additional studies are needed to examine the changes over time in these ratings, as well as their state and trait components (Normand et al., 2012). Finally, and most importantly, additional results are needed to explore the differentiated results that are obtained based on questionnaires, versus interview data, and the reasons for these differences (Toplak et al., 2009; Toplak et al., 2012).
Scale-score reliability estimates for the ADHD-RS confirm that the global ADHD G-factor (ω = .981), as well as the specific Inattention S-factor (ω = .885) present satisfactory reliability levels when properly estimated by model-based methods taking into account the specificities of the bifactor model. These values are fully in line with previous estimates (Danforth & DuPaul, 1996; DuPaul et al., 1997). However, the reliability estimate of the Hyperactivity-Impulsivity S-factor is much lower (ω = .454), confirming that apparent specificity in these ratings is mostly due to unreliability once the common core of ADHD ratings are taken into account. The present study is, to our knowledge, the first study based on a bifactor model of ADHD to report proper model-based estimates of reliability.
Measurement Invariance of the ADHD-RS
A further objective of this study was to investigate the measurement invariance of this final bifactor model. We thus verified whether group membership (gender, age, and age by gender groups) introduced any measurement bias in teachers’ ratings of ADHD symptoms. Interestingly, our results provide strong support to the total invariance of the factor loadings, thresholds, uniquenesses, and variances across all possible subgroups, only alluding to expected mean-level differences across subgroups. We found that levels on the specific Inattention factor tended to increase with age in both gender groups. This may reflect the interaction between pupils’ abilities and the increasing difficulty with grades. In our clinical practice, we often notice that teachers interpret inattention difficulties as a marker for “immaturity,” which is more than rarely the reason invoked to justify repeating a grade or, when the pupil is old enough, to argue for an orientation toward special needs schools or professional. This is fully in line with previous studies showing that pupils with predominantly inattentive ADHD are generally diagnosed much later than pupils with combined ADHD (Solanto, 2000). A second finding of this study is that male children exhibit lower levels on the specific Hyperactivity-Impulsivity, whereas female adolescents present higher levels. This unexpected result may be related to the lack of reliability observed in these specific S Hyperactivity-Impulsivity ratings made by teachers. Alternatively, it may also suggest that teachers more easily excuse disturbing behaviors as expected from male children but are more concerned when older female students exhibit such unusual behaviors. At last, latent means comparisons show that levels on the general ADHD factor decrease with age and are higher for males. This is directly in line with epidemiological results in which the boy:girl ratio of ADHD is commonly reported to be around 3:1. Similarly, the observed age-related trend is in line with the fact that inhibition abilities tend to increase with age making general ADHD symptoms less intense.
Conclusion
Based on a large community sample of French children and adolescents, our data showed that French teachers, even knowing that they tend not to be familiar with ADHD, can reliably rate the French version of the ADHD-RS. However, these results also call into question the existence, and reliability, of a subtype of ADHD mostly characterized by Hyperactive-Impulsive characteristics.
Footnotes
Acknowledgements
The authors are grateful to Dr. Eric Fontas, Vanina Oliveri and Kevin Dollet for their help in the data collection process, to the Inspection Académique des Alpes-Maritimes and the Rectorat des Alpes-Maritimes et du Var for their support, and to the teachers, pupils, and parents for participating in this study.
Declaration of Conflicting Interests
The author(s) declared no potential conflicts of interest with respect to the research, authorship, and/or publication of this article.
Funding
The author(s) disclosed receipt of the following financial support for the research, authorship, and/or publication of this article: This study, but not the paper writing, was funded by a grant to the first author from the French Health Ministry and is recorded on clinicaltrials.gov under the reference NCT01260792.