
Abstract
Keywords
Introduction
Cultural variation is an issue when assessing psychopathological symptoms with psychometric measures across countries. Even given a faithful translation of a rating instrument, specific cultural characteristics might interfere with its reliability or validity (Canino & Bravo, 1994). On account of this, ADHD, with the three core symptoms of inattention, hyperactivity, and impulsivity, is a subject of a lively discussion. Is ADHD a mere cultural construct of modern Western society—an “American” problem (Timimi & Taylor, 2004)—or rather a psychiatric disorder (Faraone, Sergeant, Gillberg, & Biederman, 2003), with a primarily internal and biological etiology (Crawford, Kaplan, & Dewey, 2006; Schneider, Retz, Coogan, Thome, & Rösler, 2006)? Several investigators found prevalence rates in Europe to be significantly lower than those in northern America, and worldwide prevalence rates range from less than 1% to approximately 20% (Faraone et al., 2003; Skounti, Philalithis, & Galanakis, 2007). Polanczyk, De Lima, Horta, Biederman, and Rhode (2007), as well as Willcutt (2012), counter this allegation in systematic reviews that identify differences in assessment methods, such as choice of impairment criteria, diagnostic criteria, psychometric measures used, or sources of information to be primarily responsible for the huge variability in prevalence. Both reviews conclude that the overall and worldwide prevalence of ADHD is about 5% for children and adolescents when taking the mentioned differences in assessment into account.
However, even if uniform methods and rating criteria are applied, the endorsement of hyperactivity and disruptive behavior of children seems to vary across countries. The “International Multicenter ADHD Genetics Project (IMAGE)” is one of the largest research projects on ADHD, with more than 1,000 families that participated in 11 European centers (Kuntsi, Neale, Chen, Faraone, & Asherson, 2006). Although administration and instruments were the same in all locations, the mean number of ADHD symptoms differed significantly across countries (Müller et al., 2011), leading to the assumption that conceptual differences between cultures seem to influence ADHD assessment. There is, therefore, every indication that ADHD is a primarily biological condition with a stable worldwide prevalence, although the estimation of what kind of behavior is seen as problematic might differ across countries, ethnicities, and cultures. Neglecting the influence of cultural variation on the diagnostic process might lead to general diagnostic algorithms and cutoffs that are not suitable for classification in different countries (Canino & Alegría, 2008).
The Conners questionnaires are widely used tools for diagnostic and research purposes of ADHD. They assess core symptoms and related problems—especially oppositional defiant disorder and conduct disorder—based on Diagnostic and Statistical Manual of Mental Disorders (DSM-IV; 4th ed.; American Psychiatric Association [APA], 1994) criteria (Sparrow, 2010). There are forms for parents and teachers, as the diagnostic criteria require impairment across different settings, as well as self-rating forms for children. Normative data exist for Canadian and U.S. populations. Self-rating and parent scales were also adapted for the Spanish-speaking population of the United States. Those scales, or parts of them, have been translated into various languages and have been used in diverse cultural settings in and outside of North America. Countries where adaptations or translations of the teacher rating scales were used include Lebanon (Al Aghar, 2012), Iran (Ghanizadeh, Mohammadi, & Moini, 2008), Turkey (Dereboy, Senol, Sener, & Dereboy, 2007), Germany (Strehl et al., 2006), Sudan (Al-Awad & Sonuga-Barke, 2002), Poland (Kolakowski, Wolancyzk, & Liwsa, 1997), India (Rosenberg & Jani, 1995), Hong Kong (Luk, Leung, & Lee, 1988), Brazil (Brito, 1987), and Italy (O’Leary, Vivian, & Nisi, 1985). Parent rating scales have been adapted for Israel (Vaisman et al., 2008) and Russia (Joseph, Reisfeld, Tirosh, Silman, & Rennert, 2004). The IMAGE project used translations of the Conners’ teacher and parent rating scales for diagnostic purposes in seven European countries (Netherlands, Ireland, Germany, Belgium, United Kingdom, Spain, and Switzerland), and Israel (Müller et al., 2011).
Although the scales are widely used internationally, difficulties with replication of the original subscale factors in those countries have been reported as well (Dereboy et al., 2007; O’Leary et al., 1985; Rosenberg & Jani, 1995). For example, the German version of the Conners Rating Scales (CRS) proved to result in different factor models for both the parent (Huss, Iseler, & Lehmkuhl, 2001) and teacher versions (Huss et al., 2002). Cross-cultural differences between the original version and the German adaptation were largest for hyperactivity and impulsivity symptoms in parent ratings (Huss et al., 2001). Large differences were found for conduct problems in the German teacher version (Huss et al., 2002).
The Conners 3rd edition (Conners 3; Conners, 2008) is the result of continuous development of the CRS and their revision (CRS-R; Conners, 1997). The full form assesses ADHD and related symptoms on 10 symptom and two validity scales. This version has only recently been translated into German (Lidzba, in press), and results of exploratory and confirmatory factor analyses (CFAs) indicated that the original American subscale factor structure could be maintained without modifications for the purpose of clinical assessment and process evaluation within Germany (Christiansen, Hirsch, Drechsler, & Lidzba, 2013).
But cultural variation is not only an issue when observing distinct geographical regions. Even within a region, beliefs, knowledge, and perception about problematic behavior might vary significantly, due to differences in ethics, socioeconomic standards, or origin of subgroups (Bussing, Gary, Mills, & Garvan, 2007). Huss, Hölling, Kurth, and Schlack (2008) demonstrated that families with migration backgrounds living in Germany simultaneously reported less ADHD diagnoses for their children, yet more ADHD symptoms. The general prevalence of ADHD in Germany is 5.1% for the 3- to 17-year-olds. Prevalence rates of ADHD in families with migration background are significantly lower (3.1%; Schlack, Hölling, Kurth, & Huss, 2007). This is attributed to various migrant-specific characteristics, help-seeking patterns, and cultural differences in tolerance of symptoms among them.
According to the Ministry of Foreign Affairs (Federal Office for Migration and Refugees, 2013; Federal Statistical Office, 2012), approximately three million people from Turkey constitute the largest subgroup with migration backgrounds in Germany. Those with low acculturation levels have been found to have significantly lower incomes, fewer German friends, lower educational levels, and poorer German language proficiency (Kiss & Kreienbrink, 2010). To date, this subgroup is assessed with the standard German assessment instruments when presenting in clinical contexts. This leads to the question, whether the actual German translation of the Conners 3 scales can also be applied to this subgroup.
Our goal is to test whether all rating-modalities (self-ratings, parent ratings, and teacher ratings) match the factorial structure of the original model and to calculate the reliability parameters of the hypothetical scales. In the second step, convergent and divergent validity among ratings is evaluated. Third, we test whether the acculturation level of parents has a moderating influence on the ratings of ADHD core symptoms and related disorders. Finally, possible discrepancies in symptom severity between raters, and influences of sex and age on ratings are analyzed.
Subjects and Method
Procedure and Subjects
This was a cross-sectional study on healthy children with Turkish migration background living in Germany, with or without German citizenship. Our sample consisted of 238 children self-ratings, 194 parent ratings, and 204 teacher ratings. Four parent rating forms had to be removed from the sample because more than five items (10%) were missing. All forms (self, parent, and teacher) were available for 152 children; in 86 cases, either parent or teacher ratings were missing. Five children did not complete the self-report, so only parent and/or teacher reports exist. Across all forms included in the final analyses, missing data on item level were 0.33%. Information on age, gender, and school grade was available for all children in the sample, along with the information on ADHD diagnoses. Information on educational level, nationality, and the language mainly used within the family was reported by 198 parents. As school graduations achieved in countries not belonging to the European Union are only rarely acknowledged, parents were first asked if they had any kind of German graduation level, and otherwise for the Turkish equivalent. Tables 1 and 2 show the details of the sample.
Demographics of Children (n = 243) With a Turkish Migration Background Living in Germany.
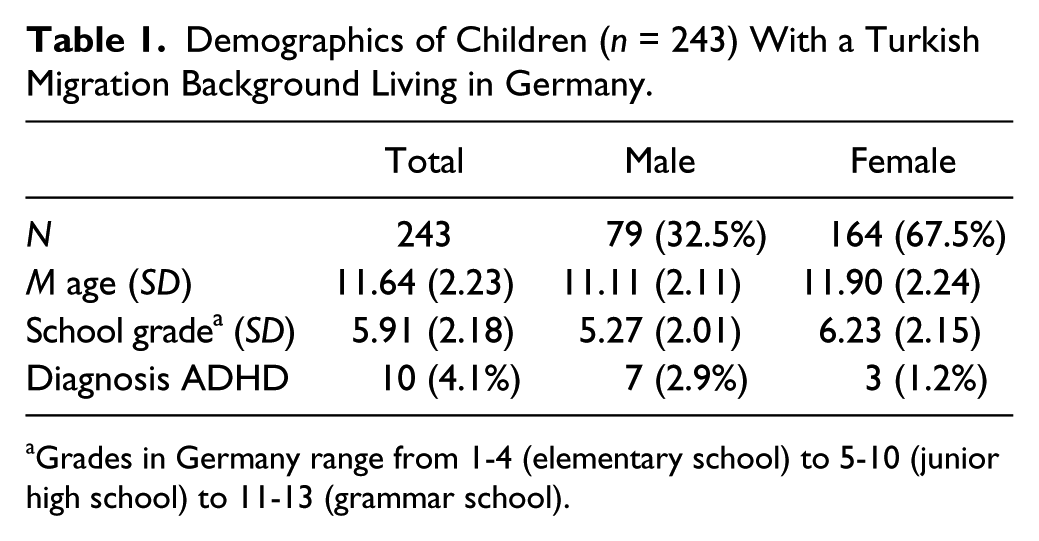
Grades in Germany range from 1-4 (elementary school) to 5-10 (junior high school) to 11-13 (grammar school).
Demographics of Parents (n = 198) With a Turkish Migration Background Living in Germany.

A study protocol in accordance with the criteria of the Declaration of Helsinki was reviewed and approved by the local institutional review board and by the school board of the German district Baden Wuerttemberg. Written informed consent was obtained from all participants, and their confidentiality was assured. From 2010 to 2011, subject data were collected through convenience sampling in different schools in Germany. Subjects were provided with a short study description, and asked to fill out the Conners 3 questionnaires for children, parents, and teachers. In addition, the parents were asked to answer questions on relevant sociodemographic parameters. Most subjects completed the questionnaires at home and sent them back to the Department of Clinical Psychology at the Philipps University of Marburg.
Method
The German Conners 3 for ADHD rating scales (C3D-C/P/T) in children and young adolescents
The German translation of the Conners 3 assesses ADHD symptoms and related problematic behaviors in children and young adolescents between 6 and 18 years of age (Lidzba, in press). The assessment of symptom frequency is based on the evaluation of parents (parent rating), teachers (teacher rating), and the children themselves (self-rating). Symptoms are rated on a Likert-type scale from 0 (not at all/never) to 3 (very much/very frequently).
The long form of the self-rating scales (C3D-C) consists of 94 items assessing not only ADHD core symptoms but also related problems in executive functions, learning problems, aggression, and peer/family relations. The C3D features screener items for anxiety and depression. Scales that relate directly to the Diagnostic and Statistical Manual of Mental Disorders (4th ed., text rev.; DSM-IV-TR; APA, 2000) diagnostic criteria (symptom scales) are included for ADHD (inattention and hyperactivity/impulsivity) as well as for the most commonly co-occurring group of disorders—disruptive behavior disorders with conduct disorder and oppositional defiant disorder that consist of 44 items in total. Our analysis focused on those four symptom scales (Inattention [INA], Hyperactivity/Impulsivity [H/I], Conduct Disorder [CD], and Oppositional Defiant Disorder [ODD]), because of their relevance in clinical evaluation.
The parent (C3D-P) and teacher (C3D-T) ratings differ from the self-report primarily in wording of questions. Items in the self-report are formulated in the first person singular (e.g., “it is hard for me to pay attention … ”), whereas items for parent and teacher ratings are formulated in the third-person singular (e.g., “the child described doesn’t pay attention … ”). The long form of the parent rating scales (C3D-P) contains 105 items, with 44 symptom scale items, while the long form of the teacher rating scales (C3D-T) consists of 111 items, with 42 symptom scale items. The two missing items in the teacher questionnaire address conduct problems hard to rate for teachers (e.g., staying out at night and bolting from home).
Acculturation Assessment Scale index
We used a modified version of this instrument originally developed by Günay and Haag (1990) that measures the acculturation level of people with Turkish migration background living in Germany. Acculturation means acceptance of values, standards, and lifestyle of the immigration country. In its original form, the scale consists of 24 items. To reduce redundancy (e.g., different items asking for preferred language when consuming different types of media), an exploratory factor analysis was calculated that yielded two factors. One of these was composed of items addressing geographical features (e.g., place of birth), while the other one consisted of items associated with acculturation (e.g., preferred language, social contacts, national identity). The latter scale was used to calculate levels of acculturation. Items that showed high similarities in content—and thus very high correlations–—with other items were removed to create a heterogeneous scale. The modified scale consists of 7 items on a 3-point Likert-type scale, for example, “German language speaking ability” from 1 (not at all/rudimentary) to 3 (good/very good). Cronbach’s alpha is .757, which is acceptable, especially as items are relatively heterogeneous in terms of content (M inter-item correlation = .344).
Statistical Analysis
All raw data were stored in a database in Marburg (Department of Clinical Psychology, Philipps University of Marburg). Data reduction and analyses were carried out using the statistical package SPSS 18, including AMOS 18, for structural equation modeling.
First, CFA was conducted for the German translations of self-report, parent rating, and teacher rating to assess whether the data of the sample of children with Turkish migration background resulted in a model fit comparable with the original American version, as this was the case with the German normative sample (Christiansen et al., 2013). The confirmatory analysis was based on the 44 items (42 items in the teacher rating) that compose the four symptom scales: INA, H/I, ODD, and CD. Factors were allowed to correlate, as factor correlations in the original validation sample were substantial (Conners, 2008). Unweighted least squares (ULS) were used for estimation, as this procedure makes no assumption on distribution or scaling properties. Indices used to evaluate model fits are explained below.
Root mean square residual (RMR)
The RMR displays discrepancies between the implied model and empirical data, and ranges from 0 to 1, with values close to 0 indicating less discrepancy. A value smaller than .05 indicates a good model fit (Byrne, 1998), and values smaller than .08 an acceptable fit (Hu & Bentler, 1999).
Goodness of Fit Index (GFI) and Adjusted Goodness of Fit Index (AGFI)
The GFI shows the amount of observed covariance explained by the covariance implied by the model (Tabachnick & Fidell, 2007). It ranges from 0 to 1, and values close to 1 indicate a high amount of explained variance. A cutoff point of .90 has been recommended, but Miles and Shevlin (1998) rather suggested values equal or larger than .95 to indicate a good fit. The AGFI adjusts this value by degrees of freedom, and favors parsimonious models—models with more degrees of freedom—over complex ones. AGFI values of .90 or larger indicate a good model fit (Hooper, Coughlan, & Mullen, 2008).
Normed Fit Index (NFI)
The NFI is an incremental fit index that compares the hypothetic model with an independent model (that assumes indicators within the model to be entirely uncorrelated). Values range from 0 to 1, with values close to 1 indicating a strong preference for the hypothetic model. Values equal or larger than .95 indicate good model fit (Hu & Bentler, 1999), while values equal or larger than 0.90 are acceptable (Bentler & Bonnet, 1980).
Parsimony Normed Fit Index (PNFI)
The PNFI index evaluates the parsimony of the model and prefers models that produce reliable estimates, while being nonrestrictive. Values range from 0 to 1, with values close to 1 indicating high parsimony. No thresholds have been recommended, but values around .5 are often reported in samples that produce otherwise good fit indices (Mulaik et al., 1989).
Because there was no evidence against the assumption that data were missing completely at random (Little’s MCAR [Missing Completely at Random] test, p = .338 for self-ratings, p = .998 for parent ratings, and p = .999 for teacher ratings), missing values were imputed with the expectation–maximization algorithm. After conduction of the factor analyses, Cronbach’s alpha was estimated for the established scales.
In the second step, correlations between identical scales across rating-modalities (self-rating, parent rating, and teacher rating) were calculated to evaluate convergent validity. Divergent validity was determined by comparing correlations between different scales across all rating-modalities. Results are displayed in a multitrait–multimethod matrix (MTMM).
Subsequently, correlations between all rating-modalities and the acculturation index were calculated to determine possible influences of cultural variation. Bonferroni–Holm corrections were used to adjust error rates for multiple testing of correlations.
In the final step, a repeated-measure MANOVA with rating-modality as a within-subject factor, gender as a between-subject factor, and age and acculturation index as covariates was calculated across all symptom scales to examine whether differences between rating-modalities and gender influenced behavior ratings. Post hoc analyses of significant differences were analyzed with ANOVAs, repeated-measure ANOVAs, and t tests.
Effect sizes are reported as eta squares (η2) for analyses of variance, or Cohen’s d (d) for t tests. Cohen (1988) defined an η2 of 0.01 / d = 0.2 as a small effect size, one of η2 = 0.06 / d = 0.5 as medium, and one of η2 = 0.14 / d = 0.8 as large.
Results
Results of CFA and Cronbach’s Alpha for the Self-Report Sample (C3D-C)
Data from 238 self-reports were entered into the analysis. Both RMR and AGFI suggested a good fit of the data for the assumed model, while PNFI suggested the theoretical model to be highly parsimonious. GFI and NFI values were within the acceptable range. Table 3 gives an overview of the established fit-index values and thresholds.
Fit Indices and Thresholds for Self-Rating and Parent and Teacher Ratings.
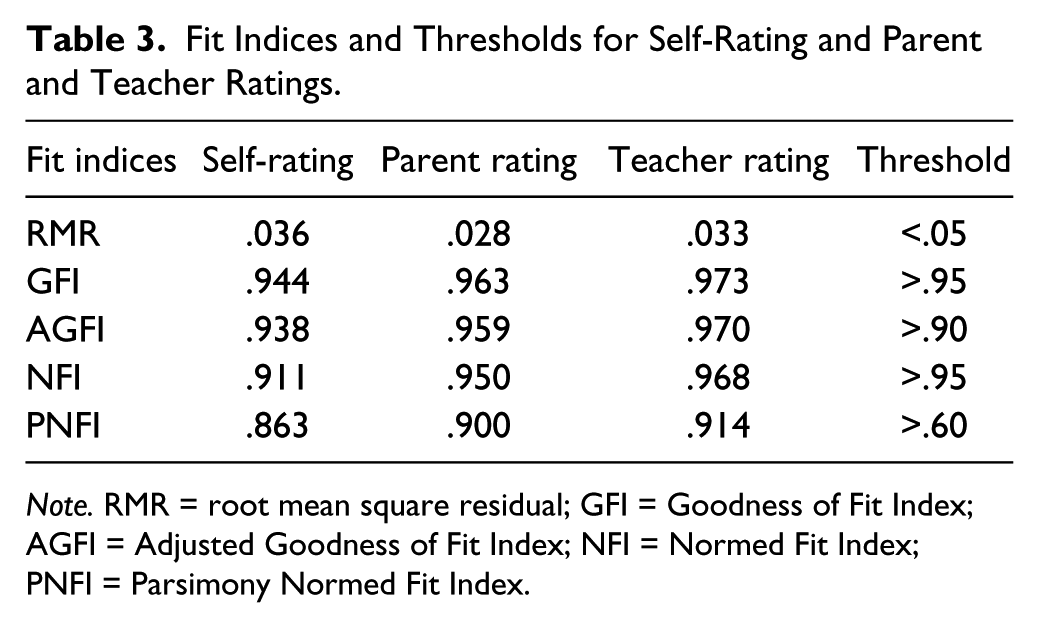
Note. RMR = root mean square residual; GFI = Goodness of Fit Index; AGFI = Adjusted Goodness of Fit Index; NFI = Normed Fit Index; PNFI = Parsimony Normed Fit Index.
Most factor loadings on the scales INA, H/I, and ODD were in the acceptable range with values greater than 0.30, and only one item on each scale loading less. Six items allocated to the scale (CD) loaded lower than 0.30 on that factor. This might be due to reduced variance, as items allocated to that scale (i.e., items regarding sexual assault or armed robbery) assess behaviors rarely displayed by children around the age of 12 years. Furthermore, social desirability might further influence ratings, contributing to reduced variance. Finally, heterogeneity of items allocated to that scale might result in lower factor loadings.
Table 4 shows the standardized factor loadings of the C3D-C self-rating items on their hypothesized factors, loadings on other factors that are within the range of 0.1 of the hypothesized factor, and intercorrelations between factors. Apart from Items 21, 39, and 42, items assigned to the factor Inattention show medium to high loadings on their respective factor, and noticeably lower loadings on all other factors. Results regarding H/I, ODD, and CD are mixed, because lots of double or triple loadings exist. The internal consistency of all four factors of the self-rating form was acceptable with the following Cronbach’s alpha values: INA, α = .79; H/I, α = .77; ODD, α = .72; and CD, α = .76.
Interfactor Correlation According to Confirmatory Factor Analysis and Standardized Factor Loadings of the Items on Their Hypothesized Factors for the Self-Rating Sample.

Note. INA = Inattention; H/I = Hyperactivity/Impulsivity; ODD = Oppositional Defiant Disorder; CD = Conduct Disorder. In addition, loadings on factors other than the hypothesized factors differing by less than .1 are shown.
To sum it up, our sample of children with Turkish migration background matches the factorial structure of the original Conners 3 self-rating forms well, with the model being highly parsimonious with acceptable fit-indices and an adequate internal consistency of the resulting scales.
Results of CFA and Cronbach’s Alpha for the Parent-Report Sample (C3D-P)
Data from 194 parent reports were entered into the analysis. This sample of parent ratings successfully replicated the factorial structure of the original Conners 3 symptom scales. The resulting model is highly parsimonious with excellent fit-indices and a good internal consistency of the resulting scales (see Table 3). The internal consistency of all four factors was good with the following Cronbach’s alpha values: INA, α = .83; H/, α = .86; ODD, α = .81; and CD, α = .87.
With the exception of one item on the factor CD (sexual assault), factor loadings on all scales were in the acceptable range with values greater than 0.30. Table 5 shows the standardized factor loadings of the C3D-P items on their hypothesized factors and intercorrelations between factors.
Interfactor Correlation According to Confirmatory Factor Analysis and Standardized Factor Loadings of the Items on Their Hypothesized Factors for the Parent Rating and Teacher Rating Sample.
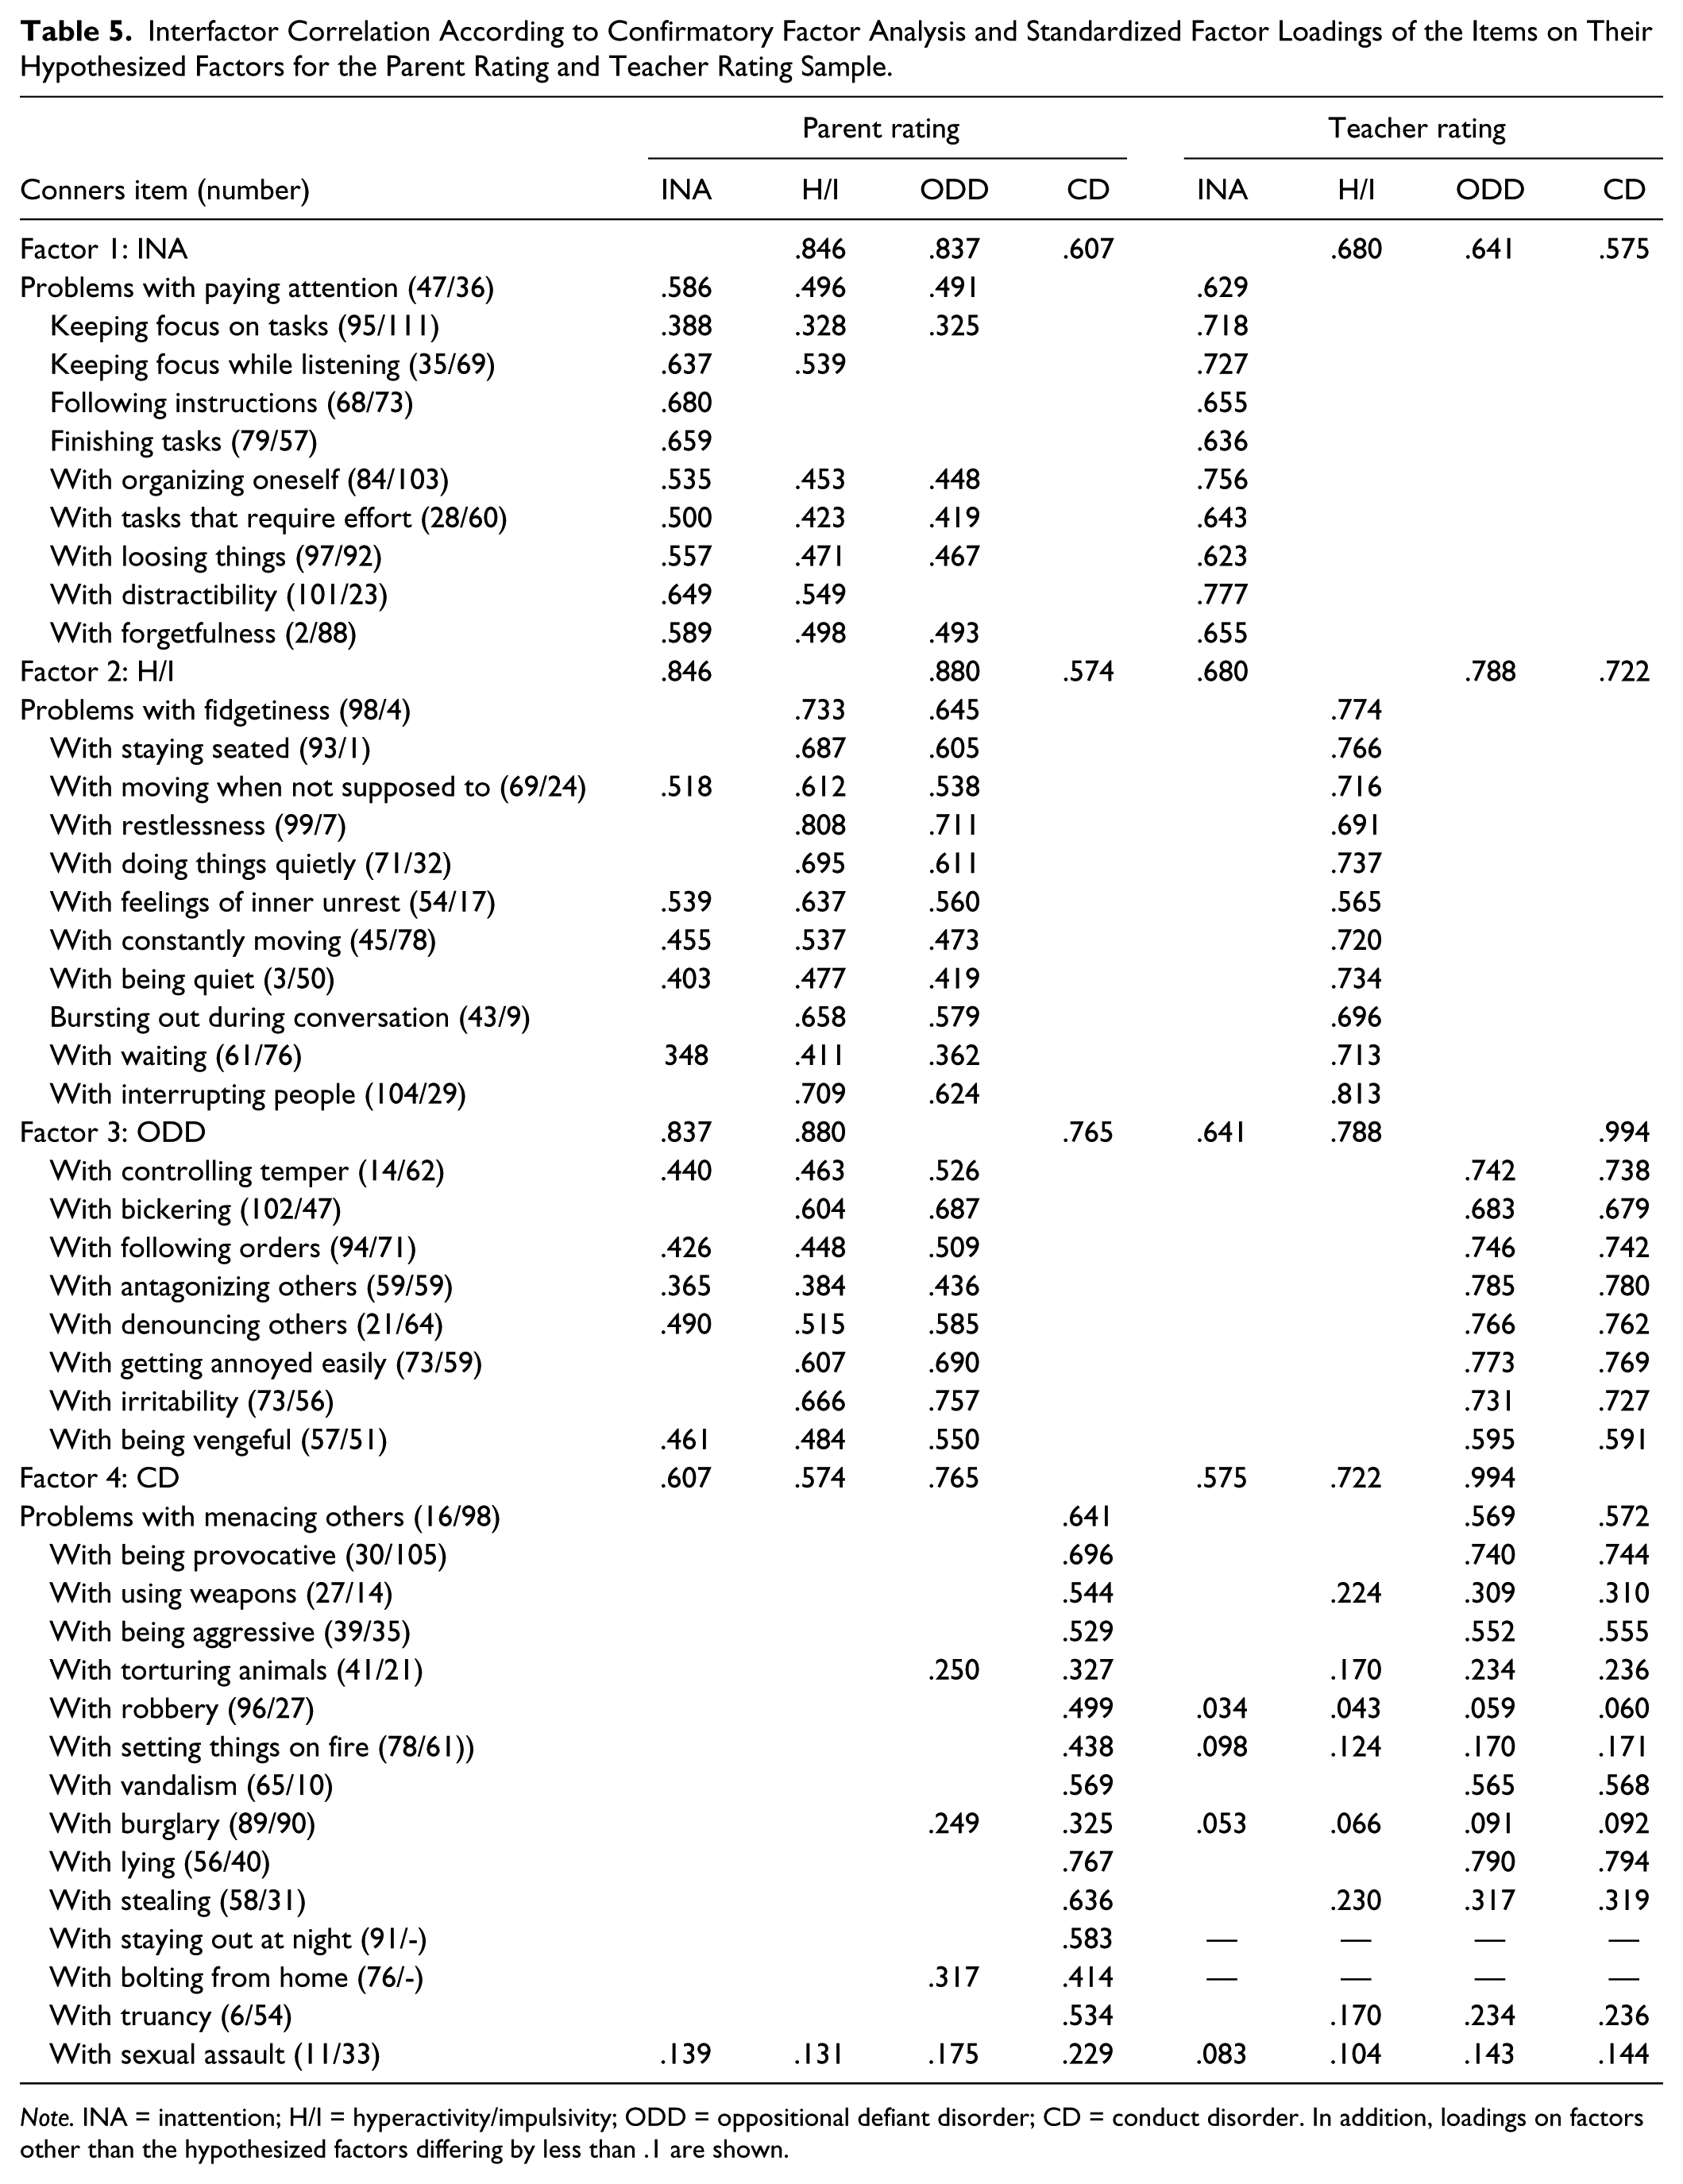
Note. INA = inattention; H/I = hyperactivity/impulsivity; ODD = oppositional defiant disorder; CD = conduct disorder. In addition, loadings on factors other than the hypothesized factors differing by less than .1 are shown.
Of the 15 items assigned to CD, 11 showed at least medium loadings on this factor and no substantial loadings on any other factor with 10 of those even showing high loadings of ≥.50. Another three items showed small to medium loadings on ODD as well. These results indicate a strong factor that, despite high correlations (.574-.765) with the other factors, depicts a distinct latent trait—namely, “serious disruptive behaviors”—rather clearly.
Almost all items assigned to the factors INA, H/I, and ODD show substantial loadings on at least one other factor, apart from the one they were originally allocated to. This suggests a higher order factor that subsumes those three factors. This higher order factor resembles the International Classification of Diseases, Tenth Revision (ICD-10) category of hyperkinetic conduct disorder (ICD-10, F90.1; World Health Organization [WHO], 2004).
Results of CFA and Cronbach’s Alpha for the Teacher-Report Sample (C3D-T)
Data from 204 teacher reports were entered into the analysis. Analogous to self-ratings and parent ratings, the replication of the original Conners 3 symptom scales was successful. All fit-indices suggest a good fit of the data with the assumed model (see Table 3). The internal consistency of all four factors was good with the following Cronbach’s alpha values: INA, α = .83; H/I, α = .86; ODD, α = .81; and CD, α = .87.
All factor loadings on all four scales were in the acceptable range with values greater than 0.30. Table 5 shows the standardized factor loadings of the C3D-T items on their hypothesized factors, and intercorrelations between factors. Items assigned to INA and H/I showed consistently high loadings on their respective factors, and considerably lower loadings on all other factors. These results are indicative that teachers are relatively precise when attributing a certain behavior to a distinct ADHD core symptom.
Items assigned to either ODD or CD showed consistently high loadings on both factors and considerably lower loadings on all other factors. As with the parent ratings, a higher order factor possibly subsumed both factors. This higher order factor could be described as “volitional disruptive behaviors.” Loading patterns of teacher ratings most closely resembled a simple structure, and therefore seem most suited for differentiation of specific symptoms.
Convergent and Divergent Validity of Rating-Modalities
Monotrait–heteromethod correlations between rating-modalities (self-rating, and parent and teacher ratings) were high for INA (ranging from .501 to .582), medium to high for H/I (.365 to .509), medium for ODD (.289 to .407), and small to medium for CD (.252 to .312).
Except in one case, inattention and hyperactivity correlated highest with their counterparts across all rating-modalities, for example, self-ratings of inattention showed higher correlations with parent ratings of inattention (monotrait correlation) than with any other scale; this indicates good convergent validity. Only the correlation between ODD teacher ratings and hyperactivity parent ratings (.384) was stronger than the monotrait correlation for hyperactivity (.365).
In the case of ODD and CD, results were mixed, with parent- or teacher-rated ODD and CD correlating higher with self-rated inattention or hyperactivity than with their counterparts. Table 6 shows the details of interrating correlations. Furthermore, children’s self-ratings of hyperactivity correlated more strongly with either parent rating (.479) or teacher rating (.509) than those two rating-modalities with each other (.365).
Multitrait–Multimethod Matrix (n = 152).
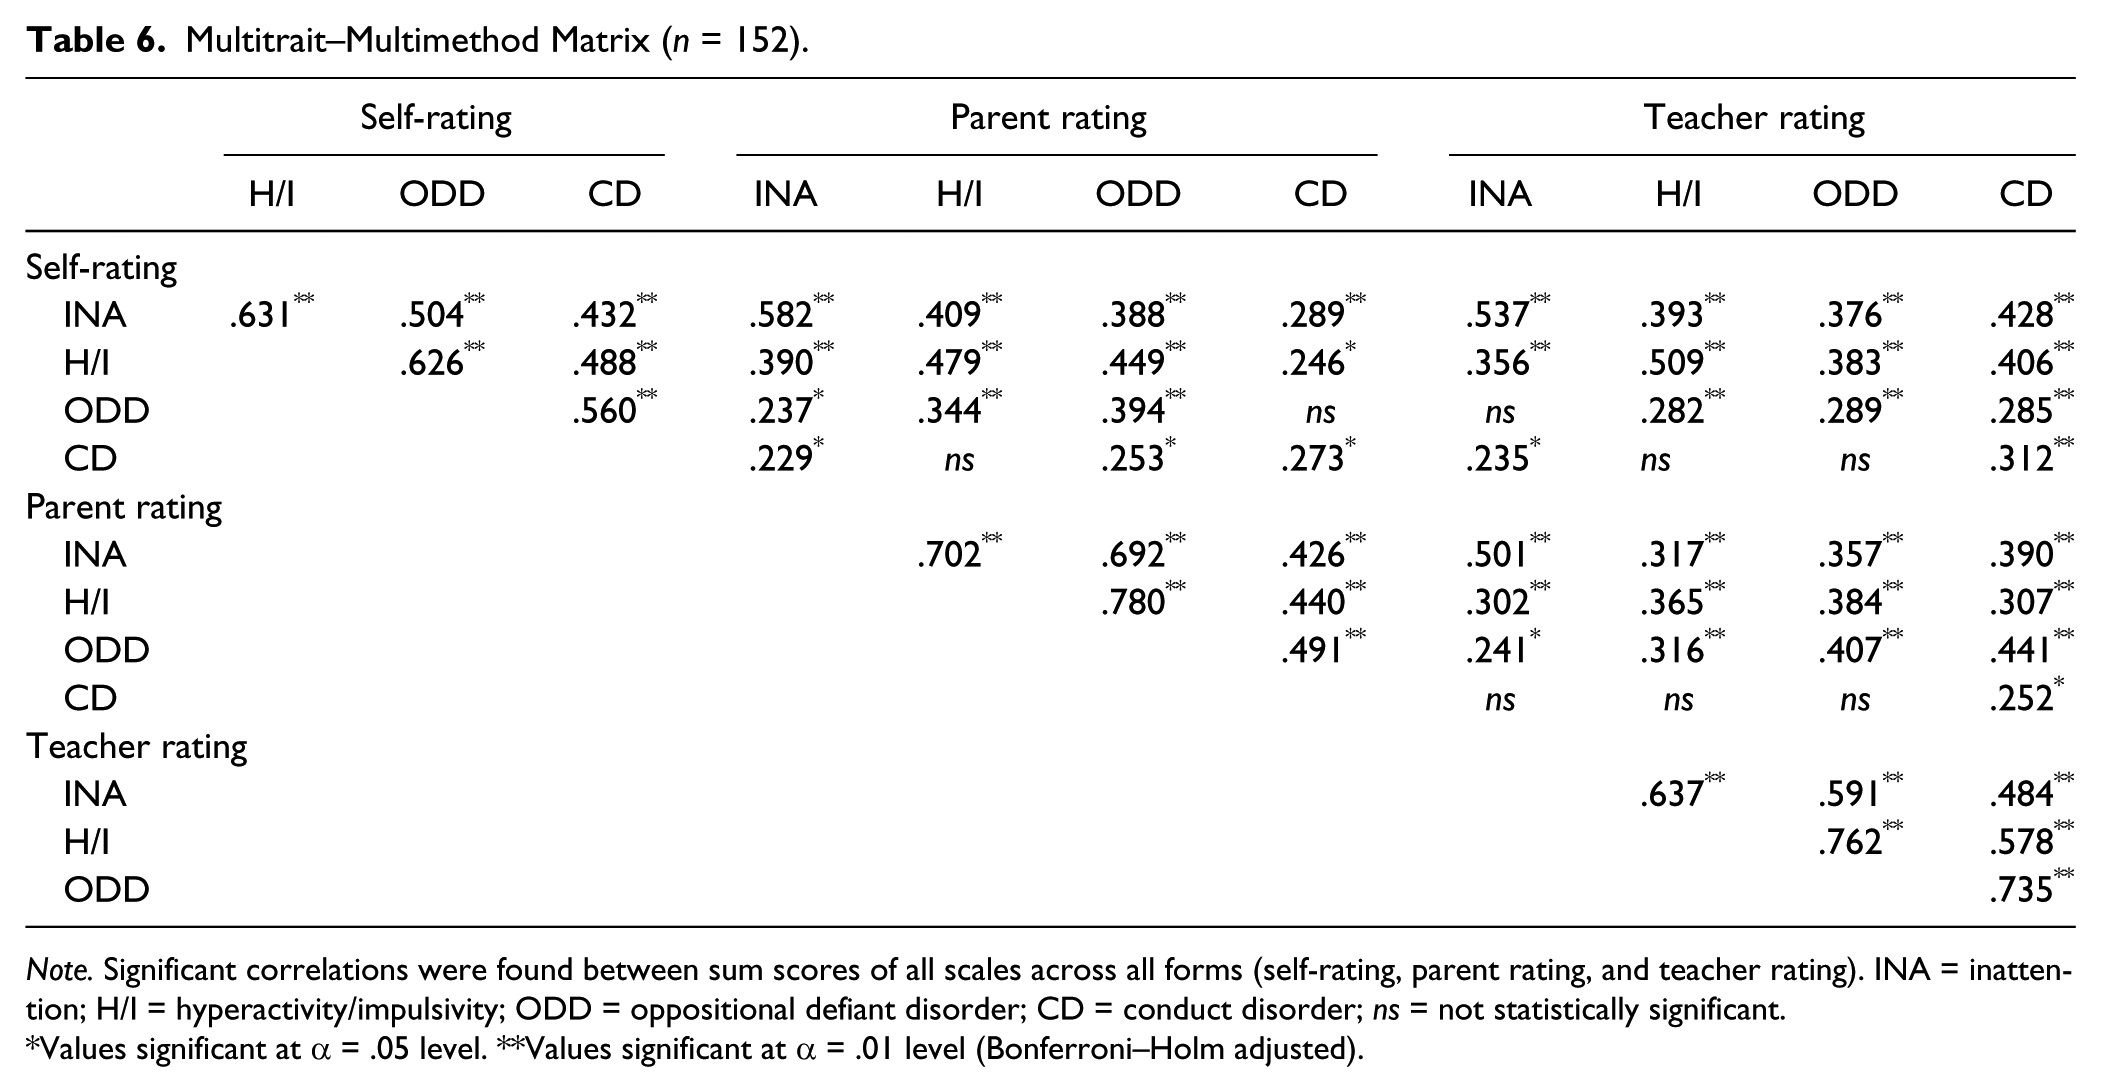
Note. Significant correlations were found between sum scores of all scales across all forms (self-rating, parent rating, and teacher rating). INA = inattention; H/I = hyperactivity/impulsivity; ODD = oppositional defiant disorder; CD = conduct disorder; ns = not statistically significant.
Values significant at α = .05 level. **Values significant at α = .01 level (Bonferroni–Holm adjusted).
Correlations between constructs within the same rating-modality (heterotrait–monomethod correlations) were strong with values up to .780 (hyperactivity/ODD) in parent ratings. As CFA demonstrated high factor correlations, this was expected.
Correlations Between All Rating-Modalities and Acculturation Index
There is a small, negative correlation between parent ratings of ODD and acculturation index (r = −.189, p = .020). It seems that a higher acculturation index goes along with less reported symptoms of ODD, and vice versa. When adjusting for multiple testing, this relationship is no longer significant (adjusted α = .0042). No other significant correlations (or trends) of the acculturation index with self-rating, parent rating, or teacher rating were found. Though the influence of acculturation on parent ratings of ODD seems small but not totally incidental, we conservatively decided to include this measure as a covariate in all further analyses.
Mean Differences Across Rating-Modalities: Influence of Age, Sex, and Acculturation
Children’s self-ratings across all problem behaviors showed higher means than parent and teacher ratings (see Table 7), though this difference was fully mediated by their age. This was illustrated by a significant effect of covariation for age, Wilks’s lambda = .908, F(145.000) = 3.66, p = .007, η2 = .092. Younger children have higher means than older ones. When age is controlled for, differences between means of children, parent, and teacher ratings disappear, Wilks’s lambda = .945, F(141.000) = 1.04, p = .421, η2 = .055.
Item Means and Standard Deviations of Symptom Scales Across All Rating-Modalities (n = 152).
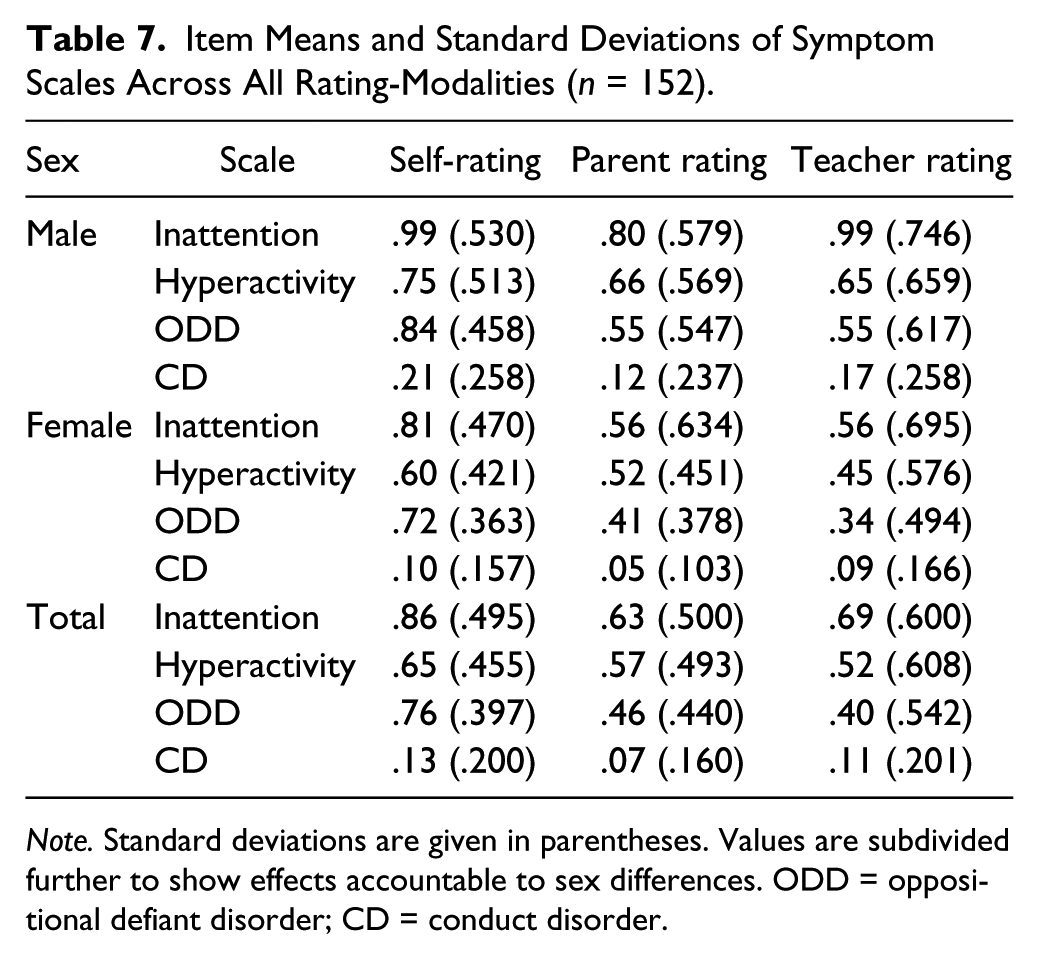
Note. Standard deviations are given in parentheses. Values are subdivided further to show effects accountable to sex differences. ODD = oppositional defiant disorder; CD = conduct disorder.
There was a significant main effect for gender, Wilks’s lambda = .880, F(145.000) = 4.93, p = .001, η2 = .120. Boys achieved higher ratings than girls across all problem behaviors and all rating-modalities.
There was no significant moderating or mediating influence for degree of acculturation, Wilks’s lambda = .964, F(145.000) = 1.36, p = .249, η2 = .036, although there is was a trend for ratings of ODD to be higher when parents had a lower acculturation index (F = 3.60, p = .060, η2 = .024).
Discussion
The goal of the study presented was to evaluate whether the German adaptation of the Conners 3 is robust to distortion by cultural variation, when presented to people with a Turkish migration background living in Germany. The CFAs with items of the Conners 3 DSM-IV symptom scales of the original American study showed consistently good model fits in our sample of children. Analyses of the different scales revealed that (a) due to high correlations between rating-modalities, convergent validity is given, and (b) self-ratings and parent and teacher ratings do not differ in estimation of symptom severity. Clinical ratings according to those original structures seem justified for this subgroup of children. This is important because prevalence rates of ADHD in families with migration backgrounds living in Germany are substantially lower than in families without migration background (Schlack et al., 2007). Therefore, it was our aim to examine if differences in awareness and/or estimation of problematic behaviors across subcultures might be responsible for this phenomenon, which in turn might influence psychometric ratings. This is important not only for clinical practice but also for research on ADHD. Considering that many studies today are international multicenter studies, it is of high importance to rely on psychometrically sound instruments with cross-cultural comparable factor structures that meet diagnostic requirements as formulated in the existing diagnostic manuals (DSM-IV/ICD-10; APA, 2000; WHO, 2004) and guidelines (National Institute for Health and Care Excellence, 2008).
When interpreting the following results, it is important to note that intercorrelations between scales are consistently high (>.5) across all rating-modalities, reflecting the strong relation between ADHD core symptoms and related disruptive behaviors.
When analyzing children’s self-ratings on item level, items associated with absentminded and distractible behavior almost exclusively load on the factor Inattention, resembling a simple structure, while lots of double or triple loadings exist for all other factors. Thus, self-reports of children seem to differentiate well between internalizing (Inattention) and externalizing (H/I, ODD, CD) problem behaviors, but not between different manifestations of externalizing behaviors.
Parent ratings, however, show a clear distinction between CD and all other factors, but have problems differentiating between core symptoms of ADHD and ODD, matching results by Gadow and Nolan (2002).
Loading patterns of teacher-rated ADHD core symptoms resemble a simple structure most clearly, as they distinguish between the three dimensions inattention, hyperactivity/impulsivity, and disruptive behaviors. However, factor intercorrelation between ODD and CD is huge (.994) for teacher ratings. Teachers seem to have difficulties to differentiate milder problem behavior (ODD) from more serious disruptive behaviors (CD). It is possible that any kind of problematic externalizing and oppositional behavior at school is rated to be more severe by teachers, whereas parents differentiate the milder forms of opposition more clearly from the stronger forms of conduct disorders.
Looking at convergent validity, inattention consistently shows the highest correlations across all rating-modalities. Convergent validity is acceptable for all other dimensions, though notably lower for parent and teacher ratings of H/I, ODD, and CD. This might reflect the aforementioned greater difficulty of parents to differentiate between those dimensions of externalizing behaviors (Gadow & Nolan, 2002), and to rather perceive this more in the sense of hyperkinetic conduct problems. Thus, parents and teachers seem to perceive and rate hyperactive/impulsive behavior differently, which may be attributed to the circumstance that both witness behaviors of children in different contexts. This assumption is supported by a number of studies, who found little to no association between parent and teacher ratings (Efstratopoulou, Simons, & Janssen, 2013; Lavigne, Dulcan, LeBailly, & Binns, 2012; Sims & Lonigan, 2012). This does not necessarily mean that one type of informant is providing invalid or unreliable information (Reid & Maag, 1994). For example, given that teachers, compared with parents, are more familiar with age-appropriate behavior of children, it might be possible that teachers are more tolerant toward the problem behavior of a particular child (Antrop, Roeyers, Oosterlaan, & Van Oost, 2002). Correlations of children’s self-/parent ratings (.479) and children’s self-/teacher ratings (.509) of H/I are higher than parent/teacher ratings (.365). It seems that children rate their own hyperactive/impulsive behavior rather accurately, probably because they experience—and more importantly receive feedback for—their behavior in both contexts.
As can be seen in the analyses on scale level, age has a mediating effect. Self-ratings of older children resemble parent and teacher ratings more than self-ratings of younger children. Possibly, very young children are overcharged when asked to rate their behavior out of the actual context, as their ability for logical, abstract, and deductive thinking is still developing until about 11 years of age (Petermann, Niebank, & Scheithauer, 2004). Varni, Limbers, and Burwinkle (2007) demonstrated that children as young as 5 years old can reliably and validly self-report their “health-related quality of life,” although correlations between parent and children ratings increase substantially when children are 10 years or older. Therefore, it may be reasonable to attribute this discrepancy to the large variability of age and therefore to different stages of cognitive development of children and teenagers in this sample. Nevertheless, as displayed by the results, even when possibly exaggerating, young children show high consistence in their self-evaluation.
As prevalence rates, and thus perception of symptoms of ADHD and other disruptive behavioral disorders, between boys and girls differ strongly (Gershon & Gershon, 2002), effects of sex were to be expected. Findings of the literature could be replicated in this respect with boys consistently scoring higher than girls across all behaviors and rating-modalities.
Finally, besides an influence on parent ratings of ODD that vanished when correcting for multiple testing, the level of parental acculturation did not influence ratings of parents, teachers, or children. Parents with lower acculturation index reported slightly higher ODD scores than those with a higher acculturation index. It seems that these parents perceive behavior of their offspring more critically. This is interesting, as Dereboy et al. (2007) reported problems replicating the scale CD for the parent ratings in the Turkish adaptation, but found no such issues for the scale H/I. Furthermore, a study on prevalence rates of ADHD and ODD based on DSM-IV criteria in Turkey (Erşan, Doğan, Doğan, & Sümer, 2004) revealed higher rates of ODD, but not ADHD, compared with prevalence rates in other countries. According to these findings, the awareness of defiant behavior seems to be more strongly affected by cultural diversity than core symptoms of ADHD.
Limitations
One limitation is the absence of a control sample of German children without migration background. On item level, a control group would have offered the opportunity for multiple-group CFA, thus testing the equivalence of models dependent on different levels of invariance (Weiber & Mühlhaus, 2010). On scale level, differences between parent groups could have been analyzed. However, teachers constitute a suitable control group, as they are independent of parental migration background. As parent and teacher ratings on symptom frequency in our sample do not differ from each other significantly, it seems sensible to assume the same for control parents. Furthermore, we specifically controlled for possible influences of acculturation.
Another problem is the high prevalence of girls in this sample, possibly because of selection bias. As effects of gender were controlled for and boys in the sample, according to expectations, scored higher than girls on all scales, this sample still seems to represent the basic population fairly.
Conclusion
There are no objections using the German translation of the Conners 3 DSM-IV symptom scales to assess ADHD and related behaviors in children with Turkish migration background. CFA revealed that our data strongly correspond with the assumed factor structure of the original Conners 3. The reliability of the resulting scales is adequate. The same applies to convergent and divergent validity parameters. Although there are small effects of acculturation on parental appraisal of oppositional behavior, these alone do not justify a special adaptation for use in clinical or research settings, especially because these effects vanish when controlling for multiple testing. Regarding ADHD core symptoms—inattention and hyperactivity/impulsivity—the Conners 3 questionnaires seem “culture fair.”
Footnotes
Declaration of Conflicting Interests
The author(s) declared no potential conflicts of interest with respect to the research, authorship, and/or publication of this article.
Funding
The author(s) received no financial support for the research, authorship, and/or publication of this article.