
Abstract
Introduction
Awareness of the presence and burden of ADHD has increased in the past decade (Akinbami, Liu, Pastor, & Reuben, 2011; Froehlich et al., 2007; Kessler et al., 2006; Substance Abuse and Mental Health Services Administration [SAMHSA], 2011) as well as the prescribing of medications for ADHD treatment (Fortuna, Robbins, Caiola, Joynt, & Halterman, 2010; Thomas, Conrad, Casler, & Goodman, 2001; Zito et al., 2000). ADHD is a behavioral condition diagnosed in 9% of children and 4% of adults presenting with persistent difficulty in focusing, controlling actions, and remaining still (Barkley, 2006). The number of youth and adult patients receiving pharmacologic ADHD treatment is growing (Cohen, Jhung & Budnitz, 2006; Fortuna et al., 2010; Safer, Zito, & Fine, 1996; Spencer et al., 2005; Zito et al., 2000), and treatment includes a diverse range of psycho-stimulants. As the number of prescriptions for these medications increases, the potential for diversion and nonmedical use (NMU) also increases. Psycho-stimulants are a broadly defined class of drugs that stimulate the central and peripheral nervous systems. The potential for NMU of psycho-stimulants is well established (Howell & Kimmel, 2008; Lile, 2006; Riddle, Fleckenstein, & Hanson, 2005), and may represent a significant public health concern.
The prevalence of NMU of prescription ADHD stimulants in the general population was reported in the 2009 National Survey on Drug Use and Health (NSDUH) to be approximately 1.1 million people (0.4%) over 12 years of age (SAMHSA, 2011), a frequency that is lower than the prevalence of NMU of prescription pain medications (5.1 million, 2%), and tranquilizers (2.2 million, 0.9%). An Internet survey in a sample representative of the U.S. general population (Cassidy, Varughese, Russo, Budman, & Butler, 2012) also reported relatively low prevalence of NMU for prescription ADHD stimulants at a class level and at a product-specific level (unadjusted prevalence of 8%; and less than two cases of NMU per 100,000 prescriptions). The literature consistently suggests that NMU of prescription ADHD stimulants in the general population is largely intended for performance enhancement (Cassidy et al., 2012; Flory, Milich, Lynam, Leukefeld, & Clayton, 2003; McCabe, Teter, & Boyd, 2006; Sussman, Dent, & Stacy, 1999), and “a friend or family member” is the most cited source of diversion for prescription stimulant medications.
In contrast to the research carried out on NMU of prescription ADHD stimulants in the general population, there are a limited number of studies evaluating NMU of prescription ADHD medications in “high-risk” populations. One such high-risk population is individuals being evaluated for substance abuse treatment and triage. This population includes individuals seeking treatment on their own, and others compelled into treatment by the criminal justice system or some other authority. Such individuals may be particularly susceptible to abuse of addictive substances due to intrinsic or external factors, and may also present with co-occurring substance abuse disorders and mental health disorders. Many within this population are poly-drug users of illicit and prescription drugs. Information on this population from existing data sources is limited. In addition, most past investigations have grouped a variety of stimulants (including illicit amphetamine, methamphetamine, ADHD medications, anorexia drugs, prescription and nonprescription diet medications) into one broad class. For example, the 2010 NSDUH, reported 343,000 persons aged 12 years or older were receiving substance abuse treatment for problems related to any stimulant (about 13% of all those in treatment (SAMHSA, 2011). Of note is that the NSDUH includes data on methamphetamine, illicit amphetamine and diet pills in the category of stimulants.
Data on substances reported on admission for treatment are available from the Treatment Episode Data Set (TEDS), a reporting system involving publically funded treatment facilities around the United States. Based on the most recently available TEDS data (SAMHSA, 2009), about 5% of individuals reported abuse of any stimulant (including methamphetamine, MDMA/Ecstasy, phenmetrazine, methylphenidate and other unspecified amines and related drugs) as the primary substance of abuse upon admission, and most of those stimulant-related admissions reported in the TEDS were due to abuse of methamphetamine. While the TEDS data system includes a large number of treatment facilities in the United States, there are some significant limitations of these data that should be noted. Factors affecting site selection and data collection methodology can vary from state to state. Differences in state systems of licensure, certification, accreditation, and disbursement of public funds may affect which facilities report to TEDS. In addition, TEDS data become available with a lag of about 2 years, limiting its ability to address recent patterns of abuse. Finally, the data collected by TEDS are not product specific, making it difficult to describe any differential patterns in NMU across the ADHD prescription medications.
To further understand patterns of NMU of prescription ADHD stimulant medications within the high-risk population of those with substance use problems, we sought to examine near real-time, product-specific data on recent (within the past 30 days) NMU of ADHD stimulant medications by adults evaluated in a substance abuse treatment context. The primary objective was to describe NMU of prescription ADHD stimulants among this sample in a way that allows comparison with other national treatment center and general population samples. The data stream used in this study was the Addiction Severity Index-Multimedia Version (ASI-MV), a component of the National Addictions Vigilance Intervention and Prevention Program (NAVIPPRO; Butler et al., 2008). Data are collected from a large, nationally dispersed network of sentinel sites in the United States that use the ASI-MV for clinical assessment of substance use problems.
The specific objectives of this study were (a) to measure prevalence of NMU of prescription ADHD stimulants among individuals assessed for substance use problems who may be at high risk for NMU of prescription medications, (b) to compare NMU of prescription ADHD stimulants to NMU of other prescription medications, (c) to compare the level of NMU for various specific prescription ADHD stimulant products, (d) to describe routes of administration (ROA) for NMU of prescription ADHD stimulants, and (e) to describe diversion sources for prescription ADHD stimulants.
Method
Sample
The sample consisted of 147,816 assessments, from individuals aged 14 to 90 years who completed the ASI-MV (described below) generally as part of the intake process from a network of facilities across the United States. Data were collected from October 1, 2009, through March 31, 2012. The assessments were conducted in 624 sites located in 37 U.S. states. Sites within the network use the ASI-MV to assess problem severity of substance use and associated life-functioning areas for treatment planning and triage. Respondents come from various sources and take the assessment for several reasons. Of the participating sites, 54.8% provide predominately substance abuse assessments for inpatient/residential treatment, outpatient non-methadone and methadone maintenance programs. Respondents also completed the ASI-MV as part of their experience in drug court, probation/parole, or Driving While Intoxicated (DWI) programs (approximately 34.5%) with another 8.5% classified as a combination of substance abuse and criminal justice assessments. About 1% of all assessments collected were conducted for TANF (Temporary Assistance for Needy Families) programs to assess substance use problems and determine need for treatment.
Data Collection
The ASI-MV is a component of NAVIPPRO (Butler et al., 2008), a sentinel surveillance system for monitoring NMU of prescription medications. The assessment is a computer-administered version of the Addiction Severity Index (ASI); a standard intake assessment for adults with demonstrated reliability and validity, and routinely administered at admission (Hendricks, Kaplan, VanLimbeek, & Geerlings, 1989; McLellan, Kushner, Metzger, & Peters, 1992). Its goal is to assess substance abuse severity and to support planning for treatment. The ASI-MV provides a continuous stream of near real-time data from a network of participating sites throughout the United States. Questions in the assessment are presented in text and audio to address literacy limitations. For those who indicate use of prescription medications, the ASI-MV collects product-specific, geographically sensitive information about past 30-day NMU of individual products, along with questions about route(s) of administration (oral, smoking, snorting, injecting), and source of drug. Individual-level de-identified data captured in the ASI-MV are HIPAA (Health Insurance Portability and Accountability Act) compliant. Research conducted on these data have been determined to be exempt by an independent Institutional Review Board.
NMU of Prescription ADHD Stimulants
NMU for this study was defined as any use of a prescription medication within the past 30 days without a prescription, or use of one’s own prescription for a nonmedical purpose (e.g., to “get high”). In the ASI-MV, respondents are asked if they have used various prescription stimulant medications for any reason in the past 30 days. If the response is positive, the respondent is prompted to answer subsequent product-specific questions regarding the number of days of use not as prescribed, route of administration and identification of the source of medication as either from one’s own prescription or a source indicating nonprescribed medication. Identification of specific medications was determined by presenting images with audio of individual prescription medications including medication names, slang names and street names.
Statistical Analyses
Prevalence of past 30-day NMU (measured as the number of cases of past 30-day NMU per 100 ASI-MV assessments) and 95% confidence intervals (CIs) were calculated for prescription ADHD stimulants as a class and for other prescription drug classes (i.e., pain relievers and sedatives/tranquilizers). Past 30-day prevalence of NMU for prescription ADHD stimulants was also calculated at a product level. Selected products examined within these categories included: Adderall (immediate-release mixed amphetamine salts), Adderall XR (extended-release mixed amphetamine salts), Ritalin (immediate-release methylphenidate), Concerta (OROS methylphenidate), and Vyvanse (lisdexamfetamine dimesylate). Estimates presented for Adderall, Adderall XR, and Ritalin include brand and generic formulations of these products.
To account for differences in availability across products, prevalence rates of NMU per 100,000 prescriptions dispensed in the United States were calculated using data for total prescriptions during the study period obtained from the SDI Health, Sub-National Pain Market Prescription Tracking database. These data comprise nearly 59,000 pharmacies (over 99% of retail stores) in the United States and include cash, Medicaid, and third-party transactions. Data are representative of the retail pharmacy universe and do not include other potential channels of distribution, such as long-term care, hospital dispensing, and mail order.
Prevalence of product-specific NMU were compared using confidence intervals calculated at the 95% confidence level and statistical significance was determined at p ≤ .05. McNemar’s tests of correlated proportions 1 were used to compare proportions of self-report past 30-day NMU of the prescription medication classes using SPSS, Version 19.
Results
Demographic Characteristics of the Study Sample
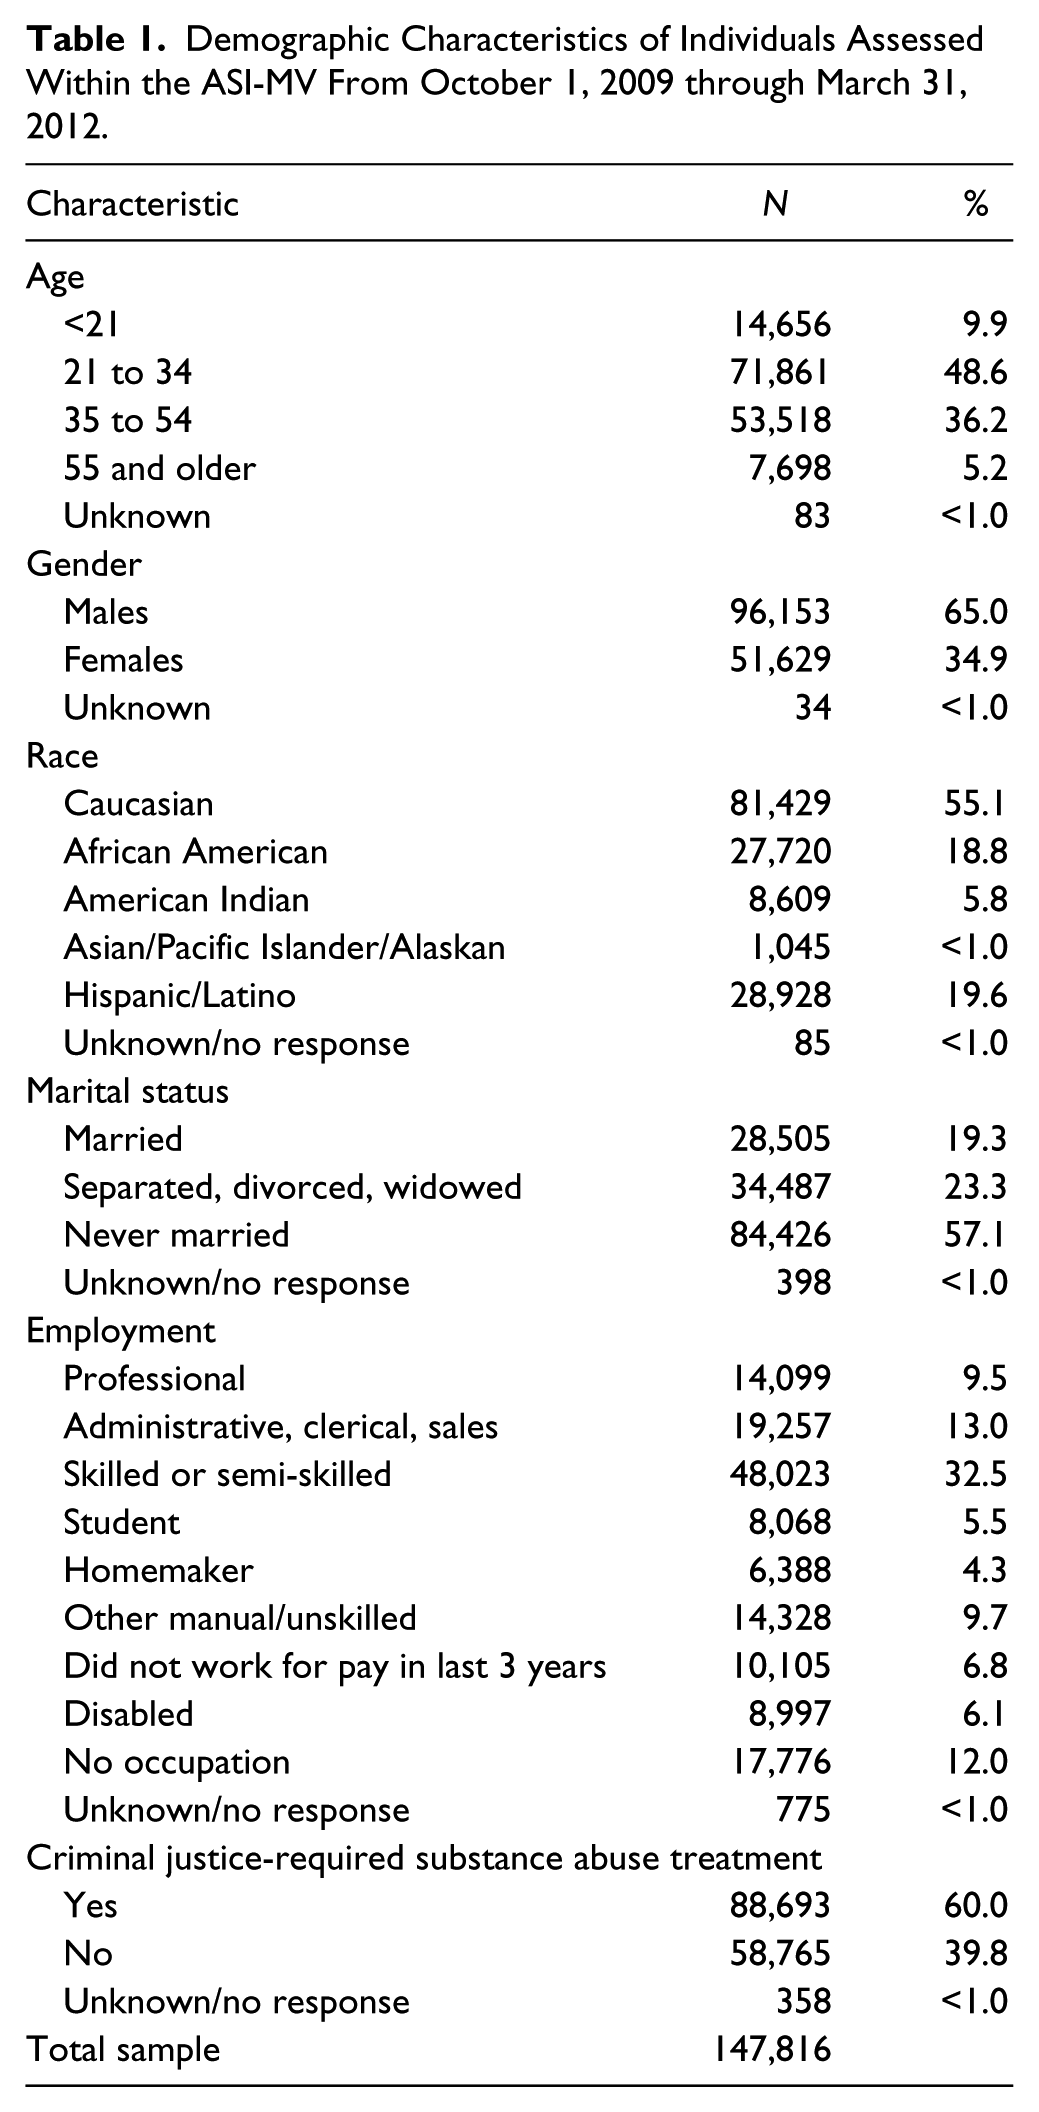
The total sample included 147,816 individuals assessed at 624 sites in 37 states across the United States. Most respondents were between 21 and 54 years of age (84.8%), and were male (65.0%) (Table 1). The majority of individuals in the sample were White (55.1%), followed by Hispanic (19.6%), and African American (18.8%).
Demographic Characteristics of Individuals Assessed Within the ASI-MV From October 1, 2009 through March 31, 2012.
Prevalence of NMU of Prescription ADHD Stimulants
Past 30-day prevalence of NMU of any prescription ADHD stimulant was reported by 1.29% (N = 1,905) of all respondents during the study period, significantly lower than reported NMU of any prescription opioid (19.79%; p < .0001) and reported past 30-day NMU of any prescription sedative (10.62%; p < .0001). These prevalence values were consistent and stable for each prescription medication group across the time period examined (Figure 1). It is important to note that the above values represent past 30-day prevalence of NMU among this sample of adults assessed for treatment for a substance abuse disorder and not the primary reason for entering or being assessed for treatment. When stratified by age, NMU of prescription stimulants was higher for younger adults with similar prevalence observed for individuals aged 18 to 25 years (1.63) and aged 26 to 34 years (1.61) compared with those in older age groups (Figure 2). In addition, while admission to treatment was prompted by the criminal justice system for approximately 60% of the total study sample, only 28.5% of those who reported prescription stimulant NMU were court ordered to treatment with the majority of them (75%) between the ages 18 and 34 years of age.
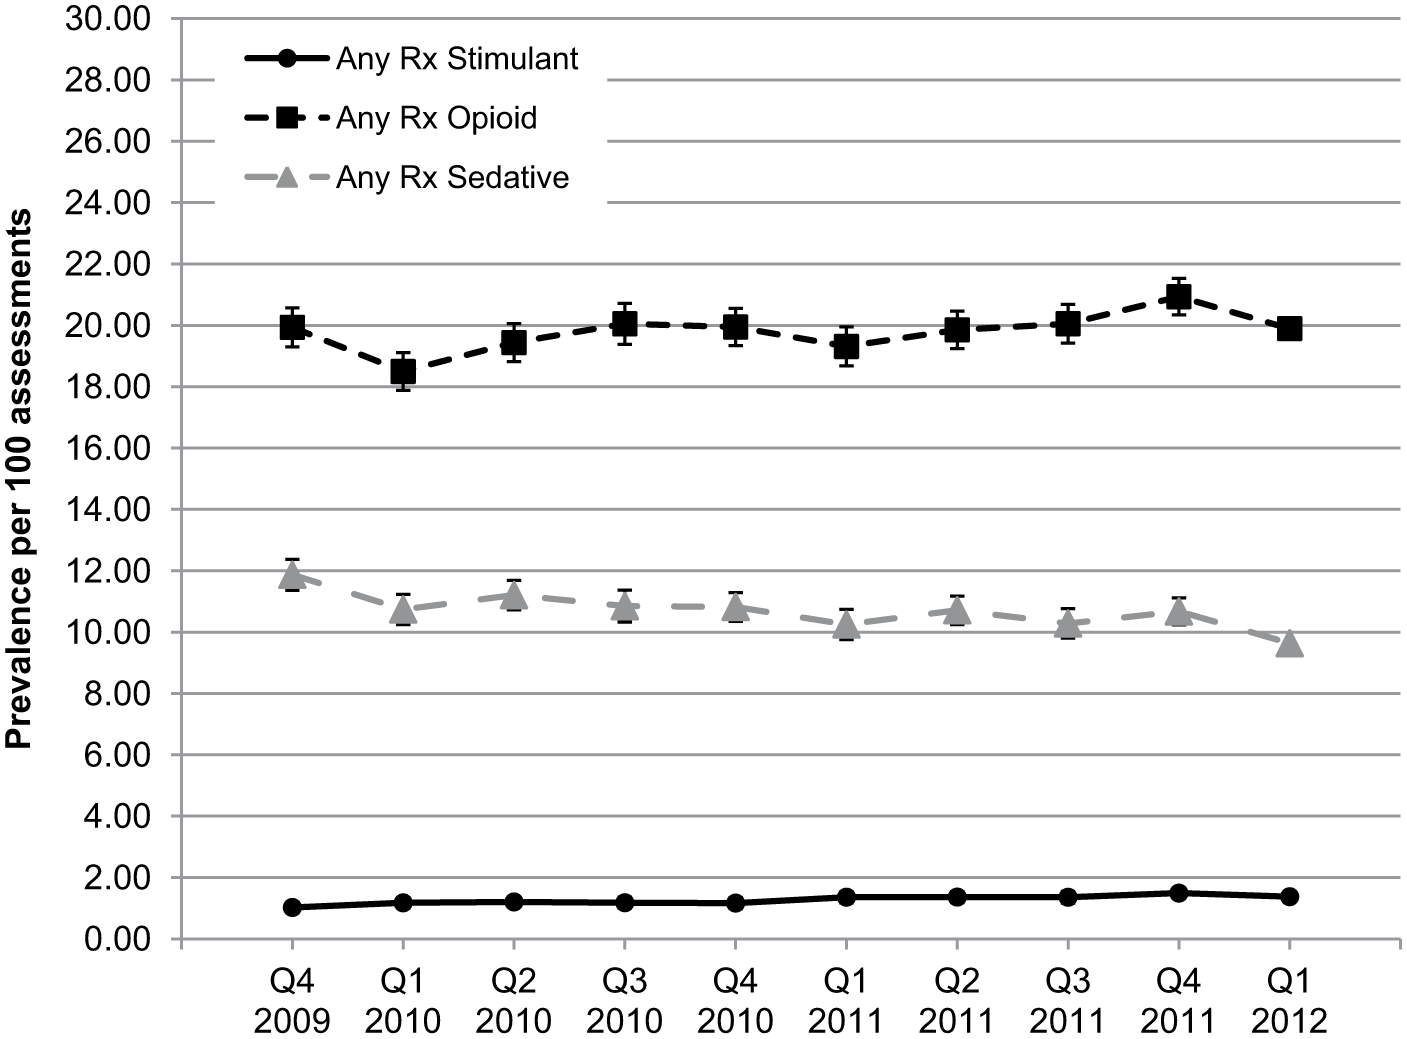
Quarterly past 30-day prevalence of nonmedical use of prescription medications, October 1, 2009 to March 31, 2012.
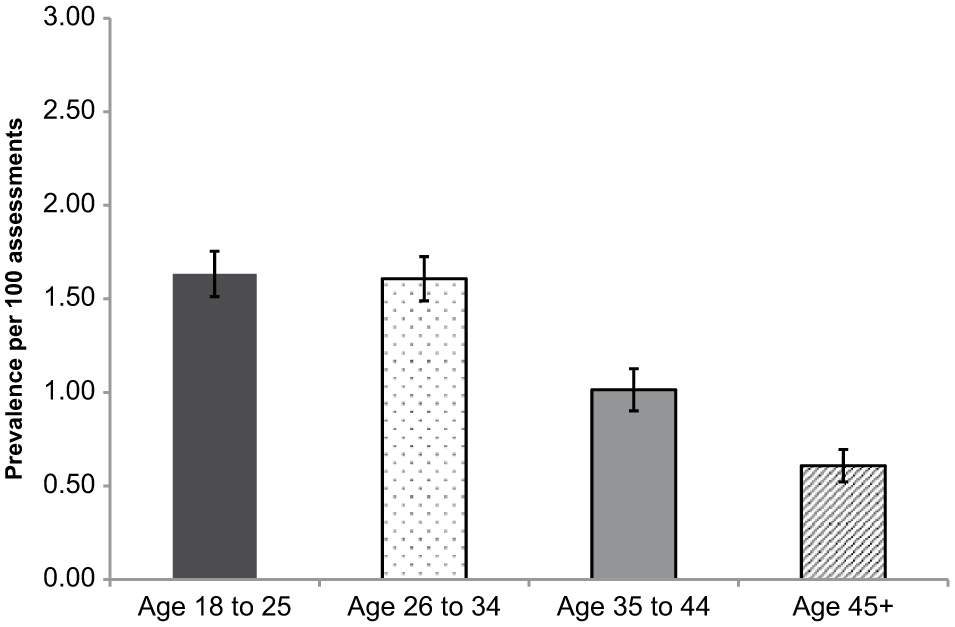
Age-specific past 30-day prevalence of nonmedical use of prescription stimulant medications, October 1, 2009 to March 31, 2012.
Five prescription ADHD stimulant products were evaluated separately including the immediate-release formulations Adderall and Ritalin and the extended-release formulations Adderall XR, Concerta, and Vyvanse. At a product level, rates of NMU of Vyvanse and Concerta were similar, and both were lower than those for mixed amphetamine salts, that is, Adderall and Adderall XR (Table 2). Within the sample studied, past 30-day NMU was highest for Adderall (0.62%), followed by Adderall XR (0.42%), and Ritalin (0.16%), all of which were significantly different from each other (p ≤ .001). Point estimates for Concerta (0.08%) and Vyvanse (0.12%) were significantly lower than the other medications (p ≤ .001), but not different from each other. To better understand the role that prescribed product availability plays in prevalence of NMU as well as to account for differences in availability across products, the volume of prescriptions dispensed was used as a proxy for the amount of a product that is potentially available within the community and thus could be diverted for misuse or abuse. After accounting for product prescribed availability in the estimates, the highest prevalence of past 30-day NMU per 100,000 prescriptions was for Adderall (4.92), Ritalin (4.68), and Adderall XR (3.18) followed by Vyvanse (1.26) and Concerta (0.89) (Table 2).
Past 30-Day Prevalence for Nonmedical Use of Rx Stimulants, Rx Opioids, Rx Sedatives, and Specified ADHD Medications (October 1, 2009 through March 31, 2012).
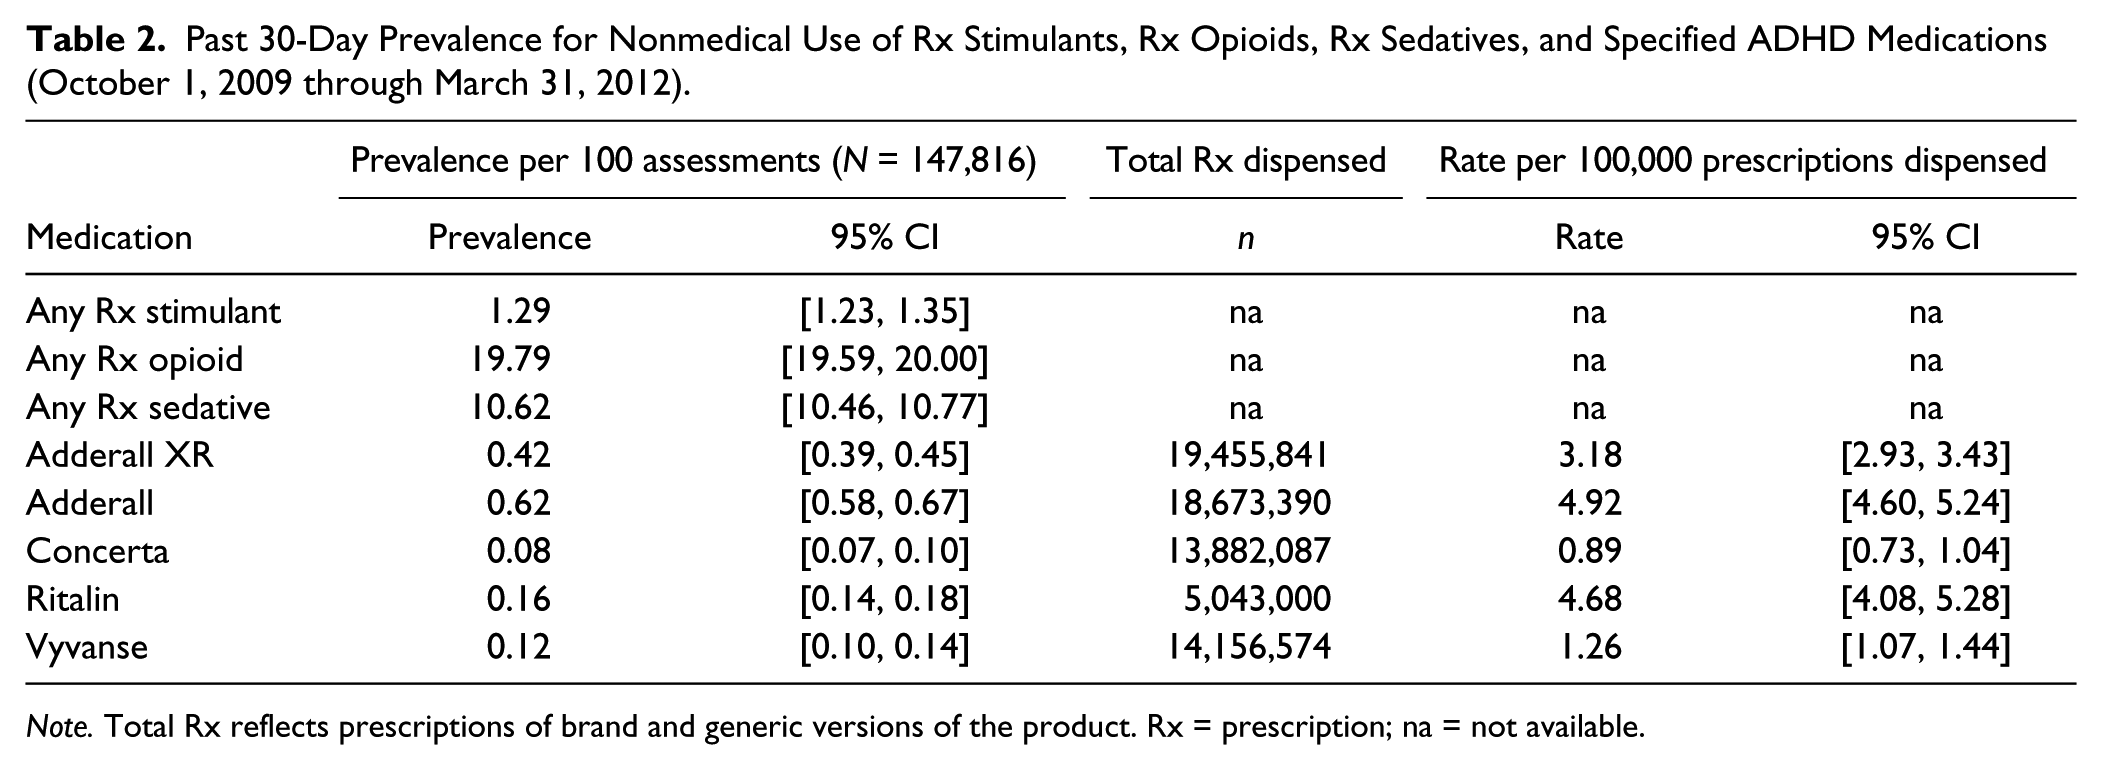
Note. Total Rx reflects prescriptions of brand and generic versions of the product. Rx = prescription; na = not available.
Although the likelihood of a product to be abused may be correlated with the prescribed availability of that product, both rates (unadjusted and adjusted for prescription volume) need to be considered when drawing conclusions about NMU of prescription ADHD stimulants. Of note is the fact that although differences in prevalence of past 30-day NMU were observed across these specific ADHD stimulant products, the low overall prevalence rate of prescription stimulant medications other drug classes calls into question the clinical relevance of those differences.
ROA and Diversion Associated With NMU of Prescription ADHD Stimulants
A variety of ROAs were endorsed by respondents reporting past 30-day NMU of ADHD stimulant medications. When considered as a group, prescription ADHD oral stimulants were most frequently swallowed whole (73.8%), followed by snorting (38%), injecting (10.1%) and smoking (3.1%). There was little difference in the pattern of ROA for the individual prescription stimulant products examined. Compared with prescription opioids as a group, the ROA profile for prescription ADHD stimulants was similar (74.8% swallowed whole, 28.1% snorted, 4.0% smoked) with the exception of a higher proportion of individuals reporting past 30-day NMU of prescription opioids reporting injection (15.1%) and “other” (8.6%) as a ROA.
Of the individuals who reported past 30-day NMU of prescription ADHD stimulants, a family or friend was the source of drug reported most frequently (54.3%), followed by a “dealer” (23.7%) and one’s own prescription (23.3%) as reported sources of these prescription stimulants for NMU. Although use of one’s own prescription as a source of drug for NMU was reported overall among the sample as 23.3%, a slightly lower percentage (19.7%) reported exclusively their own prescription as a source of drug for purposes of NMU rather than obtaining these medications from other sources. However, the point estimates for source of medication for prescription stimulant NMU differed from the pattern observed for prescription opioids where a higher percentage of prescription opioid abusers reported their own prescription (50.0%) or a dealer (28.1%) as a source compared with sources reported for prescription ADHD stimulants, which appear much more likely to be diverted through friends or family members.
Discussion
The study presented here was conducted to evaluate the prevalence of NMU of prescription ADHD stimulants within a high-risk sample of individuals evaluated for substance abuse treatment planning and triage. Class level and medication-specific information was collected and analyzed from October 2009 through March 2012.
In our study sample of 147,816 individuals from 624 sites across the United States, the proportion of participants being assessed in a substance abuse treatment context who reported past 30-day NMU of prescription opioids, prescription sedatives, or prescription ADHD stimulants was consistent over time. The prevalence of past 30-day NMU of prescription ADHD stimulants was substantially lower than that observed for prescription opioids and prescription sedatives, a pattern consistent with reports from general population-based samples (SAMHSA, 2011). In this substance abusing population, the observed pattern is similar to values reported from TEDS data (SAMHSA, 2009), in which 11.5% reported non-heroin opioid abuse on admission, 4.8% reported abuse of sedatives (not counting barbiturates), and only about 0.2% reported abuse of “other stimulants.” While the point estimates are somewhat higher among this study sample, the overall pattern is consistent: prescription stimulants intended for the treatment of ADHD appear to be used nonmedically at a much lower rate than other medications in substance abuse populations. This lower level of abuse is also consistent with levels observed in surveys of the general population (Cassidy et al., 2012; Novak, Kroutil, Williams, & Van Brunt, 2007). Estimates of past 30-day NMU of prescription stimulants similar to results reported here have been reported among general population-based samples ranging from 0.4% to 1.0% (Cassidy et al., 2012; SAMSHA, 2011). In a study of college students, a higher prevalence of past 30-day NMU of ADHD stimulants was reported as 2.1% (McCabe, Cranford, Morales, & Young, 2006), consistent with the higher prevalence of NMU observed among younger adults (i.e., ages 18-25) observed in this substance abusing population.
At a prescription stimulant product level, past 30-day NMU prevalence was calculated based on ASI-MV respondents who endorsed using specific prescription ADHD stimulants nonmedically. Although differences were found between various prescription stimulant products, it should be emphasized that the overall prevalence for prescription ADHD stimulants within this study sample is very low (1.29%). As such, even statistically significant differences between product categories or specific brands may not be clinically meaningful. Considering the prescription availability of the products (i.e., total prescriptions dispensed), we did observe, however, that past 30-day NMU of Adderall, Ritalin, and Adderall XR were higher than NMU of the newer extended-release formulations of prescription stimulant products examined (i.e., Vyvanse and Concerta).
The most frequently used ROA reported for NMU of prescription ADHD stimulants was “swallowed whole,” followed by snorting. This ROA pattern is similar to that observed in prescription opioids, when considered as group. It is interesting to note, however, that analyses of ROA patterns among specific prescription opioids in this same population (Butler, Black, Cassidy, Dailey, & Budman, 2011) identified unique, product/compound-specific ROA patterns. Such product-specific variation was not observed for NMU among the prescription ADHD stimulants.
Sources of drug procurement were also examined, and the pattern of sources did not differ among the specific prescription ADHD stimulant products. Most respondents in this sample of individuals evaluated in a substance abuse treatment context reported that their source of ADHD stimulant for NMU was a family member or friend which is consistent with the 2010 NSDUH survey (SAMHSA, 2011) and other studies (Barrett, Darredeau, Bordy, & Pihl, 2005; Cassidy et al., 2012; McCabe, Cranford, et al., 2006; Novak et al., 2007; Wilens et al., 2008), while a dealer was the source of the drugs for approximately 24% of those abusing ADHD stimulants. Again globally, these data are similar to the patterns observed with prescription opioids. However, examination of the magnitude of the differences between sources for prescription ADHD stimulants suggests that procurement through one’s own prescription or a dealer is less than half as likely as through family and friends. Among those who reported NMU of prescription stimulants, 19.7% indicated the source of drug was exclusively from their own prescription and no other source suggesting that the misuse or abuse of one’s own medication is less frequent among this substance abusing sample compared with those not prescribed these drugs but receive diverted medication for NMU from other sources. This finding implies that efforts to stem diversion that are focused on patients not sharing, selling or trading their medications with friends and family may be most impactful.
Although consistent with other published studies, results and point estimates presented here are not directly comparable to other studies using other data sources. The present study focused on a high-risk population of individuals being evaluated for substance abuse treatment at sites utilizing the ASI-MV system. Others have studied a treatment population, but these have focused on other subgroups, such as women (Shannon, Havens, Mateyoke-Scrivner, & Walker, 2009) or adolescents (Gonzales, Brecht, Mooney, & Rawson, 2011). Studies of the general population (Kroutil et al., 2006; SAMHSA, 2011) tend to measure lifetime or past 12-month NMU, whereas the present study focused on past 30-day NMU of prescription stimulants. As discussed above, the present findings are consistent with findings from other data sources on a substance abuser population (i.e., TEDS [SAMHSA, 2009]). This consistency further strengthens the product-specific, near real-time data generated from the ASI-MV network and presented here.
A key strength of this study is the use of the ASI-MV system as a data collection instrument, which uses consistent measures allowing for reliable comparisons of NMU of prescription medications over time at a class and product-specific level. In addition, the ASI-MV system’s near real-time data collection methodology allows timely analysis and monitoring of NMU among a population at risk of misuse or abuse of these medications. Another strength is that the ASI-MV is an integrated part of the clinical intake and treatment planning process. Product-specific data are collected by the ASI-MV using a variety of efforts to ensure accurate identification of prescription medications by respondents, including use of medication names, street names, pictures of the medications and a voice-over feature that mitigates the impact of poor literacy on the part of respondents.
Overall, these findings should be interpreted in light of several considerations. First, the validity of self-reported information depends on the willingness of the respondent to answer truthfully about drug use in that data collection system and their ability to recall use of specific drugs within designated time frames. On the other hand, self-reported information obtained via computer (the mode used by ASI-MV) may be more accurate than self-reports collected by an interviewer. A growing body of evidence suggests that respondents tend to endorse more sensitive or socially undesirable life circumstances on computer-administered surveys than they do to interviewers (Butler, Villapiano, & Malinow, 2009; Garb, 2007; Hewson, 2007; Joinson & Paine, 2007).
Concerns about generalizability and predictive value of these results may arise given that the population examined may not be necessarily representative of all patients entering treatment nationally. This is because the data collected from the ASI-MV network constitute a sample of sites that purchase the computer program to assist with clinical evaluations. As such, while these data, by definition, cannot be considered representative of individuals in treatment for substance use disorders, there is no reason to believe that the populations at centers who use the computerized ASI-MV are different than those who do not. Clearly, our study sample does not represent substance abusers who do not seek treatment. Further, the ASI-MV data may not be appropriate for estimating representative national rates of abuse.
As we have seen, there are differences in the point estimates of NMU prevalence from the data obtained in the substance abuse treatment context by the ASI-MV network and the TEDS dataset. These differences may reflect the many differences between the two systems, including data-collection methods, definitions, types of sites evaluated, and timeframe.
Despite acknowledged limitations of the ASI-MV system, it is important to highlight the relatively large number of assessments available, a wide geographic distribution of assessment sites, and use of a validated method of direct questioning of the individuals (Butler et al., 2001; Butler et al., 2009). In addition, the ASI-MV is part of the intake process which translates into a high participation rate, and the data stream provides near real-time data on nonmedical use of specific prescription medications. The consistency of relative rates, routes and sources reported here with those derived using other methods and other datasets further lends support for the present findings.
The present study expands previous efforts to characterize and monitor NMU of prescription ADHD stimulants in various populations by focusing on a sample of individuals at high-risk for substance abuse who are being evaluated for treatment planning purposes, and examining characteristics associated with NMU of prescription stimulants at class and product-specific level. Findings from this study suggest that those with substance use and addiction problems report lower prevalence of NMU of prescription ADHD stimulants than prescription pain medications and sedatives. This may be an indication that prescription stimulant medications have a lower level of attractiveness for purposes of nonmedical use within this sample of high-risk adults. However, it should also be noted that stimulant medications are scheduled II controlled substances that should be monitored by health care professionals for abuse potential.
Footnotes
Authors’ Note
Theresa A. Cassidy, Emily C. McNaughton, and Mirella Zulueta are employees of Inflexxion, Inc. Stephen F. Butler is an employee and shareholder of Inflexxion Inc. Sajan Varughese and Leo Russo are employees of Shire and hold stock and/or stock options in Shire Development LLC. Although the sponsor (Shire Development LLC) was involved in the design, collection, analysis, interpretation, and fact checking of information, the content of this manuscript, the ultimate interpretation, and the decision to submit it for publication in Journal of Attention Disorders were made by the authors independently.
Declaration of Conflicting Interests
The author(s) declared no potential conflicts of interest with respect to the research, authorship, and/or publication of this article.
Funding
The author(s) disclosed receipt of the following financial support for the research, authorship, and/or publication of this article: This research was funded by the sponsor, Shire Development LLC, Wayne, PA, USA. Shire Development LLC provided funding to Inflexxion Inc. for support in writing and editing this manuscript.