
Abstract
Inattention and Impulsivity and Deficits in Visual Processing and Emotion Regulation
ADHD is a neurodevelopmental disorder that typically begins in childhood and often persists into adulthood. It is characterized by inappropriate development levels of inattention and hyperactivity resulting in functional impairment in academic, family, and social life (American Psychiatric Association [APA], 1994). As a disorder that typically begins in childhood, ADHD has been found to affect between 3% and 7% of all children, a finding which was found to remain stable across many different countries (Polanczyk, de Lima, Horta, Biederman, & Rohde, 2007). Between 71% and 83% of children diagnosed with ADHD retain this diagnosis when older (Barkley, Fischer, Smallish, & Fletcher, 2002), and the prevalence of ADHD in adults is estimated to be between 2% (Simon, Czobor, Bálint, Mészáros, & Bitter, 2009) and 4% (Kessler et al., 2006).
The Diagnostic and Statistical Manual of Mental Disorders (4th ed., text rev.; DSM-IV-TR; APA, 2000) divides ADHD criteria into two main groups of symptoms: Nine inattention symptoms that mainly include problems with noticeable details, problems with order and organization, and problems with following instructions. The second group is composed of nine hyperactivity-impulsivity symptoms, which can be further divided into six hyperactivity symptoms that mainly include problems with sitting still and staying in one place, and three impulsivity symptoms that mainly include problems in waiting for one’s turn when talking or playing with others.
It is important to note that the main line of studies that aim to dissociate inattention and hyperactivity/impulsivity have done so through the use of the diagnostic subtypes of the disorder. According to the DSM IV-TR, the two symptom groups manifest themselves in three clinically distinct subtypes: predominantly inattentive subtype (ADHD-PI) defined as having six or more inattention symptoms, but five or less hyperactivity/impulsivity symptoms; predominantly hyperactive/impulsive subtype (ADHD-HI) defined as having six or more hyperactivity/impulsivity symptoms, but five or less inattention symptoms; and combined subtype (ADHD-C) defined as having six or more inattention and six or more hyperactivity/impulsivity symptoms. A major problem with this approach is that the impulsive/hyperactive subtype seems to be very rare, with a prevalence that drops to near zero when diagnosing any population that is older than preschool age (Barkley et al., 2002; Dulcan, 1997; Murphy, Barkley, & Bush, 2002; Riley et al., 2008; Van Voorhees, Hardy, & Kollins, 2011). This means that studies that have focused on ADHD in adolescents and adults often compare only the ADHD-PI and ADHD-C subtypes on various tasks, and have so far found no consistent differences between the two groups (Epstein et al. 2011; Paternite, Loney, & Roberts, 1996; Pritchard, Neumann, & Rucklidge, 2008; Riccio, Homack, Jarratt, & Wolfe, 2006; Solanto, Schulz, Fan, Tang, & Newcorn, 2009). In addition, studies that have tried to dissociate the ADHD-C and the ADHD-HI subtypes in children have been unsuccessful as well (Riley et al., 2008; Tucha et al., 2006).
While the question of whether the different subtypes should be considered as separate remains open, there is little debate regarding the distinction between the symptom groups. Despite the limitations that have been listed, when reviewing the literature of ADHD studies, it is possible to draw a relation between problems of impulsivity and deficits in emotion regulation, and between problems of inattention, and deficits in visual selective attention. These possible relations stem from studies that have either found single dissociations (i.e., findings of only one of the subtypes to be specifically impaired compared with a control group) or specific relations between symptom measures and specific task scores.
Impulsivity and Emotion Regulation
Emotional dysregulation can be defined as a failure to engage in self-regulatory actions, including self-soothing, refocusing attention, moderating the initial emotion, and organizing for coordinated action in the service of goal-directed behavior (Mitchell, Robertson, Anastopolous, Nelson-Gray, & Kollins, 2012). Building on this definition, the relation between ADHD and emotion liability has been often reported (Anastopoulos et al., 2011; Brotman et al., 2006; Martel, 2009; Retz, Stieglitz, Corbisiero, Retz-Junginger, & Rösler, 2012; Skirrow, McLoughlin, Kuntsi, & Asherson, 2009). For example, a study by Sobanski and colleagues (2010) compared 1,186 children diagnosed with ADHD-C with 1,827 neurotypical children on measures of emotional liability, and found that the mean emotional liability score of ADHD-C children was over 1.5 standard deviations from that of neurotypical children. In addition, the researchers discovered that emotional liability correlated mostly with hyperactive/impulsive symptoms (Sobanski et al., 2010).
Inattention and Visual Attention
Visual attention tasks often refer to one of two attentional processes: (a) The ability to focus on a relevant target stimuli while ignoring irrelevant distracting items (Mason, Humphreys, & Kent, 2003) and (b) the ability to focus on task-relevant information, while ignoring distracting contextual elements in a single stimulus (Della Libera & Chelazzi, 2006; Weissman, Mangun, & Woldorff, 2002). Several classic tasks that fit one of these definitions, as well as many variations of these tasks, have been in common use in the assessment of ADHD deficits, mainly the Stroop Task (Stroop, 1935), the Flanker task (Eriksen & Eriksen, 1974), the Visual Search Task (Treisman & Gelade, 1980), and the Navon Task (Navon, 1977). However, experiments applying these tasks to an ADHD population have often been inconclusive (Stroop: Homack & Riccio, 2004; Lansbergen, Kenemans, & van Engeland, 2007; Flanker: Johnson et al., 2008; Johnstone et al., 2009; Conjunction search: J. R. Booth et al., 2004; Mason et al., 2003; Navon: Groen, Mulder, Wijers, Minderaa, & Althaus, 2009; Helton, Head, & Russell, 2011).
According to J. E. Booth, Carlson, and Tucker (2007), as well as Kooistra, Crawford, Gibbard, Kaplanab, and Fand (2011), when no distinction is made between the ADHD-PI subtype and the other subtypes, studies assessing visual attention in ADHD are predicted to often be inconclusive. As partial support to this claim, several studies that have assessed only ADHD-PI participants on measures of visual attention have found significant results: In a task employing hierarchical numbers, Song and Hakoda (2012) found participants diagnosed as ADHD-PI to have an atypical local interference. This means that while the control group showed no difference between the global and local conditions, the ADHD-PI group did show a marked increase in reaction times (RTs) and error rates in the global condition (which required ignoring the local elements of the stimuli; Song & Hakoda, 2012; see also Carlson, Benjamin, Lahey, & Neeper, 1986; Goth-Owens, Torteya, Martel, & Nigg, 2010; Weiler, Bernstein, Bellinger, & Waber, 2002).
The Current Study
The main aim of the current study was to dissociate between inattention and impulsive/hyperactive symptoms. Review of the literature reveals that impulsivity is likely to be specifically related to measures of emotion regulation, while inattention is likely to be specifically related to measures of visual selective attention.
A secondary aim of this study is to evaluate the factor structure of the Conner’s adult ADHD rating scales (CAARS-S; Conners et al., 1999) in an Israeli sample, as very few studies have tested the relevance of the CAARS-S to cultures other than that of the United States.
Method
Participants
The study included 120 students from Ben-Gurion University of the Negev. Participants were male and female students (71 males) between 20 and 30 years old (M = 24.6), all native Hebrew speakers.
Participants were recruited via ads that were posted on billboards around the university campus, as well as on various class forums. The participants were offered 20 New Israeli Shekels (NIS; around US$5.5) for participating in a 50-min experiment. All participants were asked prior to testing whether they had any history of mental illness and if they are being treated for it. Students who reported any illness other than ADHD were excluded.
Out of the 120 participants, 18 had reported being diagnosed with ADHD, and 3 were taking regular medication for it. These participants were asked to refrain from taking the medication for 24 hr prior to the experiment. The experiment was approved by the local ethics committee and all participants signed an informed consent form prior to the beginning of the tests.
Procedure
The CAARS-S
As mentioned above, the CAARS-S is a self-report questionnaire designed to assess ADHD symptoms in adults. It is composed of 66 items each ranked on a 4-point Likert-type scale, and can be divided into four factors assessing cognitive/inattention, hyperactivity, emotional/impulsivity, and self concept. A Hebrew version of the questionnaire was administered as a pen-and-paper task.
In this case, the participants were given a two-sided sheet of paper and a pen, and were asked to fill in as quickly and as absent of thought as possible, to what degree the different statements apply to them. To answer the main objective of this study, while the factor structure evaluation includes all factors and items, only the two relevant factors have been included as the predicted variables of a regression: the inattention and impulsivity factors.
The Cyber Cruiser task
The Cyber Cruiser task was used to test the hypothesis that children with ADHD have a difficulty in switching between primary and secondary tasks, when the first is more emotionally engaging than the latter (Kerns, 2000; Kerns & Price, 2001). The task was chosen because it produces objective measures of emotional responses that have proven relevant to ADHD deficits in children. The experiment was conducted on a 15-inch IBM T60 Laptop. Participants in this experiment used their dominant hand to control a small cartoon car on a 2D road, using a joystick, to avoid cars that were driving in the opposite direction, as well as the occasional fire truck or ambulance that came from behind. Participants could also raise or lower the speed in which the cars were driving around them (explained as “going faster”). Participants were awarded points for every second they did not hit any car (and received more points the “faster” they went), and lost 10 points for every car they hit. In addition to avoiding oncoming traffic, their secondary task was to check their fuel gauge from time to time (by pressing a key on the joystick), and to refuel their car if the gauge was in the red zone of the fuel meter (by pressing a different key on the joystick).
While the main task was designed to be challenging and fun as described in the original paper, the secondary task was designed to be a chore while the fuel gauge was displayed, the car could not be controlled and points were often lost. The penalty for not fulfilling the secondary task, however, was losing all of the points that were accumulated so far, and starting the count from zero. Detaching oneself from the primary task to fulfill the secondary one is then emotionally taxing in at least two different ways: First, it requires the participant to stop an enjoyable task to perform a chore. Second, it requires the participant to ignore an immediate small aversive stimulus (i.e., losing points), to avoid a bigger more distant aversive stimulus (i.e., losing all points). Following the analyses performed by Kerns and Price (2001), only two measures are to be included as predictors in the regression—the number of times that the participant checked the fuel gauge and the number of times that the participant ran out of gas.
The Microgenesis task
The current study used the Microgenesis version employed by Kimchi (1998; Experiment 1), which was designed to test the effects of global and local processing in a primed similar/different judgment task. We chose this version because it has been proven useful in identifying specific impairments in a clinical group (Behrmann et al., 2006).
The experiment was conducted on a 15-inch IBM T60 laptop. Participants used their dominant hand to respond. On each trial, a fixation point appeared on the screen for 250 ms, followed by a prime that was presented for 40, 90, 190, 390 or 690 ms. Immediately after the prime, two stimuli (targets) appeared in the middle of the screen for 3,000 ms, and participants were asked to judge as quickly and as accurately as possible if the targets were the same or different.
Prime and targets consisted of either 4 or 16 (few or many) squares or circles (local elements) arranged in the shape of either a square or a diamond (global configuration). This creates four relevant conditions: (a) Few-local priming, in which the prime and targets were composed of four elements, and the prime had the same elements as the targets, but a different configuration; (b) Few-global priming, in which the prime and targets were composed of four elements, and the prime had the same configuration as the targets, but different elements; (c) Many-local priming, in which the prime and targets were composed of 16 elements, and the prime had the same elements as the targets, but a different configuration; and (d) Many-global priming, in which the prime and targets were composed of 16 elements, and the prime had the same configuration as the targets, but different elements. Examples of the four conditions are shown in Figure 1.
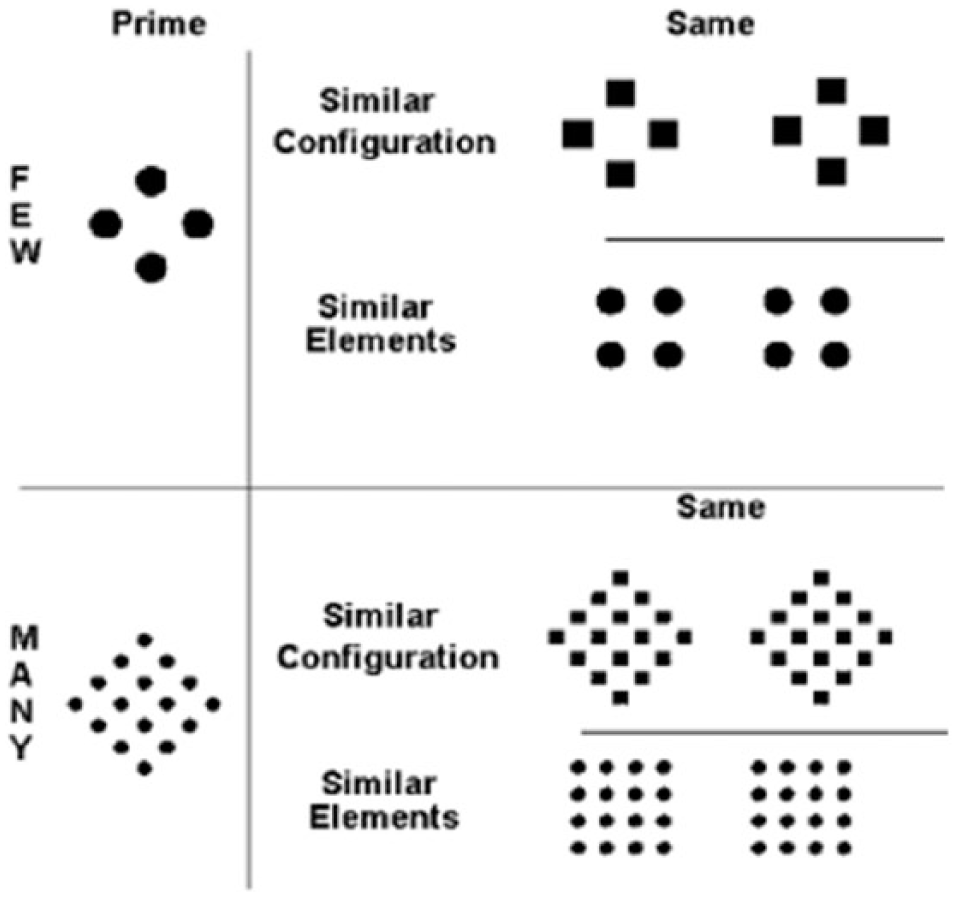
Examples of the stimuli used in the Microgenesis task, as presented in Behrmann and colleagues (2006).
Of these four conditions, two are more perceptually demanding, that is, it has been shown to be more difficult to focus one’s attention on the global configuration of a four element shape, as well as to focus one’s attention of the local element of a 16-element shape (Kimchi, Hadad, Behrmann, & Palmer, 2005; Kimchi & Palmer, 1982, 1985). This means that the few-local priming condition and the many-local priming condition should require a longer presentation of the prime (an effect we term the “prime duration effect”) to show the priming effect. This phenomenon was previously shown by Behrmann and colleagues (2006).
To measure the prime duration effect, it is possible to calculate the slope of the RTs as a function of the prime duration (RT slopes), that is, to measure how RTs become shorter as a compatible prime is presented for a longer duration. In the current study, we will calculate the RT slopes separately for each of the four conditions (i.e., few-global slope, few-local slope, many-global slope, and many-local slope). These four measures will be included as predictors in the regression analysis.
It should be noted that beside the fact that the targets were always matched in the amount of elements they were composed of, every possible prime-targets combination was used (meaning that some trials included, for example, a 4-element prime and 16-element targets). This was done so as not to allow any strategy to be formed. Then, as was done in the original study, we analyzed only “same” trials (trials in which the targets were identical to one another), in which the prime and targets conformed to one of the four conditions (meaning that the prime and targets had the same amount of elements, and the prime was similar to the targets in only one respect, either its local elements were the same as the targets’ or its global configuration was the same as the targets’; Behrmann et al., 2006; Kimchi, 1998).
Experimental procedure
Each participant stepped into a well-lit room and was greeted by one of two experimenters. The participant then filled identifying information (such as age and email address), and signed an informed consent form. The participant was then seated in front of a 15-inch IBM T60 laptop. The Microgenesis task and The Cyber Cruiser were counter balanced so that one of the tasks was run, then the CAARS-S was administered, and then the other task was run. The participant was then thanked, and given payment.
Results
CAARS’ Factor Structure
Exploratory factor analysis
A scree test was used to determine the number of factors to be used in the rotation of the data. The scree plot showed a slight bending at the four factor points, and a large bending at the five factor points making these two points candidates for the rotation. As was done in the original study, we used a varimax rotation (a rotation which chooses the solution with maximum independence between factors), while forcing the data to divide into exactly five factors.
In addition, restrictions used in the original study were used, that is, we removed items with a loading of less than 0.3 on all items, as well as items with a loading of more than 0.3 on two factors or more. However, when using this method, the fifth factor was completely removed.
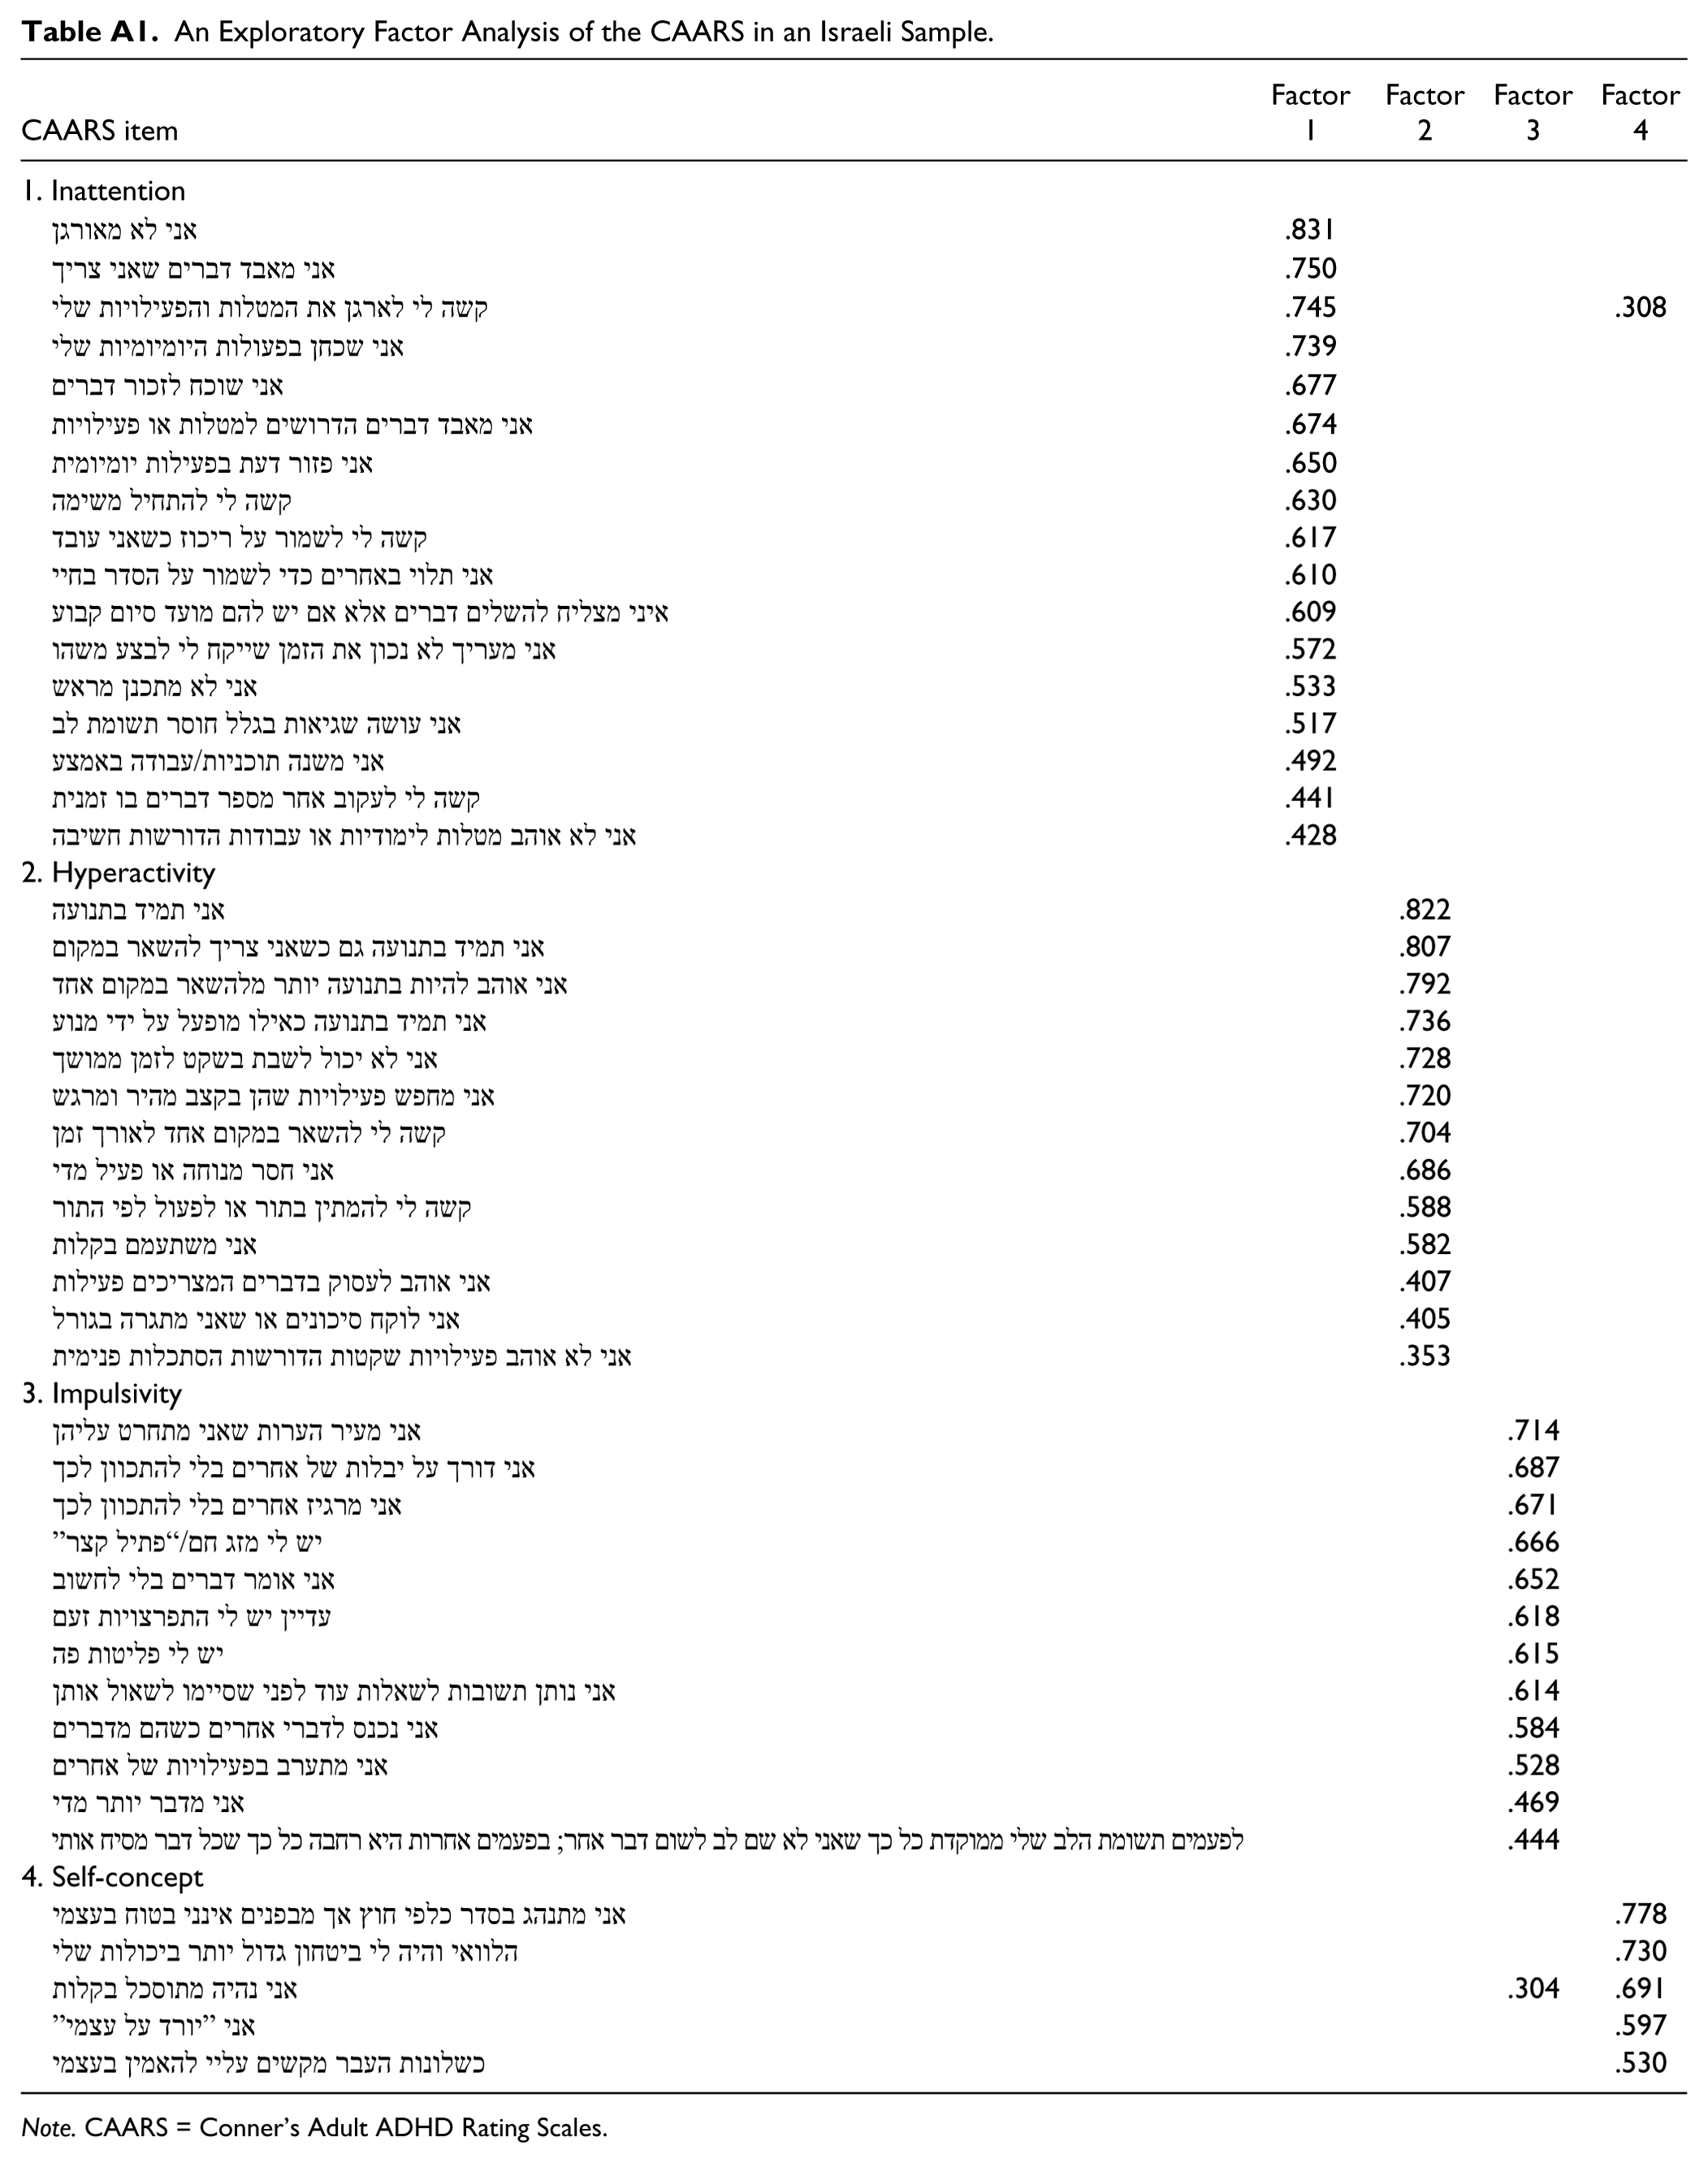
Next, we used a varimax rotation while forcing the data to divide into exactly four factors, and using the same restrictions that were mentioned above. The four factors explained 49.79% of the total variance, and the rotated factors accounted for 15.92%, 12.99%, 11.50%, and 9.39% of the variance, respectively.
Somewhat unexpectedly, the resulting matrix, as presented in the appendix, bears great resemblance to the one found in the original paper. A simple count shows that 88% of the items that composed the four factors of the original study loaded on the same factors in the Israeli sample, and only one item (“easily frustrated”) migrated from one factor to another. The remaining differences were very slight from a theoretical view point, with only a few items removed (e.g., “squirm and fidget”), and with items that were added where they were predicted to belong (e.g., “having trouble organizing tasks and activities” was included in the cognitive/inattention factor). These results show that if the original study was conducted in Israel, it is possible that a very similar factor structure would have been deduced.
Confirmatory factor analysis
The confirmatory factor analysis was performed using the AMOS 18 software. Only the 42 items that were included in the final factor matrix of the original paper were included in the analysis (see Christiansen et al., 2011). The program was then presented with the theoretical model (shown in Figure 2), and the fit between the model and the data was calculated. The degrees of freedom in the model were 813, with 42 observed variables and 46 unobserved variables.

Confirmatory factor analysis model: factors in circles, items in squares and error variances in small circles. The model was created using IBM® SPSS® AMOS 18.
The items’ loading patterns were satisfactory, with all items having a loading score larger than 0.3, except one (“like to do active things”). In addition, the factors show high internal consistency—inattention/cognitive Cronbach’s α: .878; hyperactivity Cronbach’s α: .877; impulsivity/emotion Cronbach’s α: .858; self-concept Cronbach’s α: .856.
Unfortunately, goodness of fit measures did not reach the accepted norms. The Root Mean Square Error of Approximation (RMSEA) statistic equaled .085 (while the suggested cutoff is .06 or less), the Tucker-Lewis index (TLI) statistic equaled .661 (while the suggested cutoff is .95 or above), and the comparative fit index (CFI) statistic equaled .695 (while the suggested cutoff is .95 or above). These results may stem from problems in the sample size, as is discussed in length in the discussion part.
Experimental Results
The CAARS-S inattention and impulsivity factors were extracted by averaging over the relevant items of each factor (see Conners et al., 1999). The skewness statistics of the inattention and impulsivity factors were positive (0.681 and 0.692, respectively), showing that the distribution leans toward the lower end of the range, that is, showing that the scores of both factors tended to be smaller than 2.5 (as can be expected in a sample of neurotypical participants). Nevertheless, the lower quartiles are fairly high (0.83 and 0.6, respectively, out of 3), indicating that there is probably no floor effect. The Cyber Cruiser measures were extracted by counting the number of times the participant pressed the fuel check button, and by counting the number of times the car ran out of gas. No outlier problems arose when examining the data.
The measures of The Microgenesis task were extracted by first averaging the RTs of corresponding trials, separately for each of the four conditions and for each prime duration (e.g., few-global trials, in which the prime was presented for 40 ms were grouped together, and averaged over). Then, we calculated the slope of the RTs as a function of the prime duration (e.g., all few-global means were arranged according to their prime presentation duration, and a slope score was calculated using MS Excel). The longest prime durations were discarded, because they showed an unexplained spike (the mean RT for the longest prime duration was as high as that of the shortest prime duration in all four conditions). The slope of the four remaining prime durations was then calculated separately for each of the four conditions. A correlation matrix of the six predicting variables is shown in Table 1. Often, when performing a multiple regression, a problem of multicollinearity might be considered if the correlations between measures surpass 0.7 (Slinker & Glantz, 1985). As can readily be seen, in the current regression model there is no such concern.
Correlations Between the Predicting Variables of the Regression.

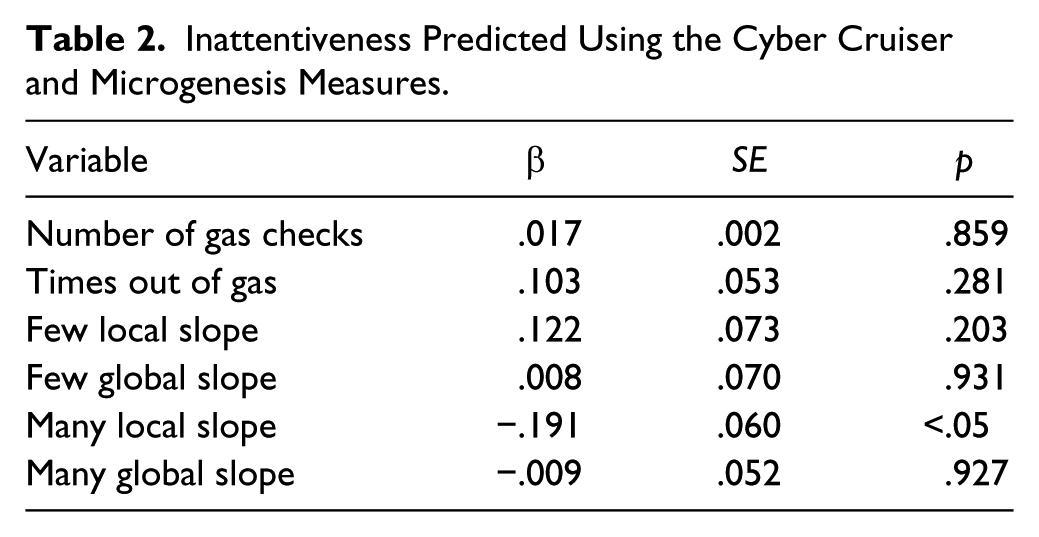
To examine whether The Cyber Cruiser and Microgenesis measures are specifically related to the inattentive and impulsive factors, we performed two multiple regression analyses in which we predicted each of the relevant CAARS factors using all of the mentioned measures as predictors. The regression results for the inattentiveness and impulsivity regressions are presented in Tables 2 and 3, respectively.
Inattentiveness Predicted Using the Cyber Cruiser and Microgenesis Measures.
Impulsiveness Predicted Using the Cyber Cruiser and Microgenesis Measures.

While the two regression models were not significant, R2 = .068, F(8, 109) = 1.325, p = NOS; R2 = .069 F(8, 109) = 1.338, p = NOS, out of the six predictors used, only the many-local condition’s slope was a significant predictor of the inattentiveness score, β = −.191, t(114) = −2.02, p = .04. The second highest predictor had a β value of .122 and a significance value of .203.
The results presented above mean that the higher the inattentiveness score, the more negative and hence steeper the RT slope was. In other words, people who had higher inattentive scores benefitted more from the longer primes in the many-local condition, and that was true only to this condition. Hence, a measure of effortful visual processing was found to be specifically related to inattentiveness.
In addition, when predicting the impulsiveness score, only the number of times the car ran out of gas was a significant predictor, β = −.23, t(114) = 2.42, p = .01. The second highest predictor had a β value of −.103 and a significance value of .288. These results indicate that the higher the impulsiveness score was, the less the participant tended to run out of gas. This means that a measure of emotional control was found to be specifically related to impulsiveness scores, although with an opposite direction to the one we predicted.
Discussion
This current study included two goals: Searching for a double dissociation between inattentive and impulsive traits and evaluating the CAARS factor structure in an Israeli sample.
The CAARS-S
The exploratory factor analysis revealed a factor pattern similar to the original one. This means that although almost no restrictions were put on the data, 88% of all items were assigned to their original factors by the factor analysis. Thus, it seems that creating and analyzing the questionnaire in Israel would have yielded very similar results to the ones presented in the original paper.
Inattention and Visual Attention
The current paper assessed the relationship between inattentive traits in typically developing adults, and a measure of visual attention. Nevertheless, this relation is not an obvious one due to the fact that the diagnoses of the predominantly inattentive subtype, as well as the items that load on the inattention factor in the CAARS-S questionnaire, revolve almost entirely around deficits in planning ahead and cognitive organization.
The rationale behind the attempt to relate inattention with visual attention stems from two sources: The first is the literature review that shows that studies that have focused on individuals who are diagnosed as predominantly inattentive have often found specific deficits (and not just a general slowing) on measures of visual attention (Song & Hakoda, 2012; Weiler et al., 2002).
The second source is a much more intuitive one and is derived from experience with children and some adults who are unable to disregard visual or auditory interferences. These are the children who can often be seen staring at various points in the classroom or listening to noises from outside instead of the teacher. We believe that while some of these phenomena are motivational in nature, some stem from the inability or difficulty to focus on the teacher and inhibit other, more salient perceptual stimuli.
In the task employed in the current study, participants were asked to decide whether two composite shapes are identical, and were potentially aided by a prime. A reminder of note is that the trials that were analyzed are the trials in which the two targets were identical, and in which the prime was potentially helpful in comparing the two targets, that is, it was matched to the targets in the amount of elements it was composed of, and in either its global configuration or its local elements. In addition, we analyzed independently conditions in which the prime was similar to the targets in its configuration (global conditions, both “few” and “many” elements separately), and conditions in which the prime was similar to the targets in its local elements (local conditions, both “few” and “many”). In the analyzed trials, since all responses should have been “same” responses, participants could be aided by the prime, which could potentially save effort in processing either the global or local level.
The results show that the primes were indeed helpful, in the sense that in all conditions, the longer the prime was, the shorter the RT on the target. This proves that, in general, participants were able to benefit from the prime on trials in which the prime was helpful.
Second, a specific relation was found between inattentive traits and the reduction in RT as a function of the prime duration in the many-local condition. In other words, in that condition the more inattentive traits, the more reduction in RT on the target per unit of prime duration. We interpret this finding as meaning that people with higher inattention scores needed more help from the prime in the many-local condition, in which they had to process not only the global and more salient aspect of the prime, but also its local and less salient information.
We believe that these findings support the notion that visual attention may play a part in the understanding of deficits in inattention, and that problems in perceptual inhibition may be a core deficit underlying some inattentive symptoms. More research is clearly needed to assess the strength and quality of these deficits.
Impulsivity and Emotion Regulation
Similar to the case of inattention and visual attention, the relation between impulsivity and emotion regulation is not an obvious one either. Impulsivity can be considered the smallest part of the ADHD diagnosis according to the DSM-IV (APA, 1994), since only three impulsivity items are included (as opposed to the six hyperactivity items and the nine inattention items). These items revolve around the inability to refrain from talking or acting out of turn. Nevertheless, the relation between impulsivity and emotion is a much more established one, and is cited in many studies (Anastopoulos et al., 2011; Martel, 2009; Retz et al., 2012; Skirrow et al., 2009; Sobanski et al., 2010) as well as echoed in the factor structure of the CAARS-S. It is our belief that the relation between the diagnostic criteria of impulsivity and emotional dysregulation may arise from the children’s inability to regulate the feeling of urgency they feel when waiting for their turn to speak or play. In addition, it seems that this dysregulation problem is much wider, and encompasses other feelings such as anger, frustration, sadness, and happiness; and as was tested in the current experiment, that of engagement and punishment aversion.
In the current experiment, participants were requested to drive a 2D car while avoiding collisions from the front and behind, and to remember to check their fuel gauge from time to time. The task of avoiding collisions was reported to be highly engaging for children (Kerns & Price, 2001) and was reported to be challenging by our adult participants in a post-experimental informal debriefing.
However, while the regression did show that the tendency to forget refilling the fuel tank was the only significant predictor of the impulsivity score, the relation was opposite in direction to the one predicted, that is, it was found that the higher the impulsivity score was, the smaller the tendency was to forget refueling the car.
Moreover, when examining the regression results further, it is possible to see that impulsivity is negatively related, although not significantly, to the number of fuel checks. Although this relation is not significant, it does show that people with higher impulsivity scores did not check their fuel status more, thus making them simply more efficient players (since they were able to remember refueling more, without having to check their fuel more often). This result is surprising since it has been previously shown that children with ADHD do tend to become more absorbed by the games they play (Pfeifer, Terra, dos Santos, Stagnitti, & Panúncio-Pinto, 2011).
A possible explanation is that since the participants in the study are university students, whether high on impulsivity or not, they are able to perform academic tasks successfully. Since that is the case, although the CAARS-S responses showed a range that was large enough, it is possible that a sampling bias of another type occurred and that only people who are able to cope with their impulsivity symptoms were recruited, thus making them better at disengaging from enjoyable tasks than normal.
The assumption is even more likely when considering the fact that the game was a children’s game with graphics that are fairly simple, making it easier to disengage from. However, although opposite to the predicted direction, the regression result shows a specific relation between an aspect of emotional regulation and a measure of impulsivity traits in adults. We suggest that more research in this direction will prove useful in understanding more about the cognitive mechanisms behind impulsivity symptoms and the hyperactive/impulsive subtype.
Conclusion and Limitations
The current study was able to show a double dissociation between the two ADHD symptom groups from a theoretical and an experimental point of view. It has been found that inattention is specifically related to a measure of visual attention, and that impulsivity is specifically related to a measure of emotion regulation, although in the opposite direction. However, several limitations exist. First, since the relation between impulsivity and emotion regulation was opposite in its direction to the one predicted, the existence of specific deficits in people high on impulsive traits still remains to be found. We believe that by using a task which will be more demanding in regard to the emotional regulation it requires, compensatory strategies will not be sufficient and the predicted relation will emerge. In addition, since the current study included neurotypical university students, the relevance of these finding to a clinical population still remains to be tested.
Despite these limitations, we believe this study to be an important step in our understanding of ADHD. It is important to note that the question of whether there are “pure” ADHD participants of any subtype is an open question. The current study dealt with ADHD symptoms and their cognitive nature, and it is very possible that the disorder will turn out to be a unitary concept in which individuals who are diagnosed tend to present symptoms of all types. The contribution of this study lies with the suggestion that even when considering the cognitive nature of the symptoms in non-“pure” cases, inattention symptoms should be considered, at least in part, in the light of deficits in visual attention, and impulsivity symptoms should be considered, at least in part, in the light of deficits in emotion regulation.
Footnotes
Appendix
An Exploratory Factor Analysis of the CAARS in an Israeli Sample.
| CAARS item | Factor 1 | Factor 2 | Factor 3 | Factor 4 |
|---|---|---|---|---|
| 1. Inattention | ||||
| אני לא מאורגן | .831 | |||
| אני מאבד דברים שאני צריך | .750 | |||
| קשה לי לארגן את המטלות והפעילויות שלי | .745 | .308 | ||
| אני שכחן בפעולות היומיומיות שלי | .739 | |||
| אני שוכח לזכור דברים | .677 | |||
| אני מאבד דברים הדרושים למטלות או פעילויות | .674 | |||
| אני פזור דעת בפעילות יומיומית | .650 | |||
| קשה לי להתחיל משימה | .630 | |||
| קשה לי לשמור על ריכוז כשאני עובד | .617 | |||
| אני תלוי באחרים כדי לשמור על הסדר בחיי | .610 | |||
| איני מצליח להשלים דברים אלא אם יש להם מועד סיום קבוע | .609 | |||
| אני מעריך לא נכון את הזמן שייקח לי לבצע משהו | .572 | |||
| אני לא מתכנן מראש | .533 | |||
| אני עושה שגיאות בגלל חוסר תשומת לב | .517 | |||
| אני משנה תוכניות/עבודה באמצע | .492 | |||
| קשה לי לעקוב אחר מספר דברים בו זמנית | .441 | |||
| אני לא אוהב מטלות לימודיות או עבודות הדורשות חשיבה | .428 | |||
| 2. Hyperactivity | ||||
| אני תמיד בתנועה | .822 | |||
| אני תמיד בתנועה גם כשאני צריך להשאר במקום | .807 | |||
| אני אוהב להיות בתנועה יותר מלהשאר במקום אחד | .792 | |||
| אני תמיד בתנועה כאילו מופעל על ידי מנוע | .736 | |||
| אני לא יכול לשבת בשקט לזמן ממושך | .728 | |||
| אני מחפש פעילויות שהן בקצב מהיר ומרגש | .720 | |||
| קשה לי להשאר במקום אחד לאורך זמן | .704 | |||
| אני חסר מנוחה או פעיל מדי | .686 | |||
| קשה לי להמתין בתור או לפעול לפי התור | .588 | |||
| אני משתעמם בקלות | .582 | |||
| אני אוהב לעסוק בדברים המצריכים פעילות | .407 | |||
| אני לוקח סיכונים או שאני מתגרה בגורל | .405 | |||
| אני לא אוהב פעילויות שקטות הדורשות הסתכלות פנימית | .353 | |||
| 3. Impulsivity | ||||
| אני מעיר הערות שאני מתחרט עליהן | .714 | |||
| אני דורך על יבלות של אחרים בלי להתכוון לכך | .687 | |||
| אני מרגיז אחרים בלי להתכוון לכך | .671 | |||
| ”יש לי מזג חם/”פתיל קצר | .666 | |||
| אני אומר דברים בלי לחשוב | .652 | |||
| עדיין יש לי התפרצויות זעם | .618 | |||
| יש לי פליטות פה | .615 | |||
| אני נותן תשובות לשאלות עוד לפני שסיימו לשאול אותן | .614 | |||
| אני נכנס לדברי אחרים כשהם מדברים | .584 | |||
| אני מתערב בפעילויות של אחרים | .528 | |||
| אני מדבר יותר מדי | .469 | |||
| לפעמים תשומת הלב שלי ממוקדת כל כך שאני לא שם לב לשום דבר אחר; בפעמים אחרות היא רחבה כל כך שכל דבר מסיח אותי | .444 | |||
| 4. Self-concept | ||||
| אני מתנהג בסדר כלפי חוץ אך מבפנים אינני בטוח בעצמי | .778 | |||
| הלוואי והיה לי ביטחון גדול יותר ביכולות שלי | .730 | |||
| אני נהיה מתוסכל בקלות | .304 | .691 | ||
| ”אני “יורד על עצמי | .597 | |||
| כשלונות העבר מקשים עליי להאמין בעצמי | .530 | |||
Note. CAARS = Conner’s Adult ADHD Rating Scales.
Declaration of Conflicting Interests
The author(s) declared no potential conflicts of interest with respect to the research, authorship, and/or publication of this article.
Funding
The author(s) received no financial support for the research, authorship, and/or publication of this article.