



Abstract
ADHD is a chronic developmental disorder with reported prevalence estimates of 5.0% among children (Polanczyk, de Lima, Horta, Biederman, & Rohde, 2007), 4.4% among adults (Kessler et al., 2006), and 2.8% to 4.2% among older adults (Michielsen, Semeijn et al., 2012). Evidence shows that ADHD in children and adults may negatively influence social functioning, such as in maintaining friendships and intimate relationships. In addition, ADHD may also lead to problems in social participation such as poorer functioning at work. Yet, little is known about these associations with older adults with ADHD.
The core symptoms of ADHD, inattention, and hyperactivity/impulsivity may make social functioning and participation difficult. Inattention problems may limit opportunities to acquire social skills through observational learning at young age (Hoza et al., 2005) and may lead to problems at work or in relationships due to forgetfulness and difficulty concentrating on a conversation or tasks. Impulsivity and hyperactivity are associated with unrestrained and overbearing behavior that makes children and adults with ADHD aversive to peers. This is confirmed in studies that showed that children with ADHD appear to have less mutual friendships, are less well liked, and appear to be substantially more rejected by their peers than children without ADHD (Hoza, 2007; Normand, Schneider, & Robaey, 2007). However, one study did not find differences in number of friends and loneliness reported by children with and without ADHD, although parents and teachers rated children with ADHD as significantly lonelier and estimated them as having fewer friends (Heiman, 2005). Studies among adults with ADHD showed that they had greater friendship problems (Young, Toone, & Tyson, 2003) and were lonelier than adults without ADHD (Philipsen et al., 2009). Moreover, the disorder may lead to problems in intimate relationships among adults. Married adults with ADHD report significantly poorer overall marital adjustment (Eakin et al., 2004). In addition, a few studies reported significantly higher rates of separations, divorces, and (re)marriages in adults with ADHD compared with those without ADHD (Biederman et al., 1993; Murphy & Barkley, 1996), although other studies did not find these differences (Das, Cherbuin, Butterworth, Anstey, & Easteal, 2012; Minde et al., 2003; Sobanski et al., 2007). Only very few studies examined ADHD among older adults in relation to their friendships and intimate relationships (Guldberg-Kjär & Johansson, 2009; Henry & Jones, 2011). In a study that assessed childhood ADHD symptoms in older adults (60-85 years; Guldberg-Kjär & Johansson, 2009), married and divorced older adults reported more childhood ADHD symptoms. In another, qualitative study, nine older women who were diagnosed with ADHD after the age of 60 were interviewed about the period in their lives before they were diagnosed (Henry & Jones, 2011). Several women reported that not only in early life they had been rejected by peers but also at present. Three women reported relational problems with their children; two of whom had lost contact with one or more of their children.
ADHD symptoms may also lead to problems in social participation such as in education and at work. Adolescents with ADHD more often drop out of education and are more likely to be expelled from school (LeFever, Villers, Morrow, & Vaughn, 2002). Adults with ADHD may face problems related to diminished educational achievement (Gjervan, Torgersen, Nordahl, & Rasmussen, 2012) or vocational training (Goodman, 2007). However, inconsistent results were found in work problems in adults with ADHD compared with those without ADHD. Adults with ADHD reported higher levels of current unemployment (Biederman & Faraone, 2006; Halmøy, Fasmer, Gillberg, & Haavik, 2009; Young et al., 2003), more often different employers in the past 5 years, and lower income than adults without ADHD (Able, Johnston, Adler, & Swindle, 2007). However, other studies did not find statistically significant differences in unemployment (Sobanski et al., 2007) and differences in level of income (Fayyad et al., 2007; Kessler et al., 2006) between adults with and without ADHD. In addition, no differences in socioeconomic status and education level between older adults with high and low levels of childhood ADHD symptoms were observed (Guldberg-Kjär & Johansson, 2009).
In conclusion, children and adults with ADHD may experience problems in social functioning (intimate and social relationships) and social participation (education and work) due to inattention and impulsivity, yet inconsistent results were found and very few studies have focused on older adults with ADHD and their social functioning and participation. Therefore, the aim of this study is to examine the association between ADHD in older adults in the Dutch population with social functioning and participation.
Method
Study Sample
Data for the present study were collected in the Longitudinal Aging Study Amsterdam (LASA), an ongoing study of changes in autonomy and well-being with aging in the Netherlands. LASA focuses on physical, emotional, cognitive, and social functioning in older adults. The multidisciplinary approach and the large sample of the older general Dutch population make it a very suitable study to examine ADHD and social functioning in older adults. Full details on sampling are described elsewhere (Huisman et al., 2011). In summary, a random sample of older men and women (55-85 years), stratified by age and sex, was drawn from the population registries of 11 municipalities in 3 geographic areas of the Netherlands. Data collection started in 1992/1993 (N = 3,107) with respondents born in 1908-1937. Further follow-ups were carried out every 3 years since then. In 2002-2003, a new cohort was sampled (birth years 1938-1947, N = 1,002) with the same sampling frame as the earlier cohort. Both samples were combined and follow-up was carried out every 3 years. Every wave consists of two parts, a main and a medical interview, in which tests were performed and structured questionnaires were administered. In the present study, data were used from the follow-up wave 2008/2009.
The ADHD side study started in 2008/2009. In the 2008/2009 wave of LASA, an ADHD screening list (Barkley, Murphy, & Fischer, 2007) was part of the medical interview (N = 1,494). To limit the number of diagnostic interviews, a two-phase nonproportional stratified random sampling procedure was used. On the basis of the results of a screener (Phase 1), the sample was divided into tertiles with low (Group1), intermediate (Group 2), and high a priori likelihood of ADHD (Group 3). These tertiles were randomly, but non-proportionally sampled for respondents who were approached for the diagnostic interview (Phase 2). In Phase 2, all the participants in Group 3, and random samples of the participants in Groups 1 and 2 (n = 271) were approached for a diagnostic interview. In total, 85 respondents of Group 1 (90%), 80 of Group 2 (86%), and 69 of Group 3 (82.3%) consented to be interviewed. Three respondents were excluded from statistical analyses due to too many missing values on the diagnostic interview, a cerebral vascular accident, and not being able to recollect childhood conditions (see Figure 1). Thus, the total study sample that was also used for the analysis consisted in total of 231 older adults. Full details of the ADHD side study on sampling, measurements, and nonresponse are described elsewhere (Michielsen, Semeijn, et al., 2012). All interviews were also conducted in the homes of respondents by specially trained and closely supervised interviewers. All interviews were tape-recorded to check the quality of the data. Informed consent was obtained from all participants, and approval of the Ethical Review Board of the VU University Medical Center (VUmc) was obtained.
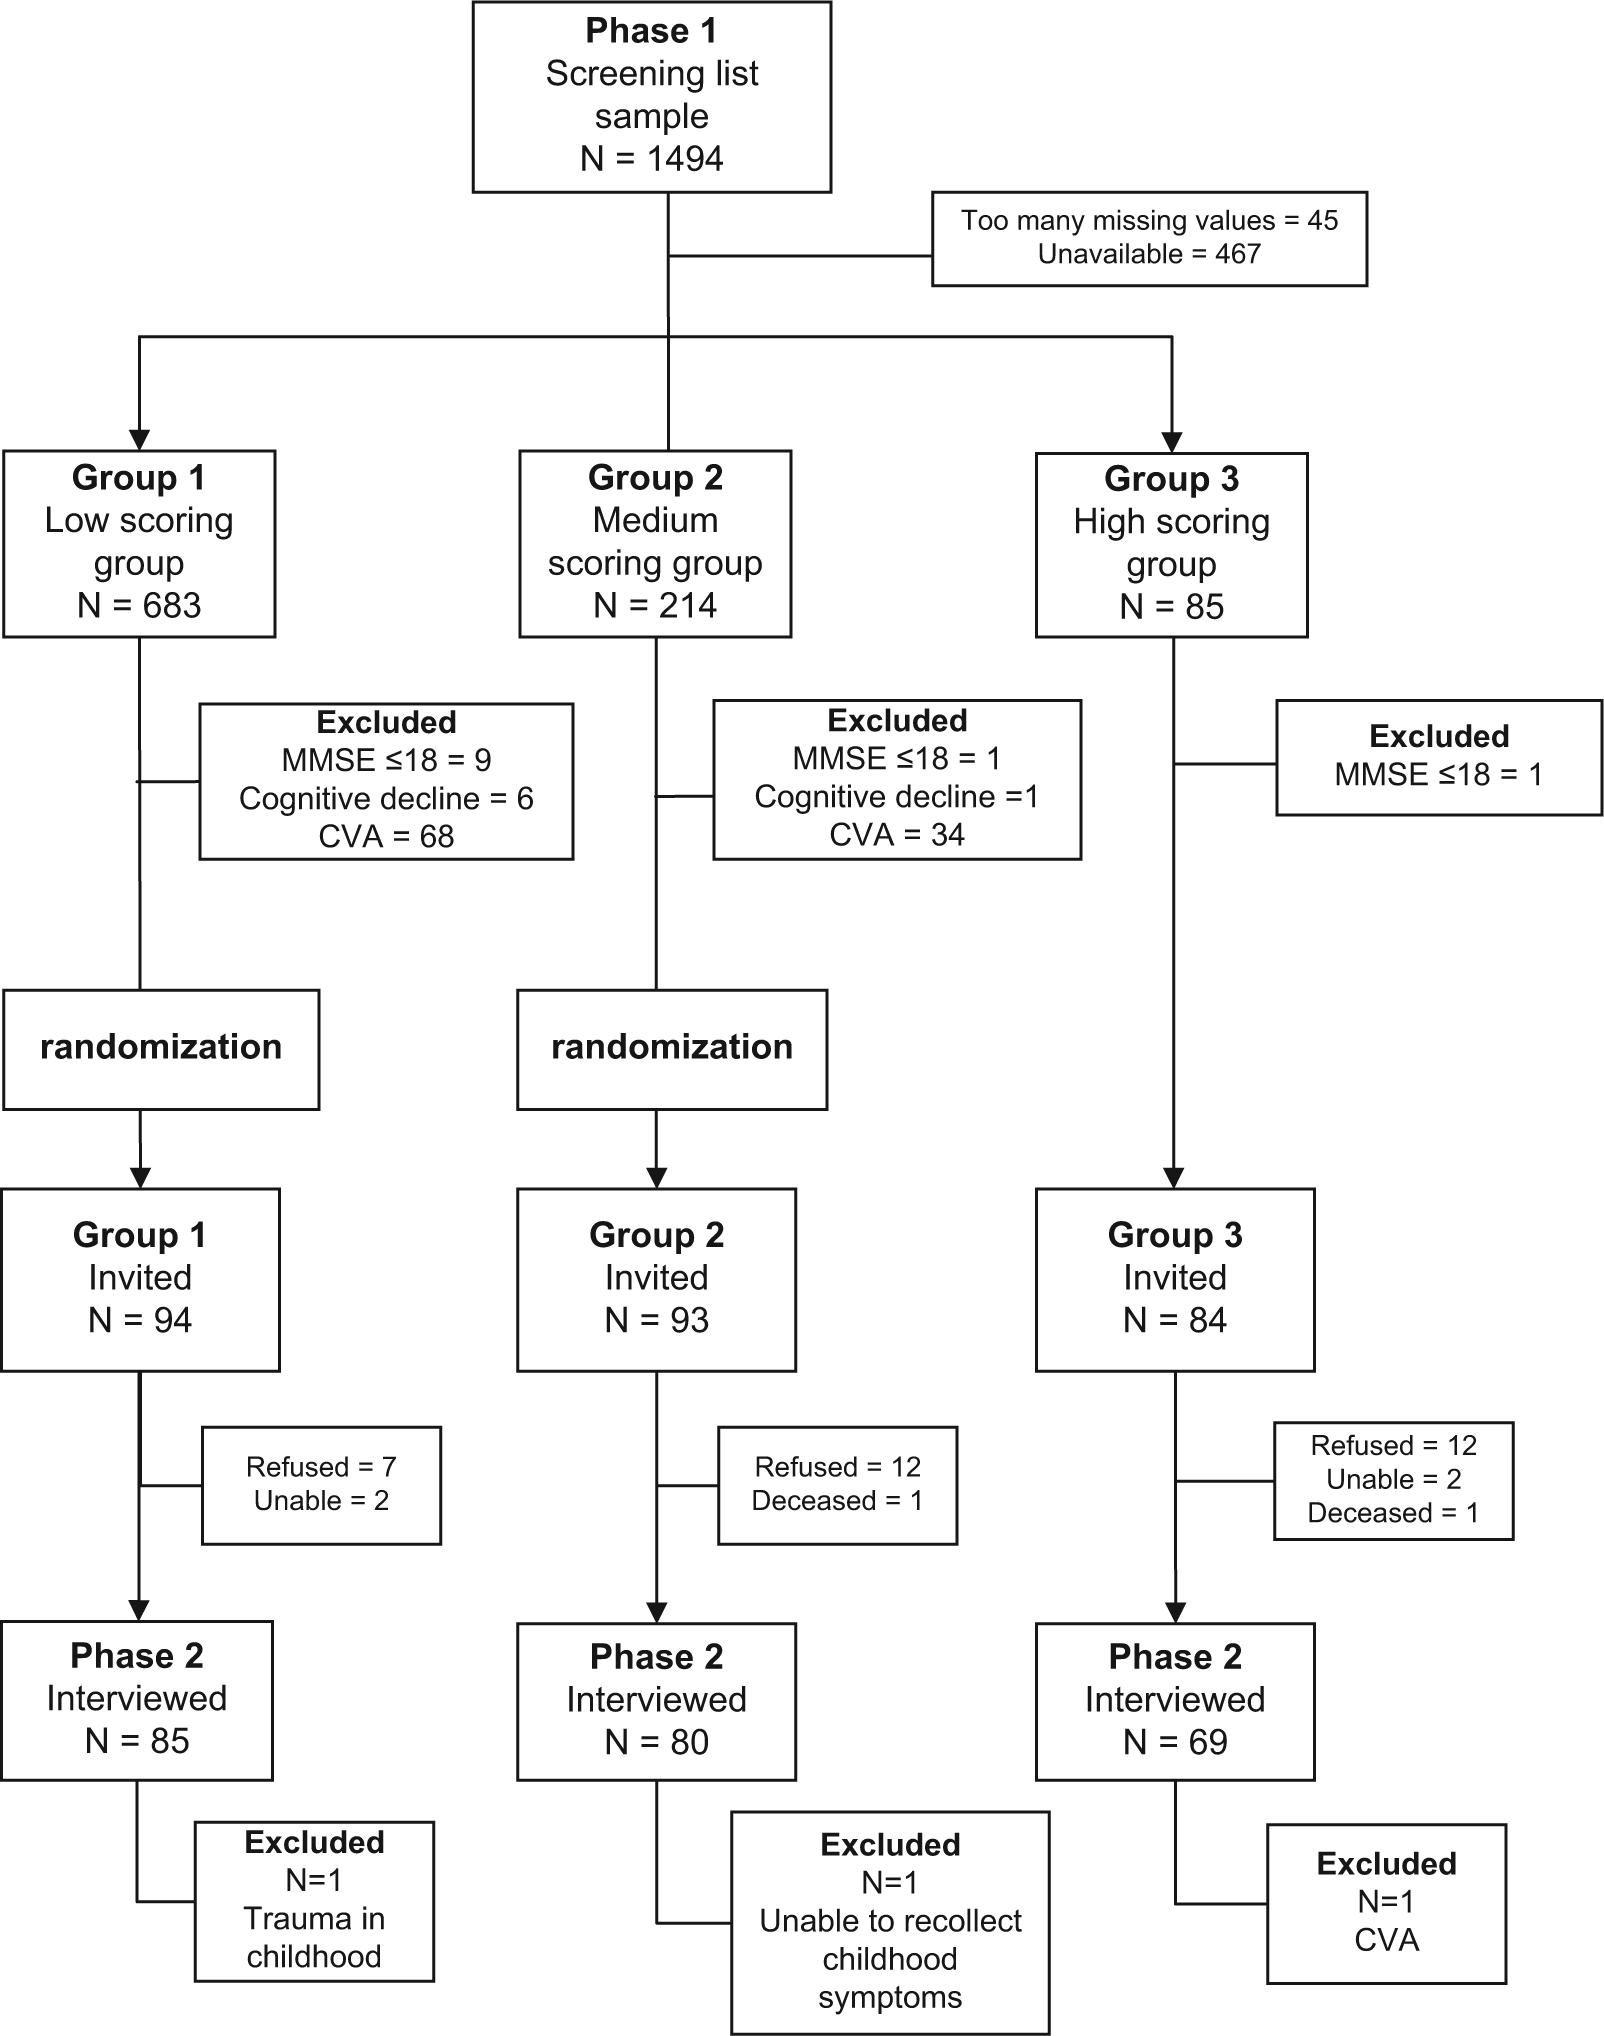
Flowchart of screening and diagnostic interview phases.
Measures
ADHD in older adults was measured by means of ADHD diagnosis and level of ADHD symptoms.
ADHD diagnosis
To diagnose ADHD, the Diagnostic Interview for ADHD in Adults, second edition, (Diagnostisch Interview Voor ADHD bij volwassenen, DIVA 2.0) was used (Kooij, 2010). This semistructured interview consists of two parts: one to assess the presence of all 18 Diagnostic and Statistical Manual of Mental Disorders (4th ed., text rev.; DSM-IV-TR; American Psychiatric Association [APA], 2000) criteria in childhood (primary school, ages 6-12 years) and at present; the other to assess impairment in five areas of functioning (work, education, family, social/relationships, and self-confidence) in childhood and at present, related to the ADHD symptoms.
For the ADHD diagnosis, it was required to have four or more symptoms of either inattention and/or hyperactivity-impulsivity during the 6 months prior to the interview. This cut-off point has been suggested for diagnosing adult ADHD (Barkley et al., 2007; Kooij et al., 2005). In addition, it was required to have six symptoms of either inattention and/or hyperactivity-impulsivity in childhood (DSM-IV [APA, 1994] criterion A). It was also required to have clinically significant impairment in at least two areas of daily life during the past 6 months prior to the interview and in childhood (Criteria C and D). Interviewers were adequately trained to evaluate the answers to the questions of the structured interview. The interviewers received 8 hr of training and practiced one interview before the study. The authors (MM and EJS) intensively supervised all interviews, and questions were discussed with an experienced psychiatrist (JJSK).
ADHD symptoms
For the total number of ADHD symptoms, the sum score of all the ADHD symptoms at the present time and childhood was calculated. The score ranged from 0 to 36, where higher scores indicated more ADHD symptoms.
Outcome Measures
Outcome measures were divided in social functioning and in social participation. Social functioning includes the following outcome measures: total social network size, partial networks, first confidants (i.e., the most important confidant of the respondent), support exchanges, marital status, and loneliness. Social participation includes informal and formal social participation, (former) work participation, and educational and income level. Because attained educational and income level can be seen as a reflection of educational and work participation in the past, both were added as outcome measures. All outcome measures are described in more detail below.
Social functioning
Marital status
Two categories for marital status were distinguished: married/widowhood versus divorced/never married. Because widowhood is an involuntary separation, it was combined with marriage.
The total social network size was defined as the total number of network members with whom the respondent had important and regular contact (van Tilburg, 1998). Network members of 18 years and older in seven domains (household members, children, other kin, neighbors, contacts through work and school, members of organizations, and others) were identified by name.
Partial networks were identified by the type of network member, that is, child (including stepchildren), child-in-law, sibling, sibling-in-law, other relative (e.g., parent, grandchild, aunt, uncle, nephew, niece), friend, neighbor, or other nonrelative (e.g., acquaintance, a colleague, or fellow member of an organization) of the respondent. The sum of the partial network sizes equals the total network size. The partial networks were categorized in family (children, children-in-law, sibling, sibling-in-law, and other relatives) and friends (friend, neighbor, or other nonrelative). The mean number of family and friends seen on a weekly basis was aggregated for each respondent. Respondents were asked which of all the identified network members they were most likely to confide in. Not more than nine network members could be labeled as a confidant, ranging from most important confidant (first confidant) to lesser important confidant (ninth confident). Weekly contact of the first confidant was calculated. The first confidants were also categorized in family and friends network members, partners were excluded.
Questions about support exchanges were asked about the 10 most important network members (or less, if fewer members were identified) with whom contact was most frequent. Support exchange was divided into four areas: (a) instrumental support given, (b) instrumental support received, (c) emotional support given, and (d) emotional support received (Penninx et al., 1999). The instrumental support given and received was measured by asking how often it had occurred in the previous year that the respondent gave and received help with daily chores in and around the house, such as preparing meals, cleaning the house, transportation, and small repairs. For measuring emotional support given and received, it was asked how often it was in the previous year that the respondent told his or her network member about personal experiences and feelings, and vice versa. Response categories and values were never (0), rarely (1), sometimes (2), and often (3). For all the “instrumental support” and “emotional support” questions, the mean of the support given (or received) from the relationships (or less, if fewer members were identified) was computed, ranging from zero (no or never supportive relationships) to three (all relationships often supportive).
Loneliness was measured with the de Jong Gierveld loneliness scale (de Jong-Gierveld & Kamphuls, 1985), ranging from 0 (not lonely) to 11 (extremely lonely). Loneliness can be differentiated between emotional loneliness stemming from the absence of an intimate relationship or a close emotional attachment (e.g., partner or best friend), and social loneliness, stemming from the absence of a broader group of contacts or an engaging social network (e.g., friends, people in the neighborhood; Gierveld & Tilburg, 2006). The scale consists of six items covering aspects of emotional loneliness and five items assessing social loneliness.
Social participation
Social participation can be divided in formal and informal participation. Formal social participation refers to participation in community organizations. In this study, we have concentrated on the visits of the respondents to (Broese van Groenou & Deeg, 2010) community organizations. A social involvement variable consisted of the sum score of all the organizations respondents visited (e.g., church, sports club, hobby club; range 0-13). Informal social participation refers to participation more based on personal development and well-being. Seven questions concerning recreational participation were presented (visiting museum/theater, social cultural center, zoo/amusement parks, pubs/restaurants, outdoor sporting events, sporting competition, shopping for pleasure), and respondents were asked to rate the frequency of attendance on a seven-point scale (1 = almost never, 2 = a few times a year, 3 = every month, 4 = a few times a month, 5 = every week, 6 = a few times a week, and 7 = every day). A sum score of recreational participation (range 0-7, low-high) was calculated. Every question that was answered with a frequency of at least monthly was rated “1,” meaning that they were recreational participant in this field. Shopping for pleasure was an exception; respondents had to go shopping at least once a week to be counted as a recreational participant.
The level of education was measured in years of education attained. Because the majority of respondents do not work (anymore), the occupational prestige of present or previous job was combined into one variable. Occupational prestige was determined by assigning a prestige scale developed by Sixma and Ultee (Sixma & Ultee, 1984). They determined this scale by asking Dutch individuals what level of prestige they think certain jobs have in society. Observed scores ranged from 13 (low; garbage collector) to 78 (high; surgeon). Previous and present job occupational skill levels were combined into one variable. The occupation performed by a respondent was coded according to the standard classification of occupation (SBC92; Standaard Beroepen Classifcatie) from Statistics Netherlands (CBS). The occupational level was derived from the SBC92 and was categorized in low (elementary and low skills), medium (medium skills), and high levels (high and scientific skills). The occupational level is determined by the Statistics Netherlands according to the level of the required skills (i.e., elementary of scientific education), which was based on the necessary level of education, trial period, and work experience.
For income, the monthly net household income was used. When data on income was missing, the income was imputed with the income of the previous measurement wave. Three categories (tertiles), in Euros, were distinguished: low (less than €1,350), medium (between €1,350 and less than €1,929), and high (greater or equal to €1,929). For participants with a partner living in the household, household income was multiplied by 0.7 to make it comparable with the incomes in a one-person household (Koster et al., 2006).
Covariates
Because older adults with ADHD are significantly younger than the older adults without ADHD in the sample, age was included as a confounder in the analyses. Depressive symptoms have been shown in an earlier study to be associated with ADHD in older adults (Michielsen, Comijs, et al., 2012). In addition, depressive symptoms are also highly correlated with loneliness, network size, and socio-economic status variables in this study. Therefore, associations between ADHD and outcomes measures were also adjusted for depressive symptoms. Depressive symptoms were measured with the Center for Epidemiologic Studies Depressive Scale (CES-D; Radloff, 1977). The CES-D is a self-report scale and consists of 20 items covering depressive symptomatology experienced in the past week. Each answer is rated on a four-point scale ranging from 0 = rarely or never to 3 = mostly or always. The total score of the 20 items ranges from 0 to 60, higher scores indicating more depressive symptoms.
Statistical Analysis
Differences in the characteristics of the respondents according to diagnostic status were examined with independent samples t-test for normally distributed or Mann–Whitney test for abnormally distributed continuous variables and chi-squared tests or Fisher’s exact tests for categorical variables.
Network size, number of family members, number of friends in network and family and friend network members seen weekly were all transformed with the natural logarithm (ln(1+networksize)) to obtain a near-normal distribution. Linear regression analyses were performed to assess the association between ADHD diagnosis and level of ADHD symptoms (independent variables) and continuous social characteristics variables as dependent variables. Logistic regression analyses were performed to assess the association between ADHD diagnosis and ADHD symptoms and dichotomous social outcome variables. Multinomial logistic regression analyses were performed to assess the association between ADHD diagnosis and ADHD symptoms and social outcome variables with more than two categories. Due to low numbers, in the logistic analyses assessing the association between ADHD diagnosis and job at present, occupational skill level, income, and marital status, only the associations adjusted for age were analyzed. In all other regression analyses age was added in the first model as covariate, level of depressive symptoms was added in the second model. A p value of < .05 was considered statistically significant. Data were analyzed using IBM SPSS Statistics 20.
Results
Descriptive statistics of the sample are presented in Table 1. Of the 231 respondents, 23 were diagnosed with ADHD. The total study sample consisted of 137 female (59%) and 94 male participants (41%). The average age was 71 years (SD = 7.7, range 60-94, not tabulated).
Descriptive Characteristics of Sample.
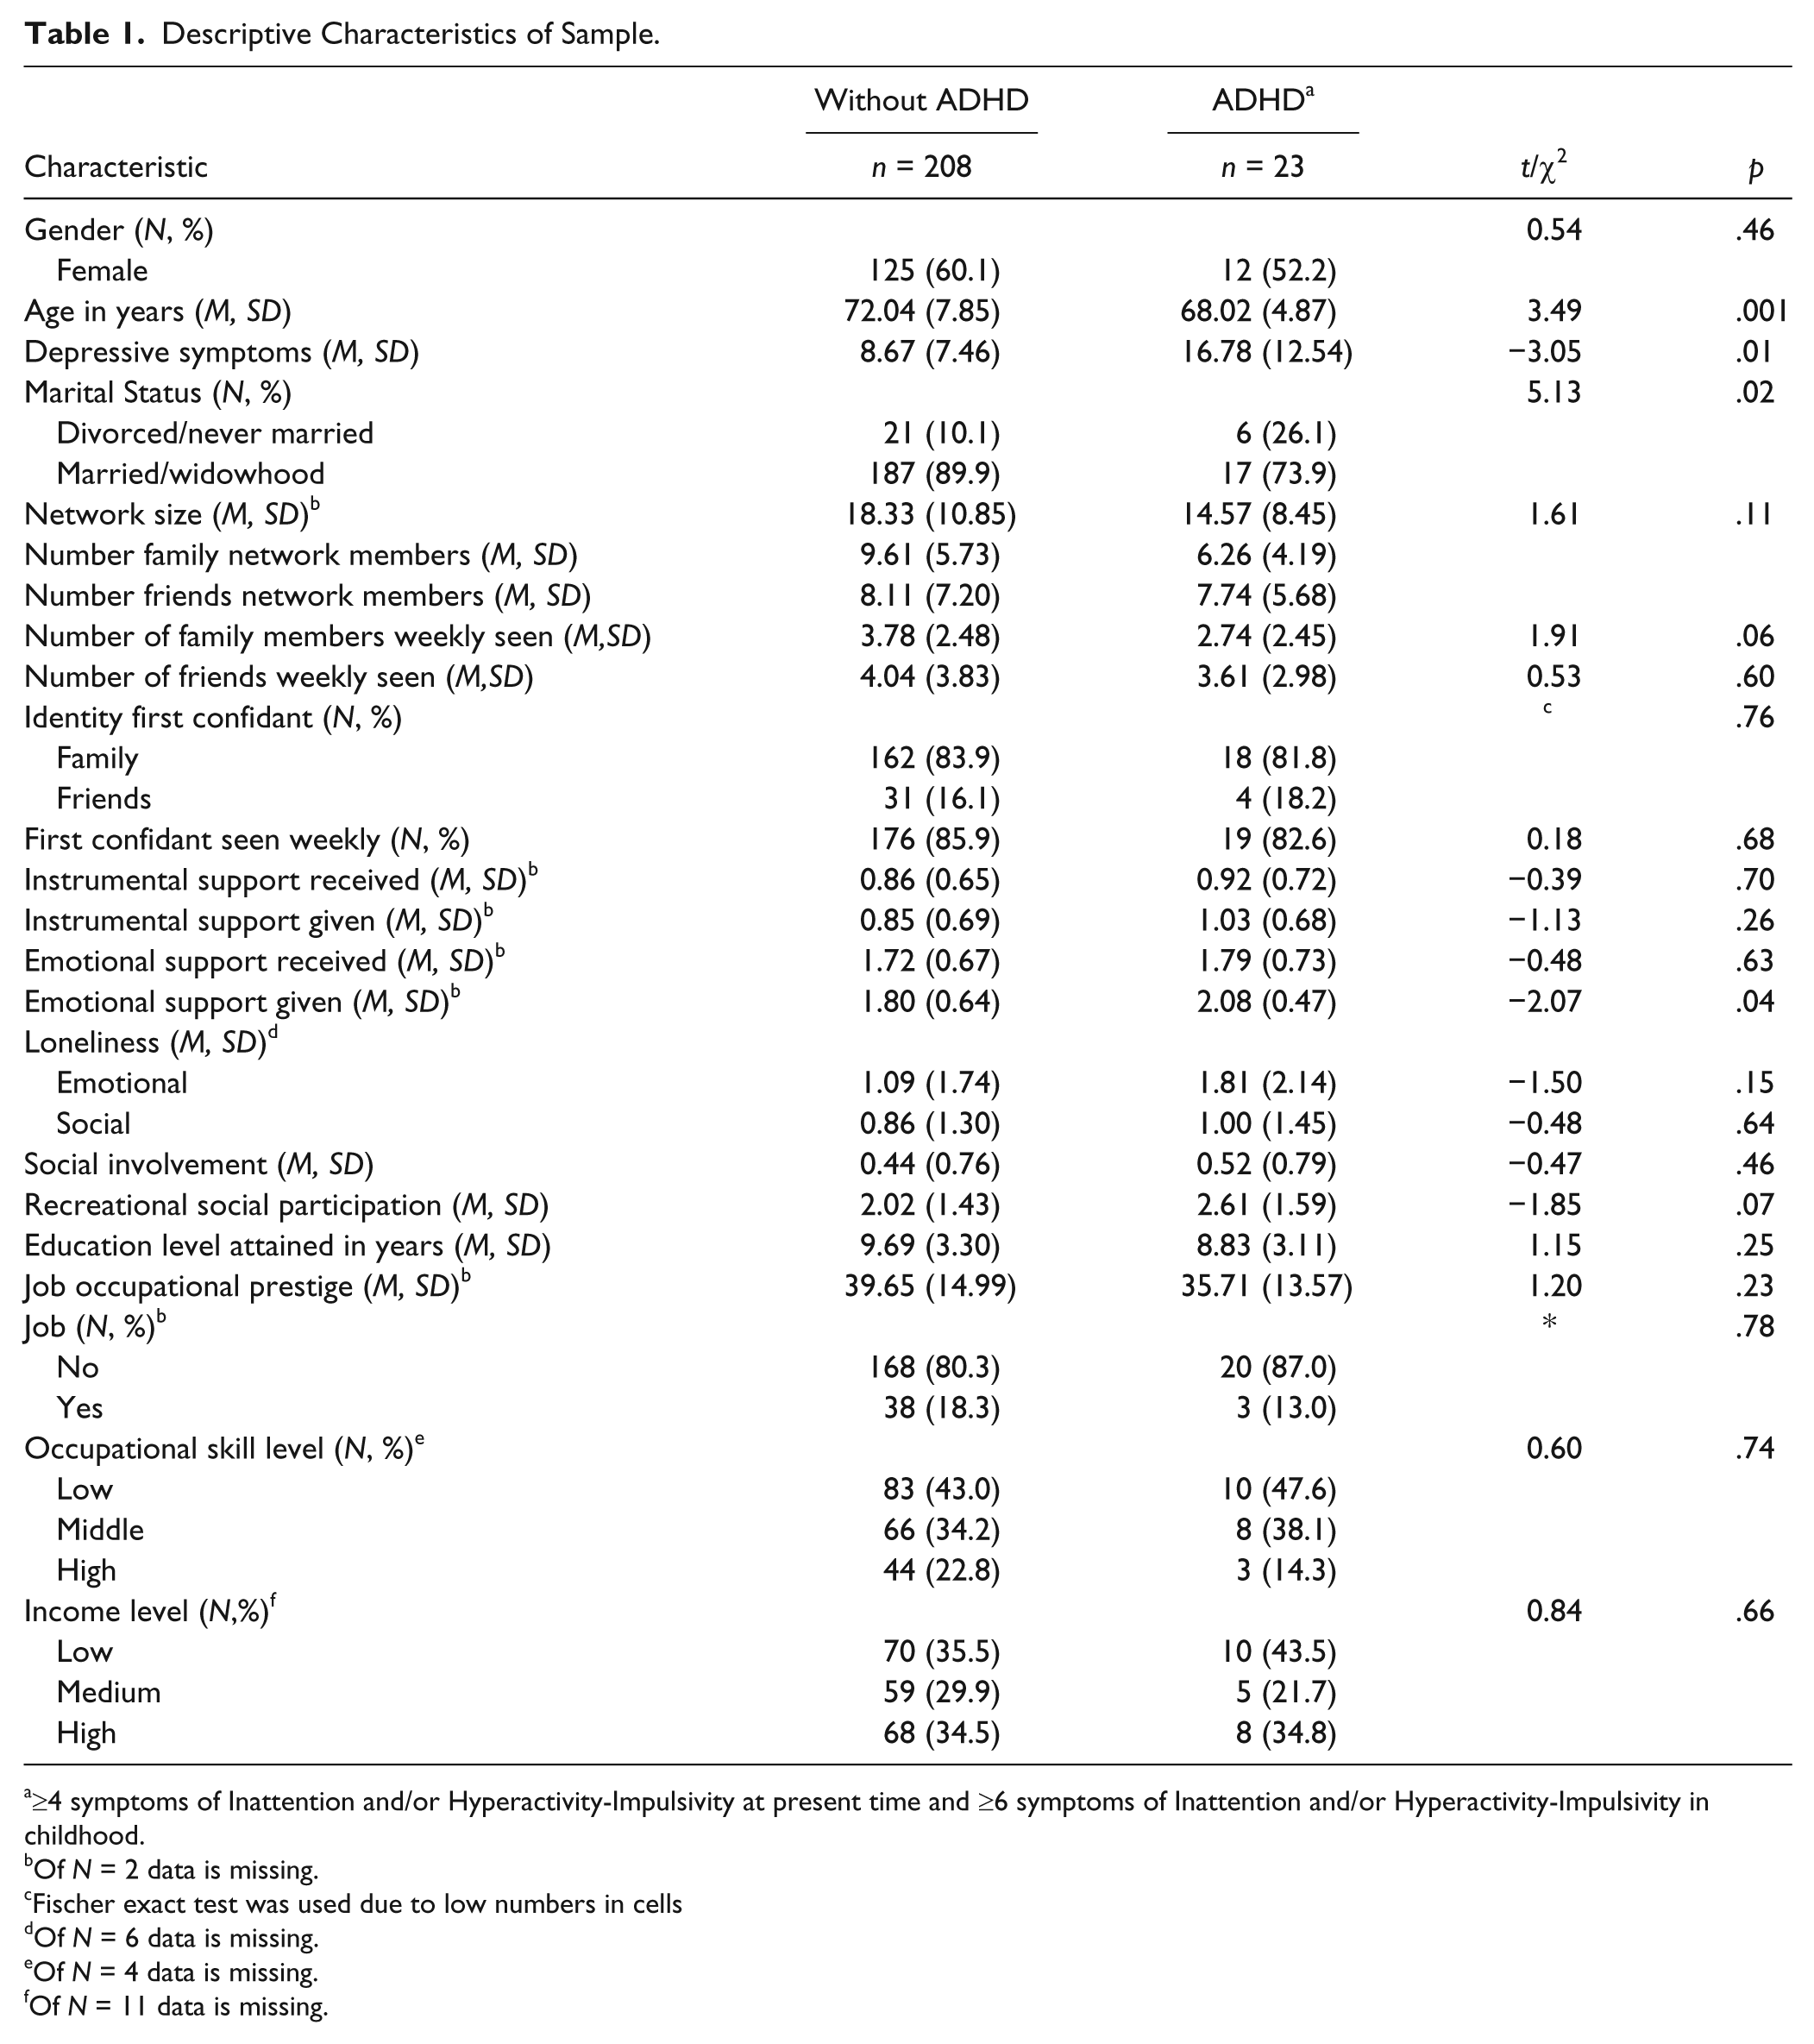
≥4 symptoms of Inattention and/or Hyperactivity-Impulsivity at present time and ≥6 symptoms of Inattention and/or Hyperactivity-Impulsivity in childhood.
Of N = 2 data is missing.
Fischer exact test was used due to low numbers in cells
Of N = 6 data is missing.
Of N = 4 data is missing.
Of N = 11 data is missing.
The results in Table 1 show that compared with the respondents without ADHD, those with ADHD were significantly younger, reported more depressive symptoms, reported higher levels of emotional support given, and had fewer family members in their network. Regarding marital status, older adults with ADHD were less often married (52.2% vs. 63.4%), less often widowed (21.7% vs. 25.5%), more often divorced (17.4% vs. 8.2), and more often never married (8.7% vs. 2.9%) compared with older adults without ADHD (not tabulated), but due to low cell counts, the significant difference in these four marital statuses between older adults with and without ADHD could not be calculated.
Table 2 shows the association between ADHD diagnosis and social functioning and participation. Two models are shown. The first model shows the association adjusted for age, the second the association adjusted for age and depressive symptoms. Because emotional loneliness was highly correlated with depressive symptoms (r = .54), the association between ADHD and emotional loneliness was not corrected for depressive symptoms.
Associations Between ADHD Diagnosis and Social Characteristics (Outcome Measures).
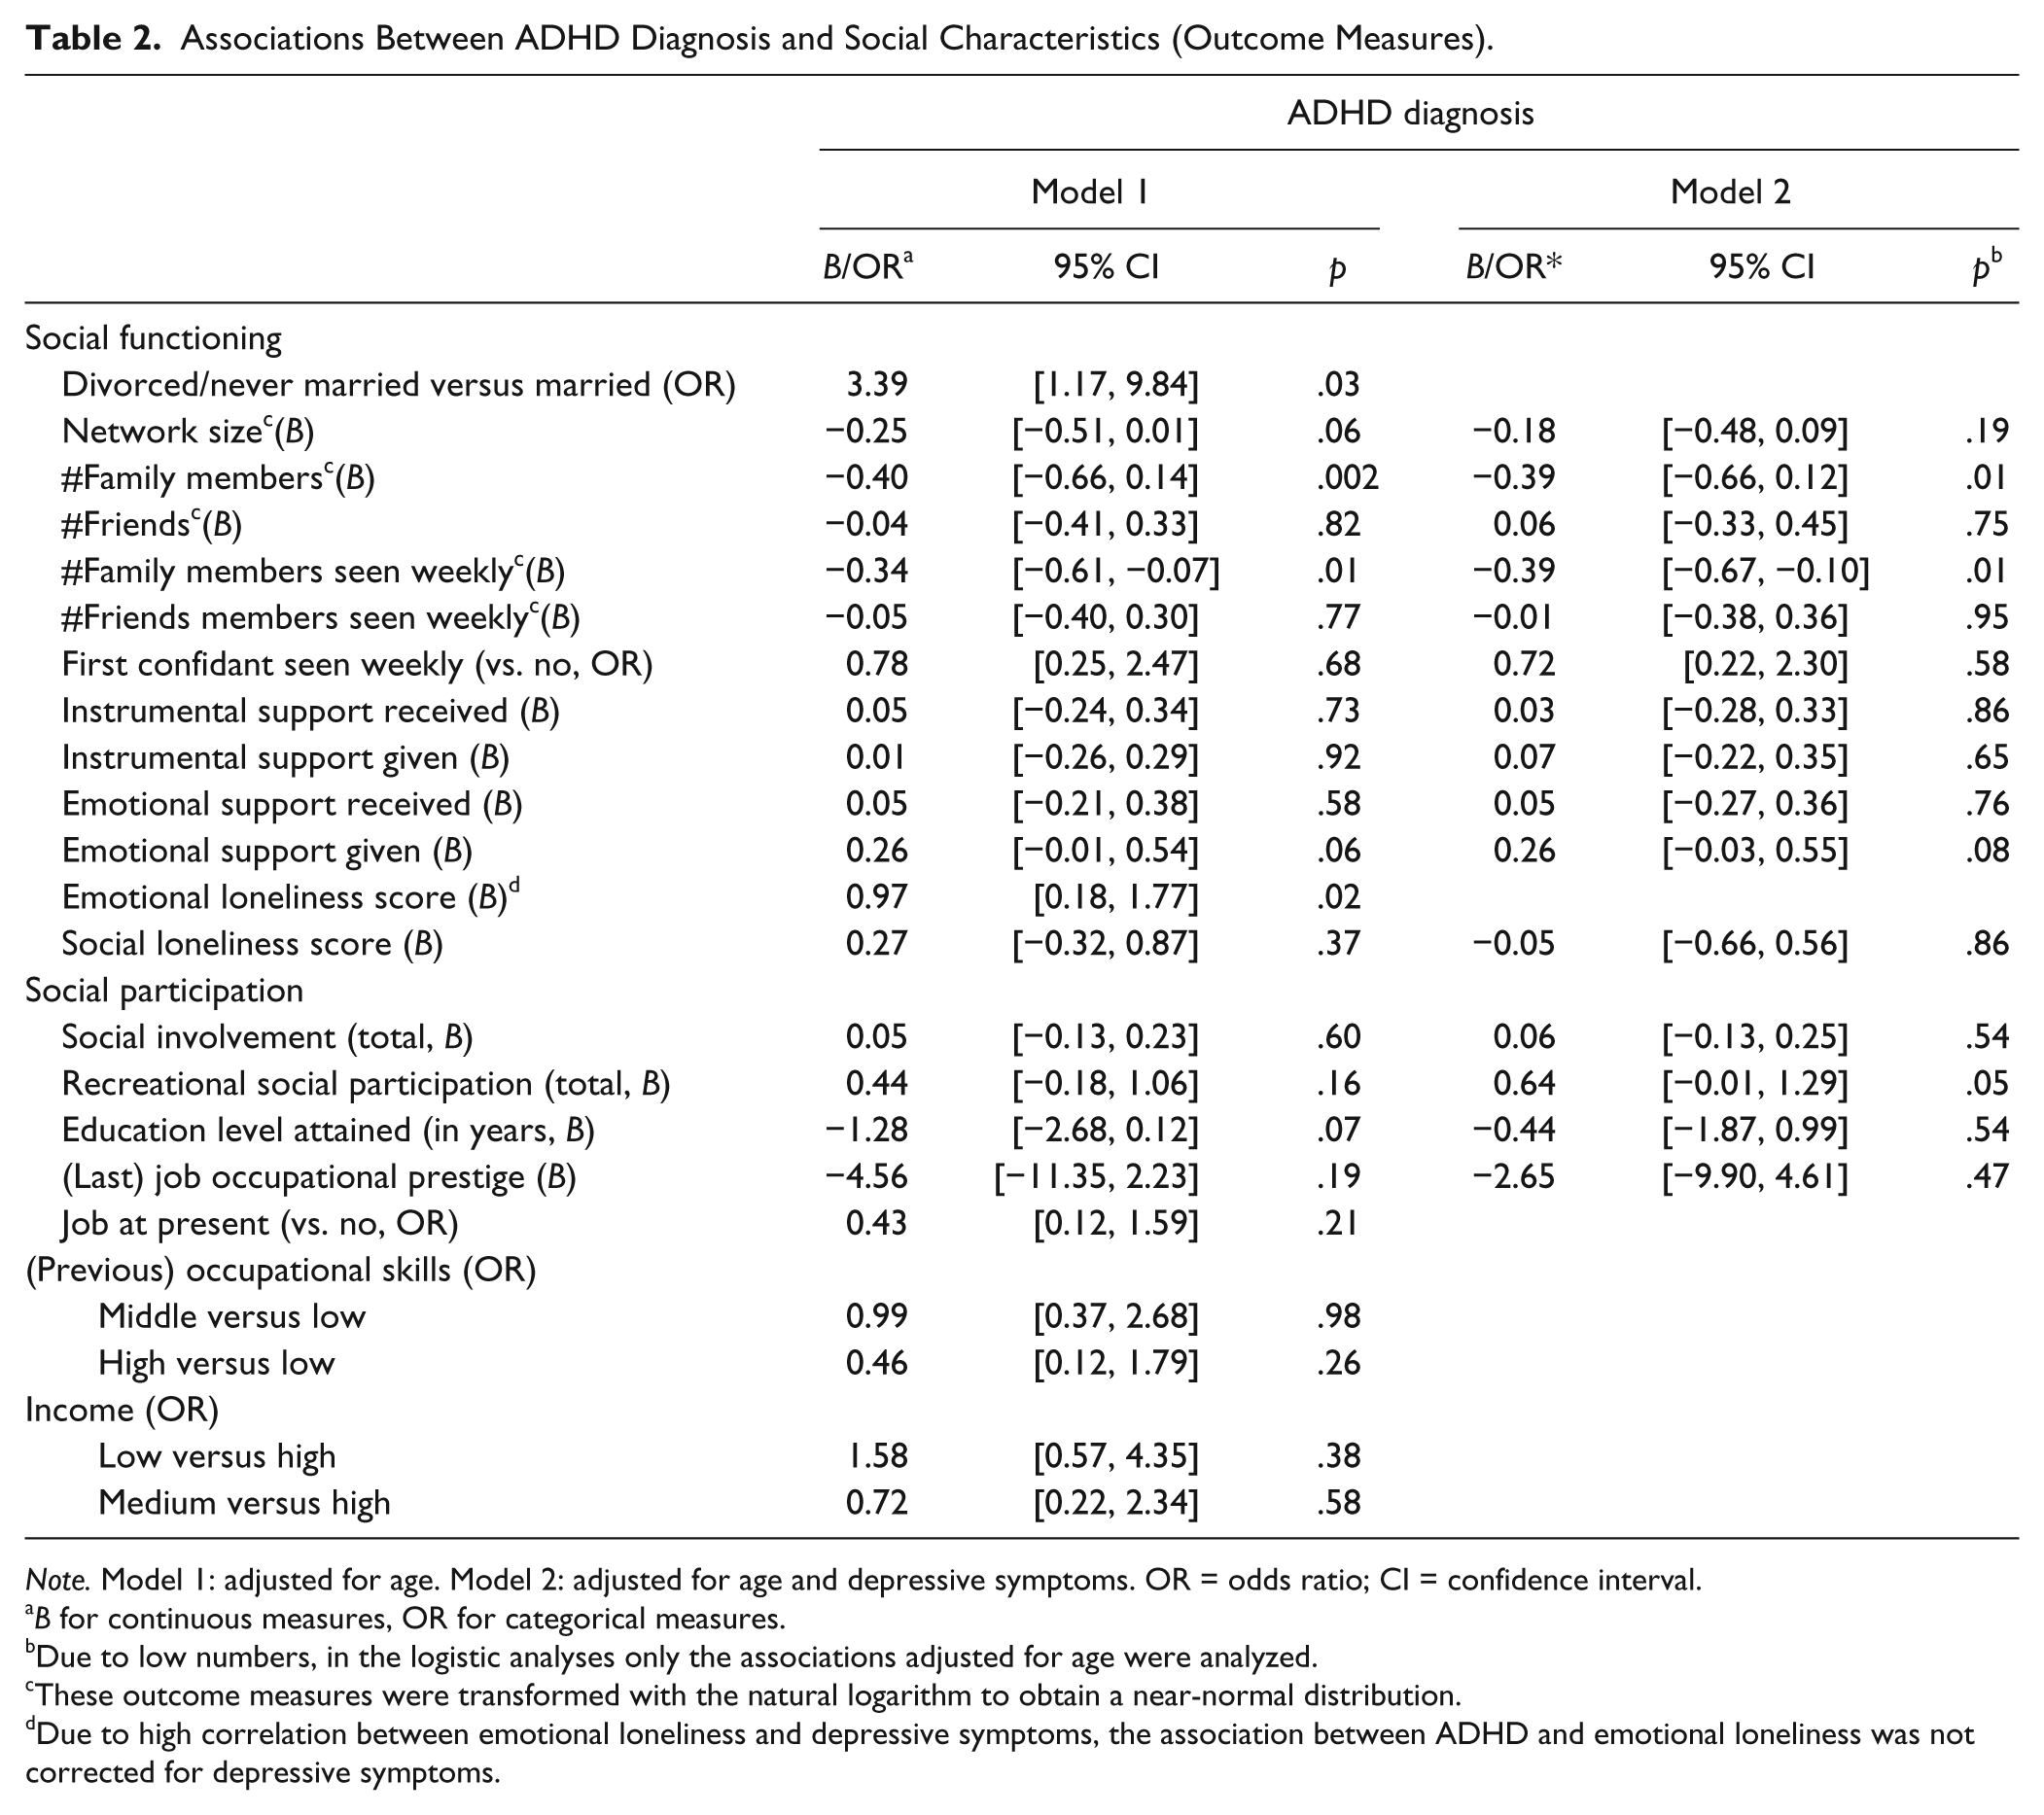
Note. Model 1: adjusted for age. Model 2: adjusted for age and depressive symptoms. OR = odds ratio; CI = confidence interval.
B for continuous measures, OR for categorical measures.
Due to low numbers, in the logistic analyses only the associations adjusted for age were analyzed.
These outcome measures were transformed with the natural logarithm to obtain a near-normal distribution.
Due to high correlation between emotional loneliness and depressive symptoms, the association between ADHD and emotional loneliness was not corrected for depressive symptoms.
The results from the logistic analyses show that after adjustment of age, ADHD was associated with being divorced/never married. The results from linear regression analyses show that ADHD diagnosis, when adjusted for age, was significantly associated with fewer family members in the social network, a lower number of family members seen weekly, and a higher level of emotional loneliness. After additional adjustment for depressive symptoms, only the associations of having fewer family members in the network and lower number of family members seen weekly stayed significant; the association with participation in more recreational activities became borderline significant.
Table 3 shows the associations between level of ADHD symptoms and social functioning and participation. The logistic analyses did not show any significant associations between higher levels of ADHD symptoms and the other social outcome variables.
Associations Between ADHD Symptoms and Social Characteristics.
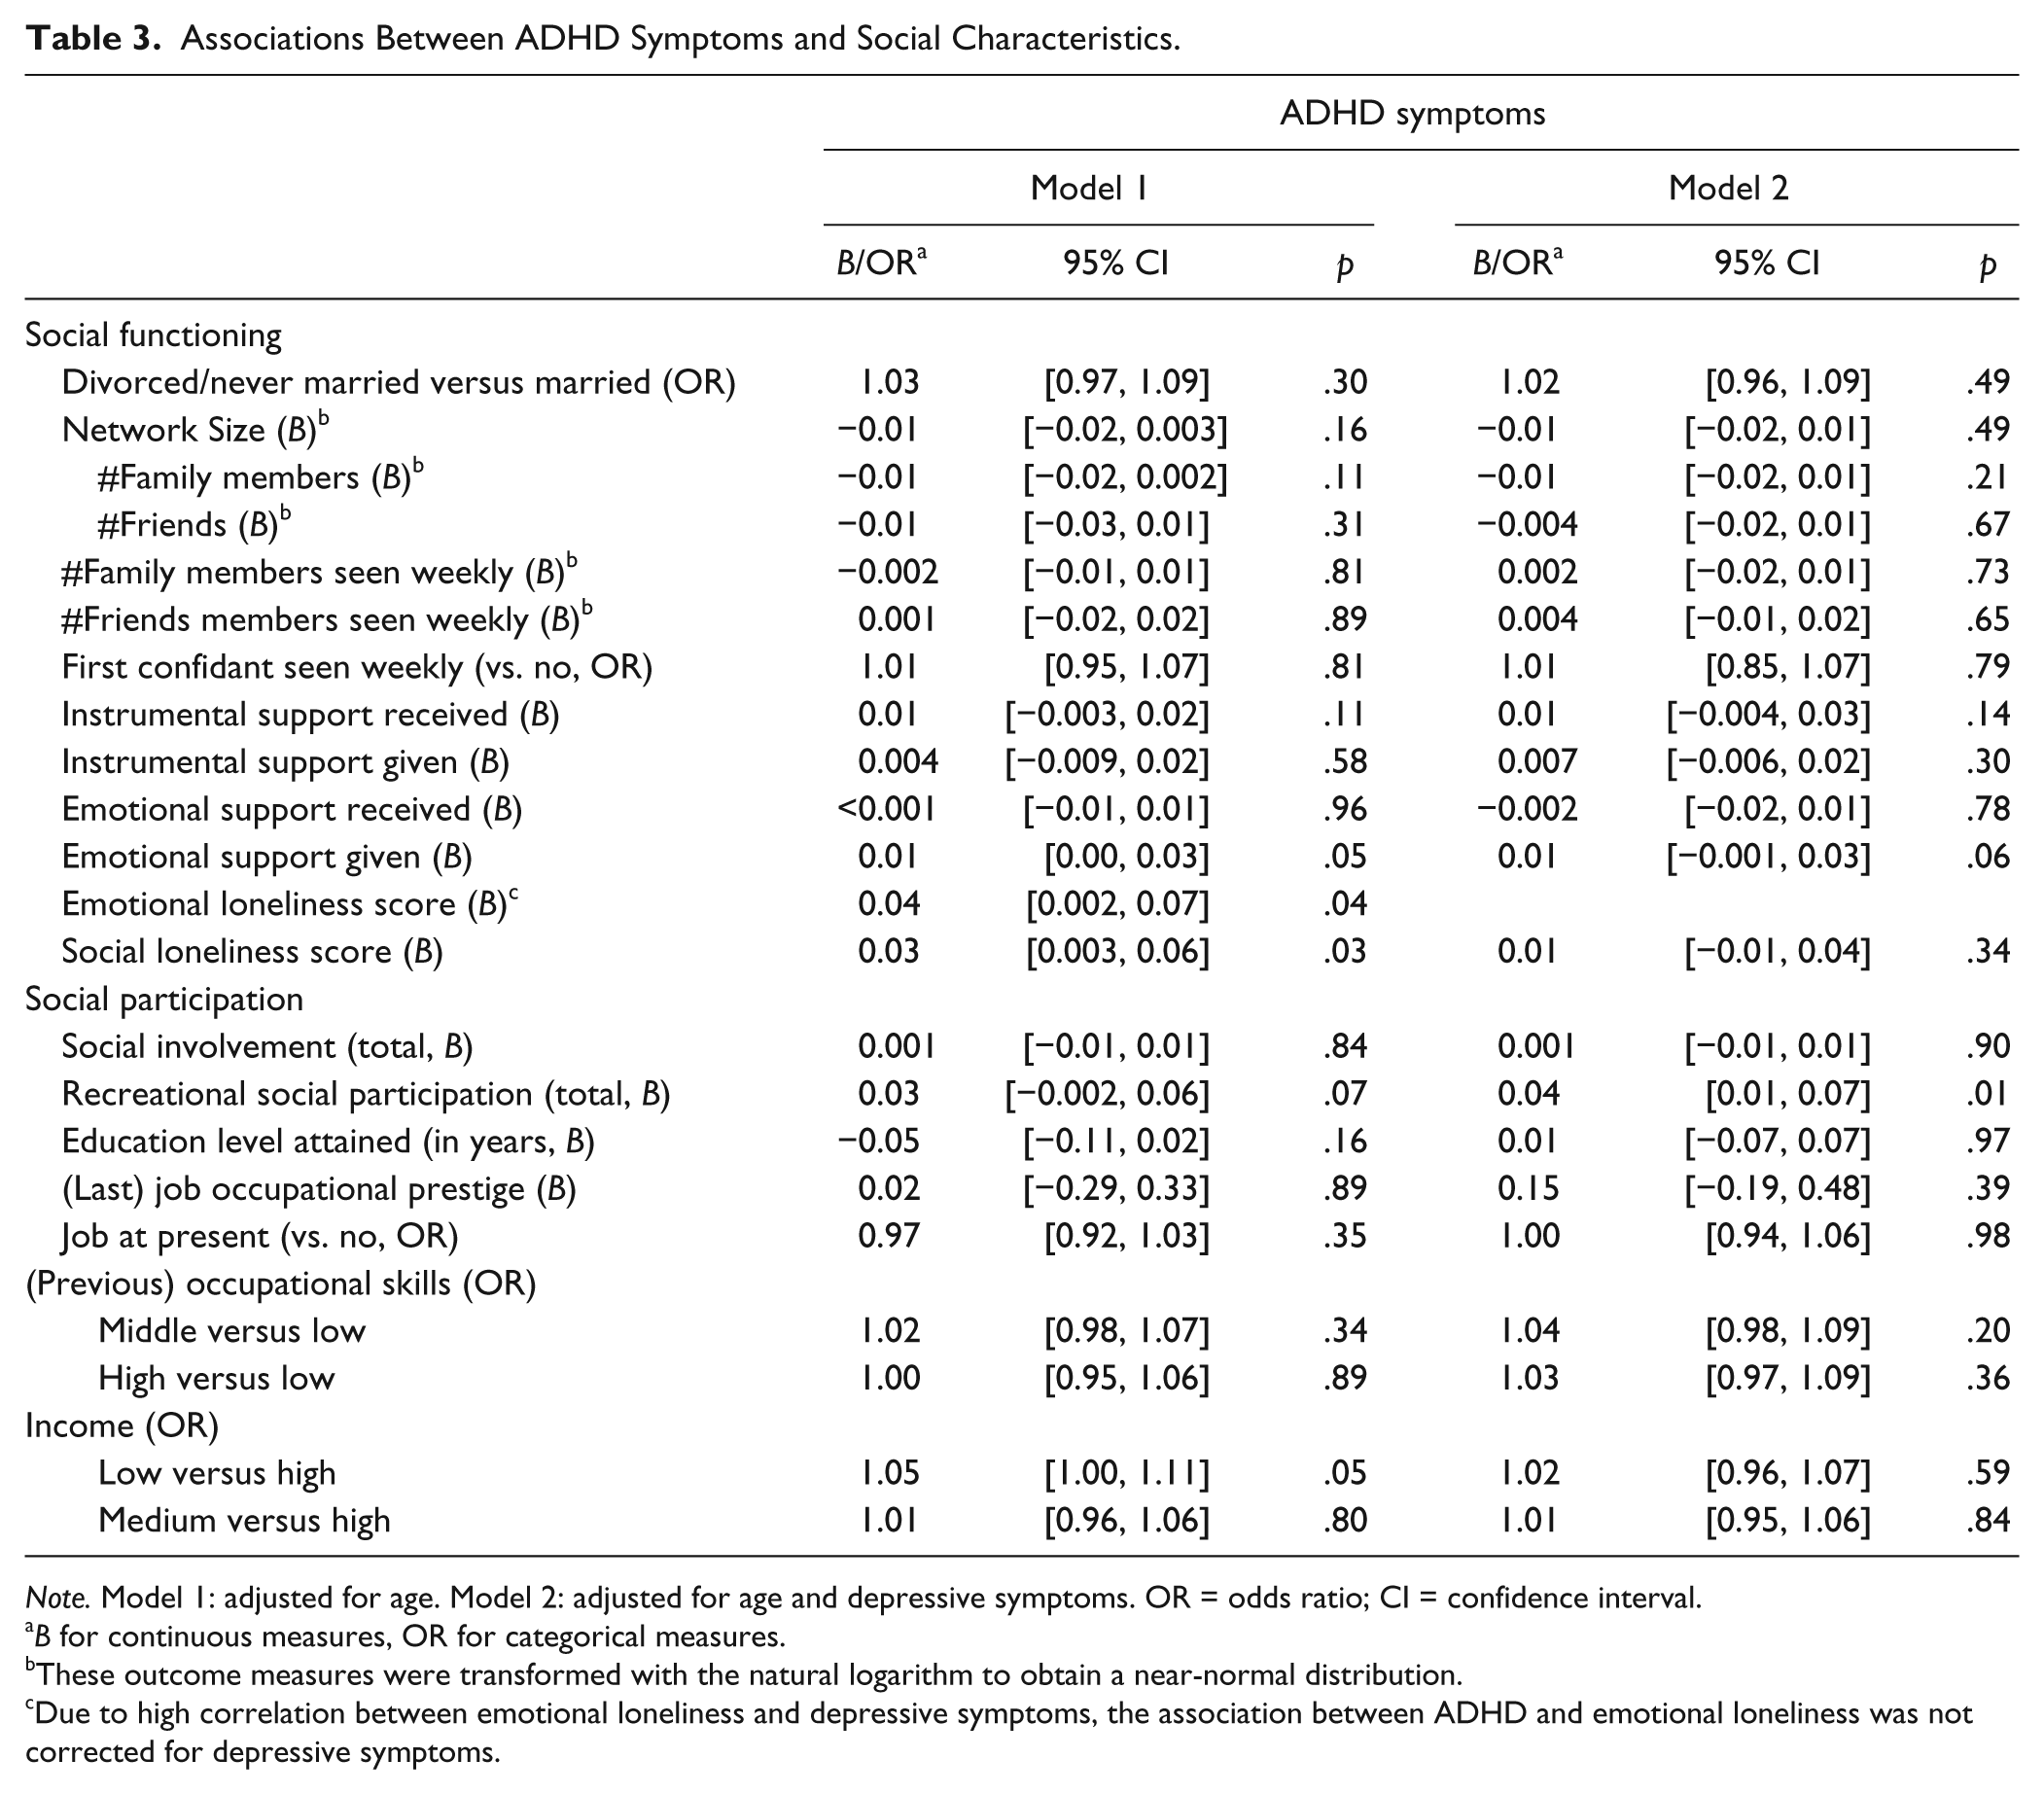
Note. Model 1: adjusted for age. Model 2: adjusted for age and depressive symptoms. OR = odds ratio; CI = confidence interval.
B for continuous measures, OR for categorical measures.
These outcome measures were transformed with the natural logarithm to obtain a near-normal distribution.
Due to high correlation between emotional loneliness and depressive symptoms, the association between ADHD and emotional loneliness was not corrected for depressive symptoms.
Linear regression analyses adjusted for age show that higher levels of ADHD symptoms were significantly associated with more emotional support given and more social and emotional loneliness, but the associations became insignificant when additionally adjusted for depressive symptoms. The association between higher levels of ADHD symptoms and levels of emotional support given became, after adjustment for depressive symptoms, only borderline significant. Only the association between level of ADHD symptoms and greater participation in recreational activities was significant after adjustment for age and depressive symptoms. The multinomial logistic regression analyses showed that older adults with higher level of ADHD symptoms were more likely to be in the lower income level than higher income level (B = 1.05, p = .05), but this association became insignificant when adjusted for depressive symptoms. Because income had 4.8% missing values, we repeated these analyses with a multiple imputation approach as a sensitivity analysis, producing five imputed datasets. The results were the same as in the original analyses and are therefore not shown.
Discussion
This epidemiological study is the first to our knowledge to explore the association between ADHD diagnosis and social functioning and social participation in older adults. In this study, older adults with an ADHD diagnosis had a three times greater odds of being divorced or never married than older adults without ADHD. In addition, older adults with ADHD reported having fewer family members in their network, greater participation in recreational activities, and more emotional loneliness than older adults without ADHD. Older adults with higher levels of ADHD symptoms also reported greater participation in recreational activities and emotional loneliness than older adults with lower levels of ADHD symptoms and in addition, reported more social loneliness, more emotional support given, and were more likely to report a lower income level.
As could be expected, older adults with ADHD, after adjustment for age, were more often divorced or never married than older adult without ADHD. Older adults with ADHD were more often never married (8.7% vs. 2.9%) and more often divorced (17.4% vs. 8.2). Our results are in concordance with studies among younger adults (Biederman et al., 1993; Eakin et al., 2004) where younger adults with ADHD were more often separated or divorced compared with a control group.
After adjustment for depressive symptoms, older adults with ADHD reported fewer family network members and less family members seen weekly. Because older adults with ADHD reported having less family members in their network, it is not surprising they see less of their family members on a weekly basis compared with older adults without ADHD. However, the first confidant was just as often a family member in older adults with and without ADHD, and there was no significant difference in weekly contact with the first confidant in the two groups. Therefore, it seems that older adults with and without ADHD do not differ in frequency of contact of the most important person in their network.
Due to their impairment in different areas of functioning, it could be expected that older adults with ADHD would receive higher levels of emotional support from their network. Interestingly, older adults with higher levels of ADHD symptoms reported higher levels of emotional support given, although this association lost significance after additional adjustment for depressive symptoms. A possible explanation for this result may be that older adults with ADHD overestimate the level of emotional support they give to others or interpret emotional support differently than older adults without ADHD. Studies revealed that boys (7-12 years) with ADHD evaluated their own performance more favorably than boys without ADHD despite their reduced social effectiveness (Hoza et al., 2005). In addition, children with ADHD were found to define “best friend” characteristics differently than those without ADHD (Heiman, 2005). According to children with ADHD, a “best friend” was someone the child could count on for companionship and having fun, while children without ADHD viewed emotional support as the core of friendship (Heiman, 2005). Following this result, it might be that older adults with ADHD evaluate or interpret their emotional relationships differently than older adults without ADHD, but more research on this topic is needed.
A surprising result was that older adults with higher levels of ADHD symptoms reported greater participation in recreational activities than older adults with lower levels of ADHD symptoms. A possible explanation for this finding could be that hyperactive or impulsive older adults may feel the need “to do something” more often than older adults without ADHD. Inattentive older adults may get bored soon with other leisure activities such as reading and may go and search for something else. Depressive symptoms seemed to mask the association between ADHD and recreational activities because the association became significant when controlling for depressive symptoms. Older adults with ADHD and low depressive symptoms probably have a greater participation in recreational activities than older adults without ADHD. Due to the small sample size, it is not possible to perform further analyses in the ADHD group, comparing recreational activities between low and high depression symptom groups. To our knowledge, no other study has focused on adult ADHD and recreational participation; more studies are necessary to replicate this result.
The association between level of ADHD symptoms and social loneliness disappeared after adjustment for depressive symptoms. Depressive symptoms and loneliness are strongly correlated (Adams, Sanders, & Auth, 2004; Barg et al., 2006; Drageset, Espehaug, & Kirkevold, 2012; Shaver & Brennan, 1991); therefore, it can be expected that depressive symptoms affect the association between ADHD and loneliness. Yet, it is unclear how depressive symptoms fit in the pathway between ADHD and loneliness. A study in middle-aged and older adults suggests that loneliness and depressive symptoms have strong reciprocal influences (Cacioppo, Hughes, Waite, Hawkley, & Thisted, 2006). In addition, the pathway between ADHD and depression is unclear. Impairments due to the disorder may lead to depression (Daviss, 2008), but there is also evidence for a common genetic origin for ADHD and comorbid depression (Cole, Ball, Martin, Scourfield, & Mcguffin, 2009; Faraone & Biederman, 1997). Longitudinal research is necessary to examine these pathways.
Older adults with higher level of ADHD symptoms were more likely to be in the lowest income category than the highest income category. This result could not be explained by gender, lower educational achievement, lower occupational prestige, or lower occupational skill level, because older adults with ADHD did not differ from those without ADHD in these measures. More research may give more insight into the relationship between ADHD, income, educational, and vocational achievement.
However, most of the expected associations between ADHD and social functioning were not significant. The results regarding social functioning and (previous) work participation did show a slight but not significant trend in the expected direction; respondents with ADHD had a smaller network size (14 vs. 18 members) and were less well presented in high job occupational skills level (14% vs. 21%). The lack of significant associations between ADHD and social functioning and social participation among older adults may be caused by selective survivorship. The respondents with ADHD may represent a subsample of the relatively successful and higher functioning older adults, who may have learned to compensate and live with the consequences of ADHD. Another explanation for not finding significant associations between ADHD and social functioning might be that the expression of ADHD symptoms “mellows” with advancing age. ADHD symptoms may be less prominent in later life compared with younger adult life. In addition, several studies found that older adults in the general population use less dysfunctional coping strategies than younger adults. For instance, older adults less often use alcohol and/or drugs, less often vent emotions (Segal, Hook, & Coolidge, 2001), have greater impulse control, and, more often, have the tendency to positively appraise conflict situations (Diehl, Coyle, & Labouvie-Vief, 1996). The possible combination of “mature” coping and lesser prominence of ADHD symptoms could be an explanation of the finding that older adults with ADHD do not differ in social and work outcomes compared with older adults without ADHD.
Limitations
It is important to note the limitations of this study. First, the cut-off score of four instead of six symptoms in adulthood is only partly validated (Barkley et al., 2007; Kooij et al., 2005) and may have led to misclassification in older adults. However, a respondent would only receive an ADHD diagnosis in our study, when six out of nine ADHD symptoms were already present in childhood and the lifetime persistence of symptoms should filter out the false positives. Even in the case of misclassification in this study, it is not very likely that this would have strongly biased the results, because it could be expected that older adults with, for example, depression also experience problems in their social functioning. Another important limitation is the small ADHD sample that yielded low statistical power. In addition, multiple tests were used that may have led to false positive results. However, because the found associations are consistent with previous studies among children and adults with ADHD, it is unlikely that the found results are due to multiple testing. Nevertheless, results should be interpreted with some caution. Final limitation is that, due to nonresponse, loss to follow-up, or death, the frailest older adults may not have been included in this study. Because ADHD in adults is associated with comorbid depression, anxiety and substance use disorders (Leibson, Katusic, Barbaresi, Ransom, & O’Brien, 2001; Sobanski, 2006), and more car accidents (Barkley, Guevremont, Anastopoulos, DuPaul, & Shelton, 1993), the remaining ADHD sample might be potentially healthier than a fully representative sample would have been. This may have resulted in an underestimation of the effects of ADHD on social functioning participation.
Conclusion
This study is the first epidemiological study examining the association between ADHD and social functioning and social participation among older adults. Significant associations between ADHD in older adults and being more often divorced or never married, more emotional support given, less family members in their network, greater recreational participation, and emotional and social loneliness were found. Especially, the association between ADHD and loneliness has clinical implications; clinicians treating older adults with ADHD should also direct their attention to loneliness. Because it is the first study on this subject among older adults, it is worthwhile for future research to further focus on ADHD and related social consequences among older adults.
Footnotes
Authors’ Note
Sandra Kooij has been a speaker for Eli Lilly, Janssen, and Shire. Aartjan Beekman has been a speaker for Lundbeck and Eli Lilly.
Declaration of Conflicting Interests
The author(s) declared no potential conflicts of interest with respect to the research, authorship, and/or publication of this article.
Funding
The author(s) disclosed receipt of the following financial support for the research, authorship, and/or publication of this article: J. J. Sandra Kooij has received unrestricted research grants from Janssen-Cilag and Shire for this study. Aartjan T. F. Beekman has received grants for research from Eli Lilly, AstraZeneca, Shire and Janssen-Cilag.