




Abstract
Keywords
Introduction
There seems to be a consensus that adolescents and young adults with ADHD are at higher risk for becoming cigarette smokers and for greater use of tobacco products than those who do not have ADHD (Pomerleau, Downey, Stelson, & Pomerleau, 1995; Sibley et al., 2014; Wilens & Biederman, 2006; Wilens & Upadhyaya, 2007). In addition, those with more ADHD symptoms are more likely to smoke than those with fewer symptoms (Kollins, McClernon, & Fuemmeler, 2005). Some investigators have also found that those with ADHD who are smokers are at higher risk for the use and abuse of alcohol and illicit drugs than those with ADHD who are nonsmokers (Biederman, Petty, Hammerness, Batchelder, & Faraone, 2012; Wilens & Upadhyaya, 2007).
ADHD shows some stability across the life span. Winters (2011) reported that childhood scores of ADHD-like behaviors are related to ADHD symptoms in adulthood. Kessler and his colleagues (2010) found that at least 46% of those having childhood ADHD met the criteria for adult ADHD.
Some investigators have suggested that inattention becomes a more prominent symptom of ADHD in adulthood as hyperactivity and impulsivity are more likely to decrease with age (Biederman, Mick, & Faraone, 2000; Kessler et al., 2010). Only Lerman and her colleagues (2001), albeit using cross-sectional data, have found an association between smoking to stimulate attention and the presence of ADHD in an adult sample (M age = 45). Otherwise, to our knowledge, there have been no studies assessing whether cigarette smoking begun in adolescence increases the likelihood of manifesting ADHD symptoms in adulthood beyond the stability of the disorder. This study will address this question by determining if various longitudinal smoking patterns differ in their association with symptoms of ADHD in a community sample of men and women in their early 40s. Thus, this study will also contribute to the literature by examining ADHD symptoms in a sample considerably older than in many previous investigations where samples have been in their 20s (Biederman et al., 2000; Kollins et al., 2005; Wilens & Upadhyaya, 2007) or covered a wide age range (18-44 years) with no mean age given (Fayyad et al., 2007). Moreover, if the longitudinal trajectories of cigarette smoking differ in their association with adult ADHD symptoms, this, combined with the findings of earlier investigators (Pomerleau et al., 1995; Sibley et al., 2014; Wilens & Biederman, 2006; Wilens & Upadhyaya, 2007), will suggest that the relationship of smoking and adult ADHD symptoms may be bidirectional.
This study controls for several variables that might moderate the relationship of longitudinal patterns of cigarette smoking to the presence of ADHD symptoms in adulthood: the diagnosis of ADHD by mid-adolescence (Kessler et al., 2010), family income, parental education (Biederman et al., 2012), participants’ depressive mood (J. S. Brook, Ning, & Brook, 2006), age and educational level in adulthood, and gender (Biederman et al., 2012).
This study hypothesizes the following: First, heavy continuous smokers are more likely than late starting smokers, moderate smokers, quitters/decreasers, and nonsmokers to manifest ADHD symptoms in adulthood. Second, nonsmokers are less likely than each of the other above categories of smokers to manifest ADHD symptoms in adulthood.
Method
Participants and Procedure
The participants in this study came from a community-based random sample residing in one of two upstate New York counties (Albany and Saratoga) and were first assessed in 1983. The participants’ mothers were interviewed about the participants in 1975 (T1) to assess problem behavior among youngsters. Primary sampling units were created from enumeration districts and block groups, which, when taken together, comprised the entire area of the selected counties. The primary sampling units in each county were stratified by urban/rural status, the proportion of Whites, and median family income. A systematic sample of primary sampling units in each county was then drawn, with probability proportional to the number of households and probabilities equal for members of all strata. Segments of blocks were then selected with probability proportional to size (number of households), and each was surveyed in the field with a proportion of the households being selected according to the predetermined sampling ratio. Address lists were compiled in this process, and interviewers were sent to the selected addresses. Those households with at least one child between the ages of 1 and 10 years were qualified for the study. In each qualified household, the interviewer, by use of a set of Kish Tables (Kish, 1949), randomly selected one child from those in the appropriate age range. The sampled families were generally representative of the population of families in the two upstate New York counties. There was a close match of the participants on family income, maternal education, and family structure with the 1980 census. Interviews of the participants were conducted in 1983 (T2, N = 756), 1985-1986 (T3, n = 739), 1992 (T4, n = 750), 1997 (T5, n = 749), 2002 (T6, n = 673), 2007 (T7, n = 607), and 2012-2013 (T8, n = 548). The mean ages (SDs) of participants at the follow-up interviews were 14.1 (2.8) at T2, 16.3 (2.8) at T3, 22.3 (2.8) at T4, 27.0 (2.8) at T5, 31.9 (2.8) at T6, 36.6 (2.8) at T7, and 43.0 (2.8) at T8, respectively.
Extensively trained and supervised lay interviewers administered interviews in private. Written informed consent was obtained from participants and their mothers in 1983, 1985-1986, and 1992, and from participants only in 1997, 2002, 2005-2006, and 2012-2013. Since 2004, the Institutional Review Board of the New York University School of Medicine authorized the use of human subjects in this research study. Earlier waves of the study were approved by the Institutional Review Boards of the Mount Sinai School of Medicine and New York Medical College. Additional information regarding the study methodology is available in prior publications (J. S. Brook, Brook, Gordon, Whiteman, & Cohen, 1990).
Measures
Trajectories of cigarette smoking (T2-T7)
At each follow-up wave (T2-T7), questions were asked about the frequency of using tobacco during the period from the last time wave through the current time wave (Johnston, O’Malley, Bachman, & Schulenberg, 2006). The tobacco measure at each point in time had a scale coded as none (0), less than daily (1), 1 to 5 cigarettes a day (2), about half a pack a day (3), about a pack a day (4), and about 1.5 packs a day or more (5). The mean (SD) tobacco use scores at each point in time were 0.59 (1.10), 0.78 (1.31), 1.37 (1.63), 1.36 (1.62), 1.24 (1.65), and 1.22 (1.73) for T2 to T7, respectively. The tobacco measure has been found to predict young adult psychiatric disorders (D. W. Brook, Brook, Zhang, Cohen, & Whiteman, 2002) and health problems (J. S. Brook, Brook, Zhang, & Cohen, 2004). In our prior research (J. S. Brook, Balka, Zhang, Pahl, & Brook, 2011), using Mplus software (Muthén & Muthén, 2010) and using the full information maximum likelihood (FIML) approach for missing data, we identified five trajectories of cigarette smoking. Bayesian posterior probability (BPP) variables for each trajectory were obtained for each participant. As shown in Figure 1 (J. S. Brook et al., 2011), the smoking trajectory groups were named heavy/continuous smokers (19.5%), late starters (10.7%), occasional smokers (18.1%), quitters/decreasers (8.2%), and nonsmokers (43.6%). As shown in the figure, the heavy/continuous smokers started smoking early, reached their maximum level (i.e., about one pack a day or more) in their late 20s, and then maintained that level into their 30s. The late starters started smoking in late adolescence but reached the same level of smoking (i.e., about one pack a day) as the heavy/continuous smokers in the late 20s. The late starters then maintained that level. The occasional smokers increased the amount of smoking from adolescence to the early 20s and then stayed at a level of less than daily smoking during adulthood. The quitters/decreasers started smoking as early as the heavy/continuous smokers (i.e., mean age 14) and reached their maximum level of smoking (i.e., daily smoking) in late adolescence. The participants then tapered off gradually from that level to minimal smoking at mean age 32.

Developmental trajectories of cigarette smoking extending from adolescence to age 37.
T8 ADHD symptoms
At T8, the participants responded to questions regarding their ADHD symptoms (Adult ADHD Self-Report Scale [ASRS] screener; Kessler et al., 2005). There are six items scored on a 5-point scale: never (0) to very often (4); α = .80; that is (a) How often do you have trouble wrapping up the final details of a project, once the challenging parts have been done? (b) How often do you have difficulty getting things in order when you have to do a task that requires organization? (c) How often do you have problems remembering appointments or obligations? (d) When you have a task that requires a lot of thought, how often do you avoid or delay getting started? (e) How often do you fidget or squirm with your hands or feet when you have to sit down for a long time? and (f) How often do you feel overly active and compelled to do things, like you were driven by a motor? The mean of the six items was used in the analysis. Kessler and his colleagues (2007) reported that the internal reliability of the ASRS screener was in the range of 0.63 to 0.72 and test–retest reliability was in the range of 0.58 to 0.77. In addition, the ability to discriminate Diagnostic and Statistical Manual of Mental Disorders (4th ed.; DSM-IV; American Psychiatric Association [APA], 1994) cases of ADHD from noncases of ADHD makes the ASRS screener appropriate for use in community epidemiological studies (Kessler et al., 2007).
T8 cigarette smoking in the past year
At T8, a question was asked about the frequency of smoking during the past year, never (0) to every day (7), (Johnston et al., 2006).
T7 depressive mood
At T7, depressive mood was assessed with five items (α = .89; for example, “Over the last few years, how much were you bothered by feeling low in energy or slowed down?” The Symptom Checklist–90 [SCL-90]; Derogatis, Lipman, Rickels, Uhlenhuth, & Covi, 1974). The mean of the five items was used in the analysis. The internal consistency, retest reliability, and validity of the SCL-90 have been proven in many studies (Hoffmann & Overall, 1978). According to Müller, Postert, Beyer, Furniss, and Achtergarde (2010), all of the short versions of the SCL-90-Revised showed high internal consistency (Cronbach’s αs ranging from .77 to .96), sensitivity and specificity, and high correlations with validity indices. In addition to having predictive validity, the depressive mood measure was stable over time (D. W. Brook, Brook, & Zhang, 2014).
ADHD at T2 to T3
The parent and youth versions of the Diagnostic Interview Schedule for Children (DISC-I; Costello, Edelbrock, Dulcan, Kala, & Klaric, 1984) were administered in 1983 (T2), and again in 1985-1986 (T3) to assess psychiatric disorders including ADHD (Anderson, Cohen, Naumova, & Must, 2006). Symptoms of ADHD include an unusually high and chronic level of inattention, hyperactivity, or both. Some items from other parts of the questionnaire were added to the DISC-I to make the diagnosis of ADHD consistent with the DSM-IV (APA, 1994). Criteria from DSM-IV were used to classify the participants with respect to ADHD. The proportion of participants (n = 548) who met the DSM-IV criteria for ADHD at T2 or T3 or both was 13.1%.
Demographic variables
Demographic variables were gender, T8 age, T8 educational level, T2 family income, and T2 parental educational level.
Analysis
Those participants who did not participate in the study at T8 (n = 208) were excluded from the analyses. There was (a) a higher percentage of females (54.7% in the sample of 548 participants vs. 36.8% in the sample of 208 nonparticipants at T8), χ2(1) = 22.5, p value < .001; (b) a lower percentage of T2/T3 ADHD diagnoses (13.1% in the sample of 548 participants vs. 18.6% in the sample of 208 nonparticipants at T8), χ2(1) = 4.1, p value = .04; and (c) a higher T2 parental educational level (13.7 [SD = 2.4] for the 548 participants vs. 13.1 [SD = 2.7] for the 208 nonparticipants at T8), t = −3.07, p value < .01. There were no differences between those included in the analysis (n = 548) as compared with those who were excluded (n = 208) from it with respect to age (t = 0.17, p value = .86), T2 family income (t = −1.91, p value = .06), and T2 depressive mood (t = −0.69, p value = .49). In addition, the difference between the two samples in the percentage of T2/T3 ADHD diagnoses was not statistically significant with control on gender (p > .05).
SAS was used to perform linear regression analyses to investigate the associations between the BPP of the trajectories of cigarette smoking and adult ADHD symptoms (n = 548). The dependent variable was T8 ADHD symptoms. There were no missing data on the T8 ADHD measure. We conducted the analyses in two steps. First, we conducted bivariate linear regression analyses of the BPPs of the trajectories of cigarette smoking and the covariates on T8 ADHD symptoms. Second, multivariate linear regression analyses were conducted by including eight control variables (i.e., gender, T8 age, T8 educational level, T8 cigarette smoking, T7 depressive mood, T2 family income, T2 parental educational level, and T2/T3 ADHD).
Results
Table 1 presents the mean (SD) or percentage (%) of the dependent and independent variables used in the present study. Table 2 presents the results of the linear regression analyses. As shown in Table 2, the bivariate linear regression analysis indicated that, as compared with the BPP of belonging to each of the other groups, the BPP of belonging to the heavy/continuous smoking group (standardized regression coefficient [SRC] = .14) was significantly associated with T8 adult ADHD symptoms. In addition, T2/T3 ADHD (SRC = .10) and T7 depressive mood (SRC = .30) were also significantly associated with T8 adult ADHD symptoms. The multivariate linear regression analysis (R2 = .12) indicated that, as compared with the BPP of belonging to the nonsmoking group, the BPP of belonging to the heavy/continuous smoking group (SRC = .17) and the BPP of belonging to the late starters (SRC = .11) were significantly associated with T8 adult ADHD symptoms. T7 depressive mood (SRC = .29) was also significantly associated with T8 adult ADHD symptoms, while cigarette smoking at T8 was associated with a lower level of T8 ADHD symptoms (SRC = −.14). In addition, as compared with the BPP of belonging to the heavy/continuous smoking group, the BPP of belonging to the quitter/decreaser group and the BPP of belonging to the occasional smoking group were significantly associated with a lower level of T8 adult ADHD symptoms (p < .05; data not shown in Table 2).
Descriptive Statistics (n = 548).

Note. BPP = Bayesian posterior probability.
Linear Regressions: Smoking and Psychosocial Factors Related to ADHD Symptoms Among Men and Women in the Early 40s (n = 548).
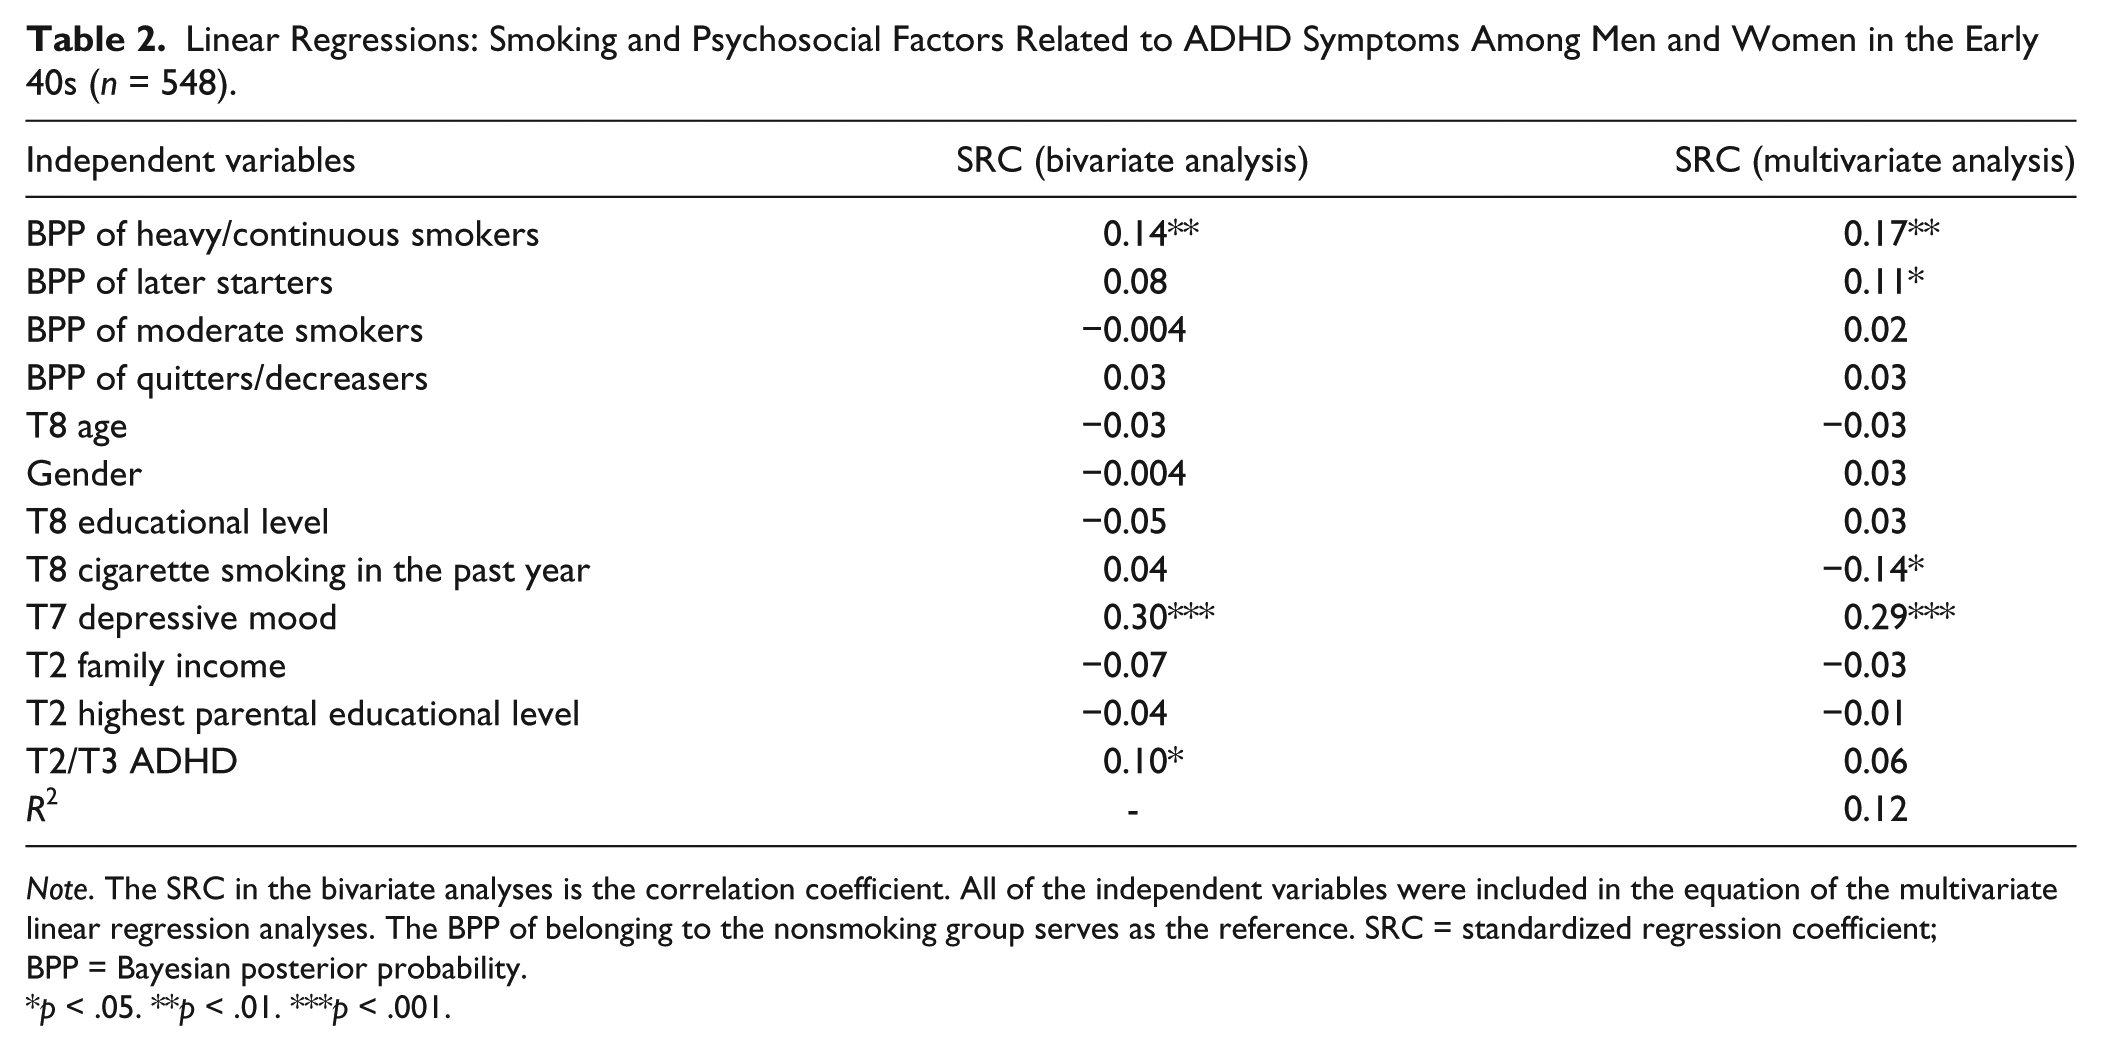
Note. The SRC in the bivariate analyses is the correlation coefficient. All of the independent variables were included in the equation of the multivariate linear regression analyses. The BPP of belonging to the nonsmoking group serves as the reference. SRC = standardized regression coefficient; BPP = Bayesian posterior probability.
p < .05. **p < .01. ***p < .001.
Discussion
This study showed a positive relationship between the chronicity of longitudinal smoking patterns and the presence of ADHD symptoms in adulthood. Thus, the association between ADHD symptoms and tobacco use appears to be bidirectional. Not only are those with more ADHD symptoms more likely to smoke (Kollins et al., 2005) but also heavy continuous smokers and late starters are more likely to show symptoms of ADHD in adulthood than are nonsmokers. The findings yielded by this longitudinal study are consistent with the results of an earlier cross-sectional study (Lerman et al., 2001).
Some investigators have found that, as those with ADHD age, smoking is more related to inattention than to hyperactivity and impulsivity (Biederman et al., 2000; Kessler et al., 2010; Lerman et al., 2001; Tercyak, Lerman, & Audrain, 2002). The relationship of smoking to inattention may be an explanation for this study’s findings. Lerman and her colleagues (2001) concluded that smokers with symptoms of inattention smoked to increase their attentiveness, a self-medication interpretation that is also consistent with the findings of Van Voorhees and her colleagues (2012). Other investigators reported similar findings. Rodriguez, Tercyak, and Audrain-McGovern (2008) noted that those with more inattentiveness might rely on nicotine to ameliorate this symptom. In addition, other research (Lerman et al., 2001; Van Voorhees et al., 2012) has suggested that those with ADHD also smoked to avoid withdrawal symptoms, another form of self-medication (Khantzian, 1997), as smoking is a central nervous system (CNS) stimulant. Nicotine may also have a positive effect on cognitive processes, including attention, control of inhibitions, and memory in those participants with ADHD. Smoking to avoid withdrawal symptoms also relieved the adverse affect common to both withdrawal and depressive symptoms, which were associated with inattention. Furthermore, Lara and her colleagues (2009) found that the only disorder comorbid with childhood ADHD that predicted the persistence of ADHD into adulthood was major depressive disorder. These studies are consistent with our finding of a positive relationship between T7 depressive mood and the presence of ADHD symptoms in adulthood.
Although this study did not address the neurobiological basis of ADHD, a number of investigators have found a link between insufficient dopaminergic activity and the presence of ADHD symptoms (Blum et al., 2008). Furthermore, these investigators note that nicotine use stimulates the production and use of dopamine. This suggests a neurological explanation: Those with ADHD self-medicate to enhance their functioning. Volkow et al. (2009), using positron emission tomography (PET) scans, also studied the dopamine reward pathway in those with ADHD. She found that adults who were not medicated for their ADHD had fewer specific dopamine receptors than those without ADHD and that having fewer dopamine receptors was associated with greater symptoms of inattention. Smoking may serve to enhance the levels of dopamine in such patients, resulting in fewer ADHD symptoms, including inattention.
Limitations
This study has some limitations. First, even though the validity of the adult ADHD symptom measure is well established in the literature (Kessler et al., 2005; Kessler et al., 2007), the correlation between the ADHD diagnosis at mean age 14 to 16 (T2/T3) and ADHD symptoms at mean age 43 was statistically significant in the bivariate analysis, but was relatively low. Therefore, it is possible that the ADHD diagnosis in adolescence did not serve as an adequate control for the adult measure of symptoms of ADHD. Possibly, the change in informants contributed to this finding (Barkley, Fischer, Smallish, & Fletcher, 2002). Earlier, the mothers may have reported more symptoms of ADHD than did the participants themselves as adults. In fact, the variety of symptoms may decrease with age. In addition, the measure of adult ADHD symptoms may not identify some of those with low or moderate levels of symptoms who actually have ADHD (Kessler et al., 2005). This T8 measure of adult symptoms was designed to screen for ADHD in the general community population, while the T2/T3 measure was intended to diagnose mainly a clinical population. If our T8 measure underidentified those with adult ADHD symptoms, then our results might be conservative. Lastly, this low correlation is consistent with the possibility that some of the participants no longer manifested their ADHD symptoms as adults. Whereas Kessler and his colleagues (2010) found that 46% of those having childhood ADHD met the criteria for adult ADHD, the balance did not. Second, this study did not have data indicating whether or not those with ADHD were treated with medicine and/or other therapeutic interventions. Hence, whether such treatment was associated with the relationship of smoking trajectories to the presence of ADHD symptoms in adulthood could not be assessed. Third, we used a single self-report measure of adult ADHD symptoms at T8. We cannot rule out the possibility that the association between smoking trajectories and adult ADHD symptoms may reflect a third common factor, such as general distress/impairment.
Still, this study has several strengths. Rather than using retrospective data to answer questions about participants when they were children, this study is strengthened by the use of longitudinal data. Moreover, some published ADHD studies have used samples from psychiatric clinics, which may have higher levels of comorbidity (Biederman et al., 2006). This study used a substantial community sample currently in their early 40s, a sample larger and older than most studies assessing smoking and adult ADHD symptoms. To our knowledge, it is the only study to examine the role of trajectories of smoking as independent variables in the context of several other dimensions related to adult symptoms of ADHD. Hence, this study’s findings, in combination with earlier research, suggest that there is a bidirectional relationship between cigarette use and adult ADHD symptoms, not just a unidirectional relationship between ADHD and smoking.
Moreover, this study contributes to the literature by examining the relationship of longitudinal smoking trajectories, not just smoking at a single point in time, to adult ADHD symptoms. The longitudinal pattern showed a more significant association for heavy continuous smokers and late starters than for the other smoking groups.
Chronic smokers seem most likely to manifest adult ADHD symptoms, thus jeopardizing both their physical health and their ability to fulfill adult roles as employees, family members, and friends. In lieu of smoking to increase their attentiveness to tasks, pharmacological and cognitive behavioral therapy might more effectively address their ADHD symptoms and at the same time facilitate their smoking cessation. Primary care providers who treat cigarette smoking with medication and/or behavioral and/or cognitive therapy may lessen the likelihood of ADHD symptoms in adulthood.
Footnotes
Declaration of Conflicting Interests
The author(s) declared no potential conflicts of interest with respect to the research, authorship, and/or publication of this article.
Funding
The author(s) disclosed receipt of the following financial support for the research, authorship, and/or publication of this article: This work was supported by a grant from the National Cancer Institute (Research Grant CA094845), and by two grants from the National Institute on Drug Abuse (Research Grants DA003188 and DA032603), all awarded to Dr. Judith S. Brook.