




Abstract
Introduction
Standardized tests play an important role in stratification. Although a growing number of colleges no longer require standardized test scores for admission (FairTest, 2014), 60% of colleges overall and 81.4% of colleges with enrollments of 10,000 or more placed “considerable importance” on tests like the Scholastic Aptitude Test (SAT) and the ACT as of 2006 (National Association for College Admission Counseling, 2008). Just as universities have been criticized for their overreliance on SAT scores in making undergraduate admission decisions (Buchmann, Condron, & Roscigno, 2010), so too have they faced criticism for overreliance on Graduate Record Examination (GRE) scores in making graduate admission decisions (Miller & Stassun, 2014). Through their importance to college admissions, test scores have the potential to influence career trajectories and outcomes; on average, college graduates have more employment possibilities, experience unemployment less often, and enjoy higher wages than high school graduates (Hout, 2012). Underperformance on such tests, then, poses a legitimate threat to future success.
Stereotype threat is a well-researched contributing factor to underperformance on tests. Claude Steele describes stereotype threat as the fear of confirming a stereotype about a group identification that is personally relevant. It is “a situational threat . . . that, in general form, can affect the members of any group about whom a negative stereotype exists” (Steele, 1997, p. 614). It manifests itself in domains where threatening negative stereotypes are relevant to the affected persons and, through distraction, self-consciousness, and related issues, can result in diminished performance on a variety of tasks (Croizet & Claire, 1998). Stereotype threat invoked on the basis of race, gender, social class, and other factors may negatively affect performance on standardized tests (Blascovich, Spencer, Quinn, & Steele, 2001; Brown & Pinel, 2003; Croizet & Claire, 1998; Deaux et al., 2007; Mayer & Hanges, 2003). Yet, relatively little is known about the potential for mental health disorder labels to induce stereotype threat on tests of relevance to university admissions. Although one previous study examined the impact of stereotype threat based on depression and eating disorders on GRE performance, the relevance of stereotypes about depression and eating disorders to the realm of test-taking is arguably questionable (Quinn, Kahng, & Crocker, 2004). Two unpublished studies examined the potential for stereotype threat based on ADHD. Madathil (2013) found that, among adults diagnosed with ADHD, those told that they were selected for the study on the basis of their ADHD achieved lower scores on a test battery measuring attention, memory, and intelligence. However, Wahlstrom (2009) found no evidence of stereotype threat effects on distraction tasks and word scramble tasks among students with ADHD primed with descriptions of the disorder as “biologically fixed” or as a “developmental delay” (p. 13). Neither of these studies considered the potential impact of ADHD-based stereotype threat on university admissions tests.
The present study addresses this gap in the literature by assessing the potential for ADHD-based stereotype threat to negatively affect GRE performance over and above the impact of ADHD symptomatology. Specifically, the present study compares four groups of participants: (a) participants reporting ADHD who are not exposed to ADHD-based stereotype threat, (b) participants reporting ADHD who are exposed to ADHD-based stereotype threat, (c) participants not reporting ADHD who are not exposed to ADHD-based stereotype threat, and (d) participants not reporting ADHD who are exposed to ADHD-based stereotype threat. ADHD provides a strong test case for the impact of stereotype threat emanating from a medical label on educational test performance, because the stereotypes associated with it are of specific relevance to academic performance (Canu, Newman, Morrow, & Pope, 2008; Chew, Jensen, & Rosén, 2009). Moreover, ADHD is among the most common disorders in the Diagnostic and Statistical Manual of Mental Disorders (4th ed.; DSM-IV; American Psychiatric Association, 1994) diagnosed in childhood, and, for as many as 50% of patients, may persist into adulthood. This raises the importance of understanding how stereotypes associated with ADHD may be holding back the diagnosed (Schweitzer, Hanford, & Medoff, 2006).
Stereotype Threat: A General Overview
Steele and Aronson (1995) first identified stereotype threat in a series of experiments in which they administered the Verbal section of the Graduate Record Examination (GRE) to African American and White college students. Controlling for self-reported previous performance on the SAT, when researchers described the test questions as measuring intellect, African American students achieved lower scores than White students. However, when researchers described performance on the test as non-indicative of ability, score averages converged between the two groups (Steele & Aronson, 1995).
Concern over confirming negative stereotypes about underperformance on standardized tests motivated African American test-takers to actively avoid underperforming. Yet, efforts to overcome stereotypes about underperformance led to actual underperformance; specifically, African American test-takers answered fewer items in more time with less accuracy than White students when the test was framed as evaluative of ability. Moreover, Steele and Aronson (1995) found that a test need not even be diagnostic of ability to trigger stereotype threat; all that was necessary to trigger stereotype threat among African American test-takers was to ask them to self-identify their racial/ethnic background prior to answering test questions.
Although studies of stereotype threat have involved a variety of activities, academic-oriented test-taking remains one of the central domains in which researchers address the possible presence of the phenomenon. Research has revealed how stereotype threat may negatively affect test-taking performance not only on the basis of race (Blascovich et al., 2001) but also on the basis of ethnicity (Deaux et al., 2007), gender (Brown & Pinel, 2003), and socioeconomic status (Croizet & Claire, 1998). These bases for stereotype threat may only be scratching the surface; Steele (1997) argued that stereotype threat could “affect the members of any group about whom a negative stereotype exists (e.g., skateboarders, older adults, White men, gang members)” (p. 614).
Social scientists have largely overlooked the potential impact of stereotype threat on adults labeled with stigmatizing mental disorders. To the author’s knowledge, only one study has considered the impact of mental illness-based stereotype threat on a commonly used university admission test (Quinn et al., 2004). Quinn and colleagues (2004) found evidence that participants previously treated for depression performed worse on GRE questions after revealing their mental illness history than participants who had not been treated previously for depression and that persons with eating disorders did not perform significantly worse when they revealed their disorder than when they did not. This work sets a useful foundation for mental illness-based stereotype threat research but suffers from a key limitation. Among mental illnesses, the stereotypes associated with depression and eating disorders have questionable relevance to test-taking, and, in fact, Quinn and colleagues (2004) did not directly establish the relevance of stereotypes about either to the test-taking domain. Thus, diminished performance found among those with a history of depression may have resulted from pre-occupation with the devalued status for reasons unrelated to the test-taking task. The present study contributes to the literature on stereotype threat by exploring whether stereotype threat from domain-relevant stereotypes about mental illness—specifically, ADHD—impedes test-taking performance.
To increase theoretical relevance, the present study conforms to the major assumptions regarding task difficulty and domain relevance of the task from the stereotype threat paradigm while incorporating a method for prompting stereotype threat that is common to the literature (Spencer, Steele, & Quinn, 1999). Spencer and colleagues (1999) and O’Brien and Crandall (2003) suggested that stereotype threat only arises when a task is difficult, as individuals may be able to perform simple tasks competently even in the face of stereotype threat. The difficulty of the GRE, then, justifies its use to determine the impact of stereotype threat on young adults with ADHD’s test-taking performance.
Steele’s (1997) identification of domain relevance as necessary for the emergence of stereotype threat was incorporated in two ways. First, the present study focuses recruitment on current or recent students by using university recruitment outlets. Current or recent students likely completed the ACT or the SAT in recent years and could be interested in taking other standardized tests required for professional school admissions, so the standardized test-taking domain would likely be significant to them. In addition, a standardized test-taking domain may be important to participants—regardless of student status—given that standardized tests have traditionally been presented as measures of aptitude (Sacks, 2001). Second, the present study applies a manipulation designed to prompt stereotype threat both in participants reporting ADHD and in participants not reporting ADHD. Participants not reporting ADHD who were exposed to ADHD-based stereotype threat would not necessarily be expected to view stereotypes about diminished performance from ADHD as personally relevant, but some studies of stereotype threat suggest that non-personally relevant stereotype invocation may still diminish performance in certain cases (Wheeler & Petty, 2001). Thus, this experiment allows for examination of whether performance suffers more among those exposed to medicalized label-induced stereotype threat if the stereotype invoked is personally applicable (i.e., domain relevant).
Finally, a well-studied method for inducing stereotype threat is used. Mentioning to participants that members of a group they belong to do not perform as well on a task as others—the primary means by which stereotype threat is prompted in the present study—is a well-tested way of invoking stereotype threat (Spencer et al., 1999).
ADHD as a Potential Basis for Stereotype Threat
In general, having ADHD is strongly correlated with academic underachievement. Children and adolescents with ADHD struggle with comprehension, class preparedness, and study skills, leading to low grades on tests and quizzes (Raggi & Chronis, 2006). College students with ADHD report lower grade point averages and problems with study and organizational skills, note taking, time management, concentration, and test-taking (Daley & Birchwood, 2010; Heiligenstein et al., 1999; Weyandt et al., 2013). This underachievement may undermine self-perceptions in testing situations; research indicates that students with ADHD see themselves as lacking the test performance capabilities of their non-ADHD affected peers (Lewandowski, Gathje, Lovett, & Gordon, 2013).
Given both the common general academic difficulties and the specific testing difficulties experienced by persons with ADHD, university admissions testing among young adults reporting ADHD represents a particularly appropriate realm for the study of stereotype threat. ADHD symptomatology has the potential to specifically negatively affect test-taking performance by influencing careless mistakes, distraction by “extraneous stimuli,” and difficulty following directions (Educational Testing Service [ETS], 2008). Indeed, Goodwin, Gudjonsson, Sigurdsson, and Young (2011) found evidence of an adverse relationship between adult ADHD symptoms and performance on the Ravens Standard Progressive Matrices (RSPM) test, a test designed to measure IQ (Goodwin et al., 2011).
The challenges posed to young adults reporting ADHD in a standardized test-taking realm are also consistent with the conditions under which Steele (1997) suggested that stereotype threat occurs. Adults with ADHD are negatively stereotyped (Jussim, Palumbo, Chatman, Madon, & Smith, 2000). Although positive framings of ADHD have entered public discussion (Hallowell & Ratey, 1995), the disorder’s negative aspects are more widely recognized and accepted (e.g., Weiss, Hechtman, & Weiss, 1999). Research suggests that children associate ADHD with violence and antisocial behavior and may prefer social distance from their peers with the disorder (Walker, Coleman, Lee, Squire, & Friesen, 2008). College students stigmatize peers with ADHD as well, viewing them as less academically competent than persons without ADHD (Canu et al., 2008; Chew et al., 2009). As Lee Jussim and colleagues (2000) argued, “the ADHD label represents a devalued social identity based on flaws in one’s behavior (and, to a lesser extent, personality)” (p. 390).
The standardized test-taking process taps directly into the stigmatization of adults with ADHD. Acceptance of negative stereotypes as personally applicable is a precondition for receiving accommodations on ETS standardized tests such as the Graduate Record Examination (GRE). To receive accommodations on such tests, adults with ADHD must demonstrate evidence of long-standing impairment across multiple domains (ETS, 2008). Thus, the present study represents a logical framework from which to examine medicalized labeling as a potential basis for stereotype threat in educational testing situations.
Hypotheses
A number of ADHD symptoms have the potential to negatively affect test-taking performance, including making careless mistakes, become distracted by “extraneous stimuli,” and failing to follow instructions (ETS, 2008). Thus, I hypothesize that
Stereotype threat negatively affects test-taking performance among members of a number of stigmatized groups (Blascovich et al., 2001; Deaux et al., 2007; Mayer & Hanges, 2003; O’Brien & Crandall, 2003; Spencer et al., 1999). Given that ADHD fits the scope conditions for stereotype threat coupled with Steele’s (1997) predictions that stereotype threat could emerge among members of any group subject to negative stereotypes, I hypothesize that
Stereotype threat should typically only appear under circumstances of personal applicability (Steele, 1997). Therefore, I hypothesize that
Generally, it is hypothesized that respondents neither reporting ADHD nor exposed to conditions intended to elicit stereotype threat will score highest, whereas participants reporting ADHD exposed to conditions intended to elicit stereotype threat will score lowest.
Method
Participants
Most participants were recruited through an interdisciplinary participant pool at an elite, Southern university. The recruitment text called for participation in a test of experimental GRE questions allegedly being considered for inclusion on future GREs.
Participants completed an online demographic questionnaire including the following question:
Do you have any mental health disorder(s) or learning disability/disabilities which could make answering test questions more difficult, such as dyslexia, attention deficit disorder (ADD), Attention Deficit/Hyperactivity Disorder (ADHD) or Autism? (You are still welcome to participate in the study if you do).
Answer choices included the following: “attention deficit/hyperactivity disorder (ADHD/ADD),” “autism,” “dyslexia,” “other mental health disorders or learning disabilities which could interfere with test-taking or learning (please specify),” and “none.” This made it possible to distinguish between participants reporting ADHD and participants not reporting ADHD. Self-reported ADHD status was also verified using the first six questions of the Adult ADHD Self-Report Scale–V1.1 (ASRS-V1.1), which was administered during the experiment (see the “Tasks” section). The questions were administered as part of the stereotype threat manipulation for self-reported ADHD participants for whom stereotype was deliberately invoked (Condition 2) and administered at the end of the session for all other participants with self-identified ADHD (Condition 1; see the “Procedures” section). The six questions cover difficulty wrapping up final details of projects, difficulty getting things in order, problems remembering obligations, avoidance or delay in completing difficult tasks, fidgeting and squirming, and feelings of being overly active and compelled to do things. For each question, participants answered “never,” “rarely,” “sometimes,” “often,” or “very often.” The scoring instructions for the ASRS-V1.1 indicate the answers which suggest symptomatology consistent with ADHD, with four or more such answers indicating that the individual “has symptoms highly consistent with ADHD in adults” (World Health Organization, 2003). Due to their “high sensitivity” and “moderate specificity,” these questions have been verified as constituting “an effective adult ADHD screening to guide further evaluations for ADHD” (Hines, King, & Curry, 2012, p. 847). All participants reporting ADHD met the criteria for “symptoms highly consistent with ADHD in adults” (World Health Organization, 2003).
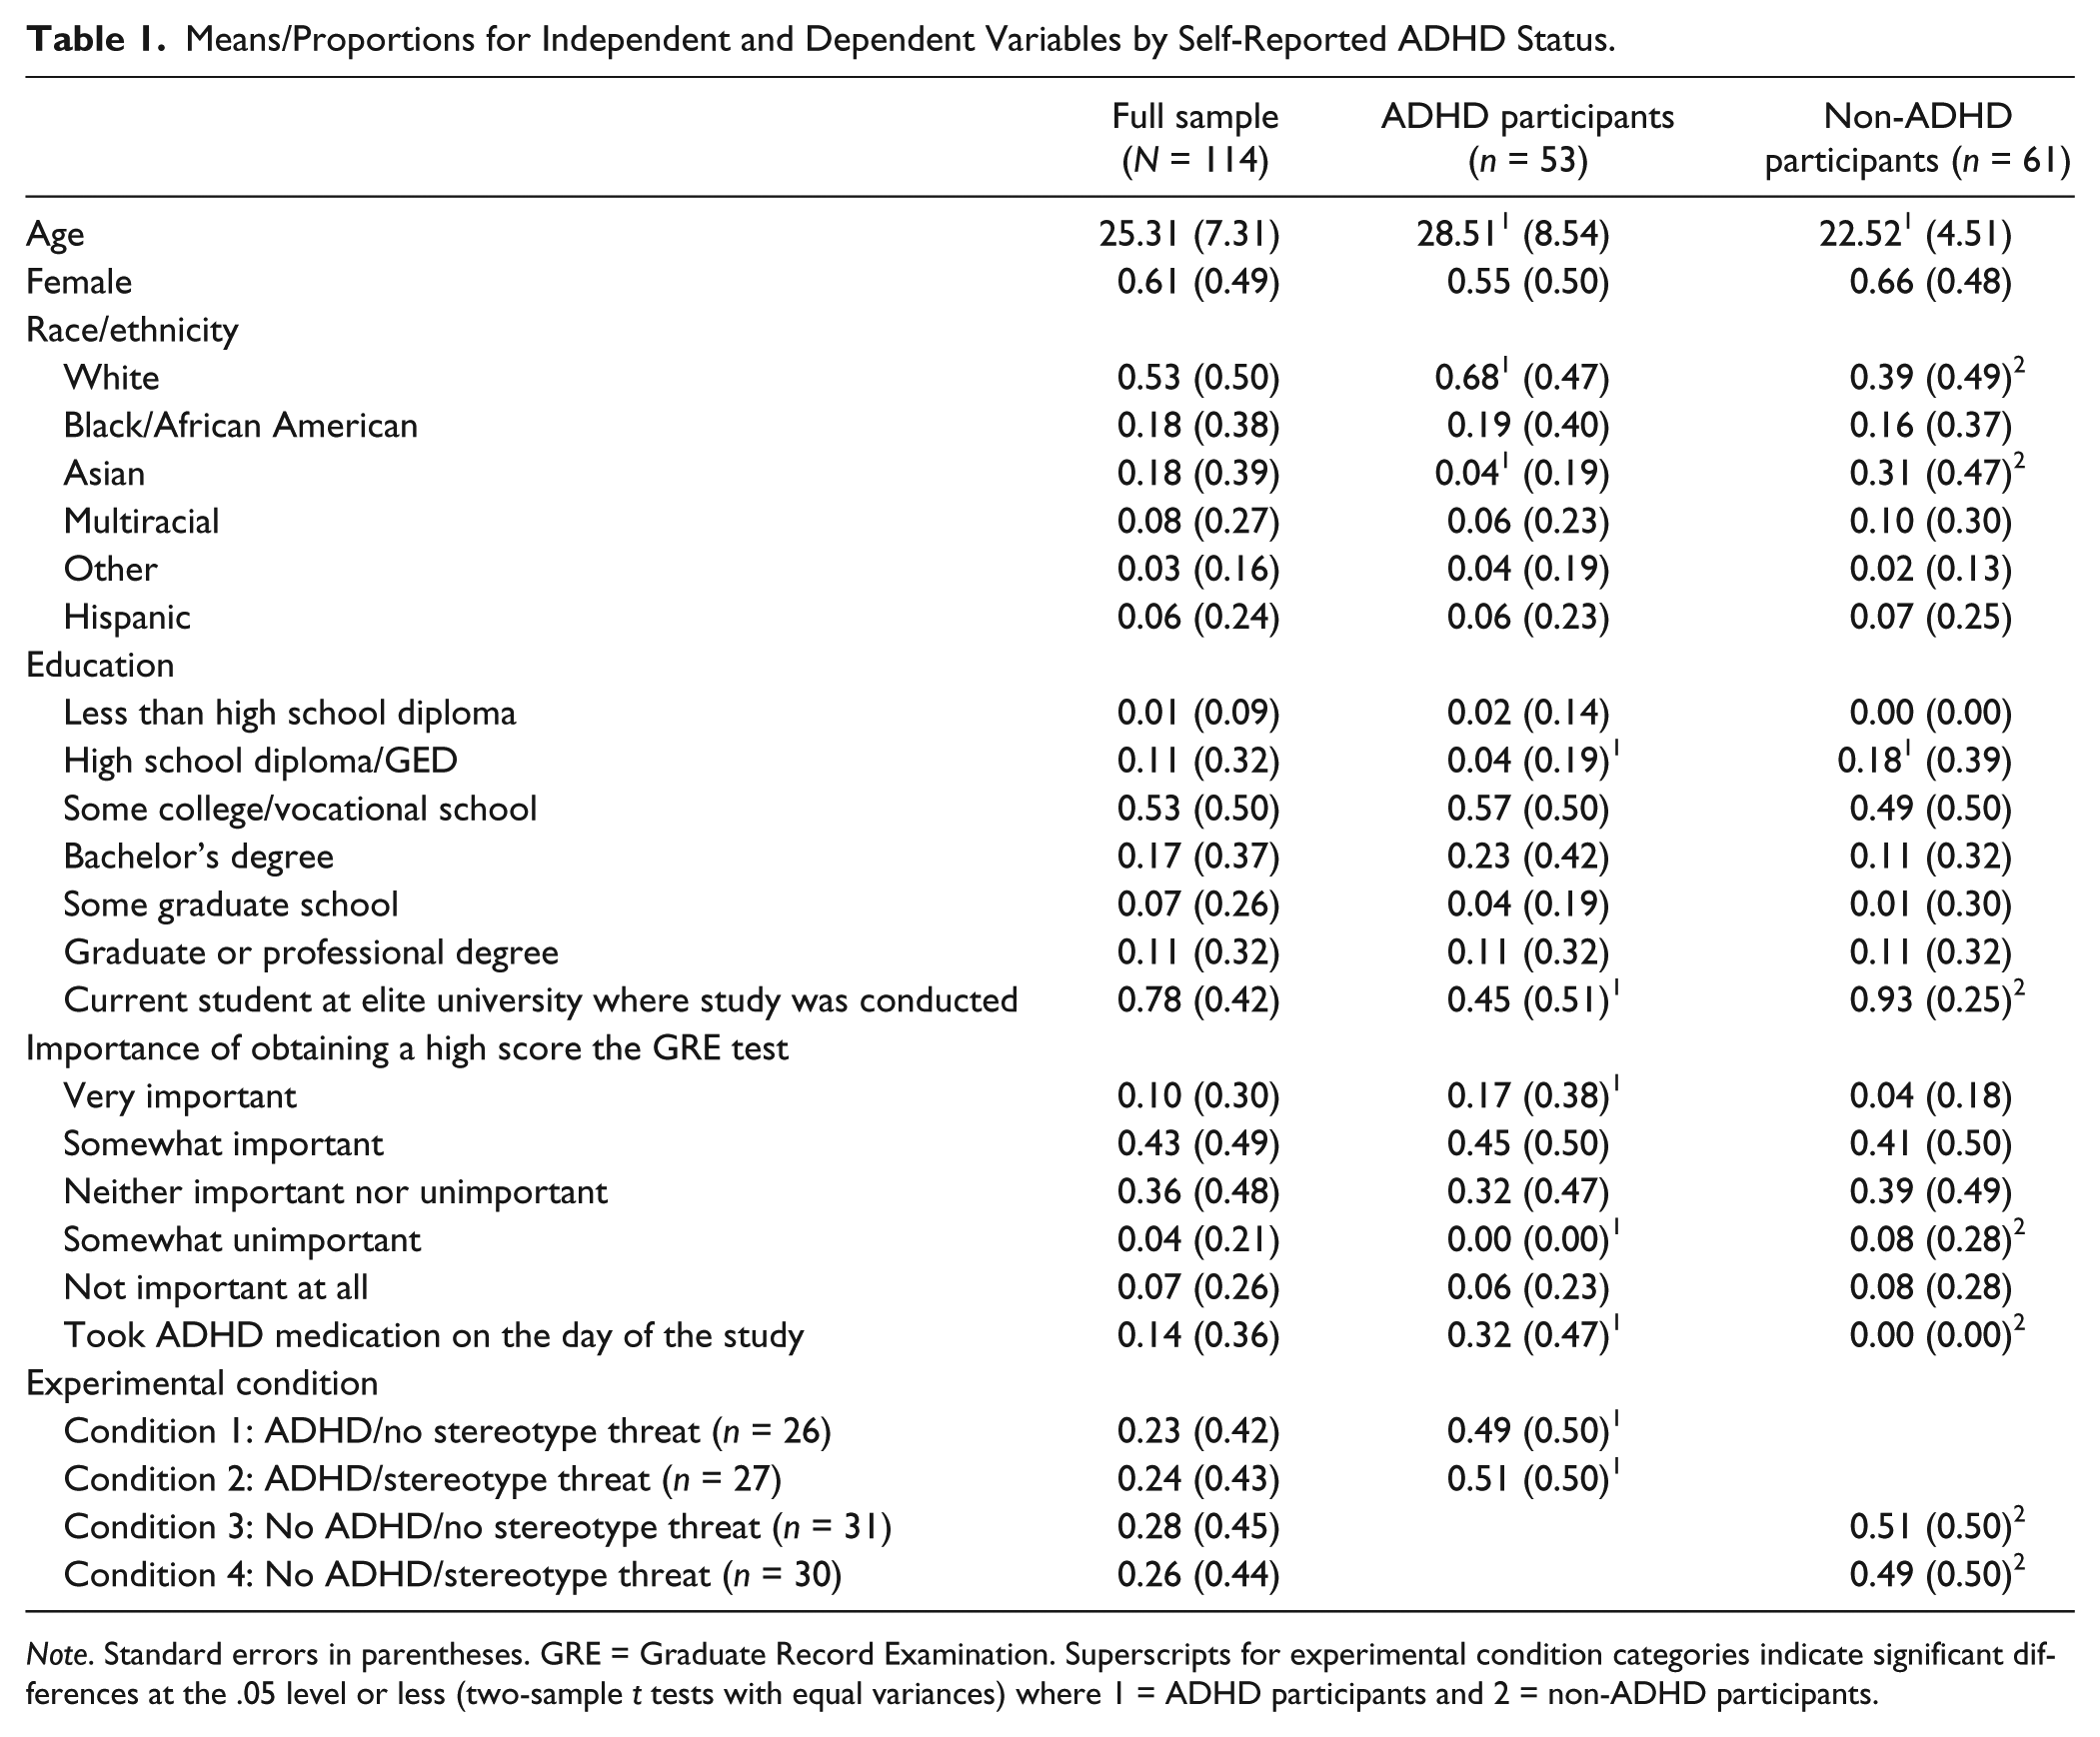
An alternative version of the recruitment text specifically expressed interest in participants with ADHD given their infrequent inclusion in tests of new GRE questions. This was circulated through classified ads, through flyers posted on bulletin boards in public meeting spaces and psychiatric treatment facilities, and through email listservs connected with local ADHD support groups after at least 30 participants had been recruited for each non-ADHD condition. In addition, the study was initially restricted to current students but then expanded to a broader population given the difficulty of recruiting only ADHD-reporting participants who were current students in sufficient numbers. Most of the participants reporting ADHD (30 out of 56) were, nevertheless, current students. Recruitment yielded a total of 114 participants (see Table 1 for descriptive statistics).
Means/Proportions for Independent and Dependent Variables by Self-Reported ADHD Status.
Note. Standard errors in parentheses. GRE = Graduate Record Examination. Superscripts for experimental condition categories indicate significant differences at the .05 level or less (two-sample t tests with equal variances) where 1 = ADHD participants and 2 = non-ADHD participants.
Participants were approximately 25 years old, with about 61% being women and 39% being men. About 53% identified as White, 18% Black or African American, 18% Asian, and 11% multiracial or Other, with about 6% of participants identifying as Hispanic. Nearly 1% of participants had less than a high school diploma, while about 11% had a high school diploma or GED, 53% completed some college or vocational school, 17% had a bachelor’s degree, 7% completed some graduate school, and 11% had a graduate or professional degree. About 78% of participants were current students at the elite university where the study was conducted. Among participants, about 10% described the GRE questions they answered in the study as very important, while 43% described them as somewhat important, 36% as neither important nor unimportant, 4% as somewhat important, and 7% as not important at all. Fourteen percent of the sample took ADHD medication on the day of the study. Participants were fairly evenly distributed into experimental conditions, with about 23% in Condition 1 (reporting ADHD, no stereotype threat), 24% in Condition 2 (reporting ADHD, stereotype threat), 27% in Condition 3 (not reporting ADHD, no stereotype threat), and 26% in Condition 4 (not reporting ADHD, stereotype threat).
Compared with participants not reporting ADHD, participants reporting ADHD were about 6 years older on average (28.51 vs. 22.52). A smaller percentage of participants reporting were female than participants not reporting ADHD (approximately 55% vs. 66%). Compared with participants not reporting ADHD, there were substantially more White participants (approximately 68% vs. 39%), slightly more Black/African American participants (approximately 19% vs. 16%), substantially fewer Asian participants (approximately 4% vs. 31%), slightly fewer multiracial participants (approximately 6% vs. 10%), and slightly more participants who identified themselves as being of some Other race (approximately 4% vs. 2%) among those reporting ADHD. Slightly fewer participants reporting ADHD identified as Hispanic (approximately 6% vs. 7%). Slightly more participants reporting ADHD had less than a high school diploma (2% vs. 0%), substantially fewer had a high school diploma or GED (4% vs. 18%), more had attended some college or a vocational school (57% vs. 49%), substantially more had a bachelor’s degree (23% vs. 11%), fewer had attended some graduate school (4% vs. 10%), and a similar percentage had completed a graduate or professional degree (11% vs. 11%). A much higher percentage of participants not reporting ADHD were current students at the university where the study was conducted (93%) than the percentage of ADHD-reporting participants who were current students at the university (45%). Compared with participants not reporting ADHD, more ADHD-reporting students viewed the GRE questions answered in the study as very important (17% vs. 4%) or somewhat important (45% vs. 41%), and fewer viewed the questions as neither important nor unimportant (32% vs. 39%), somewhat unimportant (0% vs. 8%), or not important at all (6% vs. 8%). Thirty-two percent of ADHD-reporting participants reported having taken ADHD medication on the day of the study as compared with 0% of participants not reporting ADHD.
Nationally representative data suggest that adults reporting ADHD are significantly more male and White (Kessler et al., 2006). In this study’s sample, adults reporting ADHD were significantly more White but not significantly more male (see Table 1). This may be attributable to the broader trend of women more frequently volunteering to participate in experimental studies (Patel, Doku, & Tennakoon, 2003). Consistent with that trend, in the full sample for the present study, only 39% of participants were men, whereas 61% were women.
To determine relevance of the test-taking procedure to the participants, after completion of the study, participants answered the question (among other post-study questions) of how important achieving a high score on the experimental GRE questions used in the study was to them. Of the participants reporting ADHD, 9 (17%) indicated that it was very important, 24 (45%) somewhat important, 17 (32%) neither important nor unimportant, 0 (0%) somewhat unimportant, and 3 (6%) not important at all. Thus, most participants reporting ADHD cared about doing well on the GRE questions. (In comparison, among participants not reporting ADHD, 2 (3%) indicated that it was very important, 25 (41%) somewhat important, 24 (39%) neither important nor unimportant, 5 (8%) somewhat unimportant, and 5 (8%) not important at all.)
Tasks
The primary task for participants was to complete GRE questions. To help mitigate the potential for respondent fatigue, a subsample of questions were used in this study rather than a full GRE test. All questions came from a single previously administered GRE test (GR92-1) published in what was the most recent GRE General Test preparation book released by the ETS at the time of study commencement (ETS, 2002).
Included test questions were divided into two sections: (a) a section containing 15 verbal questions from the GRE and (b) a section containing 14 quantitative questions from the GRE. The verbal section covered the breadth of question types by including 3 fill-in-the-blank questions, 4 analogy questions, 4 reading comprehension questions, and 4 antonym questions from GRE test GR92-1. Similarly, the quantitative section included 7 questions for which information is supplied and the test-taker is asked to indicate whether the value in Column A is greater, the value in Column B is greater, the two values are equal, or the relationship cannot be determined from the information given, and 7 questions for which the test-taker is instructed to answer by choosing one possibility from among five answer choices. As with the verbal questions, these questions came from GRE test GR92-1 (ETS, 2002).
Using data from 3 years of these questions’ administration, the researcher determined the difficulty of questions for each section of GRE test GR92-1. For the present study’s verbal section, the researcher selected five questions answered correctly by 28% or fewer of test-takers, four answered correctly by between 29% and 49% of test-takers, three answered correctly by between 50% and 74% of test-takers, and three answered correctly by between 75% and 100% of test-takers (ETS, 2002). For the quantitative section of the present study, the researcher selected five questions answered correctly by 33% or fewer test-takers, four questions answered correctly by between 34% and 49% of test-takers, three questions answered correctly by between 50% and 74% of test-takers, and two questions answered correctly by between 75% and 100% of test-takers. This process was intended to ensure the inclusion of some of the most difficult questions from GR92-1 and thereby increase the potential for stereotype threat, as previous studies suggest that stereotype threat effects are more likely when test difficulty or item difficulty increases (Neuville & Croizet, 2007; O’Brien & Crandall, 2003; Spencer et al., 1999; Wicherts, Dolan, & Hessen, 2005). However, questions at other difficulty levels were included to increase the potential for variance among test-takers’ scores.
Participants also completed the first six questions from the ASRS-V1.1 Symptoms Checklist from the World Health Organization’s International Diagnostic Interview, a diagnosis questionnaire containing questions regarding diagnosis type, medication usage, and symptomatology, and a post-study questionnaire which included a funnel debriefing. The funnel debriefing asked the participants what they thought the purpose of the experiment was, whether parts of the study struck them as unusual or confusing, how difficult the test questions were, whether they felt that they had adequate time to complete the questions, what they thought the questions were intended to measure, whether a mental health disorder or learning disability may have interfered with their performance on the GRE questions, and whether, for participants reporting ADHD, having ADHD made answering questions more difficult. Participants then received an explanation of the study which addressed the need for deception and noted that performance in the study was not necessarily indicative of ability to perform well on GRE tests in general.
Procedures
All procedures took place in an interdisciplinary lab with one participant in each room, and each participant read, signed, and received a copy of an informed consent form. Each participant was randomly assigned to one of four conditions. Participants reporting ADHD were randomly assigned to Condition 1 or 2, whereas participants not reporting ADHD were randomly assigned to Condition 3 or 4. Participants in Condition 1 were young adults reporting ADHD who completed the GRE questions without explicit exposure to stereotype threat. Participants in Condition 2 were young adults reporting ADHD who were explicitly exposed to ADHD-based stereotype threat. The researcher exposed participants to ADHD-based stereotype threat in Condition 2 by (a) having them complete the six-question screener from the ASRS-V1.1 Symptoms Checklist described in the “Participants” section as well as questions regarding diagnosis type and medication usage (which were not administered until after completion of the GRE questions in Condition 1) and (b) warning them that people with ADHD typically score much lower on the questions than other persons.
Participants in Condition 3 were young adults not reporting ADHD who completed GRE questions without explicit exposure to stereotype threat. Participants in Condition 4 were young adults not reporting ADHD who were exposed to ADHD-based stereotype threat following the same procedures for stereotype threat exposure as participants in Condition 2.
Participants had 15 min to complete the verbal section, and 22 min and 30 s to complete the quantitative section (based on average time per question on a typical administration for the number of questions asked). No time left over from the first section carried over to the second section.
Results
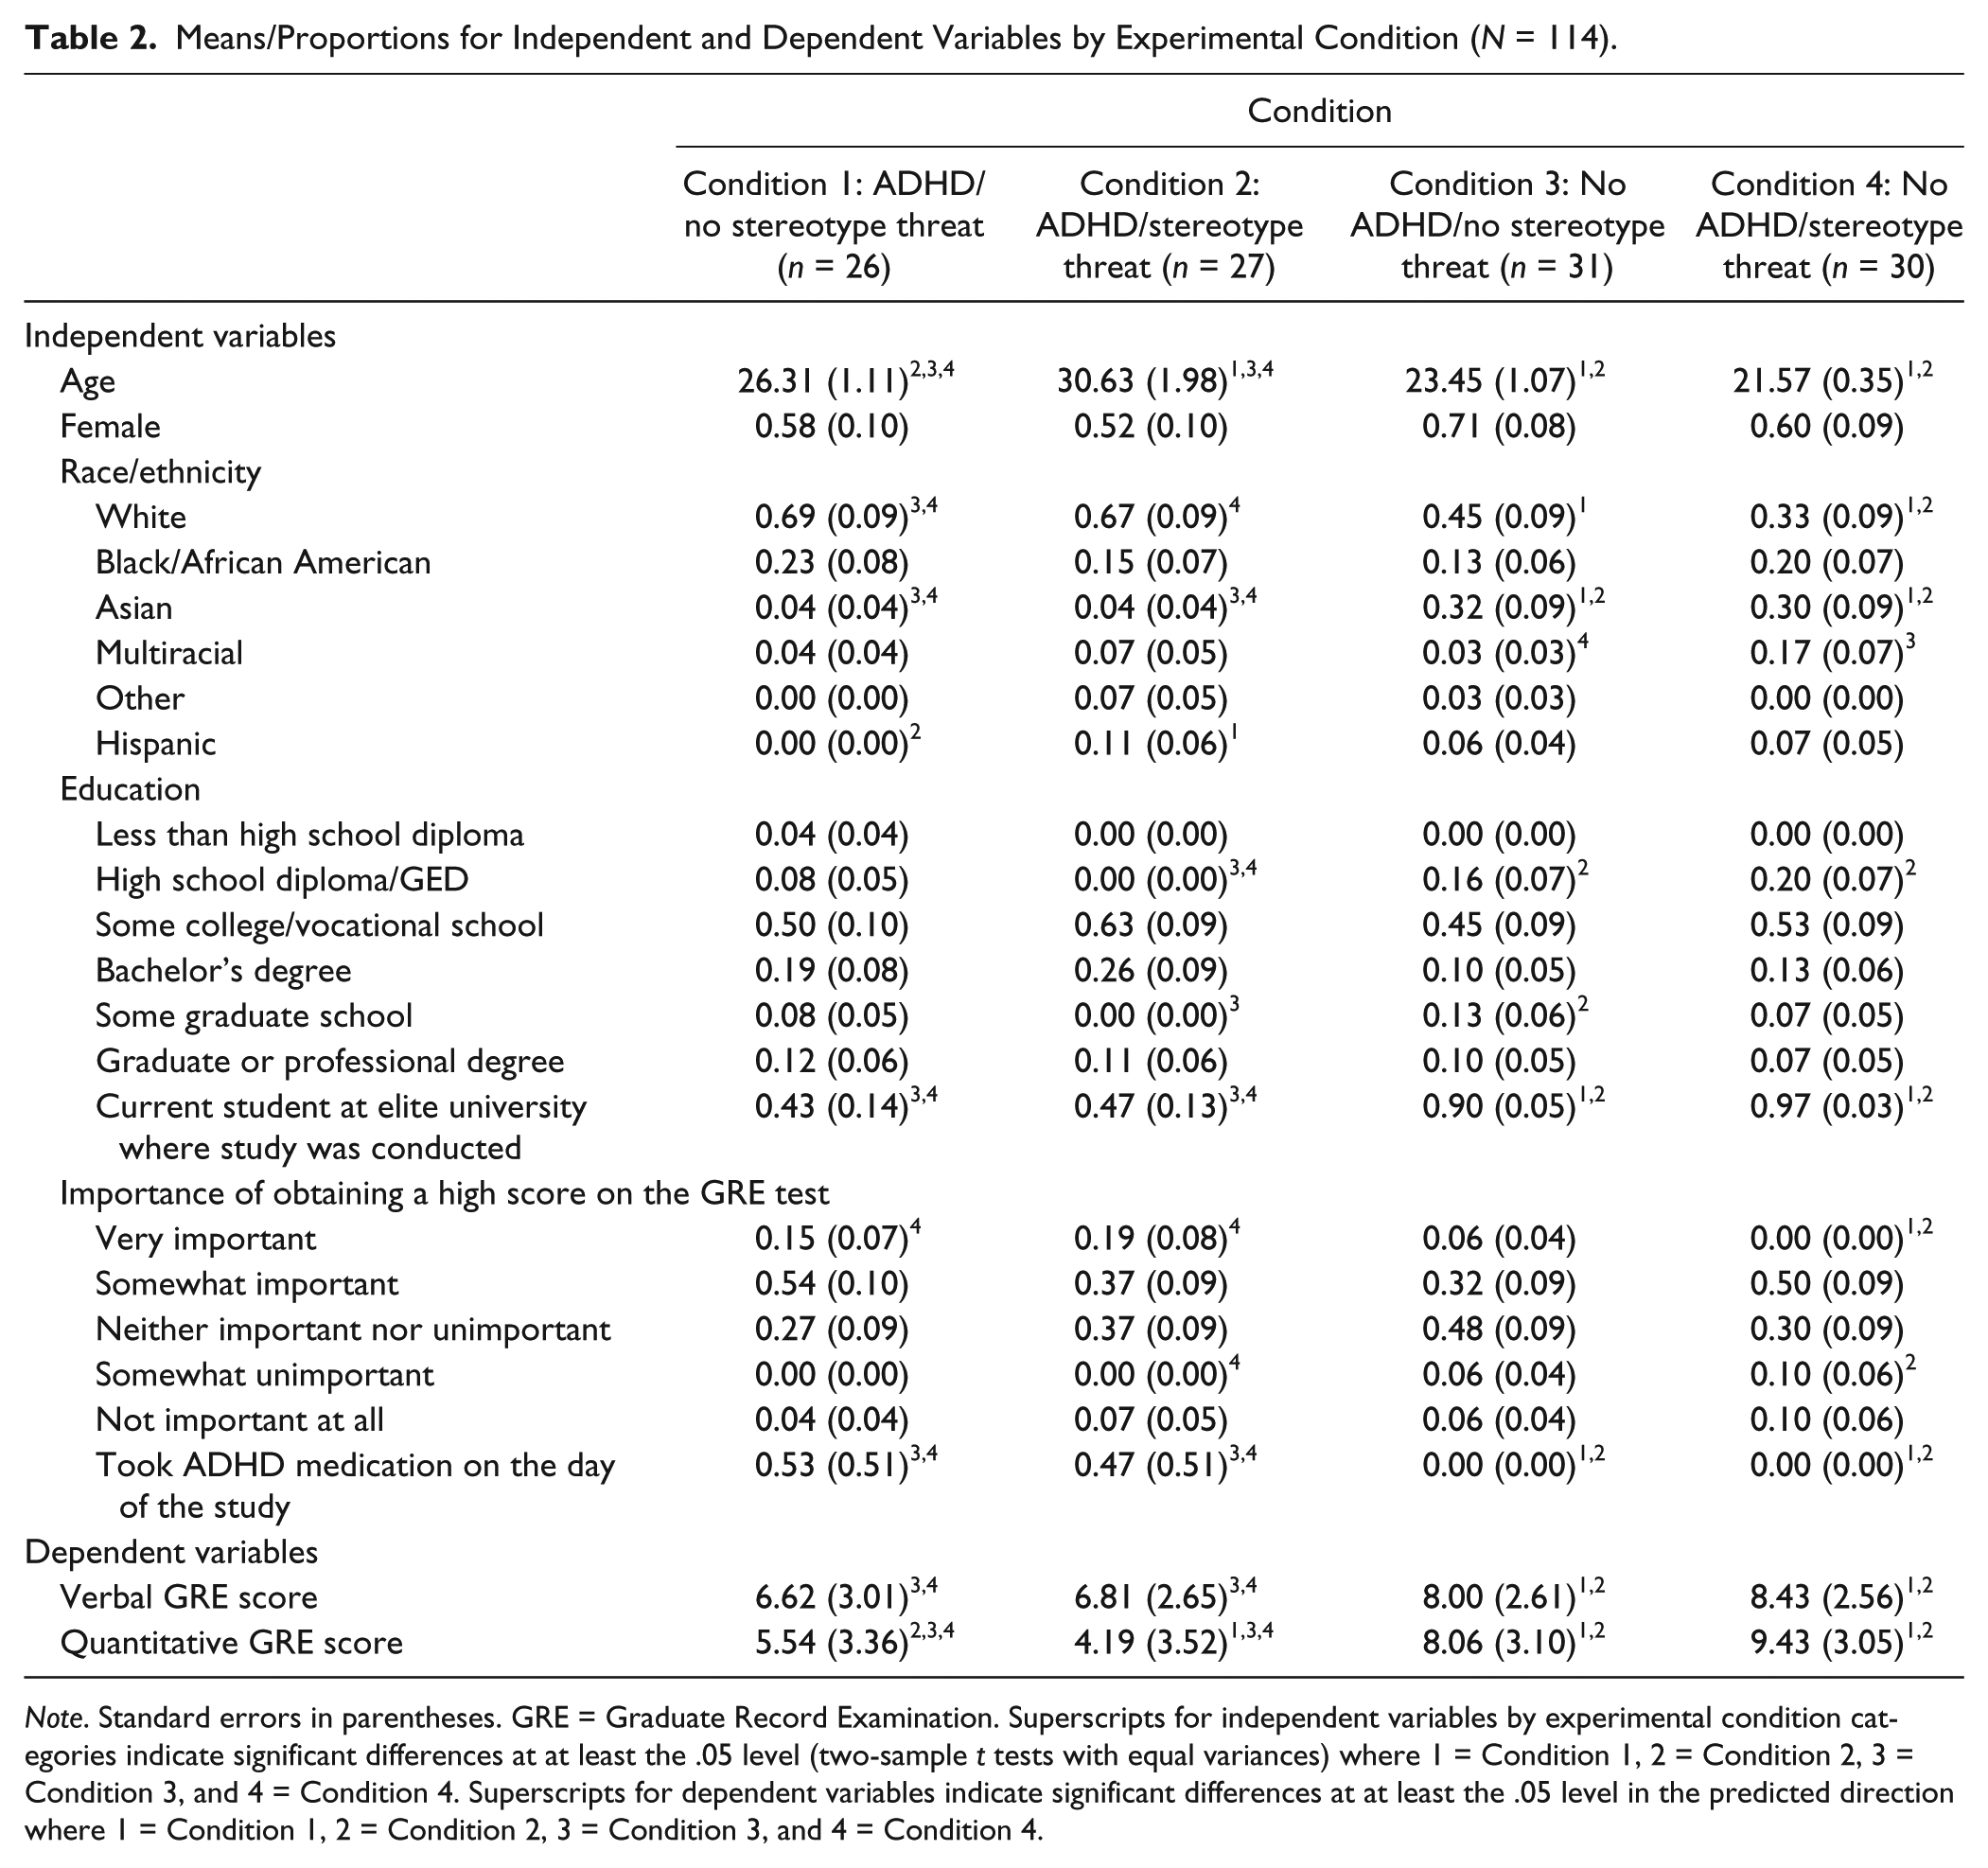
All analyses were performed using Stata 13. T tests comparing the full sample, ADHD-reporting participants, and participants not reporting ADHD (see Table 1) and t tests comparing each experimental condition with each other experimental condition on all independent and dependent variables (see Table 2) were conducted. Independent variables varying across conditions were noted. Comparisons of verbal and quantitative GRE scores were then made using ANCOVA models based on Type III sums of squares, with all independent variables which were significantly different (p < .05) across experimental conditions entered as covariates (see Tables 3 and 4). Although not significantly different between experimental conditions, gender was also included given the larger representation of women than men among the study’s sample. These ANCOVA analyses limited the sample to participants of traditional college age (to whom standardized testing would likely be most relevant). The National Center for Education Statistics (2015) defined traditional undergraduate students as those under the age of 25.
Means/Proportions for Independent and Dependent Variables by Experimental Condition (N = 114).
Note. Standard errors in parentheses. GRE = Graduate Record Examination. Superscripts for independent variables by experimental condition categories indicate significant differences at at least the .05 level (two-sample t tests with equal variances) where 1 = Condition 1, 2 = Condition 2, 3 = Condition 3, and 4 = Condition 4. Superscripts for dependent variables indicate significant differences at at least the .05 level in the predicted direction where 1 = Condition 1, 2 = Condition 2, 3 = Condition 3, and 4 = Condition 4.
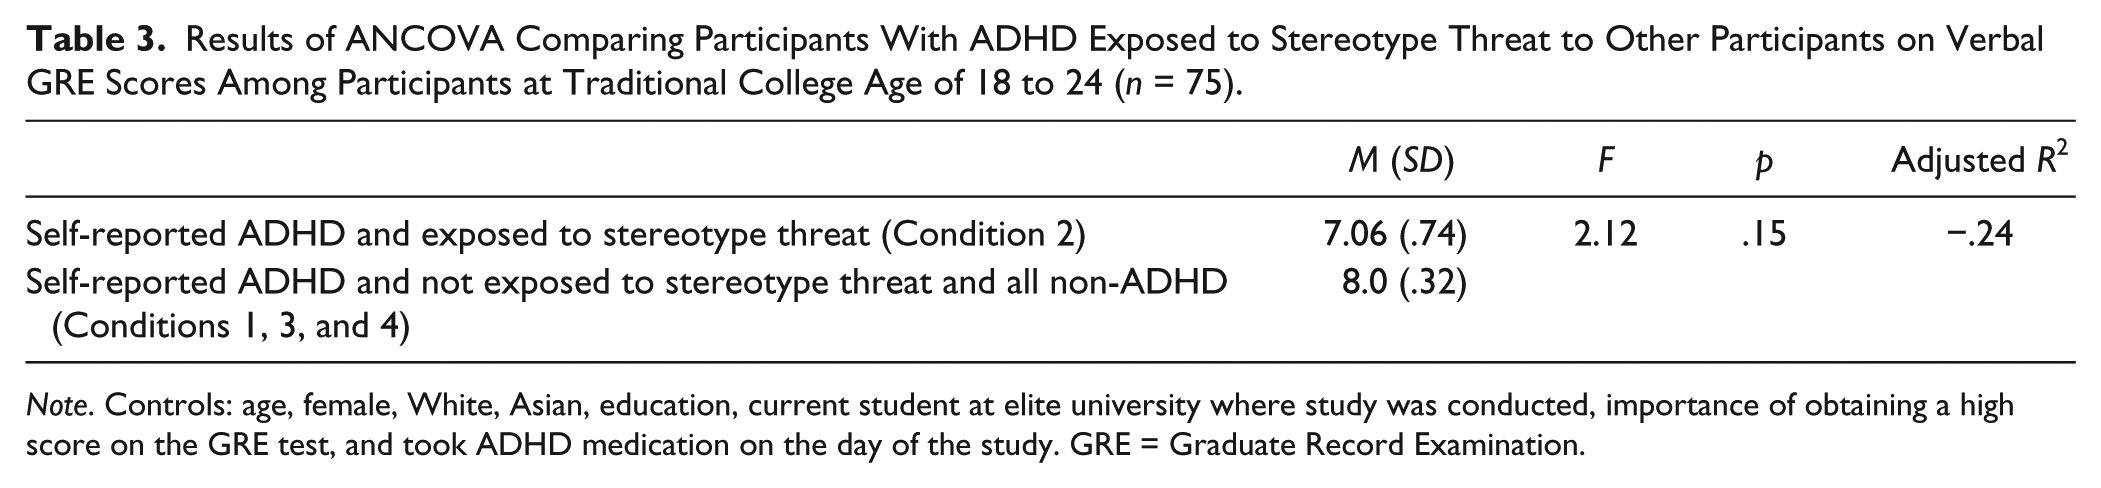
Results of ANCOVA Comparing Participants With ADHD Exposed to Stereotype Threat to Other Participants on Verbal GRE Scores Among Participants at Traditional College Age of 18 to 24 (n = 75).
Note. Controls: age, female, White, Asian, education, current student at elite university where study was conducted, importance of obtaining a high score on the GRE test, and took ADHD medication on the day of the study. GRE = Graduate Record Examination.
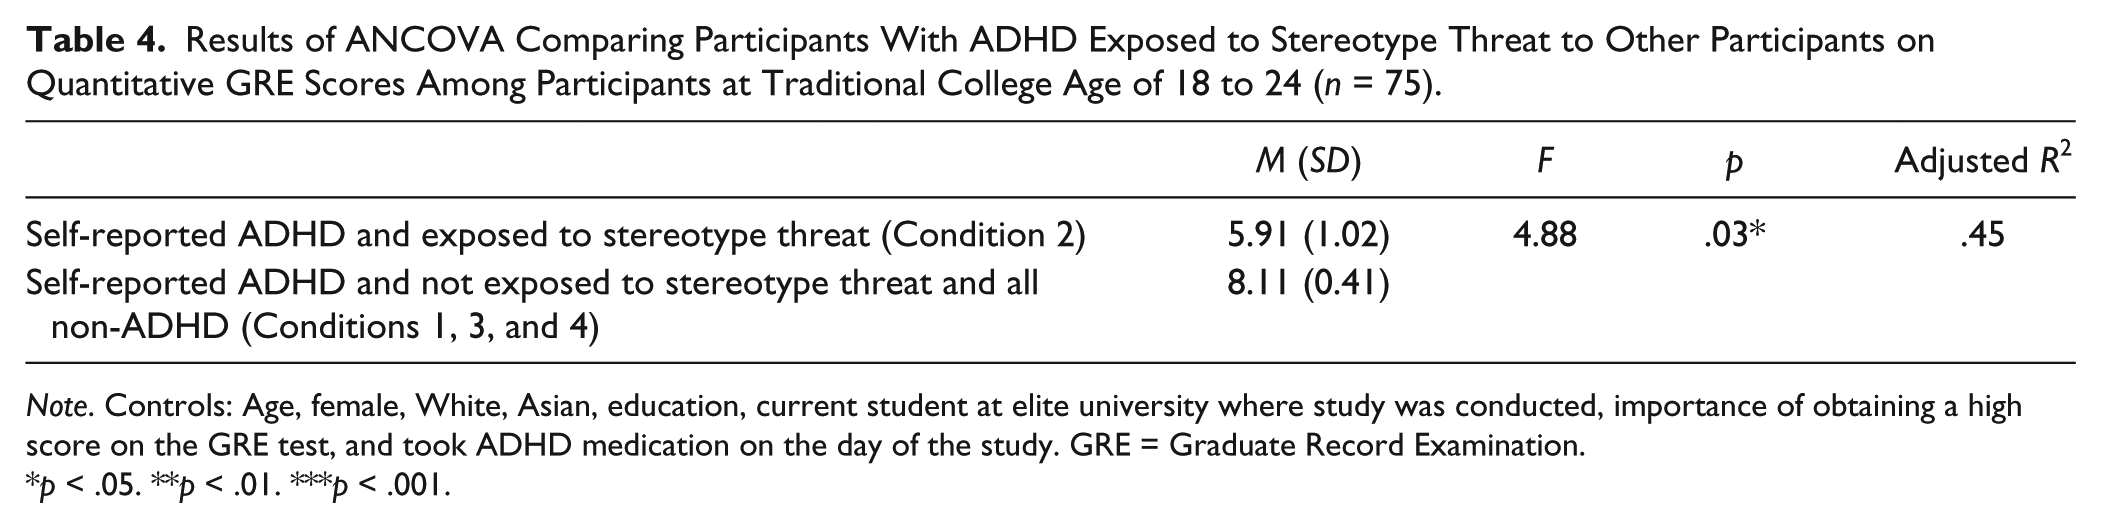
Results of ANCOVA Comparing Participants With ADHD Exposed to Stereotype Threat to Other Participants on Quantitative GRE Scores Among Participants at Traditional College Age of 18 to 24 (n = 75).
Note. Controls: Age, female, White, Asian, education, current student at elite university where study was conducted, importance of obtaining a high score on the GRE test, and took ADHD medication on the day of the study. GRE = Graduate Record Examination.
p < .05. **p < .01. ***p < .001.
The data fit the independence, normality, and homogeneity of variance assumptions of ANCOVA. Regarding the independence assumption, participants were randomly assigned to conditions. The normality assumption was tested via visual inspection of standardized normal probability plots constructed for each experimental condition for quantitative GRE scores and verbal GRE scores. As for the homogeneity of variance assumption, a Levene’s test fails to reject the null hypothesis of equal variances across conditions for both quantitative GRE scores (Pr > F = 0.91) and verbal GRE scores (Pr > F = .53).
Table 2 provides mean scores for the verbal and quantitative GRE sections. On the verbal section, participants reporting ADHD who were not exposed to stereotype threat had the lowest average score (Condition 1, 6.62 out of 15), followed by participants reporting ADHD exposed to stereotype threat (Condition 2, 6.81 out of 15), participants not reporting ADHD who were not exposed to stereotype threat (Condition 3, 8.00 out of 15), and participants not reporting ADHD who were exposed to ADHD-based stereotype threat (Condition 4, 8.43 out of 15). On the quantitative section, participants reporting ADHD who were exposed to stereotype threat had the lowest average score (Condition 2, 4.19 out of 14), followed by participants reporting ADHD not exposed to stereotype threat (Condition 1, 5.54 out of 14), participants not reporting ADHD who were not exposed to stereotype threat (Condition 3, 8.06 out of 14), and participants not reporting ADHD who were exposed to ADHD-based stereotype threat (Condition 4, 9.43 out of 14).
Hypothesis 1 posits that participants reporting ADHD will achieve lower average scores on GRE sections than participants not reporting ADHD. Table 1 compares participants reporting ADHD with participants not reporting ADHD on verbal and quantitative GRE scores. Consistent with Hypothesis 1, participants reporting ADHD achieved significantly lower average scores than participants not reporting ADHD on both verbal (6.72 vs. 8.21, p < .001) and quantitative (4.85 vs. 8.74, p < .001) sections.
Hypothesis 2 postulates that, among participants reporting ADHD, those explicitly exposed to stereotype threat will achieve lower average scores on GRE sections than those who are not. Inconsistent with Hypothesis 2, Table 2 reveals no significant difference in the average verbal section scores of participants reporting ADHD exposed to stereotype threat (Condition 2, 6.81) and participants reporting ADHD not exposed to stereotype threat (Condition 1, 6.62). However, on average, participants reporting ADHD exposed to stereotype threat (Condition 2) achieved significantly lower scores on the quantitative section (4.19 vs. 5.54, p < .05) than participants not reporting ADHD who were not exposed to stereotype threat (Condition 1). Thus, the data reveal partial evidence that stereotype threat diminishes test-taking performance among persons reporting ADHD. ANCOVA analyses controlling for age, gender, race, education, current student status at the university where the study was conducted, importance of the GRE questions to participants, and whether participants took ADHD medication on the day of the study revealed parallel evidence among participants at a traditional age for college. With all covariates entered, no significant difference was found in verbal GRE scores between participants reporting ADHD who were exposed to stereotype threat and participants reporting ADHD who were not exposed to stereotype threat (adjusted R2 = −.24, see Table 3). However, participants with ADHD exposed to stereotype threat achieved a significantly lower average quantitative GRE score than participants with ADHD not exposed to stereotype threat (adjusted R2 = .45, see Table 4).
Hypothesis 3 conjectures that participants reporting ADHD who are explicitly exposed to stereotype threat will obtain lower average scores on GRE questions than participants not reporting ADHD assigned to a condition explicitly designed to invoke stereotype threat in persons reporting ADHD. Consistent with Hypothesis 3, Table 2 reveals that participants reporting ADHD explicitly exposed to stereotype threat (Condition 2) obtained lower average scores on the verbal section (6.81 vs. 8.43, p < .001) and the quantitative section (4.19 vs. 9.43, p < .001) than participants not reporting ADHD who were exposed to ADHD-based stereotype threat (Condition 4).Overall, ADHD was negatively associated with verbal and quantitative test-taking performance. Persons reporting ADHD performed even worse on quantitative questions when exposed to stereotype threat. Finally, ADHD-based stereotype threat only affected those predicted to be impacted by it (persons reporting ADHD).
Discussion
This study is the first to specifically address the role of stereotype threat among persons reporting ADHD on questions from a test regularly used for university admission. In doing so, it extends stereotype threat research by illuminating whether a domain-relevant mental disorder can serve as a basis for stereotype threat, thereby diminishing test performance. The symptomatology of ADHD is directly relevant to test-taking (as attention and focus are important components of success on standardized testing in a timed environment). Furthermore, given ETS’ history of providing accommodations on standardized tests for ADHD via an evaluation process that necessitates proof of academic impairment (such as low performance on previous standardized tests), the process of obtaining accommodations during the test registration process itself may invoke stereotype threat that impedes actual test performance. Thus, it is important to understand whether or not stereotype threat is relevant to persons reporting ADHD.
Consistent with the relevance of ADHD to the test-taking environment, participants in this study reporting ADHD—regardless of condition—performed at a lower level than persons not reporting ADHD. However, over and above the impact of simply having ADHD, stereotype threat appeared to further impede the performance of persons reporting ADHD in answering quantitative GRE questions. As with previous research (Quinn et al., 2004), exposure to stereotypes outside of their relevant category (when participants not reporting ADHD were exposed to circumstances designed to create stereotype threat in persons with ADHD) did not impede performance.
Previous stereotype threat research indicates a number of possible reasons why those for whom negative stereotypes about ADHD were relevant were affected as they were completing the quantitative GRE section. Most simply, the threat of confirming negative stereotypes about people with ADHD’s ability to perform effectively may have distracted participants reporting ADHD in the stereotype threat condition from the task at hand (Steele & Aronson, 1995). In addition, those who are exposed to stereotype threat may experience a decrease in positive emotions, which inhibits functioning (Kang & Chasteen, 2009). Concern with confirming negative stereotypes may also lead to individuals’ self-handicapping (Steele & Aronson, 1995). Although not specifically tested for in this study, certain actions, such as intentionally neglecting to take medication to relieve the symptoms of ADHD, could function as self-handicapping mechanisms specific to persons with ADHD.
Whatever the relevant mechanisms, this study reveals that stereotype threat, in addition to impeding performance on so many other bases, has relevance to ADHD. Coupled with existing evidence regarding general mental illness and history of depression as triggers for stereotype threat (Quinn et al., 2004), this study provides confirmatory information suggesting that stereotype threat may pose problems both at the broad conceptual level (pertaining to general stereotypes about mental illness) and at the diagnosis-specific level (pertaining to particular mental disorder labels). Stereotype threat poses a serious concern, then, for those affected by mental illness insofar as it impedes test-taking performance, potentially negatively influencing future educational and vocational prospects. This is particularly true given that stereotype threat in specific task situations can have spillover effects, depleting self-control resources needed for other related or unrelated life challenges (Inzlicht, Tullett, Legault, & Kang, 2011).
There are a number of reasons why this study may represent a conservative test of stereotype threat. First, given the difficulty of recruiting participants with ADHD, 31 of the 53 participants reporting ADHD (13 in Condition 1, the non-stereotype threat condition, and 18 in Condition 2, the stereotype threat condition) were recruited using the recruitment text indicating that researchers were looking for participants with ADHD given that such individuals are generally not included in tests of experimental GRE questions. This more direct form of recruitment may have resulted in a more conservative test of the difference between the stereotype threat and non-stereotype threat ADHD conditions, as participants in Condition 1 may have been implicitly affected by stereotype threat through the attention to their disorder raised by the form of recruitment used. However, recruitment was typically detached from actual participation in the study by several days, and emphasis was placed on the study as a test of experimental GRE questions.
In addition, this may have been a conservative test of stereotype threat for other reasons. It is possible that participants reporting ADHD in the non-stereotype threat condition experienced indirect stereotype threat by virtue of the test-taking situation. Furthermore, the sample for this study was highly educated on average (both in general and specifically among its participants reporting ADHD). This being the case, participants reporting ADHD in this sample may have been uncharacteristically high-achieving and, in many cases, had found ways to mitigate their test-taking deficits at least enough to successfully enter higher education. A sample with lower education might have yielded a stronger contrast between those participants reporting ADHD who were explicitly exposed to stereotype threat and those who were not. Future research is necessary to delineate between test-takers at differing levels of ability in assessing the impact of ADHD-induced stereotype threat on performance.
Footnotes
Acknowledgements
I gratefully thank the National Science Foundation’s Division of Social and Economic Sciences for funding this study and Linda K. George, Lynn Smith-Lovin, Deborah T. Gold, and Kenneth I. Spenner for helpful comments on earlier versions of this manuscript.
Declaration of Conflicting Interests
The author(s) declared no potential conflicts of interest with respect to the research, authorship, and/or publication of this article.
Funding
The author(s) disclosed receipt of the following financial support for the research, authorship, and/or publication of this article: This study was supported by National Science Foundation SBE Doctoral Dissertation Grant: 1030117.