



Abstract
Introduction
ADHD is a common disorder in childhood and one of the most frequent conditions affecting school performance. Studies analyzed at the international level cite prevalence rates ranging from 5% to 7% in the school-age population (Polanczyk, Willcutt, Salum, Kieling, & Rohde, 2014; Steinau, 2013). This disorder is characterized by a persistent behavioral pattern associated with inattention, over-activity (or hyperactivity), and difficulty in controlling impulses, leading to four subcategories or presentations: the combined presentation, the predominantly inattentive presentation, the inattentive/restrictive presentation, and the predominantly impulsive/hyperactive presentation (hereafter I/H; American Psychiatric Association [APA], 2013).
Recent research on ADHD highlights the existence of an executive function (EF) impairment in this population, which would explain its difficulty in controlling impulsive responses, resisting interference, organizing activities in a sequential manner, and sustaining cognitive effort while performing an activity (Barkley & Murphy, 2010; García, González-Pienda, Rodríguez, Álvarez, & Álvarez, 2014).
Given the symptomatic complexity of ADHD (Biederman, Petty, Evans, Small, & Faraone, 2010; Ramos-Quiroga et al., 2012) and its high prevalence rates (Polanczyk et al., 2014), professionals must have reliable and valid instruments to diagnose this disorder. In this context, questionnaires based on behavioral observations, including the Evaluation of Attention Deficit and Hyperactivity (EDAH; Farré & Narbona, 2001), the Behavior Assessment System for Children (BASC; Reynolds & Kamphaus, 2004), the Child Behavior Checklist (CBCL; Achenbach, 1991), and the Conners’ scales (Conners, 1995), are widely used to detect the key symptoms of ADHD (Moeller, Barratt, Dougherty, Schmitz, & Swann, 2014). However, the use of these instruments as the sole assessment measure has certain limitations, including potential subjectivity on the part of the observer (García, González-Castro, Areces, Cueli, & Rodriguez, 2014).
Other widely used tests in ADHD diagnosis are those based on a participant’s performance, with the most important being the so-called Continuous Performance Test (CPT). Within this group, Conners’ CPT (Conners, 1995), the Children Sustained Attention Task (CSAT; Servera & Llabrés, 2004), the Integrated Visual and Auditory Test (VAT; Tinius, 2003), and the Test of Variables of Attention (TOVA; Greenberg, 1993) are noteworthy. These tests provide quantitative data on different variables of interest (e.g., omissions, commissions, response time, variability, and post-commission response time) and have been shown to be useful in examining the relationships between various performance variables and the phenotypic behavior of ADHD students (Epstein et al., 2003) and in the differential diagnosis of ADHD and its different presentations (Bart, Raz, & Dan, 2014; González-Castro, Rodríguez, López, Cueli, & Álvarez, 2013; Miranda et al., 2012). In particular, the research conducted by González-Castro and collaborators analyzes performance in CPTs (specifically, the TOVA) in a wide sample of students between 8 and 13 years of age with the three different presentations of ADHD (i.e., combined, predominantly inattentive, and I/H presentations) and controls.
However, this type of test is commonly criticized for its low ecological validity (García, González-Castro et al., 2014; Gioia, Kenworthy, & Isquith, 2010). According to these authors, attention deficit, motor hyperactivity, and cognitive impulsivity do not always occur when a child is in a small room, with a single adult, and under controlled contextual conditions, as is often the case in testing situations. These conditions differ considerably from those present in real life.
Various studies indicate that the use of tools based on virtual reality represents a breakthrough in the diagnosis of ADHD, precisely because it allows comparing control and ADHD groups in a realistic environment (Adams, Finn, Moes, Flannery, & Rizzo, 2009; Bioulac et al., 2012; Iriarte et al., 2012). In this sense, it is necessary to highlight that the closest precedent of the AULA Nesplora would be the so-called “Virtual Reality Classroom” (Adams et al., 2009; Rizzo et al., 2001). Although the AULA Nesplora follows the same logic as its predecessor, that is, presenting a task of sustained attention and inhibition of responses in the context of a virtual classroom, it represents a step forward in the sense that it provides information differentiated by the sensory channel (visual and auditory), type of task (x-go and x-no go), and presence or absence of distractors, in addition to providing a reliable indicator of motor activity during performance (Díaz-Orueta et al., 2014). Therefore, this test would provide more detailed and accurate information than the CPTs traditionally employed. The research conducted by previous authors has found that AULA Nesplora was even able to discriminate between children with ADHD under medication and those with no medication via the indicators offered by the test.
Along the same lines, previous studies using virtual reality tools have limitations that must be taken into account. One limitation relates to the sample size, as is the case for the research conducted by Adams et al. (2009), which consists of a sample of 19 participants with ADHD and 16 controls, 8 to 16 years of age. Although the results indicate lower performance levels and a greater tendency to distraction in the former group, the reduced sample size represents an issue when generalizing results. Perhaps in this case, referring to trends would be more appropriate. Another limitation relates to the fact that, to date, no study has considered the type of presentation of ADHD. Thus, the potential discriminative utility of the test has not yet been studied in this regard. Therefore, the present study aims to analyze the effectiveness of AULA Nesplora in discriminating among the three groups of students with ADHD (inattentive, I/H, and combined presentations) and a control group. To analyze its effectiveness, the variables studied by the test (omissions, commissions, response time, and motor activity) are taken into account to address the following: a general measure of the indicators provided, the task type (go vs. no-go), the influence of contextual features (presence vs. absence of distractors), and the sensory modality in which stimuli are presented (visual vs. auditory channels).
Given that the different presentations of the disorder are characterized by differential symptoms, there should exist different behaviors in the diagnostic groups studied in addition to differences between ADHD and controls, with the contextual characteristics of the task acting as an important constraint in students’ performance.
In this regard, at a general level (without taking into account the contextual characteristics of the task) and bearing in mind the results of previous studies (Díaz-Orueta et al., 2014), the symptoms associated with impulsivity and hyperactivity are expected to present through an increasing number of commissions and greater motor activity. Conversely, the characteristic symptoms of inattention should be expressed as an increasing number of omissions and greater response times.
More specifically, the group with a predominantly I/H presentation, characterized by low inhibition and little resistance to distraction, is expected to perform worse than the remaining groups in the presence of distractors (i.e., more commissions and increased motor activity) because distractors generate increased levels of impulsivity in participants. By contrast, in the absence of distractors, it is likely that combined and inattentive presentations show lower performances (especially regarding omissions and response time), given that in the absence of distractors, sustaining attention plays a large role, whereas impulsivity control comes in second.
Third, regarding the type of channel presenting the stimuli (auditory vs. visual) and taking into account the influence of prior training derived from the everyday use of new technologies (the use of computers, game consoles, etc.), poorer discrimination in the visual channel in comparison with the auditory channel is expected between the different presentations in the response time variable, as previous training tends to decrease response times considerably, which in turn diminishes the differences between students with ADHD and controls.
Finally, with respect to the type of task (i.e., go/no-go protocols), considering that the first task correlates with impulsivity symptoms, worse results will be obtained by predominantly I/H and combined presentations, with a large number of commissions and increased motor activity. By contrast, for the second task, aimed at measuring attention, worse results are expected at the level of omissions and response time mainly in the group with inattentive and combined presentations.
Method
Participants
This study made use of a non-probabilistic clinical sample composed of 90 males (76.9%) and 27 females (23.1%) between 5 and 16 years of age (M = 11.18 years, SD = 3.10 years) and with an average IQ of 105.17 (SD = 13.52). The participants in the ADHD groups were identified according to the Diagnostic and Statistical Manual of Mental Disorders (5th ed.; DSM-5; APA, 2013), resulting in a control group (n = 28, 23.93%), an inattentive ADHD group (n = 28, 23.93%), an I/H ADHD group (n = 29, 24.78%), and an ADHD combined group (n = 32; 27.35%; Table 1).
Descriptive Statistics for IQ, Ages, and EDAH Scale.
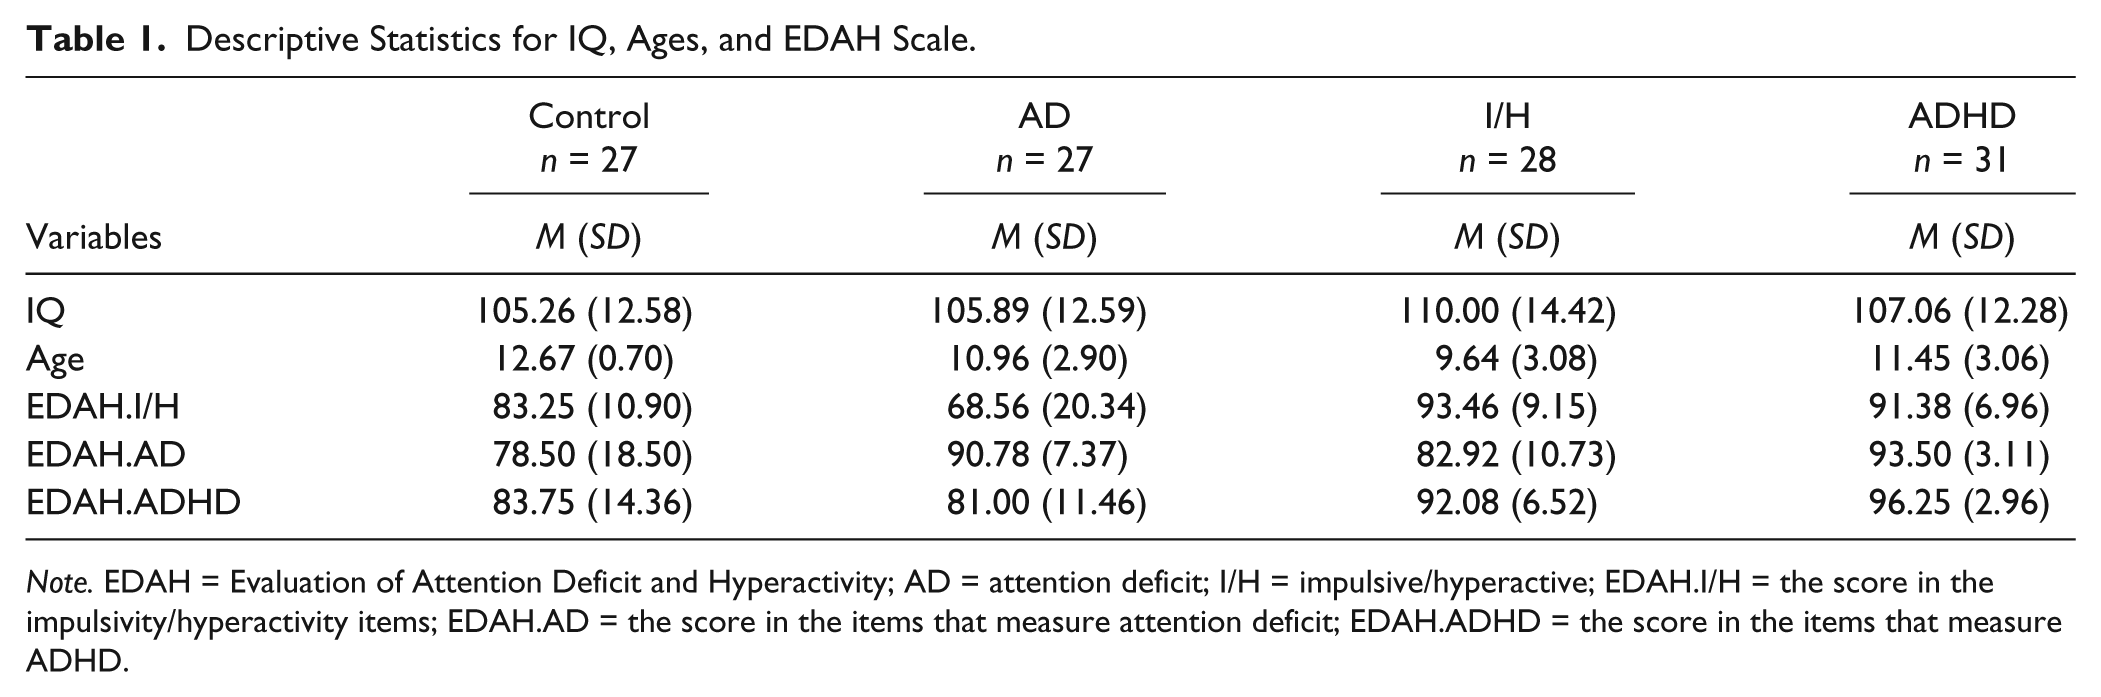
Note. EDAH = Evaluation of Attention Deficit and Hyperactivity; AD = attention deficit; I/H = impulsive/hyperactive; EDAH.I/H = the score in the impulsivity/hyperactivity items; EDAH.AD = the score in the items that measure attention deficit; EDAH.ADHD = the score in the items that measure ADHD.
No statistically significant differences were found between the groups with respect to IQ (p = .539), but minor differences in age appeared, F(3, 109) = 4.964, p = .003, η2 = .120. However, both variables are included as covariates in subsequent statistical analyses.
Inclusion criteria
First, the Wechsler Intelligence Scale for Children–IV scale (WISC-IV; Wechsler, 2005) was used to eliminate participants with an IQ lower than 80 and greater than 130. None of the participants with ADHD was receiving medication at the time of assessment.
A MANOVA lead to statistically significant differences between the three comparison groups, λ = .484, F(9, 224) = 2.919, p = .005; η2= .215. Table 1 shows that the measures of attention deficit (EDAH.AD), F(3, 114) = 3.478; p = .027; η2= .240, and hyperactivity/impulsivity (EDAH.I/H), F(3, 114) = 4.908; p = .006;η2= .309, were used separately and jointly (EDAH.ADHD), F(3, 114) = 5.222; p = .005;η2 = .322.
Instruments
The following instruments were used to perform the present study:
The WISC-IV by Wechsler (2005) is a tool that assesses individual intelligence in children and adolescents between the ages of 6 years and 16 years 11 months. In this study, it was used to obtain a measure of total IQ (TIQ).
The Scale for the Assessment of ADHD (EDAH; Farré & Narbona, 2001) was administered to families. It comprises 20 items that provide information on the presence of symptoms relating to attention deficit and hyperactivity/impulsivity and helps differentiate between predominantly I/H, inattentive, and combined ADHD. A score above 90% in its subscales indicates attention deficit, hyperactivity/impulsivity, or both. In this case, the following variables were taken into account: EDAH.I/H (the score in the impulsivity/hyperactivity items), EDAH.AD (the score in the items that measure attention deficit), and EDAH.ADHD (the score in the items that measure ADHD).
AULA Nesplora (Climent, Banterla, & Iriarte, 2011) is the main object of study. This continued assessment task evaluates attention, impulsivity, processing speed, and motor activity in participants between 6 and 16 years of age. The task is performed in a virtual reality environment, which is shown through three-dimensional (3D) glasses (Head Mounted Display, HMD) equipped with motion sensors and headphones. The virtual stage presented through the HMD is similar to a classroom. The participant takes the perspective of a student sitting in one of the desks and facing the chalkboard. Head movements are detected by sensors located in the glasses; thus, the software updates the angle of vision, giving the participant the feeling of actually being in a virtual classroom.
The test consists of three phases that are gradually explained by a virtual teacher. The objective of the first phase is to immerse the participant in the context of virtual reality, and it consists of visually locating balloons and popping them. Below is a task based on the “x-no” paradigm (traditionally known as “no-go”) in which the participant must press a button provided that he or she does not see or hear the stimulus “apple.” Finally, an “x” paradigm (or “go”) is incorporated, with participants being asked to press a button whenever they see or hear the number “seven.” Thus, not only the delivery response but also its inhibition is assessed. The variables provided by the instrument do not differ from those of other CPTs regarding attention deficit and hyperactivity/impulsivity measures; however, they complement this information, differentiating these measures by the sensory modality (visual vs. auditory), presence/absence of distractors, and task type (go vs. no-go). These measures are the following:
Omissions: These are errors that occur when the participant must respond to the target stimulus but does not do so. It is a measure related to selective and focused attention. AULA Nesplora offers a general index called total omissions, in addition to more specific indicators, where omissions are differentiated by the sensory modality (auditory vs. visual omissions), presence of distractors (omissions with vs. without distractors), and type of task (omissions in x-no vs. X).
Commissions: These occur when the participant clicks on the button, even if the target stimulus has not been presented. This measure correlates with a lack of motor control or inhibition of response. AULA Nesplora also offers the previous measures for this variable: total commissions by the sensory modality, presence of distractors, and task.
Average response time: Average response time is the reaction time in milliseconds, and it is used as a measure for processing speed. AULA Nesplora collects the values for this variable under the same conditions noted for the two previous variables. Response times are measured not only when correct answers are provided but also when errors by commission occur.
Motor activity: The 3D glasses used in this test have a motion sensor that records the entire motor activity of the participant during the test. In this manner, head movements are captured to register their frequency and relevance (i.e., required vs. unnecessary movements). The score in this variable is related to the motor hyperactivity associated with ADHD. The latter variable does not consider the distinction between visual and auditory channels because the test does not consider this differential measurement. High scores in these indicators represent a deficit.
Procedure
Considering the objective of this research, we studied participants with ADHD who came to the clinical service for a diagnosis. To that end, once parental consent to evaluate the children was provided, the corresponding tests were conducted to verify the diagnosis and to participate in this research.
Data Design and Analysis
This study used as ex post facto descriptive-comparative design for four groups, three corresponding to the three types of ADHD presentations and a control group.
First, the descriptive statistics for the variables under study were analyzed, with special attention to asymmetry and kurtosis values. Kline’s (2011) criterion, according to which the maximum scores accepted for asymmetry and kurtosis range between 3 and 10, was employed. The results indicated that the variables met this criterion, which allowed parametric analysis. Subsequently, to analyze the differences between the groups, a MANCOVA was performed, using age and IQ as covariates. The dependent variables were the attention measures derived from the gross AULA Nesplora scores (omissions, commissions, response time, and motor activity). These measures were taken globally (total scores in the test) and separately for the different conditions offered by the test (presence vs. absence of distractors, auditory vs. visual channel, and X vs. no-X task) to determine whether these conditions differently affect the presentations of ADHD. The group was the independent variable. Once the existence of statistically significant differences was verified, to determine in which diagnostic groups these differences lie, a post hoc analysis was conducted using Scheffé’s test for multiple statistical comparisons. Cohen’s (1988) delta was used as a measure of effect size. Cohen’s classic work defines a small effect size as η2 = .010 (Cohen’s d = 0.20), a medium effect size as η2 = .059 (Cohen’s d = 0.50), and a large effect size as η2 = .138 (Cohen’s d = 0.80).
SPSS 19 (Arbuckle, 2010) was used in the analysis of data, establishing p< .05 as the criterion for statistical significance.
Results
As shown in Table 2 and according to the Kline (2011) criteria, it was found that the variables had a normal distribution.
Descriptive Statistics for AULA Nesplora Variables.

Note. AD = attention deficit; I/H = predominantly hyperactive/impulsive presentation; ADHD = combined presentation; Cont. = control group; M = mean; SD = standard deviation; O = omissions; C = commissions; RT = response time associated with a correct answer; MA = motor activity during the activities; x-no go = the individual should not hit the button before the target stimulus; x-go = the individual should hit the button before the target stimulus.
Table 3 shows the results of the MANCOVA, taking into account age and IQ as covariates. These results show the general measures of AULA Nesplora first and then for each of the conditions of the test separately. As shown, statistically significant differences were found between the groups. In this regard, it is worth noting that high scores in the different test indicators are related to poor performance.
Differences Among the Groups for Each AULA Nesplora Variable.

Note. O = omissions; AD = attention deficit; ADHD = combined presentation; C = commissions; I/H = predominantly hyperactive/impulsive presentation; Cont. = control group; RT = response time associated with a correct answer; MA = motor activity during the activities; DA = predominantly inattentive presentation; x-no go = the individual should not hit the button before the target stimulus; x-go = the individual should hit the button before the target stimulus.
p< .05. **p< .005. ***p< .001.
General Measures
In terms of the general measures, the MANCOVA indicated the existence of statistically significant differences between groups, λ = .449, F(13, 105) = 44.240, p < .001,η2 = .145. IQ yielded no differences (p = .270), but age did, F(4, 104) = 29.075, p < .001,η2 = .558. These differences were found in the different variables studied, effect sizes being considerably higher in the case of commissions and omissions (Table 2). As might be expected, differences were found not only between the control group and the different groups with ADHD but also among the three presentations. In this sense, the omissions variable detected differences among the groups that share an inattention component (AD and ADHD) and controls, with a larger deficit in the former two groups. The commission variable differed between those groups with an impulsivity/hyperactivity component (I/H and ADHD) and controls and between the two presentations. The presence of impulsivity/hyperactivity symptoms was related to a greater number of commissions. Differences in motor activity were very similar to those found in commissions (here, with differences between the AD and I/H groups), indicating greater activity in the groups with impulsivity/hyperactivity components. Finally, response time showed differences between the predominantly inattentive group and the control group, with the former group having slower performances.
Sensory Channel
The results of the test were analyzed based on the sensory channel. A MANCOVA was conducted separately for each sensory modality. In the visual channel, after controlling for IQ (p = .244) and age effects, F(3, 105) = 44.240, p < .001,η2 = .558, statistically significant differences were found between the groups, λ = .624, F(9, 255) = 6.070, p < .001, η2 = .145. It should be noted that, specifically in the omissions variable, differentiating between the control and the combined group was possible; the combined group had poorer scores. The commissions variable, however, distinguished between the presentations that share impulsive and hyperactive symptoms (I/H and combined presentation) and between these and the inattentive presentation or the control group. The reason is the I/H and the combined presentations have the worst scores in that variable. The response time in the visual channel revealed no differences across presentations because the four groups obtained similar response times.
When performing the same analysis for the auditory channel, after controlling for the IQ (p = .885) and age covariates, F(3, 105) = 24.021, p < .001,η2 = .407, there were also statistically significant differences, λ = .697, F(9, 255) = 4.552, p < .001, η2 = .114. The results showed the effectiveness of each variable in differentiating between diagnostic groups. When analyzing the omissions variable, it was possible to differentiate between predominantly inattentive and I/H presentations; the former group had worse scores. Regarding commissions, it was possible to distinguish between the predominantly I/H and the combined presentations and also between each one of these presentations and the control group. Regarding response time, although there were no differences between groups concerning the visual channel, when examining variables related to the auditory channel, it was possible to distinguish between the inattentive and I/H presentations.
Presence/Absence of Distractors
A differential analysis relating the conditions offered by AULA Nesplora and the presence or absence of distractors was conducted. For the analysis of the results in the absence of distractors, IQ (p = .239) and age were taken as covariates F(4, 104) = 32.471, p < .001,η2 = .555, and the existence of statistically significant differences between the groups was detected, λ = .627, F(12, 275) = 4.432, p < .001,η2 = .144. Given the significance of the results, the post hoc analysis demonstrated the discriminatory power of the different variables analyzed. Specifically, the omissions variable allows differentiating between the control group and those presentations that share the inattention component (predominantly inattentive and combined presentations). By contrast, the commissions variable allows differentiating between predominantly I/H and inattentive presentations and the control group. Response time distinguished the control group from the inattentive and combined presentations. Similarly, the analysis of the motor activity variable made it possible to differentiate the I/H presentation from the inattentive presentation and the control group.
When analyzing the results in the presence of distractors, the same covariates were considered: IQ (p = .814) and age λ = .603, F(4, 104) = 17.141, p < .001,η2 = .397, and significant differences were found between the groups: λ = .606, F(12, 275) = 4.777, p < .001,η2 = .154. As in the presence of distractors, the omissions variable distinguished between the control and the inattentive and combined presentation groups. In terms of the commission variable, in addition to differentiating between the same groups that showed differences in the presence of distractors (predominantly inattentive presentation from I/H presentation and the control group), it allows discriminating between the combined presentation and the control group. However, unlike the previous situation (in the presence of distractors), response time only distinguishes between the control group and the predominantly inattentive presentation. With regard to motor activity, it was possible to distinguish between the I/H presentation and the inattentive presentation as well as the control group.
X/No-X Paradigm
We conducted a MANCOVA for each task type used by the AULA Nesplora test. Similar to the previous analysis, in Task 1 (no-X), the effect of the variables was controlled: IQ (p = .177) and age, F(4, 104) = 22.124, p < .001,η2 = .460, pointing to statistically significant differences between the groups, λ = .631, F(12, 275) = 22.124, p < .001,η2 = .142. Thus, it was observed that omissions discriminate between the control group and inattentive and combined presentations. Commissions allowed distinguishing between the I/H and inattentive presentations and the control group, in addition to differentiating between the combined presentation and the control group. With regard to response time, there were no differences between the groups. Motor activity distinguished between the control group and the I/H and combined presentations.
The same analysis was performed for Task 2, taking IQ (p = .176) and age as covariates, F(4, 104) = 24.438, p < .001, η2 = .485, and statistically significant differences were also found λ = .746, F(12, 275) = 2.692, p < .001,η2 = .093. In this case, the omissions variable has a discriminatory power different from that presented in other situations, showing differences between the control group and the presentations with impulsive and hyperactive symptoms (I/H and combined). The commission variable follows the same line as in previous cases, showing differences between the control group and the combined and inattentive presentations and between the combined and inattentive presentations. As in Task 1, the response time variable does not present differences among groups. However, motor activity has established differences between the I/H and inattentive presentations and between the control group and the I/H presentation.
Discussion and Conclusion
The objective of this study was to verify the effectiveness of the AULA Nesplora test in discriminating between the different presentations of ADHD and between these presentations and the control group, and the results showed the effectiveness of the diagnostic test for differentiating between presentations. In addition, considering that ADHD in its inattentive presentation that often goes unnoticed (Rodriguez et al., 2009) because it does not present disruptive behavior in the classroom, it is relevant to use evidence such as that provided by the AULA Nesplora test that allows its discrimination from a control group or the different presentations of ADHD (I/H or combined presentation).
Thus, after analyzing the variables in each of the conditions referred to by the test, it was found that all of them made it possible to distinguish between predominantly I/H and combined presentations with respect to the control group and between I/H and inattentive presentations. By contrast, differentiation between certain presentations has only been demonstrated under one of the conditions analyzed.
First, analyzing the general indicators provided by the test showed results similar to those obtained in previous studies (Egeland, 2007; González-Castro et al., 2013). ADHD presentations sharing inattention as a symptomatic component (inattentive and combined presentations) showed a greater number of omissions and response time. However, the presentations characterized by impulsivity and/or hyperactivity (presentation I/H and combined) showed a greater number of commissions and a high level of motor activity.
Subsequently, after analyzing the performance of the presentations of ADHD both in the presence and absence of distractors, the presence of a stable performance profile for each was detected. In both cases, I/H presentation has been characterized by a large number of commissions and a high level of motor activity, whereas the predominantly inattentive presentation obtained lower performance levels for omissions and response time (Iriarte et al., 2012). However, contrary to expectations, both the control group and the different presentations of ADHD showed lower performance levels in the absence of distractors. This finding may be because distractors in the AULA Nesplora test provide motivation for the task, which positively affects participants’ performance.
In terms of the sensory channel, it was found that the analysis of visual and auditory channels separately hints at differences between presentations that were undetected in other conditions established by the test. Thus, differences between the I/H and combined presentations are only evidenced in the omissions registered by the visual channel, with the I/H presentation having lower performance levels. However, the distinction between the inattentive and combined presentations has only been manifested in the commission variable through the auditory channel, with the result that the inattentive presentation has increased response times. These results suggest that analysis of the indicators by sensory modality is relevant for providing a differential diagnosis of ADHD and its presentations (Sancho, Pardo, González, & García, 2015). In addition, the data obtained are consistent with previous studies (Grizenko, Paci, & Joober, 2009) that indicated inattentive presentation as having behavior substantially different from the other presentations. Furthermore, it was observed that the response time collected by the visual channel presents no differences between groups. As described in one of the baseline hypotheses, this absence of differences may be due to the training effect in the visual channel, which causes a significant decrease in response times.
Regarding the type of task, Climent et al. (2011) argue that the x-go task is effective in the identification of inattention symptoms whereas the x-no go task is more effective in the detection of inhibitory deficits; the results in the present study show a different pattern. Specifically, the x-go task has not shown inattention symptoms because it has not allowed for a clear distinction between the predominantly inattentive presentation and the control group. This finding may be because it is a simple task, and the number of errors due to omission, although higher than in the control group, had no significant differences. No-go tasks established differences among the I/H and inattentive participants and controls. In this sense, x-nogo inhibition tasks not only show symptoms of impulsivity and hyperactivity in the predominantly I/H presentation (Diaz-Orueta, et al., 2014; Iriarte et al., 2012) but also negatively affect the inattentive presentation.
Therefore, these results confirm that AULA Nesplora shows a tendency to effectively detect the different presentations of ADHD, with certain differences when analyzing the same variables under different conditions.
The results obtained in the present study may be useful in guiding practitioners toward a better interpretation and diagnosis on the basis of the information provided by this test.
However, some limitations of the study should be considered in future research. First, the sample size must be expanded to check whether the discriminative capacity shown by the evidence in the present study is maintained. In addition, it would be desirable to expand this evaluation through the use of tests that evaluate performance functions such as planning, working memory, and cognitive flexibility, which have been shown to play an important role in the diagnosis of ADHD (García et al., 2014) and would, therefore, produce a more complete diagnostic profile.
Footnotes
Declaration of Conflicting Interests
The author(s) declared no potential conflicts of interest with respect to the research, authorship, and/or publication of this article.
Funding
The author(s) disclosed receipt of the following financial support for the research, authorship, and/or publication of this article: This work has been supported by a project of the Principality of Asturias (FC-15-GRUPIN14-053) and a predoctoral grant from the Severo Ochoa Program (BP14-030).