



Abstract
Introduction
ADHD has major public health significance, due to its multinational prevalence of 3.4% to 4.4%, and associated educational, psychological, and social impairment (Fayyad et al., 2007; Kessler et al., 2006). Metabolic syndrome (MetSyn) is a combination of risk factors for cardiovascular disease and diabetes, which include obesity (National Cholesterol Education Program (NCEP) Expert Panel on Detection, Evaluation, & Treatment of High Blood Cholesterol in Adults (Adult Treatment Panel III), 2002). The criteria are at least three of the following conditions: abdominal obesity, raised levels of triglycerides and fasting glucose, low high-density lipoprotein (HDL) cholesterol, and hypertension (NCEP Expert Panel on Detection, Evaluation, & Treatment of High Blood Cholesterol in Adults [Adult Treatment Panel III], 2002). The prevalence of MetSyn has been increasing (Grundy, 2008), and it presents a significant public health challenge.
While there is theoretical discussion of a possible link between ADHD and MetSyn (Nousen, Franco, & Sullivan, 2013), to our knowledge, the relationship between these two disorders has not been clearly investigated. One study found that adults with ADHD have a higher risk of body mass index (BMI) > 25, high low-density lipoprotein, and diastolic blood pressure > 90 mmHg (Spencer, Faraone, Tarko, McDermott, & Biederman, 2014). We now outline an etiological model where comorbid ADHD is linked to an increased risk of MetSyn because of the following associated symptoms: psychiatric and somatic comorbidities, core ADHD symptoms, and sleep disturbance.
With regard to psychiatric comorbidity, ADHD coexists with depressive and anxiety disorders in 18% to 23% of cases (Kessler et al., 2006; Pineiro-Dieguez, Balanza-Martinez, Garcia-Garcia, & Soler-Lopez, 2014). The most common comorbid psychiatric disorders in adult ADHD are anxiety (47%) and depressive disorders (38%; Kessler et al., 2006). In turn, affective disorders have also been associated with ADHD symptoms (Bron, Bijlenga, Verduijn, et al., 2016), higher BMI and obesity (de Wit, Fokkema, et al., 2010; de Wit, Luppino, et al., 2010; van Reedt Dortland, Giltay, van Veen, Zitman, & Penninx, 2010), and MetSyn (Kahl et al., 2015). Results are not uniform (Hildrum, Mykletun, Midthjell, Ismail, & Dahl, 2009). In practice, clinicians frequently treat ADHD in the presence of psychiatric comorbidities. The difficulty of studying the relationship between ADHD and MetSyn is that affective disorders may comprise a potential confounder or may add to the risk of developing MetSyn.
Concerning somatic comorbidities, there are indications that a diagnosis of ADHD may increase the likelihood of developing chronic diseases (Bijlenga, van der Heijden, et al., 2013; Semeijn et al., 2013). ADHD has been linked to an increased prevalence of smoking, which may partly account for this increased risk (Pomerleau, Downey, Stelson, & Pomerleau, 1995). Despite the paucity of research on MetSyn and ADHD, the relationship between obesity and ADHD has been investigated (Cortese, Ramos Olazagasti, et al., 2013; Docet, Larranaga, Fernandez Sastre, & Garcia-Mayor, 2010; Pagoto et al., 2009). Overall, the risk of obesity in ADHD for children and adults appears to be elevated, according to a recently published meta-analysis, which did control for comorbid affective disorders (Cortese et al., 2016). In children, results vary with age, sex, and medication status (Biederman, Spencer, Monuteaux, & Faraone, 2010; Byrd, Curtin, & Anderson, 2013; Fliers et al., 2013; Kim, Mutyala, Agiovlasitis, & Fernhall, 2011; Racicka, Hanc, Giertuga, Brynska, & Wolanczyk, 2015; Waring & Lapane, 2008). Some studies found increased BMI for ADHD children (Biederman et al., 2010; Erhart et al., 2012; Fliers et al., 2013; Holtkamp et al., 2004; Racicka et al., 2015; Waring & Lapane, 2008). From the literature and as reviewed by Cortese and Vincenzi (Cortese & Vincenzi, 2012), some studies did not account for comorbidities, lacked an ADHD diagnosis or controls (Cortese & Vincenzi, 2012; Kim et al., 2011; Linares, Martinez-Martin, & Castellanos, 2013; Tenore & Tenore, 2012; Waring & Lapane, 2008). Other studies have not found this relationship (Cortese & Vincenzi, 2012; Dubnov-Raz, Perry, & Berger, 2011; Lingineni et al., 2012; McCarthy, 2013; Pauli-Pott, Becker, Albayrak, Hebebrand, & Pott, 2013; Poulton et al., 2013; Radesky, Reddy, Steiner, & Augustyn, 2013). Childhood psychopathology (including ADHD) has been associated with increased adult BMI (Cortese, Ramos Olazagasti, et al., 2013; Korczak, Lipman, Morrison, Duku, & Szatmari, 2014; McClure, Eddy, Kjellstrand, Snodgrass, & Martinez, 2012) and obesity (von Stumm et al., 2011). But some studies did not examine affective disorders as possible confounders (Cortese & Vincenzi, 2012).
In adults, most studies do show a significant relationship between ADHD and obesity (Alfonsson, Parling, & Ghaderi, 2012, 2013; Altfas, 2002; Cortese, Ramos Olazagasti, et al., 2013; de Zwaan et al., 2011; Fleming, Levy, & Levitan, 2005; Fuemmeler, Ostbye, Yang, McClernon, & Kollins, 2011; Gruss, Mueller, Horbach, Martin, & De Zwaan, 2012; Pagoto et al., 2009), as well as overweight status (Bijlenga, van der Heijden, et al., 2013). Some of these studies controlled for the possible confounder of affective disorders (Alfonsson et al., 2012, 2013; Cortese, Ramos Olazagasti, et al., 2013; de Zwaan et al., 2011; Fuemmeler et al., 2011; Gruss et al., 2012; Pagoto et al., 2009), but others did not (Altfas, 2002; Bijlenga, van der Heijden, et al., 2013). Adults with extreme obesity and remitted affective disorders had a higher prevalence of ADHD (Altfas, 2002). ADHD was also more prevalent in obese women (Fleming et al., 2005), and bariatric surgery patients, compared with the general population (Alfonsson et al., 2012). Impaired attention in obese participants has recently been linked to low-grade inflammation (Lasselin et al., 2016). In contrast to studies confirming these associations, an epidemiological study by Cortese, Faraone, Bernardi, Wang, and Blanco (2013) did not show a significant relationship between persistent, lifetime, or remitted ADHD and obesity (N = 34,653) after controlling for affective disorders.
ADHD core symptoms may partly explain the relationship between adult ADHD and obesity, a component of MetSyn. These core symptoms include poor planning, impulsivity and delay aversion, which may influence food choices, resulting in a raised BMI (Altfas, 2002; Davis, Levitan, Smith, Tweed, & Curtis, 2006). Unhealthy diet and shorter intervals between meals may be associated with MetSyn (Baik, Lee, Jun, Lee, & Shin, 2013). Eating at night has been associated with ADHD (Docet, Larranaga, Perez Mendez, & Garcia-Mayor, 2012) and increased BMI (Lucassen et al., 2013).
Finally, sleep disturbances may also link ADHD and MetSyn and form part of the etiological model. They include late chronotype, delayed sleep onset and shorter total sleep duration (Bijlenga, Van Someren, et al., 2013; Bron, Bijlenga, Kooij, et al., 2016). Sleep disturbances have been linked to increased BMI with and without ADHD (Bayon, Leger, Gomez-Merino, Vecchierini, & Chennaoui, 2014; Bijlenga, van der Heijden, et al., 2013).
In short, according to this etiological model, ADHD is associated with a combination of factors, which may all increase the risk for MetSyn. The present study is the first to examine the potential association between MetSyn, obesity-related outcomes and clinical comorbid ADHD symptoms, in a large sample with different stages of affective disorders. Our hypothesis is that according to our etiological model, adult ADHD adds to the risk for MetSyn, beyond the frequently associated affective disorders.
Method
Participants
Participants took part in the Netherlands Study of Depression and Anxiety (NESDA), an 8-year longitudinal, naturalistic cohort study of 2,981 participants, aged 18 to 65 years (Penninx et al., 2008). Participants were recruited from different health care settings (community, primary, and specialized mental health care) and included a group without psychiatric symptoms (“Controls”) and others in different developmental stages of affective disorders. A full description of NESDA has been reported elsewhere (Penninx et al., 2008). Ethical Review Boards of all participating centers approved the NESDA study protocol. All participants gave written informed consent at enrollment. Our sample comprised 2,307 respondents, in whom ADHD symptoms were checked at the 4-year follow-up after baseline (77.4% of total sample).
Materials
Connors Adult ADHD Rating Scale (CAARS)
To identify those respondents with clinical ADHD symptoms, the CAARS–Self Report: Screening Version (CAARS-S:SV) was used at the 4-year follow-up assessment of NESDA. As ADHD is a lifelong condition starting in childhood (Michielsen et al., 2012), we believed it was acceptable to use data from the 4-year follow-up assessment for ADHD, and baseline data for other parameters. The CAARS-S:SV is a 30-item questionnaire that assesses ADHD symptoms and behaviors. The 18-item Total symptom scale identifies Diagnostic and Statistical Manual of Mental Disorders (4th ed.; DSM-IV; American Psychiatric Association, 1994) criteria for ADHD (Inattention [IA] and Hyperactivity/Impulsivity symptoms [H/I]; range of possible scores = 0-54). The 12-item ADHD Index scale identifies ADHD behaviors (range of possible scores = 0-36). The CAARS-S:SV uses a 4-point Likert-type scale rating current behavior and problems. Ratings range from 0 (not at all, never) to 3 (very much, very frequently). Several studies have confirmed the validity and reliability of the CAARS-S:SV (Kooij et al., 2008). For this study, the raw CAARS-S:SV scores were converted into standardized scores (T-scores) using age- and sex-corrected norm values (Conners, Erhardt, & Sparrow, 1999). The ADHD group was defined as those participants obtaining a T-score value of 65 or above (on either the Total symptom or Index scales), indicating clinically significant ADHD symptoms. For the analysis, we also identified a group of participants with a T-score of > 70 (above 98th percentile) on these two scales. We calculated the CAARS-S:SV sum score (range = 0-90) by combining the Index with the Total score, permitting us to assess ADHD symptoms comprehensively (diagnostic criteria and behaviors). Finally, to determine specific risks of ADHD symptom domains, we analyzed high IA (cutoff T > 65; n = 165; 7.2%) and high H/I symptoms (cutoff T > 65; n = 81; 3.5%).
We chose to study only those ADHD participants with comorbid affective disorders to estimate more accurately any added risk of ADHD for MetSyn. Of the 2,307 persons with CAARS-S:SV data, only four participants (<1%) had ADHD without comorbid affective disorders, and these were excluded from the analysis as this group was too small to yield meaningful results. The total number used in the analyses was therefore 2,303 (77.3% of baseline sample). Two or fewer items were missing on either the Index or Total score for 108 participants (4.6%). Here, values were imputed using simple imputation.
Composite International Diagnostic Interview (CIDI-21)
Depressive disorder (major depressive disorder and dysthymia) and anxiety disorders (panic disorder, social phobia, agoraphobia, or generalized anxiety disorder) were assessed at the baseline visit using the DSM-IV CIDI-2.1 by trained research staff (World Health Organization [WHO], 1997). The reliability and validity of the CIDI are high: Interrater agreements for all diagnoses are excellent (Wittchen et al., 1991), and test–retest reliability is also satisfactory (Wittchen et al., 1991). We used lifetime diagnoses of affective disorders.
MetSyn and obesity-related outcomes
MetSyn was defined at baseline following the widely used adjusted Adult Treatment Panel III criteria (NCEP Expert Panel on Detection, Evaluation, & Treatment of High Blood Cholesterol in Adults (Adult Treatment Panel III), 2002). MetSyn was considered present if three or more criteria were met: (a) waist circumference >102 cm (men), >88 cm (women); (b) triglycerides ≥1.7 mmol/l or use of medication for hypertriglyceridemia; (c) HDL cholesterol <1.03 mmol/l (men), <1.30 mmol/l in women, or use of medication for reduced HDL cholesterol; (d) blood pressure ≥130/85 mmHg, or use of antihypertensive medication; and (e) fasting plasma glucose ≥5.6 mmol/l, or use of anti-diabetic medication. Waist circumference was measured with a tape midway between the lower rib margin and the iliac crest over light clothing. Fasting triglycerides, HDL, and glucose levels were determined using standard laboratory method. Blood pressure was defined as the average of two successive Omron monitor readings on the right arm, in a supine position. In addition, we also looked separately at the MetSyn count (number of MetSyn risk factors). BMI and waist–hip ratio (ratio of waist to hip circumferences) were used as measures of obesity-related outcomes.
Covariables
Sociodemographic variables included age, sex, and years of education. Potential confounders associated with ADHD, affective disorders, and MetSyn were also included. Lifestyle and health covariables included smoking (nonsmoker/current smoker; Pomerleau et al., 1995), alcohol use (number of alcohol consumptions/week: Alcohol Use Disorders Identification Test; Edwards & Kendler, 2012), and physical activity, as assessed using the valid and reliable International Physical Activity Questionnaire (IPAQ; Kurtze, Rangul, & Hustvedt, 2008). The IPAQ is a 7-item self-reporting questionnaire, which measures time spent on physical activity during the previous week. The overall energy expenditure estimate is expressed in Metabolic Equivalent Total (MET)-minutes per week. We assessed the number of self-reported chronic diseases diagnosed and under treatment, as determined during a 21-item, face-to-face interview.
The use of psychotropic, lipid altering, antihypertensive, or antidiabetic medications in the previous month, was recorded after drug container inspection and coded according the WHO Anatomical Therapeutic Chemical (ATC) classification (WHO, 2006). Antidepressants included selective serotonin reuptake inhibitors (SSRI; ATC code: N06AB), serotonin-norepinephrine reuptake inhibitors (SNRI; N06AX16, N06AX21), tricyclics (N06AA), and tetracyclics (N06AX03, N06AX05, N06AX11). All anxiolytics identified were benzodiazepines (N03AE). Centrally acting psychostimulants (N06BA) were also identified. The use of any of these medications was rated positive if the participant had used it on at least 50% of days during the past month. We defined a variable termed other psychotropic medications because of their potential impact on MetSyn. This group included corticosteroids (H02, R03BA, R03AK, D07), antiepileptics (carboxamide and fatty acid derivatives; N03AF, N03AG), anticholinergics (A03AA, A03AB), and antipsychotics (N05A).
Statistical analyses
Means and standard deviations for continuous data, and frequencies and percentages for categorical data, were reported. Between-group comparisons (controls, depressive and anxiety disorders without ADHD: D/A − ADHD, depressive and anxiety disorders with ADHD: D/A + ADHD) were made using chi-square and analysis of variance (ANOVA) tests. Linear regressions were performed for all continuous outcome measures, with a log-transformation for triglycerides because of extreme skewness. In the logistic regression, presence of MetSyn was the outcome variable. The ADHD predictor variables used in analyses were ADHD (yes/no), high IA (yes/no), high H/I symptoms (yes/no), and the continuous CAARS-S:SV sum score. All regression models were analyzed in a univariable regression model (Model 1), then adjusted for covariables age, sex, and education (Model 2), additionally adjusted for depressive/anxiety disorders (Model 3), and finally adjusted for lifestyle and health covariables (smoking, exercise, number of chronic diseases, and use of antidepressants, Model 4). Data were analyzed using SPSS for Windows (Version 16; IBM Company, Chicago, Illinois, USA). Statistical significance was inferred at p ≤ .05.
Results
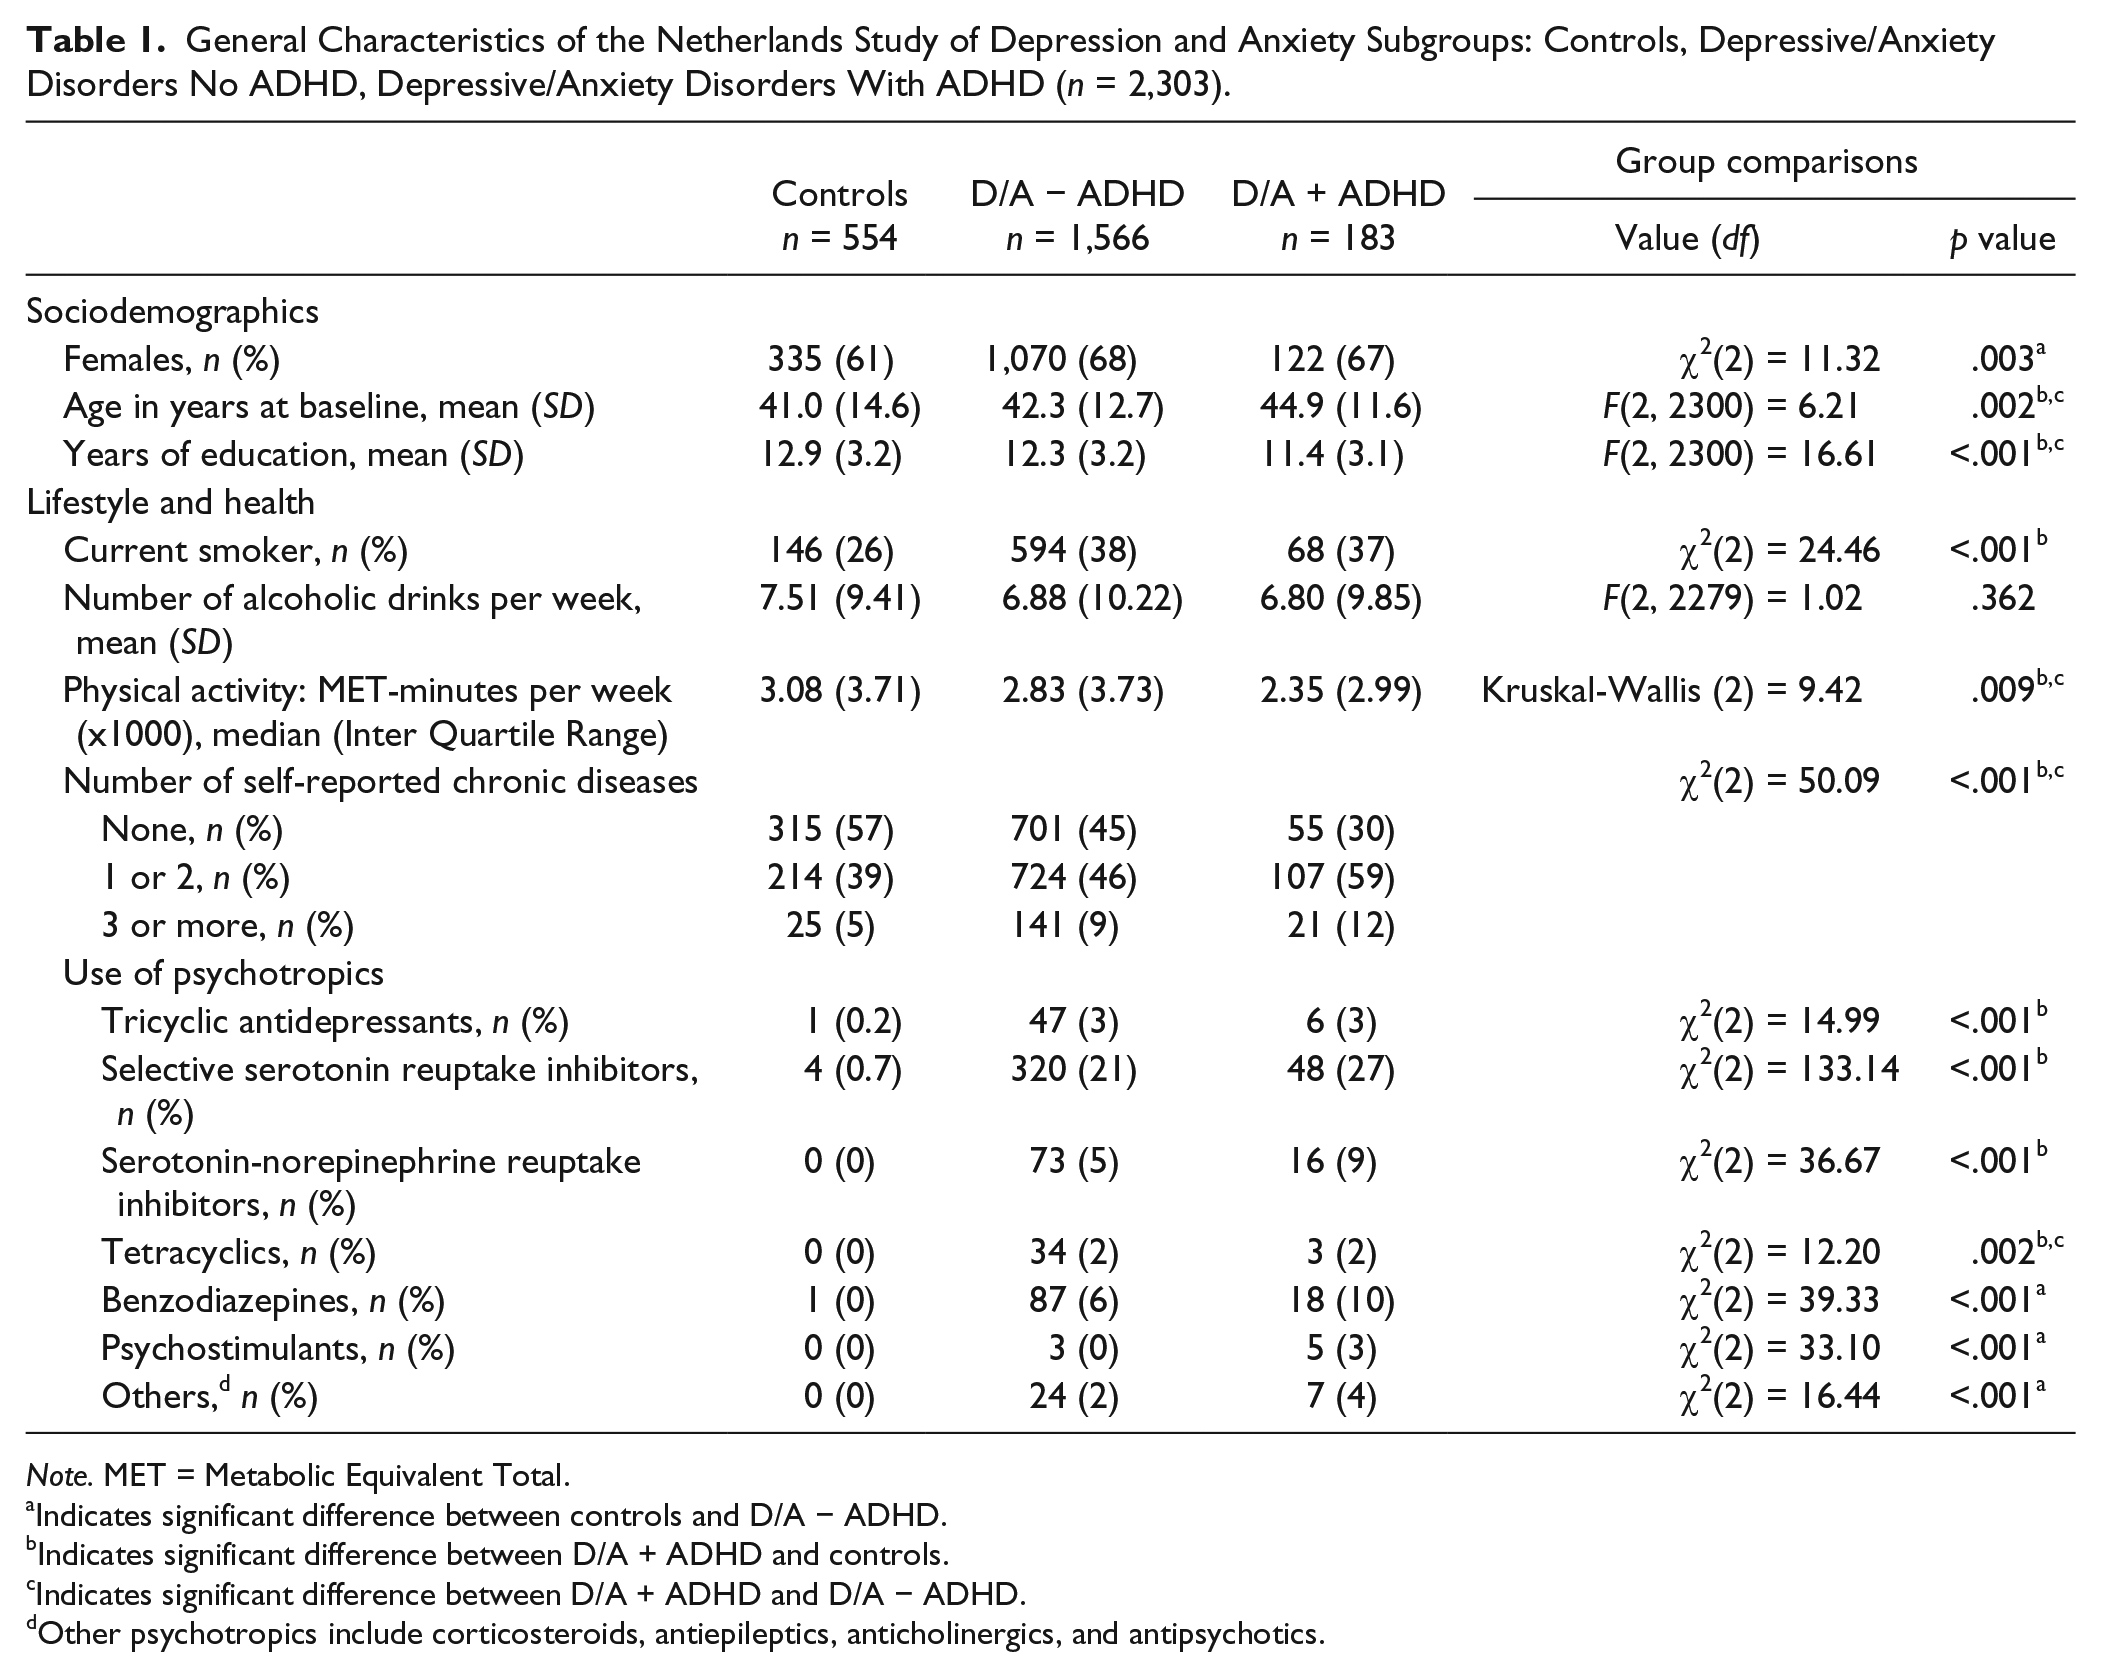
General characteristics of the three groups are described in Table 1. The groups (controls, n = 554; D/A − ADHD, n = 1,566) differed significantly in their numbers of women. Participants in the D/A + ADHD group (n = 183) were both significantly older, and had fewer years of education than in the other two groups. The D/A + ADHD group contained significantly more current smokers than controls. They also exercised significantly less and had three or more self-reported chronic diseases significantly more often than members of the two other groups. Apart from SSRI use, few used psychotropic drugs. While we identified 183 participants with clinical comorbid ADHD symptoms (T-score > 65 on CAARS-S:SV scale), only three were using stimulant medication.
General Characteristics of the Netherlands Study of Depression and Anxiety Subgroups: Controls, Depressive/Anxiety Disorders No ADHD, Depressive/Anxiety Disorders With ADHD (n = 2,303).
Note. MET = Metabolic Equivalent Total.
Indicates significant difference between controls and D/A − ADHD.
Indicates significant difference between D/A + ADHD and controls.
Indicates significant difference between D/A + ADHD and D/A − ADHD.
Other psychotropics include corticosteroids, antiepileptics, anticholinergics, and antipsychotics.
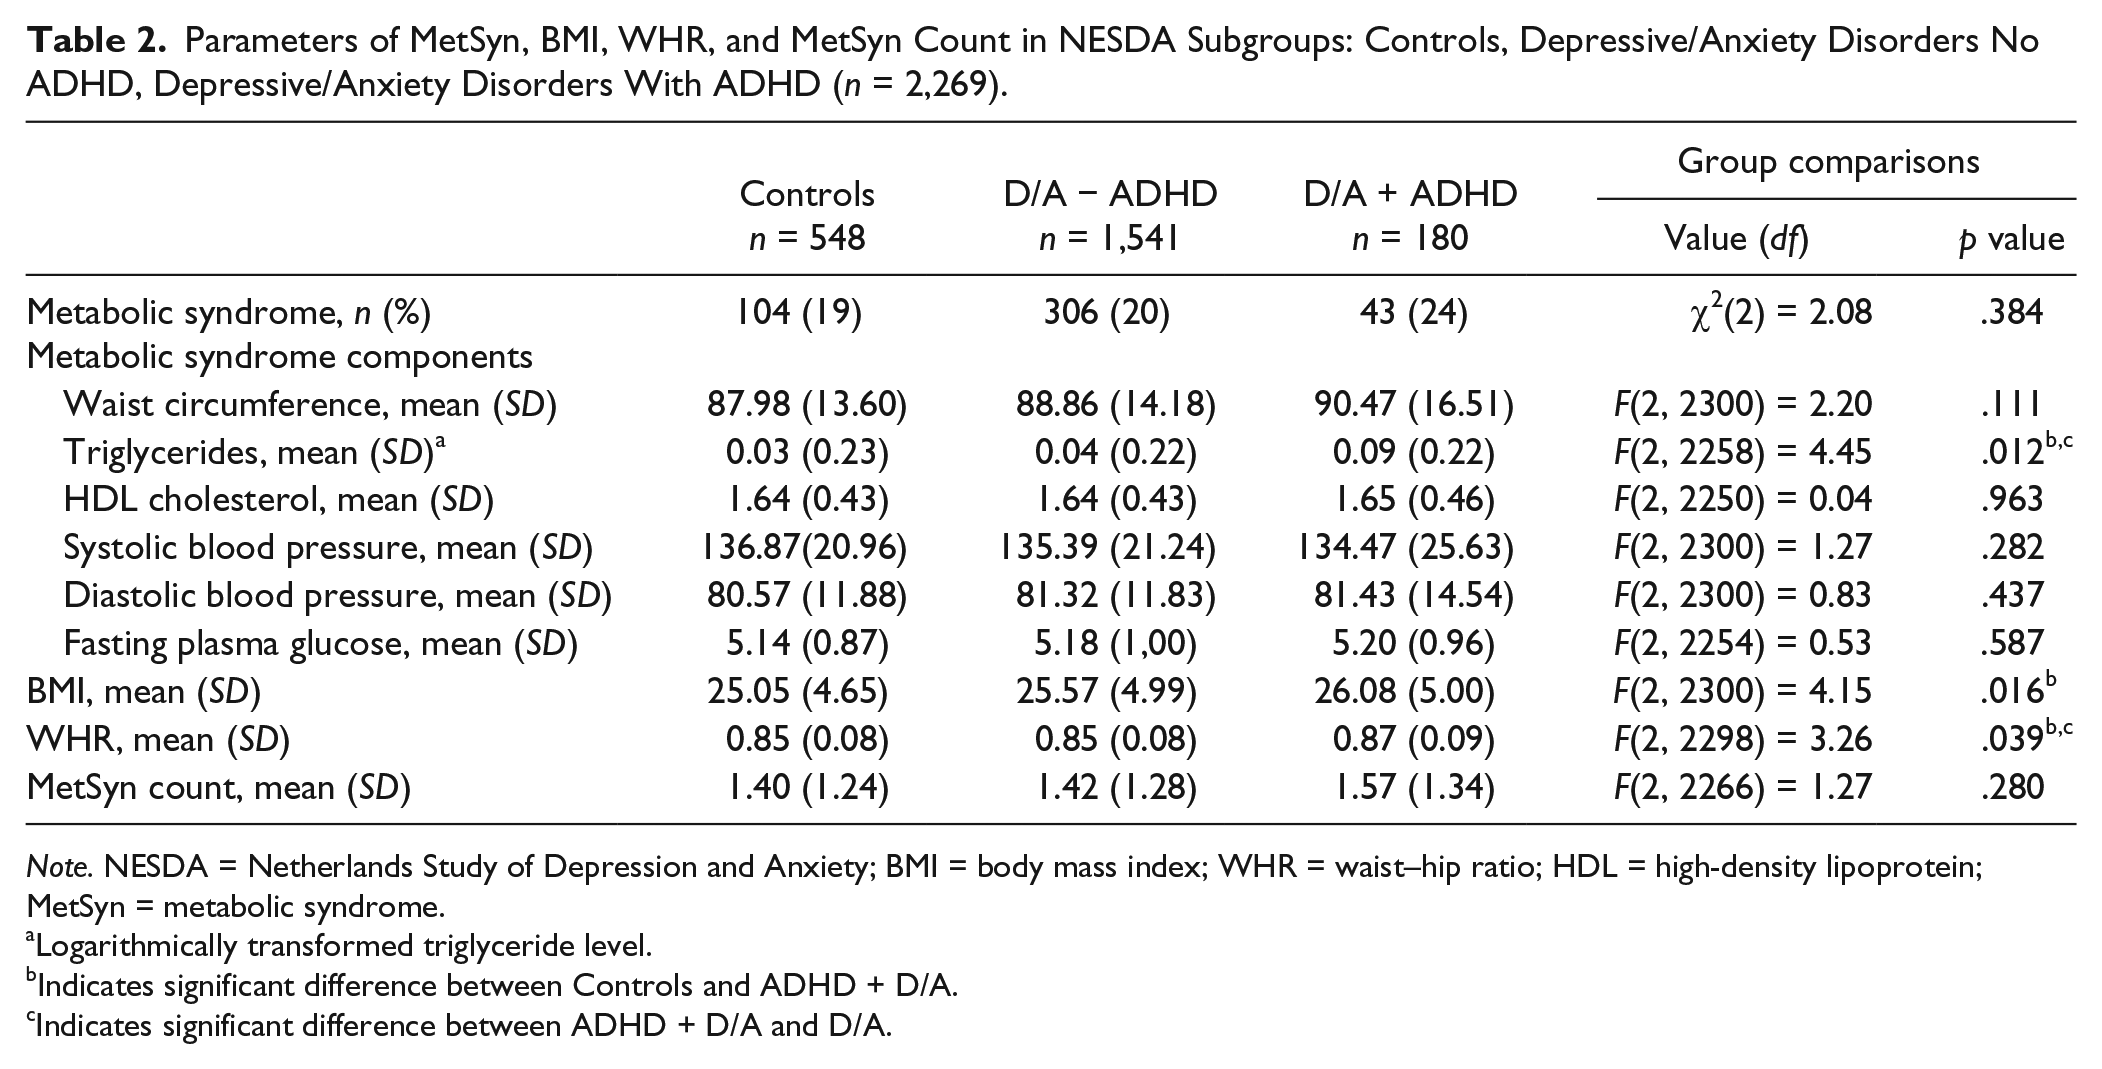
Table 2 shows the differences for metabolic parameters between the three subgroups. Triglyceride levels and waist–hip ratios were significantly higher in the D/A + ADHD group compared with the other groups. Participants in the D/A + ADHD group had significantly higher mean BMI compared with controls, although the increase was slight. This finding concurred with expectations from our etiological model. None of the other metabolic parameters showed significant group differences.
Parameters of MetSyn, BMI, WHR, and MetSyn Count in NESDA Subgroups: Controls, Depressive/Anxiety Disorders No ADHD, Depressive/Anxiety Disorders With ADHD (n = 2,269).
Note. NESDA = Netherlands Study of Depression and Anxiety; BMI = body mass index; WHR = waist–hip ratio; HDL = high-density lipoprotein; MetSyn = metabolic syndrome.
Logarithmically transformed triglyceride level.
Indicates significant difference between Controls and ADHD + D/A.
Indicates significant difference between ADHD + D/A and D/A.
Table 3 shows the logistic regression for the association between the dichotomous MetSyn variable and ADHD measures. None of the four regression models showed significant findings: Lifestyle and health factors were therefore not reported in this Table. Neither the presence of clinical ADHD symptoms nor the ADHD symptom domains were associated with an increased risk for MetSyn. This contradicted our etiological model.
Logistic Regression for Presence of MetSyn (Adjusted Adult Treatment Panel III Criteria) With Different ADHD Measures (n = 2,303).

Note. MetSyn = metabolic syndrome; OR = odds ratios; 95% CI = 95% confidence intervals; IA = high Inattention symptoms; H/I = high Hyperactivity/Impulsivity symptoms.
Model 1: unadjusted.
Model 2: Model 1 plus adjusted for age, sex, education.
Model 3: Model 2 plus adjusted for lifetime depressive/anxiety disorder.
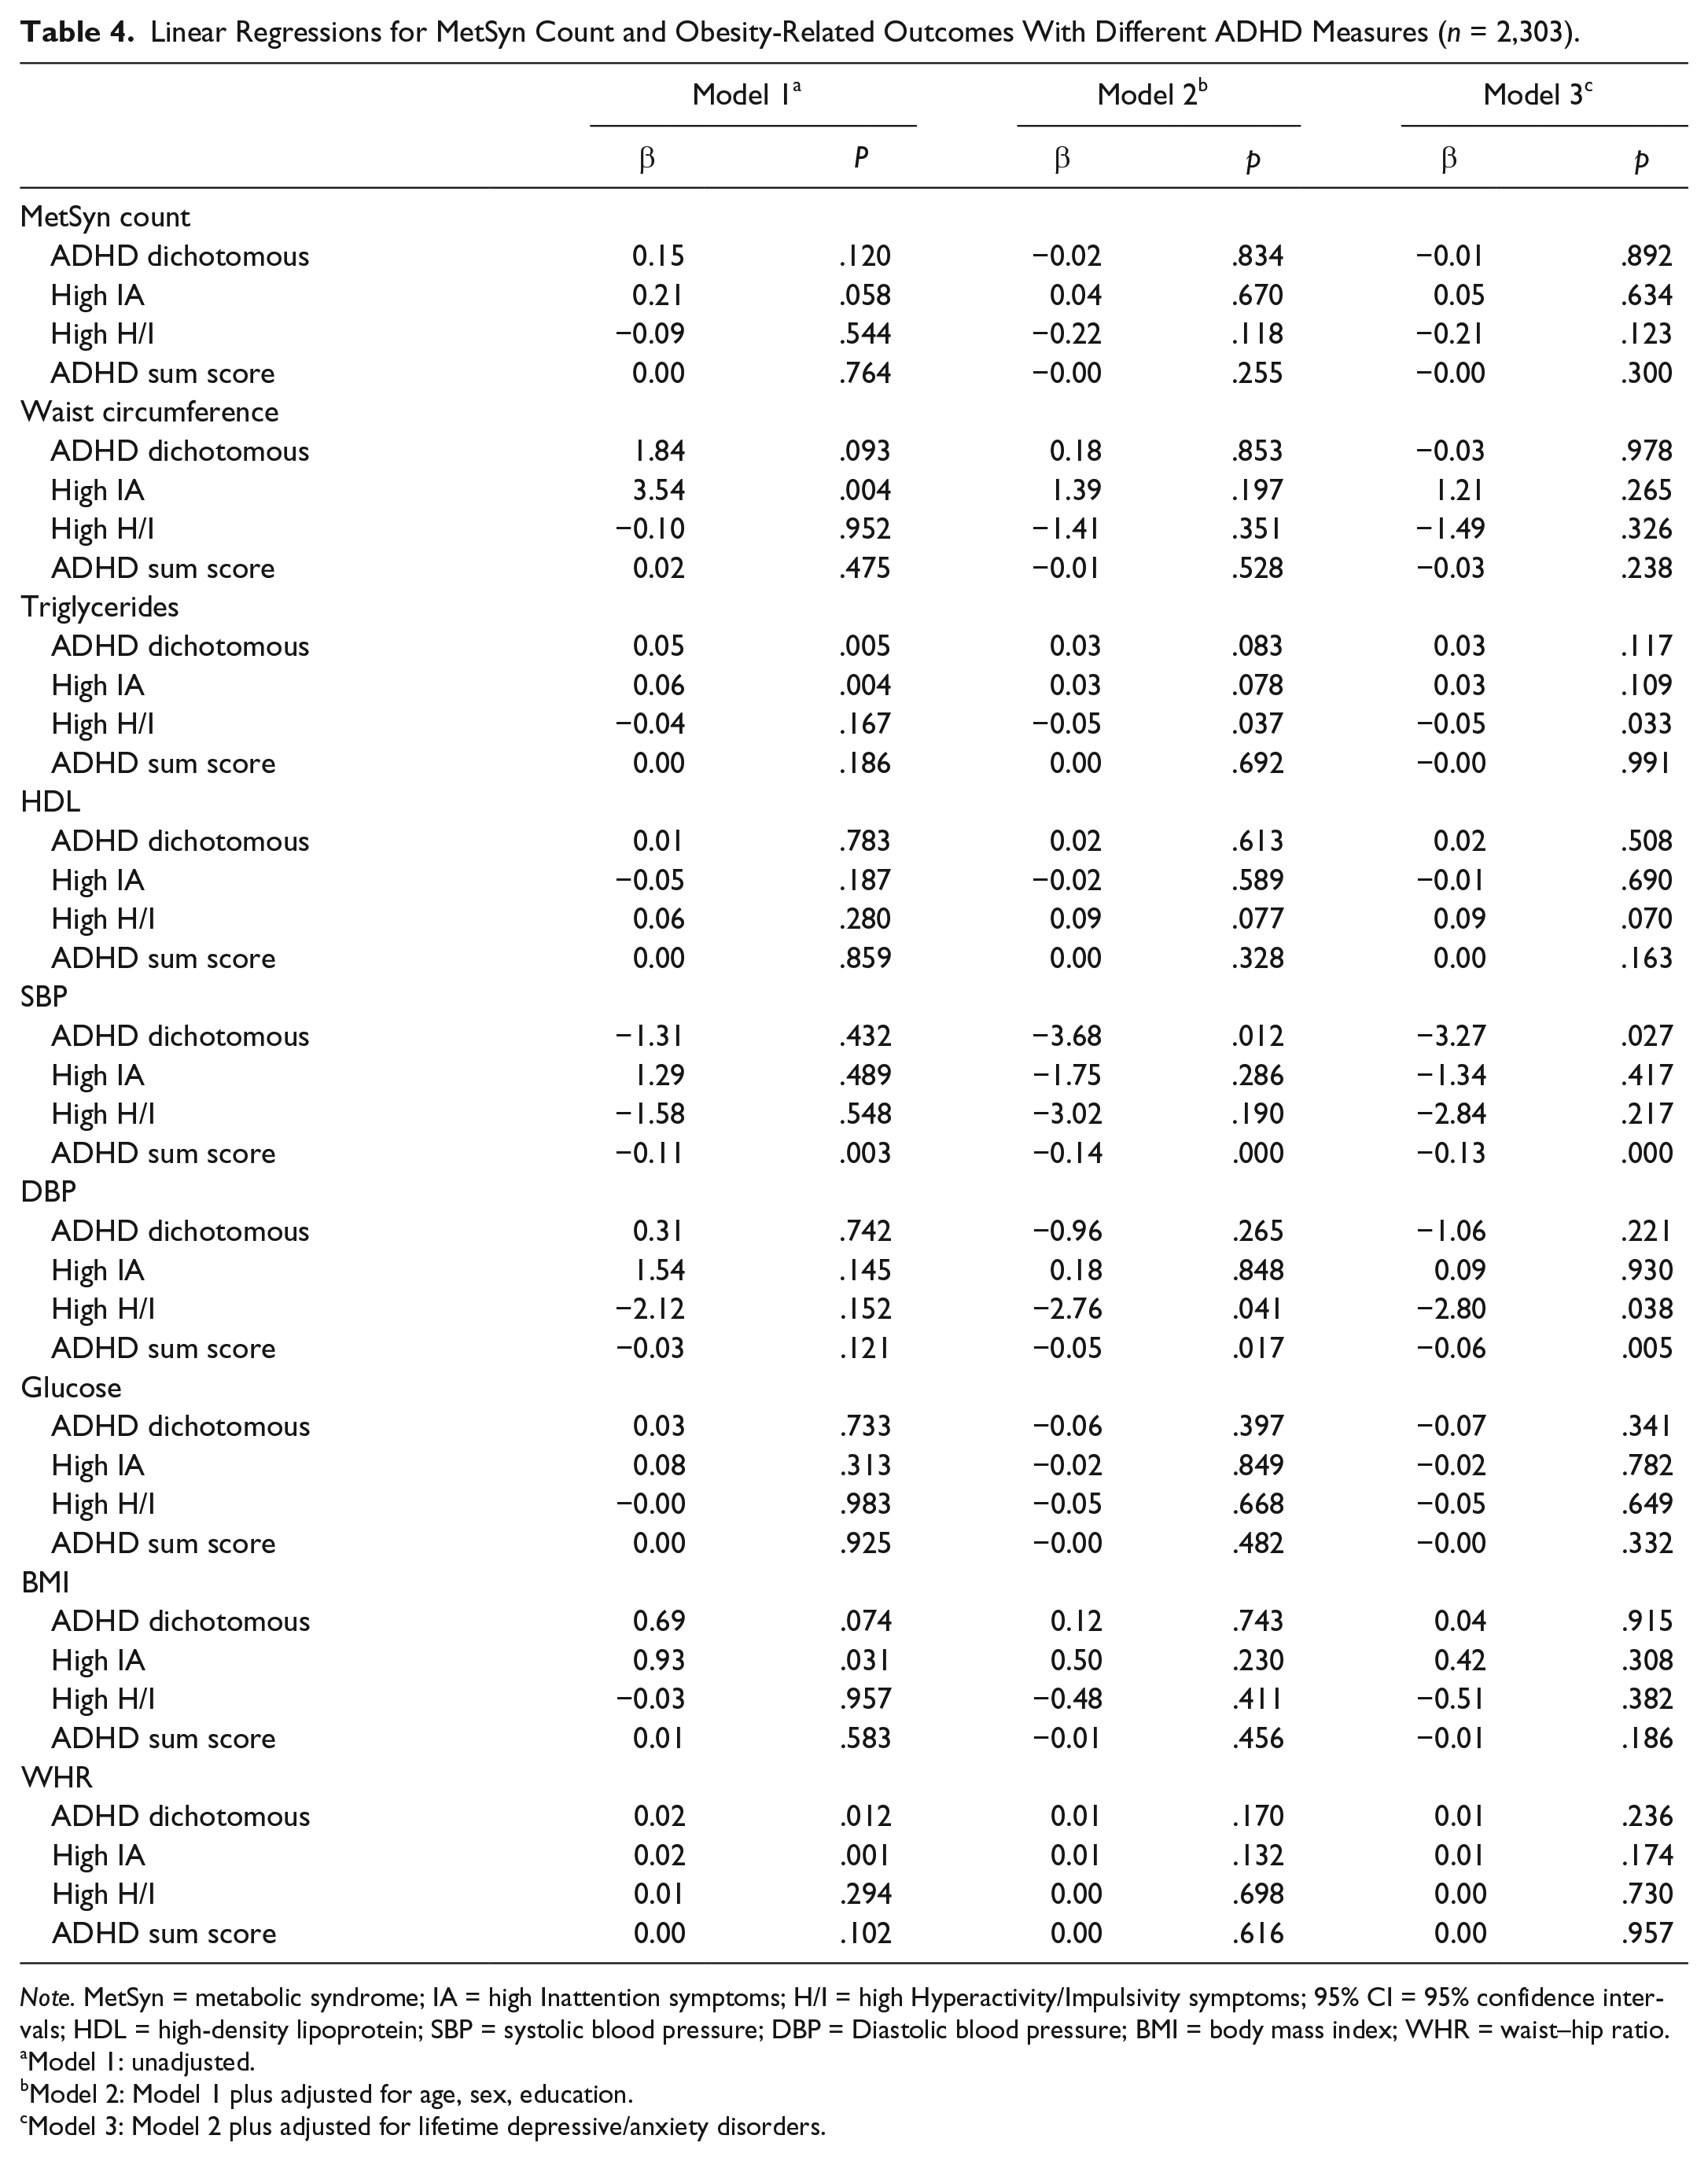
Greater waist circumference, triglyceride levels, BMI, and waist–hip ratios were significant in the high IA group, with the univariable Model 1 (Table 4). However, these findings disappeared in the multivariable Models 2 and 3, when adjusted for age, sex, education, depressive, and anxiety disorders. Triglyceride levels and waist–hip ratios were also significantly higher in the dichotomous ADHD group, but only with the univariable model. In contrast, triglyceride levels were significantly lower in the high H/I group (multivariable models only). Several definitions of more severe ADHD symptoms were associated with a statistically significantly lower systolic blood pressure (dichotomous ADHD group: Models 2 and 3, ADHD sum score group: all three models). Similarly, lower diastolic blood pressure was significantly associated with high H/I and sum score groups (multivariable models). There were no other significant relationships observed and hence no increased risk of MetSyn was found in the comorbid ADHD group. Overall, considering the number of associations tested, only a few significant associations emerged, which would not survive multiple testing correction. Adjustment for lifestyle and health factors did not change any of the findings and was therefore not reported.
Linear Regressions for MetSyn Count and Obesity-Related Outcomes With Different ADHD Measures (n = 2,303).
Note. MetSyn = metabolic syndrome; IA = high Inattention symptoms; H/I = high Hyperactivity/Impulsivity symptoms; 95% CI = 95% confidence intervals; HDL = high-density lipoprotein; SBP = systolic blood pressure; DBP = Diastolic blood pressure; BMI = body mass index; WHR = waist–hip ratio.
Model 1: unadjusted.
Model 2: Model 1 plus adjusted for age, sex, education.
Model 3: Model 2 plus adjusted for lifetime depressive/anxiety disorders.
A previous NESDA article showed that tricyclic antidepressant use increased the odds for MetSyn, independent of depression severity (van Reedt Dortland et al., 2010). We therefore added the frequent use of tricyclics as a covariate to all multivariable regressions. However, this did not change the relationships between ADHD and any of the MetSyn parameters. The MetSyn outcome was found to be independent of the lifestyle and health factors included in Model 4. To investigate whether the severity of ADHD symptoms was linked to MetSyn, we conducted an analysis using a higher cutoff for CAARS-S:SV T-score > 70 (>98th percentile; Conners et al., 1999). There were only 41 participants in this group (1.8%), and no significant relationships with MetSyn were found.
Discussion
We believe this is the first report which analyzes the association between all five MetSyn risk factors and adult ADHD comorbid with affective disorders. In this large-scale study, we investigated the relationship between comorbid ADHD symptoms, MetSyn, and obesity-related parameters. According to our etiological model, we expected an increased risk of MetSyn among comorbid ADHD patients, but after adjusting for potential confounders, we did not find this.
We used several different definitions for ADHD. In contrast to previous studies, our wide range of comprehensive analyses and models showed few clear associations between MetSyn, obesity-related outcomes, and clinical comorbid ADHD symptoms. We did find some significant, yet unexpected, associations. These were the relationships between lower triglyceride levels and hyperactivity symptoms, and lower blood pressure in the comorbid ADHD group, which persisted when we adjusted for sociodemographic factors, affective disorders, and health/lifestyle covariables. There were no other significant associations in the adjusted models. Contrary to our expectations, lower triglyceride levels were associated with high H/I symptoms in the multivariable models. This finding contradicts results from three other studies in which raised plasma lipids in adult ADHD patients were found (Irmisch, Richter, Thome, Sheldrick, & Wandschneider, 2013; Spencer et al., 2014; Young, Maharaj, & Conquer, 2004). However, two of these studies were small, with n = 15 and n = 72, respectively (Irmisch et al., 2013; Young et al., 2004). Ours may well have been a chance finding. Another surprising finding was the negative association between blood pressure and comorbid ADHD. There is little research on associations between blood pressure and ADHD. Available data deal with blood pressure changes in controlled medication studies, which may exclude patients with hypertension risk (Mick, McManus, & Goldberg, 2013). Some studies found an association between depression, anxiety, and lower blood pressure (Hildrum, Mykletun, Holmen, & Dahl, 2008; Paterniti et al., 1999) in participants using antidepressants but without controlling for ADHD (Luppino, Bouvy, Giltay, Penninx, & Zitman, 2014). Our finding may indicate the presence of decreased blood pressure in comorbid ADHD, which again contradicts the proposed etiological model linking ADHD to MetSyn.
In terms of the ADHD domains, we found high IA symptoms to be significantly associated with several obesity-related outcomes (univariable model only). The two large studies which examined obesity and ADHD also distinguished between symptom domains in ADHD, with varying results (Cortese, Faraone, et al., 2013; Fuemmeler et al., 2011). In the first, a population-based study (n = 15,197), a linear association was found between the number of IA and H/I symptoms and waist circumference, BMI, and blood pressure (Fuemmeler et al., 2011). However, in the epidemiological study where ADHD symptom domains were analyzed separately, no association was found between the number of Hyperactivity symptoms and obesity, after adjustment (Cortese, Faraone, et al., 2013). This concurs with our findings.
Possible biological mechanisms associating ADHD and obesity may relate to core ADHD symptoms such as poor planning, influencing diet and resulting in a higher BMI (Altfas, 2002; Davis et al., 2006). Other mechanisms deserving further exploration include the intrauterine environment. Low birth weight (LBW) is associated with ADHD (Hanć et al., 2016) and adult obesity (Jornayvaz et al., 2016). Animal studies propose that LBW offspring are “programmed” to eat more because of reduced hypothalamic satiety pathways (Desai, Li, & Ross, 2011). Obesity is considered a low-grade inflammatory disorder (Gregor & Hotamisligil, 2011). Genome-wide analysis of ADHD implicates genes involved in inflammation, and this may be another mechanism linking the two disorders. In our study, we failed to find obesity in the comorbid ADHD group, even though we analyzed waist circumference, BMI, and high-risk waist–hip ratio separately, using well-validated diagnostic methods. The studies where BMI is associated with ADHD may have methodological problems, including the reliance on self-reporting for measurements (Cortese, Faraone, et al., 2013; de Zwaan et al., 2011; Lucassen et al., 2013; Pagoto et al., 2009). In contrast, we measured height, weight, and waist circumference objectively in accordance with published guidelines (National Institute of Health, 2000). Raised BMI per se, as opposed to abdominal obesity, may not increase MetSyn risk as BMI cannot distinguish between lean mass and adipose tissue. Waist circumference and waist–hip ratio may give a better indication of visceral fat, the main factor in cardio-metabolic risk (Nazare et al., 2015).
It is possible that associations between the risk factors of MetSyn and comorbid ADHD in adults are very difficult to detect, and therefore we failed to find them, despite our large sample. The presence of comorbid affective disorders in the ADHD group may have obscured any increased risk of MetSyn. In addition, the risk of MetSyn increases with age (Meigs et al., 2003). In the comorbid ADHD group, the average age was 45 years, so it was unexpected that we found no correlation. The negative outcome of this study may also be related to the concept and definition of MetSyn, which have been questioned (Kahn et al., 2005). While cardiovascular risk factors are prone to cluster, they may not share unifying pathophysiological pathways. It is possible that not all MetSyn risk factors contribute significantly to cardiovascular diseases and diabetes, whether for the general population (Reaven, 2011) or those with affective disorders and ADHD. Some researchers have postulated that of the five MetSyn risk factors, abdominal obesity and insulin resistance are major culprits (Paoletti, Bolego, Poli, & Cignarella, 2006). Previously, an increased prevalence of dyslipidemia and abdominal obesity only was reported in patients with affective disorders (van Reedt Dortland, Giltay, van Veen, Zitman, & Penninx, 2013). Hence, the relative importance of each of the five MetSyn risk factors is still uncertain. We examined all MetSyn risk factors both separately and together to clarify the relative contribution of each, yet we still failed to find an increased risk of MetSyn in the comorbid ADHD group. Similar to our results, the epidemiological study by Cortese, Faraone, et al. (2013) also failed to find a significant association between ADHD and obesity in adults after adjustment for depression and anxiety.
Our study, in combination with previous work, has several clinical implications. Clinicians frequently encounter ADHD comorbid with affective disorders, so where ADHD is being treated, there should be screening for affective disorders and obesity (Kooij, 2016). Coexisting disorders should be managed in a step-wise fashion. Affective disorders should generally be treated before ADHD (Kooij et al., 2012). Patients should be informed of the potential risks of developing obesity and MetSyn. However, these patients may struggle to adhere to preventive measures. Hence, clinicians should structure and target treatment with an emphasis on good sleep hygiene, balanced diet, and exercise.
Our study also has implications for future research. First, it is currently unknown whether treating coexisting affective disorders will lessen the risk of MetSyn in those with adult ADHD; this should be researched. Second, the etiological model associating ADHD with MetSyn may need to be modified. Future studies should investigate whether a “pure” ADHD group increases risk of MetSyn, as comorbid affective disorders may mask the association between ADHD and MetSyn. However, these patients are difficult to find. Ideally, it would be advisable to study MetSyn in a large ADHD cohort, with and without comorbidity. Third, ADHD may increase the risk of obesity but not for MetSyn as a whole. The concept of MetSyn and its possible association with ADHD needs to be carefully reappraised. MetSyn is a constellation of different risk factors of cardiovascular disease and diabetes. ADHD may have a different impact on each factor and these should be individually studied.
Our study has several limitations. The cross-sectional design did not allow us to make causal inferences on the relationship between ADHD and MetSyn. As we included only those with ADHD and comorbid affective disorders, our results cannot be generalized to all populations. However, clinicians rarely encounter patients with “pure” ADHD, and the inclusion of the comorbid ADHD group could also be seen as a study strength. In addition, completing the CAARS-S:SV depends on retrospective self-reporting, as ADHD starts in childhood. This may have introduced recall bias, leading to under reporting (Miller, Newcorn, & Halperin, 2010). Yet, the validity of retrospective ADHD symptom self-reporting was shown to be reliable (Kooij et al., 2008). Finally, while the CAARS-S:SV identified those with clinical symptoms of ADHD, a diagnosis of ADHD had not been made. We were not able to collect collateral information, and only three people were treated with a psychostimulant. Despite these considerations, our study extends the literature exploring relationships between comorbid ADHD and MetSyn.
Conclusion
ADHD is a complex disorder with frequent psychiatric comorbidity. In our large sample of persons, with and without affective disorders, comorbid adult ADHD did not predispose to MetSyn. ADHD symptoms were examined comprehensively including severity and the domains of IA and H/I. Obesity-related parameters such as raised BMI, high waist–hip ratio, and increased Waist Circumference were also not associated with comorbid ADHD. Hence, those with comorbid ADHD do not appear to have an added risk of MetSyn and its complications, beyond that conferred by affective disorders.
Footnotes
Declaration of Conflicting Interests
The author(s) declared the following potential conflicts of interest with respect to the research, authorship, and/or publication of this article: D. Wynchank has served on the advisory boards of Janssen BV, Novartis, and Eli Lilly. She has been a speaker for Shire. J. J. S. Kooij was on the speakers’ bureau of Janssen, Eli Lilly, and Shire until 2012 and received unrestricted research grants from Janssen BV and Shire for other studies until 2010. A. T. F Beekman has been a speaker for Lundbeck and Eli Lilly and received research grants from Astra Zeneca, Eli Lilly, and Shire for other studies. B. W. J. H. Penninx has received research grants from Nederlandse Organisatie voor Wetenschaplijk Onderzoek (NWO), Biobanking and Biomolecular Research Infrastrucutre-Netherlands (BBRMI-NL), National Institute of Mental Health (NIMH), and the EU-FP7 program for research in Netherlands Study of Depression and Anxiety (NESDA). D. Bijlenga, T. I. Bron and F. Lamers declare no conflicts of interest.
Funding
The author(s) disclosed receipt of the following financial support for the research, authorship, and/or publication of this article: This study is funded by the Netherlands Foundation for Mental Health (grant number 2013-6777). The infrastructure for the NESDA study ( ) is funded through the Geestkracht Program of the Netherlands Organization for Health Research and Development (Zon-Mw, grant number 10-000-1002). This organization had no further role in study design, collection, analysis and interpretation of data, writing of the report, and in the decision to submit the paper for publication. NESDA is supported by participating universities and mental health care organizations (VU University Medical Center, GGZ inGeest, Arkin, Leiden University Medical Center, GGZ Rivierduinen, University Medical Center Groningen, Lentis, GGZ Friesland, GGZ Drenthe, Scientific Institute for Quality of Healthcare (IQ healthcare), Netherlands Institute for Health Services Research (NIVEL) and Netherlands Institute of Mental Health and Addiction (Trimbos Institute).