
Abstract
Over the past few decades, researchers have shown increased interest in the relationship between attention-deficit hyperactivity disorder (ADHD) symptoms and those of sluggish cognitive tempo (SCT; for reviews, see Barkley, 2014; Becker, Marshall, & McBurnett, 2014). SCT is characterized by symptoms such as drowsiness, daydreaming, lethargy, and being “in a fog” (Barkley, 2011; Becker et al., 2016). It should be noted that investigators refer to these characteristics as symptoms, even though SCT is not yet an established disorder. High levels of SCT symptoms appear to be prevalent in samples of children, adolescents, and adults (Barkley, 2012, 2013; Wood, Lewandowski, Lovett, & Antshel, 2014).
Although SCT symptoms were initially considered a subset of ADHD inattention symptoms (American Psychiatric Association, 1980), researchers have consistently found SCT symptoms to form a separate factor from symptoms of inattention and hyperactivity–impulsivity within child and adolescent samples (Bauermeister, Barkley, Bauermeister, Martínez, & McBurnett, 2012; Garner, Marceaux, Mrug, Patterson, & Hodgens, 2010) and adult samples (Barkley, 2012; Wood, 2015). In addition to being a separate factor from symptoms of inattention and hyperactivity–impulsivity, SCT symptoms have been shown to form a separate factor from symptoms of anxiety, depression, and daytime sleepiness (Barkley, 2013; Becker, Langberg, Luebbe, Dvorsky, & Flannery, 2014; Wood, 2015).
Although SCT symptoms have been found to be present across populations and form a statistically separate factor from other clinical factors, relatively few studies have examined what underlying performance deficits, if any, are central to SCT symptoms. To date, more such studies have been conducted among children and adolescents than adults. In their recent meta-analysis, Becker and colleagues (2016) reported that elevated levels of SCT symptoms in children and adolescents are significantly associated with lower performance on measures of intelligence, response inhibition, working memory, sustained attention, and processing speed, though the overall effect sizes were small to moderate (weighted r = .19-.29). Becker and colleagues noted that significantly fewer studies have examined underlying neuropsychological deficits in adult samples. They identified three studies of adults that found elevated SCT symptoms to be associated with impaired executive functioning as measured by self-report (i.e., individuals who endorsed SCT symptoms also endorsed higher levels of executive dysfunction). Becker et al. identified only one study that examined the relationship between SCT symptoms and actual performance (as opposed to self-report) on standardized measures in adults. Jarrett, Rapport, Rondon, and Becker (2017) examined both self-report and performance-based measures of neuropsychological functioning (e.g., a visual working memory task, the Stroop task, and the Conners’ Continuous Performance Test) in a sample of 298 college students. Overall, Jarrett and colleagues found that SCT symptoms were strong predictors of self-reported executive dysfunction but not objective neuropsychological test performance.
Although Jarrett and colleagues (2017) were the first to examine the relationship between cognitive functioning and SCT in an adult sample, they did not examine the speed of performance. The examination of processing speed in relationship to SCT symptoms has become a focal point in current debates of SCT. Specifically, Barkley (2016) expressed concern regarding the potential inaccuracy of labeling SCT symptoms as “sluggish” when there are little to no data to support a relationship between SCT symptoms and processing speed. Indeed, even in the meta-analysis conducted by Becker and colleagues (2016), the effect size of the relationship between SCT symptoms and processing speed in child samples was small, and no studies have yet examined the relationship between SCT symptoms and processing speed in an adult sample.
The current study aims to address the gaps in the current literature by examining whether college students who reported higher levels of SCT symptoms were actually more “sluggish” in their pace while completing speeded cognitive and academic measures. The examination of the relationship between task completion speed and SCT symptoms in a college student sample is important for two key reasons. First, there is a need to better understand the neurocognitive profile of SCT symptoms, and no study has yet examined the relationship between SCT symptoms and processing speed in an adult sample. Second, this issue is particularly interesting given recent comments from Barkley (2016) challenging the name of “sluggish cognitive tempo.” If SCT symptoms are not associated with sluggish performance, this may support Barkley’s claim that the current label is inaccurate.
Method
Participants
Following approval by Institutional Review Boards (IRBs), a total of 253 undergraduate students enrolled in psychology courses at two universities in the Northeast United States were recruited for this study. Upon completion of the study, students were awarded partial course credit. The sample consisted of primarily freshmen (49%) and sophomore students (43%), with a mean age of 19.03 years (range = 27-46 years, SD = 2.4 years). Similar numbers of participants reported being male (49%) and female (46%); the remainder of participants did not report a sex. The majority of participants were Caucasian (75%), while the remaining participants were African American (7.4%), Hispanic/Latino (7.8%), Asian (8.6%), and American Indian or Alaskan Native (0.4%). Approximately one quarter (24%) of participants reported having a history of at least one disability, with “disability” defined broadly as a history of any professional diagnosis of a condition. The most commonly reported disability was ADHD (8.7%) followed by anxiety (3.2%) and depression (1.6%). Ten participants reported being eligible for disability accommodations at their institution.
Measures
Demographic questionnaire
A demographic questionnaire was used to obtain background information from the participants. The questionnaire asked about the following variables: age, sex, year in school, grade point average (GPA), ethnicity, native language, disability status, medication use, and eligibility for academic accommodations.
Barkley Adult ADHD Rating Scale–IV (BAARS-IV): SCT section
The BAARS-IV (Barkley, 2011) contains nine items relating to SCT symptoms. Sample items include “prone to daydreaming,” “easily bored,” and “lethargic, more tired than others.” Participants were asked how frequently they experienced each symptom over the past 6 months using a 4-point scale (1 = not at all, 2 = sometimes, 3 = often, and 4 = very often), and so SCT total scores ranged from 9 to 36. Barkley (2012) suggested a cutoff of five symptoms being endorsed as occurring “often” or “very often” as indicating clinically “elevated” SCT symptoms in adult samples. For this study, SCT total score was calculated by adding the total number of symptoms endorsed by participants as occurring “often” or “very often” (range = 0-9). Two groups were created based upon these symptom counts. The High-SCT group consisted of individuals who met the cutoff of five or more elevated SCT symptoms. The Low-SCT group included individuals who endorsed four or fewer elevated SCT symptoms. The SCT subscale on the BAARS-IV has demonstrated adequate internal consistency (α = .90) and test–retest reliability (r xx = .88; Barkley, 2011).
Self-Evaluation of Performance on Timed Academic Reading (SEPTAR)
The SEPTAR (Kleinmann, 2005) is a nine-item self-report questionnaire measuring an individual’s self-assessment of timed test-taking skills. Items include “I am a slow reader” and “I could do better on my exams if I had extra time.” Individuals report their behaviors on a 5-point scale (1 = strongly disagree, 2 = disagree, 3 = neutral, 4 = agree, and 5 = strongly agree). The item scores are summed, and the total score ranges from 9 to 45, with higher scores reflecting a stronger perception of needing additional time for reading and tests. The SEPTAR has demonstrated good reliability (α = .89) with a single-factor structure. It has demonstrated construct validity through significant correlations with speeded cognitive performance measures (Kleinmann, 2005).
Woodcock–Johnson Tests of Achievement–Third Edition (WJ-III): Reading Fluency subtest
In this task, individuals are asked to read a series of 98 simple sentences (e.g., “A pen is for writing,” “A shoe goes on your head”) and indicate whether they are true or false within a 3-min time period (Woodcock, McGrew, & Mather, 2001). The number of correct responses was summed for this study. The WJ-III manual reports good test–retest reliability with an extended test–retest interval of 1 year (r xx = .88).
Wechsler Adult Intelligence Scale–Fourth Edition (WAIS-IV): Processing speed index (PSI)
The WAIS-IV (Wechsler, 2008) is a measure of general intellectual functioning and provides a full-scale IQ, along with four index scores. The PSI score is based on two 2-min subtests (Coding and Symbol Search) that measure processing speed, visual discrimination, and visual motor coordination. The Coding subtest requires an examinee to copy marks paired with numbers using a provided key. The Symbol Search subtest requires an examinee to identify whether a row of symbols contains either of two target symbols. On these tasks, a higher score indicates faster processing speed abilities. The PSI score has excellent internal consistency reliability (average rxx = .90) and good test–retest stability (average rxx = .87) over intervals of approximately 1 month.
Nelson–Denny Reading Test (NDRT): Reading Comprehension subtest
The Reading Comprehension portion of the NDRT, Form G (Brown, Fishco, & Hanna, 1993), was utilized as a measure of both reading comprehension and reading speed. The measure includes seven reading passages, with each passage followed by several multiple-choice comprehension questions (38 questions in total). Typically, examinees are given 20 min to complete as much of the test as they can, but in this study, students were allowed to take as long as they needed and we recorded how long they took (see below). The comprehension task also allows for the calculation of a rough estimate of “reading rate,” based on how far in the first reading passage an individual has read at the 1-min mark. Higher scores on the NDRT indicate stronger performance for both the reading comprehension and reading speed variables. The NDRT manual reports good alternate-form reliability (rxx = .81) for the Comprehension subtest.
Procedure
Participants met in quiet classrooms, with a maximum number of 15 participants per session, and two experimenters were present at all times to ensure that procedures were followed reliably. After reviewing the informed consent, participants began by completing the demographic questionnaire. Next, participants completed the other measures in a counterbalanced order, except for the NDRT, which was always the final measure so that participants could leave whenever they finished. Participants were given as much time as they needed to complete the NDRT, although they were instructed to work “as quickly and as accurately” as they could, to emphasize both speed and accuracy dimensions. Upon completion of the test, participants raised their hand, and an experimenter recorded the completion time. Each session lasted between 30 and 55 min.
Results
Two types of data analyses were conducted. First, SCT was treated as a continuous variable, and its relationships to other measures in the battery (either considered individually or as a set) were examined using correlation and regression analyses. A complete list of all of the variables examined can be found in Table 1. Second, the sample was divided into High-SCT and Low-SCT groups using Barkley’s (2011) criteria to examine whether group differences existed on the other measures, and whether these other measures could be used as a set to predict group membership. Although dividing a sample into two groups along a continuous variable generally reduces power (MacCallum, Zhang, Preacher, & Rucker, 2002), if the cut-point is clinically meaningful, the resulting analyses will have more practical import than analyses based on a continuous variable.
Correlates of Self-Reported SCT Symptoms.
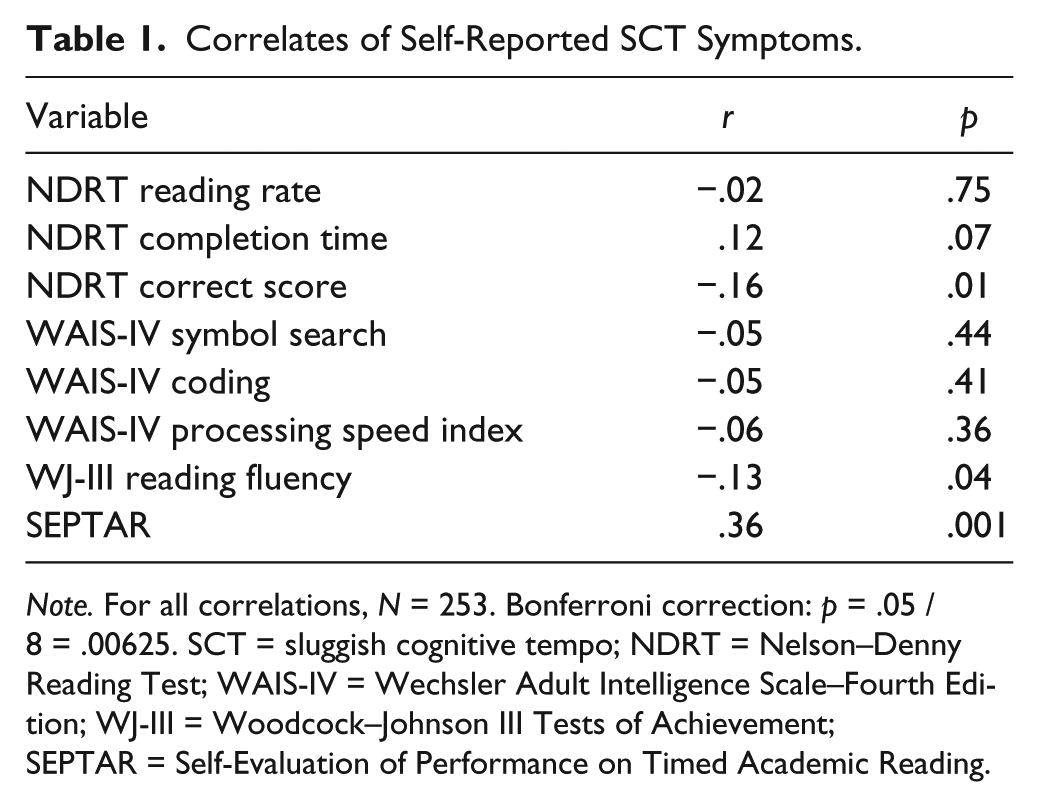
Note. For all correlations, N = 253. Bonferroni correction: p = .05 / 8 = .00625. SCT = sluggish cognitive tempo; NDRT = Nelson–Denny Reading Test; WAIS-IV = Wechsler Adult Intelligence Scale–Fourth Edition; WJ-III = Woodcock–Johnson III Tests of Achievement; SEPTAR = Self-Evaluation of Performance on Timed Academic Reading.
SCT as a Continuous Variable
First, simple bivariate correlation coefficients were computed between SCT total score and all other measures (see Table 1). Self-reported SCT was only significantly associated with SEPTAR (r = .36, p < .001) once the Bonferroni correction for eight statistical tests (p = .05 / 8 = .00625) was applied. While self-reported SCT was associated with NDRT correct score (r = −.16, p = .01), WJ-III reading fluency (r = −.13, p = .04), and was marginally associated with NDRT completion time (r = .12, p = .07), these relationships were not statistically significant after applying the Bonferroni correction. These results suggest that SCT has a small relationship with measures of processing speed, perhaps too small to be of clinical interest.
Despite the modest independent relationships between the SCT symptom score and individual speeded performance variables, an additional analysis was conducted to examine the possibility that a set of speeded tasks together might predict SCT symptom levels. A regression model was fitted using WJ-III reading fluency, NDRT completion time, and WAIS-IV PSI to predict SCT symptom levels (see Table 2). The regression model did not significantly predict SCT symptom levels (R2 = .01, p = .37), and none of the predictors were individually significant in the context of the model.
Simultaneous Multiple Regression Predicting SCT Total Score.
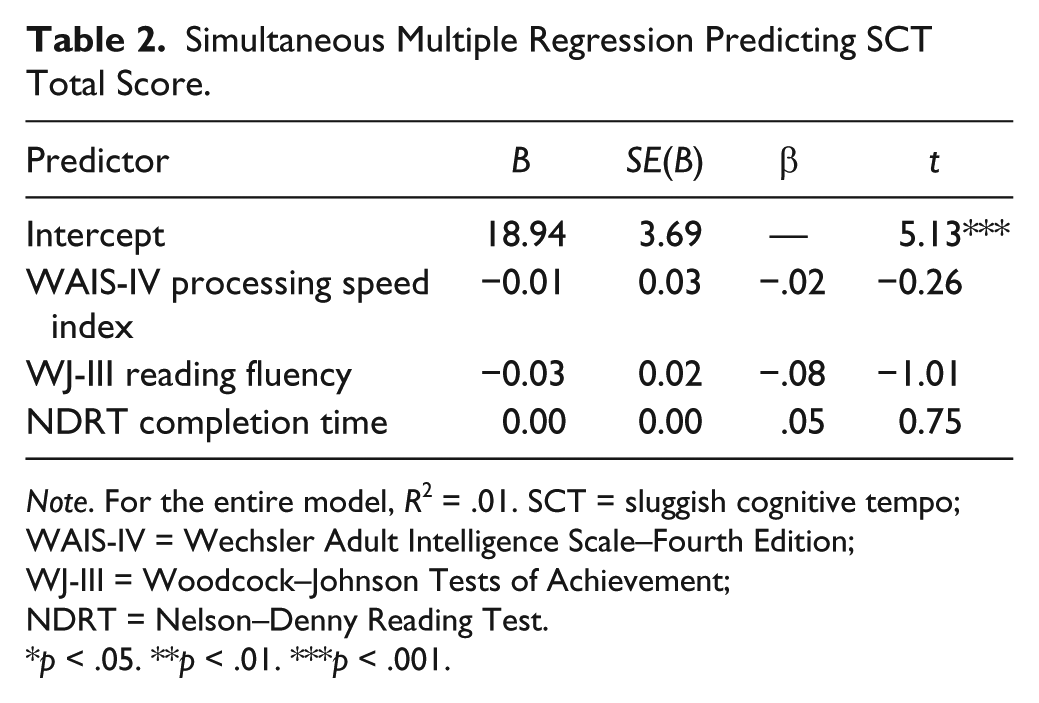
Note. For the entire model, R2 = .01. SCT = sluggish cognitive tempo; WAIS-IV = Wechsler Adult Intelligence Scale–Fourth Edition; WJ-III = Woodcock–Johnson Tests of Achievement; NDRT = Nelson–Denny Reading Test.
p < .05. **p < .01. ***p < .001.
High- and Low-SCT Group Analyses
Next, the cutoff of five symptoms with a score of three or greater (often or very often) was employed to identify individuals with clinically high SCT symptom reports, as suggested by Barkley (2012). This cutoff identified 11.1% of students (n = 28) who formed a High-SCT group, with an average symptom count of 6.50 symptoms (SD = 1.35). The remaining 225 participants formed a Low-SCT group averaging 1.44 symptoms (SD = 1.32). Groups did not differ significantly on age, GPA, sex, primary language, ethnicity, medication use, or use of accommodations in high school. Groups did differ significantly on presence of any disability (χ2 = 2.52, p = .009). Notably, the rate of reported ADHD diagnoses in the two groups was very similar (8% for the Low-SCT group; 11% for the High-SCT group).
Independent group t tests were computed to compare the High-SCT and Low-SCT groups on all of the outcome variables (see Table 3). The results paralleled the correlational analyses above. With a Bonferroni-corrected p value of .00625, the groups only differed significantly on the SEPTAR, t(251) = 4.4, p < .001, with the High-SCT group obtaining significantly higher SEPTAR scores (indicating more perceived problems with timed tasks). WJ-III reading fluency was the only other variable for which the group difference was even close to significance, t(251) = 2.37, p = .02, with the High-SCT group showing lower reading fluency. Effect sizes showed a large group difference in SEPTAR scores (d = 0.89), a moderate group difference in WJ-III reading fluency scores (d = 0.46), and small group differences on NDRT completion time (d = 0.28) and WAIS-IV symbol search scores (d = 0.26), with all of these effects in the expected direction.
Comparison of High-SCT Symptom and Non-High-SCT Symptom Groups.
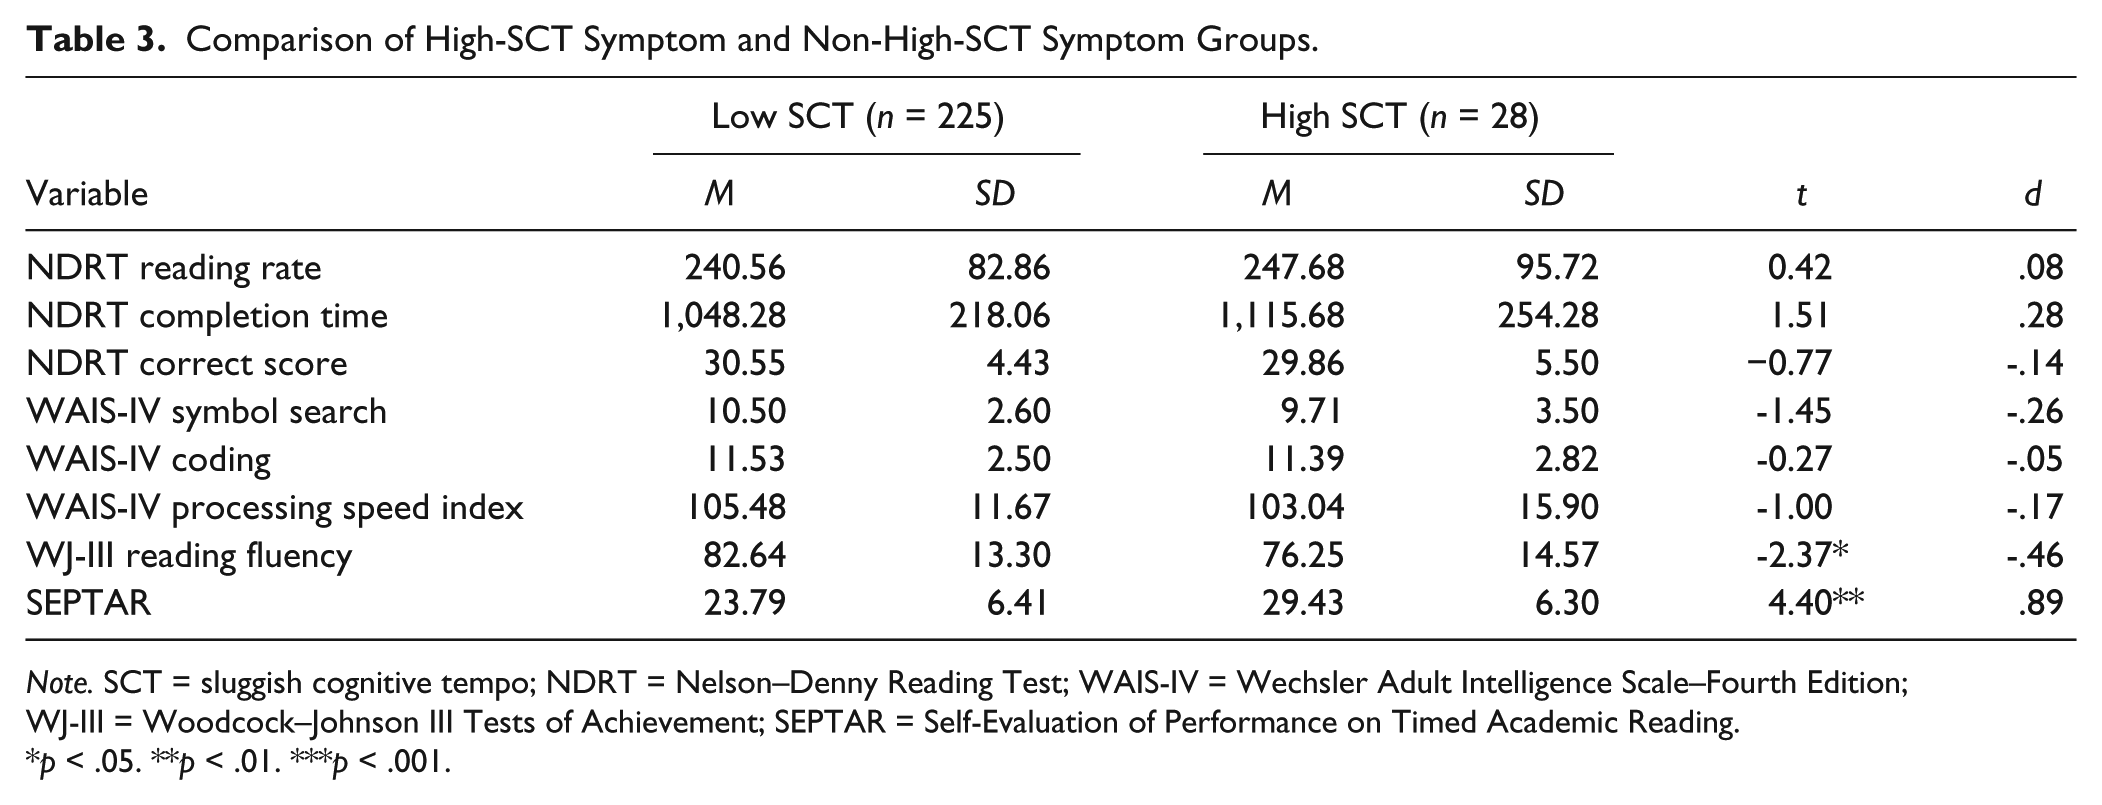
Note. SCT = sluggish cognitive tempo; NDRT = Nelson–Denny Reading Test; WAIS-IV = Wechsler Adult Intelligence Scale–Fourth Edition; WJ-III = Woodcock–Johnson III Tests of Achievement; SEPTAR = Self-Evaluation of Performance on Timed Academic Reading.
p < .05. **p < .01. ***p < .001.
Finally, a logistic regression model was fitted to predict group membership using three independent speeded performance measures: WAIS-IV PSI, WJ-III reading fluency, and NDRT completion time (see Table 4). None of the predictors were individually significant in the context of the model, nor were the predictors significant as a set (Hosmer–Lemeshow, χ2 = 12.06, p = .15).
Simultaneous Logistic Regression Predicting SCT Group Membership.
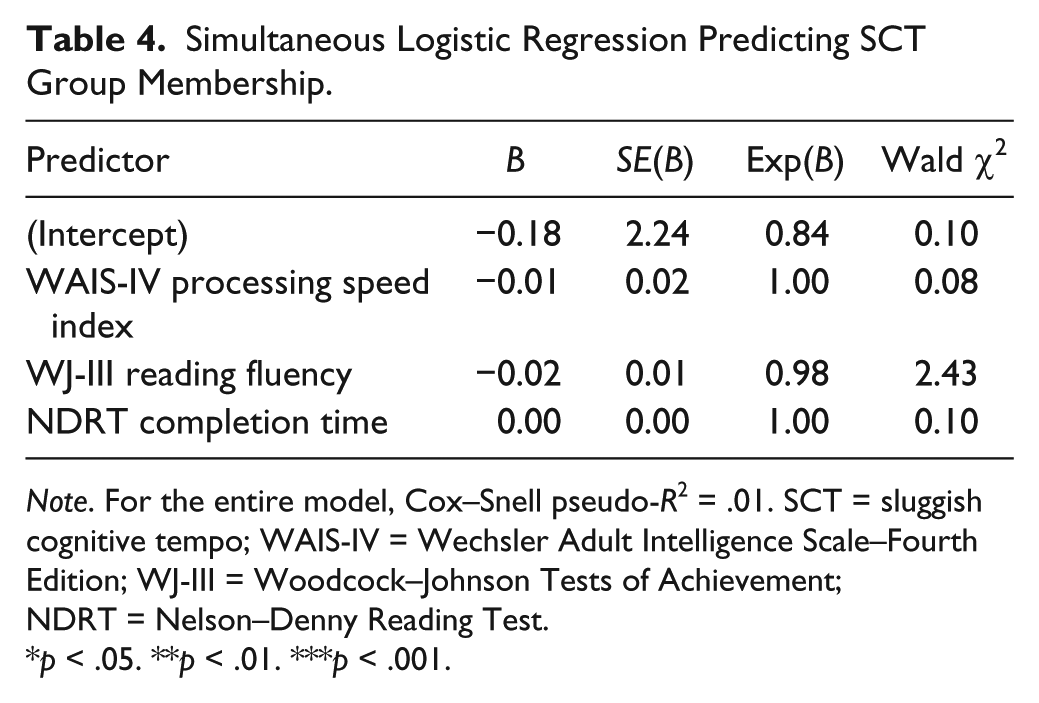
Note. For the entire model, Cox–Snell pseudo-R2 = .01. SCT = sluggish cognitive tempo; WAIS-IV = Wechsler Adult Intelligence Scale–Fourth Edition; WJ-III = Woodcock–Johnson Tests of Achievement; NDRT = Nelson–Denny Reading Test.
p < .05. **p < .01. ***p < .001.
Discussion
The purpose of this study was to investigate whether college students who reported higher levels of SCT symptoms were actually more “sluggish” in their pace while completing speeded cognitive and reading-based measures. Despite the term sluggish cognitive tempo, these data suggest that students who report high levels of SCT symptoms are not reliably more “sluggish” in their performance on timed measures of processing speed or reading accuracy and comprehension. The relationship between SCT symptoms and reading fluency was too small to be considered meaningful. Indeed, even combining all performance variables into a regression model failed to significantly predict SCT symptom level. Self-reported difficulty on timed reading tasks was the only variable to be significantly associated with SCT symptom score. That is, students who reported high levels of SCT symptoms were also more likely to endorse academic fluency concerns than other students. In terms of High-SCT and Low-SCT group comparisons, the High-SCT group reported significantly more academic fluency concerns than the Low-SCT group. SEPTAR score was the only variable on which there was a significant group difference after correction for family-wise Type I error. There was a moderate effect size difference between groups for reading fluency, with the High-SCT group showing moderately lower reading fluency performance; however, this should be interpreted cautiously in light of the small to negligible statistical findings. Overall, these results suggest that individuals who endorse high levels of SCT symptoms do not perform reliably more slowly than their peers on performance-based tasks, although they perceive themselves as being slower.
These data support Barkley’s (2015, 2016) concerns regarding the appropriateness of the term sluggish cognitive tempo, as individuals who endorse SCT symptoms do not appear to perform more slowly than their peers. Though a tentative relationship between SCT and processing speed has been identified in two studies, both of those studies focused on children and sampled from clinical groups (i.e., pediatric tumors and ADHD; Willard et al., 2013; Willcutt et al., 2014). Given the confounds of these clinical groups, little can be determined regarding the unique relationship between SCT and processing speed. Furthermore, among studies that focus on SCT in general population samples, no significant relationship has been identified between SCT symptoms and processing speed (Bauermeister et al., 2012). Therefore, Barkley may be correct in claiming that the term SCT is a misnomer.
Although SCT symptoms were not associated with performance-based tasks in college students, SCT symptoms were associated with more self-reported impairment on the SEPTAR. This is consistent with the study conducted by Jarrett and colleagues (2017), which found that although SCT symptoms in college students were associated with more self-reported impairment, SCT symptoms were not significantly related to various measures of neuropsychological performance (e.g., visual working memory task, the Stroop task, and Conners’ Continuous Performance Test). Similar results have been found among college students with ADHD diagnoses. For example, Lewandowski, Gathje, Lovett, and Gordon (2013) found that college students with ADHD diagnoses reported significantly more perceived problems with timed reading tasks and more anxiety toward tests, yet their performance on several reading and processing speed measures was not significantly different from the control group. Lewandowski and colleagues hypothesized that the college students in their sample may have historically received negative feedback about their abilities, which resulted in lower self-efficacy, or that these college students may have a general tendency that makes them more likely than other students to endorse self-report impairment items.
Several potential explanations are worth considering in an attempt to account for the discrepancy that we found between college students’ self-reported problems and their actual performance on measures involving speed. First, as hypothesized by Lewandowski and colleagues (2013), it may be that students who are endorsing more SCT symptoms have a tendency to endorse more problems across all measures. Previous studies have found that college students in a High-SCT group are also more likely to endorse significantly more symptoms of anxiety, depression, and inattention than those in the Low-SCT group (Wood, 2015). Therefore, the impairment reported by college students who endorse elevated SCT symptoms may be more indicative of a general tendency to endorse problems. Perhaps these individuals experience general problems with adjustment and life satisfaction. Another consideration is that as the High-SCT group students endorsed a wide range of problems across domains (e.g., anxiety, depression), it may be that the reported impairment is more likely to be caused by these other factors than by SCT symptoms specifically. Indeed, Wood (2015) found that when controlling for related symptom sets (i.e., ADHD, anxiety, depression) and behavioral characteristics (i.e., sleep, health, substance use), SCT symptoms no longer predicted a significant amount of self-reported functional impairment.
Another explanation for the findings is that students may have been accurate in reporting their perceived impairment, but the processing speed and reading measures used in this study may not be representative of the kinds of tasks that students with high SCT levels would struggle with in their everyday lives. For example, in college, students are asked to read lengthy academic material (e.g., an entire textbook chapter). This may cause college students to rate their difficulties with reading as more severe than they appeared on our brief reading measures and may explain why the results did not identify significant reading difficulties associated with SCT symptoms. A similar explanation has been used to account for discrepancies between executive functioning rating scales and more objective cognitive tasks measuring executive functioning (Barkley, 2016; Becker et al., 2016; Jarrett et al., 2017).
Finally, SCT symptoms may simply not be significantly related to measures of processing speed. If this is the case, researchers must ask whether “sluggish” is the best way to describe this construct. Furthermore, SCT symptoms may be associated with other neurocognitive problems besides processing speed. Although Jarrett and colleagues (2017) did not find significant relationships between SCT symptoms and measures of visual working memory, sustained attention, or reaction time, their study warrants extension and replication. Clearly, more studies are needed to clarify the relationship between SCT symptoms and a comprehensive battery of performance-based measures prior to determining the clinical utility of the SCT construct. Perhaps, as Becker and colleagues (2016) suggested, SCT symptoms may comprise a “transdiagnostic” construct rather than a unique disorder. Or, as Lewandowski, Wood, and Lovett (2016) have suggested, SCT symptoms may be more of a personality construct or “style” than a disorder with a unique impairment profile.
Clinically, these findings suggest that students with SCT symptoms are not at any significant disadvantage in terms of speed when completing tests. Therefore, at present, clinicians should not advocate for extended time as an accommodation simply because a student has an elevated level of self-reported SCT symptoms.
Limitations and Future Research
These findings should be considered in light of several limitations. First, these measures were administered in a group format, though the WAIS processing speed subtests were normed based upon individual administration. It may be that the format of administration affected the relationship between SCT symptoms and processing speed. Second, this study obtained data from only one informant for self-report measures. While additional research is needed to determine the proper method of assessing SCT symptoms, an additional collateral reporter may help to corroborate self-report measures. Furthermore, this study utilized only a unidimensional measure of SCT, though research has suggested that SCT symptoms may be multidimensional with three primary factors (sleepy, daydream, and slow; Langberg, Becker, Dvorsky, & Luebbe, 2014). Using a multidimensional measure of SCT may have resulted in a different relationship between the separate SCT factors and processing speed. Fourth, the cutoff score for identifying the “High-SCT” group is relatively arbitrary. Although Barkley (2012) recommended a cutoff of five symptoms, he generated this number by calculating the 95th percentile cutoff. As 11% to 13% of college students meet this five-symptom “cutoff,” researchers should investigate the appropriateness of this cutoff for college students. Finally, this study is limited by the measures that were used to assess processing speed and reading fluency and comprehension. The measures in this study were brief and restricted in focus. Such measures may not have been representative of the kinds of tasks that college students complete in their day-to-day activities. Future research would benefit from expanding the battery of tests to include ecologically valid measures of other neurocognitive areas of interest (e.g., sustained attention, response time, memory, executive functioning).
Despite growing evidence for the validity of the SCT construct (Becker et al., 2016), much remains to be understood about the impairment associated with SCT. Although several SCT symptoms focus on “sluggish” behavior, our findings suggest that college students who endorse elevated levels of SCT symptoms are not reliably more “sluggish” in their performance on timed measures of processing speed or reading accuracy and comprehension. In light of this, researchers should broaden their examination of neurocognitive functioning among college students with SCT to determine what type of neurocognitive deficit, if any, is associated with the SCT construct.
Footnotes
Declaration of Conflicting Interests
The author(s) declared no potential conflicts of interest with respect to the research, authorship, and/or publication of this article.
Funding
The author(s) received no financial support for the research, authorship, and/or publication of this article.