
Abstract
Introduction
ADHD has been intensively investigated as one of the obesity risk factors. Studies in recent years have shown that ADHD is associated with a higher risk of overweight and obesity in school-aged children and adolescents (Hanć, Cieślik, Wolańczyk, & Gajdzik, 2012; Hanć, Słopień, Wolańczyk, Dmitrzak-Węglarz, et al., 2015; Hanć, Słopień, Wolańczyk, Szwed, et al., 2015; Khalife et al., 2014; Racicka, Hanć, Giertuga, Bryńska, & Wolańczyk, 2015; R. Yang, Mao, Zhang, Li, & Zhao, 2013). Current meta-analysis, including 42 studies, has confirmed a significant association of ADHD with obesity in both children and adults (Cortese et al., 2015). However, it is not clear what factors underlie the ADHD–obesity relationship.
In recent years, there have been a few attempts to explain the genetic background of comorbidity of these disorders (Agranat-Meged et al., 2008; Albayrak et al., 2013; Gray et al., 2006; Kernie, Liebl, & Parada, 2000; Lynos et al., 1999). Moreover, the co-occurrence of ADHD and obesity can also be associated with deficits in executive functions. Previous studies indicate that a deficit in executive functions occurs both in obese children and adolescents (Reinert, Po’e, & Barkin, 2013), as well as in patients with ADHD (Willcutt, Doyle, Nigg, Faraone, & Pennington, 2005). Only a few studies have tested deficits in executive functions and self-regulation as a possible cause of increased risk of obesity in children with ADHD, and their results are contradictory (Choudhry et al., 2013; Graziano et al., 2011). Moreover, because the deficits in the executive functions can be shared by ADHD and the obesity phenotype, developing on the same genetic background, it seems reasonable to carry out studies analyzing the total contribution of candidate genes for ADHD and deficit in executive functions as determinants of the risk of obesity in patients with ADHD. So far, however, such studies have not been conducted.
The aim of the present study was to assess the relationship of overweight among children with ADHD with selected polymorphisms in candidate genes for ADHD, which may cause a tendency to excessive weight gain through a neuropsychological mechanism, connected with deficits in executive functions. We assumed that we will demonstrate both the relationship between the polymorphisms and deficits of executive functions with the occurrence of overweight among boys with ADHD, and that the deficits of executive functions underlying obesity in this group will be genetically conditioned.
Materials and Method
Ethical Statements
The study used data collected during a project carried out in the years from 2007 to 2010 that aimed at evaluating the relationship of selected genotypes and alleles of candidate genes with ADHD symptoms and cognitive functions of patients (Słopień, 2011). The project was approved by the Bioethics Committee at the Medical University in Poznan and Warsaw, and has been performed in accordance with the ethical standards laid down in the 1964 Declaration of Helsinki and its later amendments; it was also consistent with the national law. For the purpose of the project, we have collected the data on selected candidate genes polymorphisms, performed neuropsychological tests, and collected clinical, sociodemographic information and the data on the development and health of children. The participants and their legal guardians were fully informed about the research procedures, and legal guardians gave a written consent to participate in the study.
ADHD Diagnosis
The study group comprised of unrelated patients aged 7 to 17 years with a diagnosis of ADHD. Parents and their children were informed about the possibility of withdrawing from the study at any time. Patients were recruited in the Outpatient Clinic of Psychiatry and Department of Child and Adolescent Psychiatry at the Poznan University of Medical Science, and in the Department of Child Psychiatry at the Medical University of Warsaw.
Patients were diagnosed by two independent psychiatrists through diagnostic interviews with a parent directed toward the ADHD and comorbid disorders (Wolańczyk & Kołakowski, 2005) based on Diagnostic and Statistical Manual of Mental Disorders (4th ed., text rev.; DSM-IV-TR; American Psychiatric Association [APA], 2000), and with the use of the ADHD Rating Scale–IV (DuPaul, Power, Anastopoulos, & Reid, 1998) and Conners’ Rating Scale (parents and teachers version; Conners, 1973). The exclusion criteria were organic central nervous system (CNS) dysfunctions (e.g., epilepsy, serious trauma, tumors, and infections of the CNS), endocrine disease (e.g., hypothyroidism, Cushing’s syndrome, growth hormone deficiency, hypogonadism, pseudohypoparathyroidism), genetic syndromes and co-occurring schizophrenia, and bipolar disorder. Drugs used to treat ADHD and other disorders that may affect the CNS (e.g., antihistamines) were withdrawn for 72 hr before performing the neuropsychological tests.
Genetic Studies
ADHD is the most common behavioral and neurodevelopment disorder; thus, neurodevelopmental genetic factors (brain-derived neurotrophic factor [BDNF] and others) are potentially significant contributors in ADHD etiology (Bilgiç, Toker, Işık, & Kılıç, 2016). Biochemical and pharmacological studies indicate a relationship of ADHD with impaired dopaminergic, serotonergic, and noradrenergic systems (Briars & Todd, 2016). According to this knowledge, in the study, we examined genes that were chosen based on a literature review for association studies of genes that could have an impact on ADHD development. Among the selected 14 polymorphisms of eight genes were polymorphisms previously analyzed for the potential relationship with ADHD and the new ones selected due to their functioning in the neural system or a relationship with neurodevelopmental disorders. We examined the genes for dopamine receptor DRD2 (polymorphism rs1799732 associated with schizophrenia, Cordeiro, Siqueira-Roberto, Zung, & Vallada, 2009), DRD3 (rs6280 associated with ADHD, Ettinger, Joober, De Guzman, & O’Driscoll, 2006), and DRD4 (rs1800955 related to ADHD, J. W. Yang et al., 2008; rs1800443 related to impulse control, Zainal Abidin et al., 2015; 48 variable number of tandem repeats [VNTR] related to ADHD, Ettinger et al., 2006), the dopamine transporter DAT (three polymorphisms associated previously with ADHD: rs27072, Gizer, Ficks, & Waldman, 2009; rs463379, Friedel et al., 2007; VNTR 3′-UTR, Ettinger et al., 2006), catechol-O-methyltransferase COMT (rs4680 related to ADHD, Ettinger et al., 2006), presynaptic protein SNAP25 (rs363039 related to ADHD, Söderqvist et al., 2010; rs363043 and rs363050 associated with autism, Braida et al., 2015), serotonin receptor 5HTR2A (rs17288723 related to depression and effects of antidepressant treatment, Horstmann et al., 2010), and BDNF (rs6265 related to ADHD, Gizer et al., 2009).
DNA isolation from peripheral blood, as well as an analysis of the gene DRD4 polymorphism rs1800955, and DAT and DRD4 genes VNTR polymorphism, were performed in the Laboratory of Psychiatric Genetics, Department of Psychiatry, Poznan University of Medical Sciences. Studies of other Single Nucleotide Polymorphisms (SNP) were performed at the Department of Genomics at the University of Bonn. The salting-out method was used for the isolation of DNA from peripheral blood (Miller, Dykes, & Polesky, 1988). DRD4 gene polymorphism rs1800955 was analyzed by Polymerase Chain Reaction - Restriction Fragment Length Polymorphism (PCR - RFLP) through amplification of the DRD4 gene promoter region using the procedures and primers described by Jönsson et al. (2001). DAT gene VNTR polymorphism was analyzed with the PCR-VNTR through amplification of the 3′UTR region of the gene using the primers described by Vandenbergh et al. (1992). The examined polymorphism is characterized by a VNTR in the 3′-untranslated region (3′-UTR) of a gene. A single motif has a size of 40 bp, and may be repeated by 3 to 13 times. DRD4 gene VNTR polymorphism was analyzed with the same method through amplification of the DRD4 gene region of exon 3 using primers described by Mill et al. (2002). A single motif has a size of 48 bp. Alleles described so far had from 2 to 11 repeats of this motif. The SNP determination was performed by the IPLEX Gold using a system of Sequenom. The applied methodology allowed for the use of robotic systems and inspection of the signal quality (positive control—1.5%, negative—1.5%, and duplicate samples—1.5%). The analysis with the use of a Sequenom system is based on the multiplex PCR and mass spectrometry (Ross, Hall, Smirnov, & Ha, 1998).
Neuropsychological Examination
The level of executive functions was evaluated based on the results of seven neuropsychological tests. The tests were performed in the following order: computerized version (Borkowska, 2008) of Continuous Performance Test (CPT; Rosvold, Mirsky, Sarason, Bransome, & Beck, 1956), The Stroop Color-Word Interference Test (SC-WIT; Stroop, 1935), The Trail Making Test A and B (TMT; Reitan, 1985), The Matching Familiar Figures Test (MFFT; Kagan, Rosman, Day, Albert, & Phillips, 1964), Verbal Fluency Test (VFT; Lezak, 1995), and The Rey-Osterrieth Complex Figure (ROCF; Osterrieth, 1944). Wisconsin Card Sorting Test (WCST; Heaton, Chelune, Talley, Kay, & Curtis, 1993) was performed as the first or last (detailed description of neuropsychological indicators used in the study is presented in Online Appendix 1 of the Online Supplement).
Anthropometric Assessment and Overweight Diagnosis
Assessment of obesity was not the objective of the project from which the data used in the present study were collected. Measurements of height and body weight were performed additionally in the clinical evaluation of patients. Height measurements were performed according to standard procedures (de Onis, Onyango, Van den Broeck, Chumlea, & Martorell, 2004; Hanć, Janicka, Durda, & Cieślik, 2013) using stadiometer with precision to 1 mm. Body weight was measured using medical weight with precision to 100 g. Patients were weighed in their underwear. Measurements were performed by trained medical personnel. On the basis of the measurements, we calculated the body mass index (BMI). Height, weight, and BMI were standardized for age and sex based on Polish growth charts (Kułaga et al., 2010). These growth charts give standard measurements at an interval of 1 year; therefore, when calculating the z scores, we assumed a constant rate of change of the mean and standard deviation between 1 year and the next. Underweight, overweight, and obesity were diagnosed in patients under the guidance of the International Obesity Task Force (Cole, Bellizzi, Flegal, & Dietz, 2000; Cole, Flegal, Nicholls, & Jackson, 2007).
Statistical Methods
To compare the prevalence of overweight in patient subgroups distinguished on the basis of the category of the controlled variables, the Pearson’s chi-square test or the Fisher’s exact test were used. To evaluate the differences in neuropsychological tests between groups distinguished by the presence of overweight or alleles and genotypes, the ANOVA, Kruskal–Wallis test, or Mann–Whitney U tests were used, depending on the number of compared groups and whether the compared groups met the requirements of the parametric tests. The Tukey’s and Dunn’s post hoc tests were used to confirm the significance of differences between groups in case of multiple comparisons.
To isolate two patient groups, homogeneous due to the pattern of obtained results of neuropsychological tests, we applied the cluster analysis with the method of k-means on cases, after previous standardization of results of individual indicators to their own means and standard deviations.
The relationship of alleles and genotypes with overweight was evaluated with the help of the chi-square and Fisher’s exact tests. Stepwise logistic regression with Quasi-Newton estimation method was used to evaluate the strength of the relation between selected genotypes with overweight and obesity. Genotypes were tested in models unadjusted to other variables. All tests were considered to be statistically significant at p < .05 and not corrected for multiple testing. Statistica (Version 9) was applied for all statistical analyses. The power analysis was performed with the use of G*Power (Version 3.1).
Results
The database we used contained data of 205 patients. However, it was not possible to obtain the complete data for all the examined participants. Because of that, we excluded from the test those patients for whom we could not obtain the date of birth (necessary to calculate the exact age and for the standardization of the anthropometric measurements), full anthropometric data, or DNA sample. Due to a small number of girls with complete data, in our analyses, we only used data of boys (the procedure of data selection is presented in Figure S1 of the Online Supplement).
The final study sample consisted of 109 boys, aged between 7 and 17 years (M = 11.13, SD = 2.79). Basic characteristics of the sample are presented in Table 1. According to G*Power (Version 3.1), the sample size provides a 75% to 99% chance of detecting moderate to large effects in case of the chi-square test, 63% to 97% for ANOVA, and 0.57% to 0.99% for the t-student test if at a two-tailed alpha level of .05. For small effects, the power falls down to 12%, 14%, and 14%, respectively.
Basic Characteristics of the Sample.
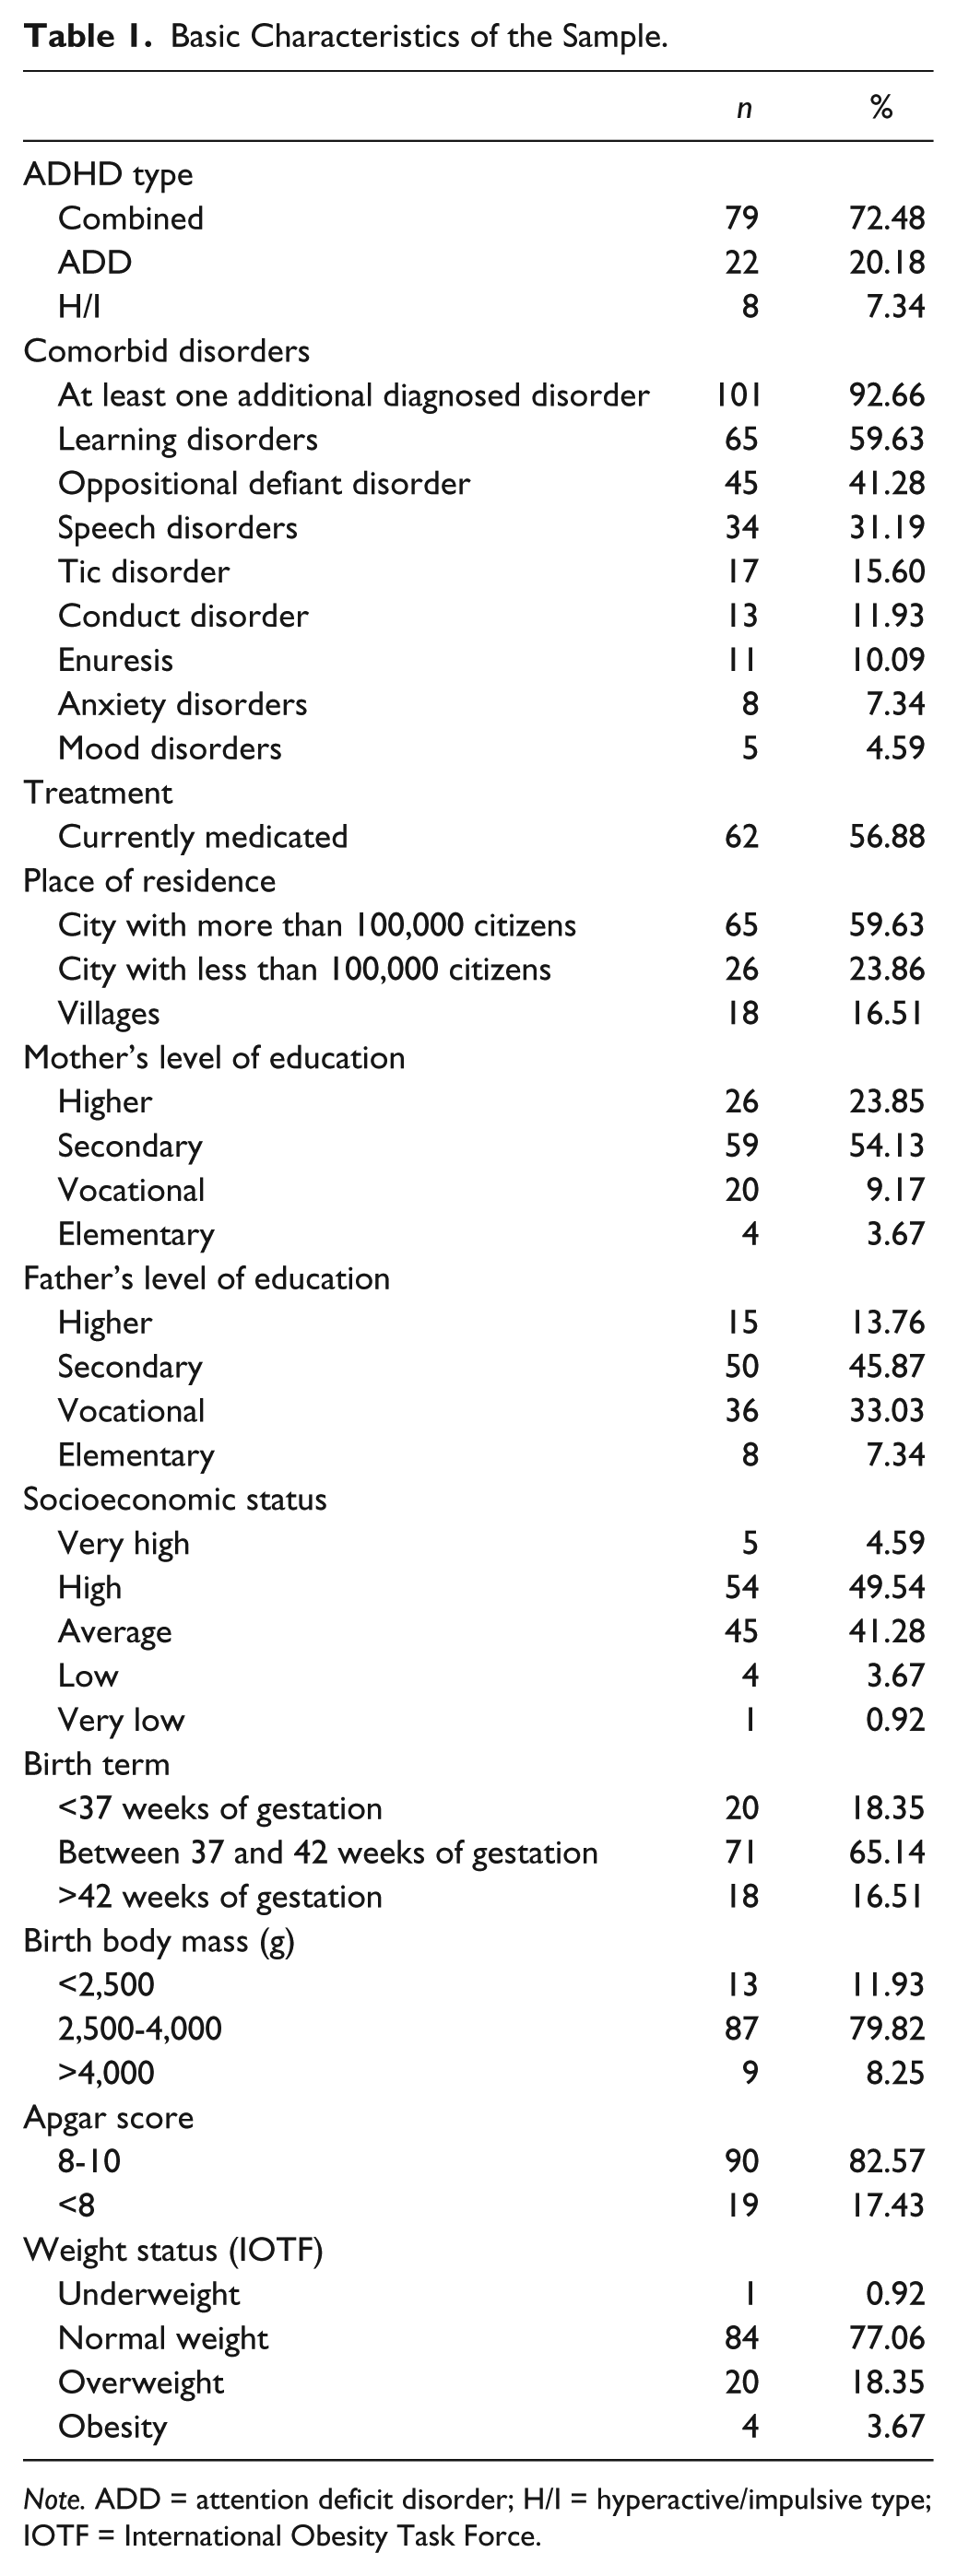
Note. ADD = attention deficit disorder; H/I = hyperactive/impulsive type; IOTF = International Obesity Task Force.
Most of the boys had a combined type of ADHD (72.48%) and at least one comorbid disorder (92.66%). The most frequently recognized comorbid disorders in the group were the learning disorders (59.63%) and oppositional defiant disorder (41.28%). At the moment of recruitment, 56.88% of the boys were treated pharmacologically due to ADHD and/or comorbid disorders. The mean of body height adjusted for age and sex was 0.21 (95% confidence interval [CI] = [0.002, 0.40], SD = 1.00), for age and sex adjusted weight 0.08 (95% CI = [−0.1, 0.26], SD = 0.95), and for age and sex adjusted BMI 0.02 (95% CI = [−0.17, 0.21], SD = 0.99). Underweight was present in one boy (0.92%), overweight in 20 (18.35%), and obesity in four (3.6%). Due to a small number of boys with obesity, in all analyses presented below, we have evaluated the prevalence of overweight understood as abnormally elevated body weight (overweight + obesity). The prevalence of overweight was not dependent on controlled variables such as socioeconomic status, the date of birth, birth weight, Apgar score, ADHD subtype, symptoms intensity, pharmacological treatment, or comorbid disorders (results are described in detail in Appendix 2 of the Online Supplement).
Analysis of the Relationship Between Polymorphisms and Executive Functions
General results of neuropsychological tests are presented in Table S1 and the prevalence of genotypes and alleles of analyzed polymorphisms are shown in Table S2 of the Online Supplement.
The k-mean clustering analysis test was used to distinguish two clusters of patients with substantially different results of neuropsychological tests (see Appendix 3 and Table S3 of Online Supplement). Based on the configuration of the test results, we have concluded that Cluster 1 represents patients with a low level of executive functions (LLEF; lower scores for indicators: the first response time in MFFT, the number of words and the number of correct words in both parts of VFT, and with higher scores for all other indicators), and Cluster 2 represents patients with a high level of executive functions (HLEF; higher scores for indicators: the first response time in MFFT, the number of words and the number of correct words in both parts of VFT, and lower scores for all other indicators).
The Mann–Whitney U test was used to test the differences in the results of the neuropsychological tests obtained, depending on the present alleles and genotypes of studied polymorphisms. In the case of genotypes, the tests were carried out in the recessive (AA vs. Aa+aa) and the dominant (aa vs. Aa+AA) model. The relationship of alleles and genotypes with LLEF and HLEF were tested with chi-square or Fisher’s exact tests. All polymorphisms, except DAT VNTR, were significantly connected with the results of the neuropsychological tests (Table 2). Related to LLEF were rs1800443 (allele G: p = .02, genotype GT: p = .02) and rs1800955 (genotype TT: p = .02) of gene DRD4 and DAT rs463379 (allele C: p = .02, genotypes GC and CC: p = .01).
The Association of Polymorphisms With the Results of Neuropsychological Tests.
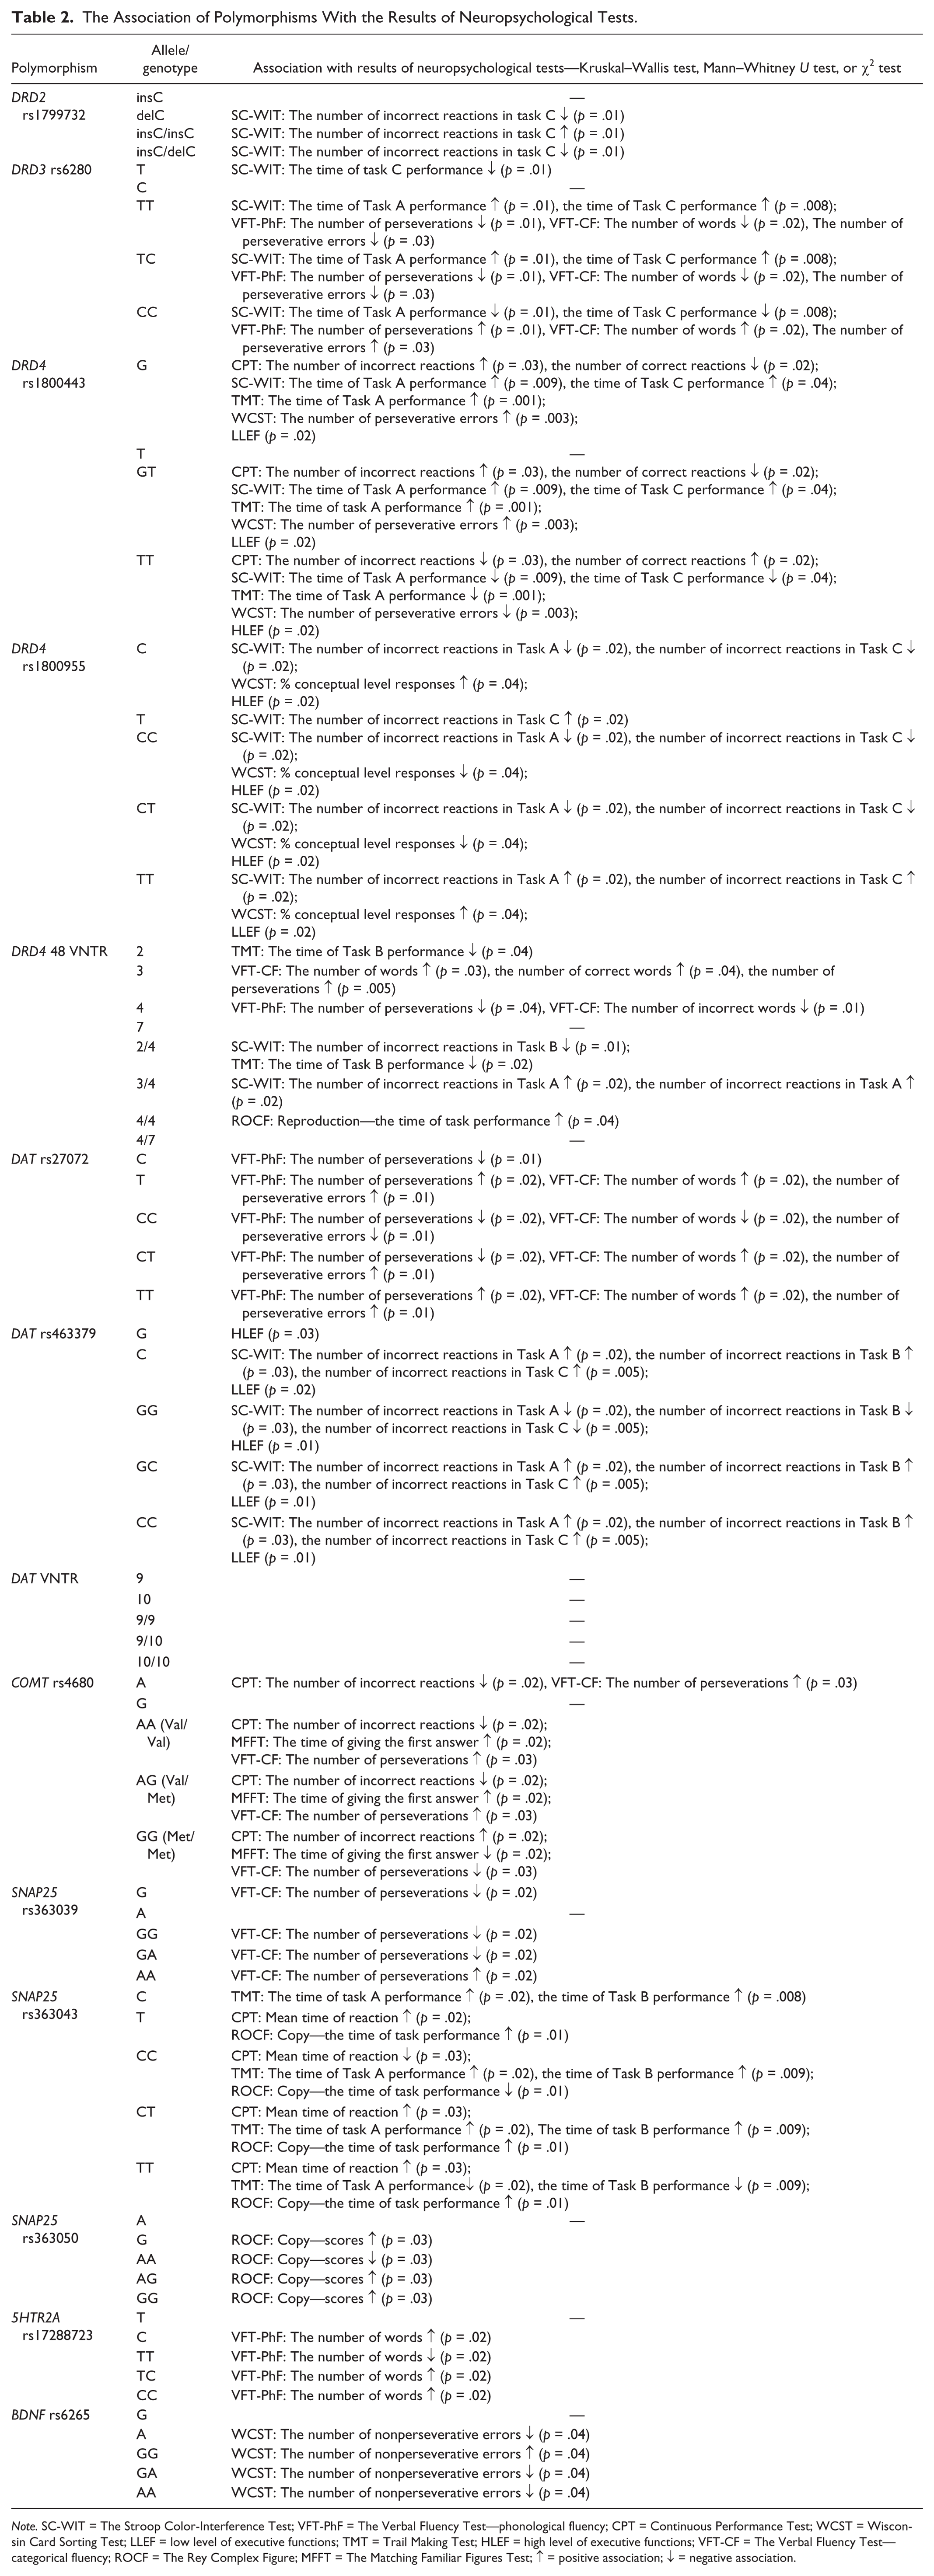
Note. SC-WIT = The Stroop Color-Interference Test; VFT-PhF = The Verbal Fluency Test—phonological fluency; CPT = Continuous Performance Test; WCST = Wisconsin Card Sorting Test; LLEF = low level of executive functions; TMT = Trail Making Test; HLEF = high level of executive functions; VFT-CF = The Verbal Fluency Test—categorical fluency; ROCF = The Rey Complex Figure; MFFT = The Matching Familiar Figures Test; ↑ = positive association; ↓ = negative association.
Analyses of the Relationship of Polymorphisms With Overweight
Four alleles were statistically significantly less frequently present in the group of patients with overweight than in the group of patients without overweight: DRD4 rs1800955 allele T (72.73% vs. 90.48%, χ2 = 4.79, p = .03), SNAP25 rs363039 allele A (41.67% vs. 64.71%, χ2 = 4.13, p = .04), SNAP25 rs363043 allele C (75% vs. 92.94%, χ2 = 6.15, p = .01), and 5HTR2A rs17288723 allele C (8.33% vs. 28.24%, χ2 = 4.08, p = .04; Table 3).
The Differences in the Frequency of Studied Alleles Between Patients With and Without Overweight.
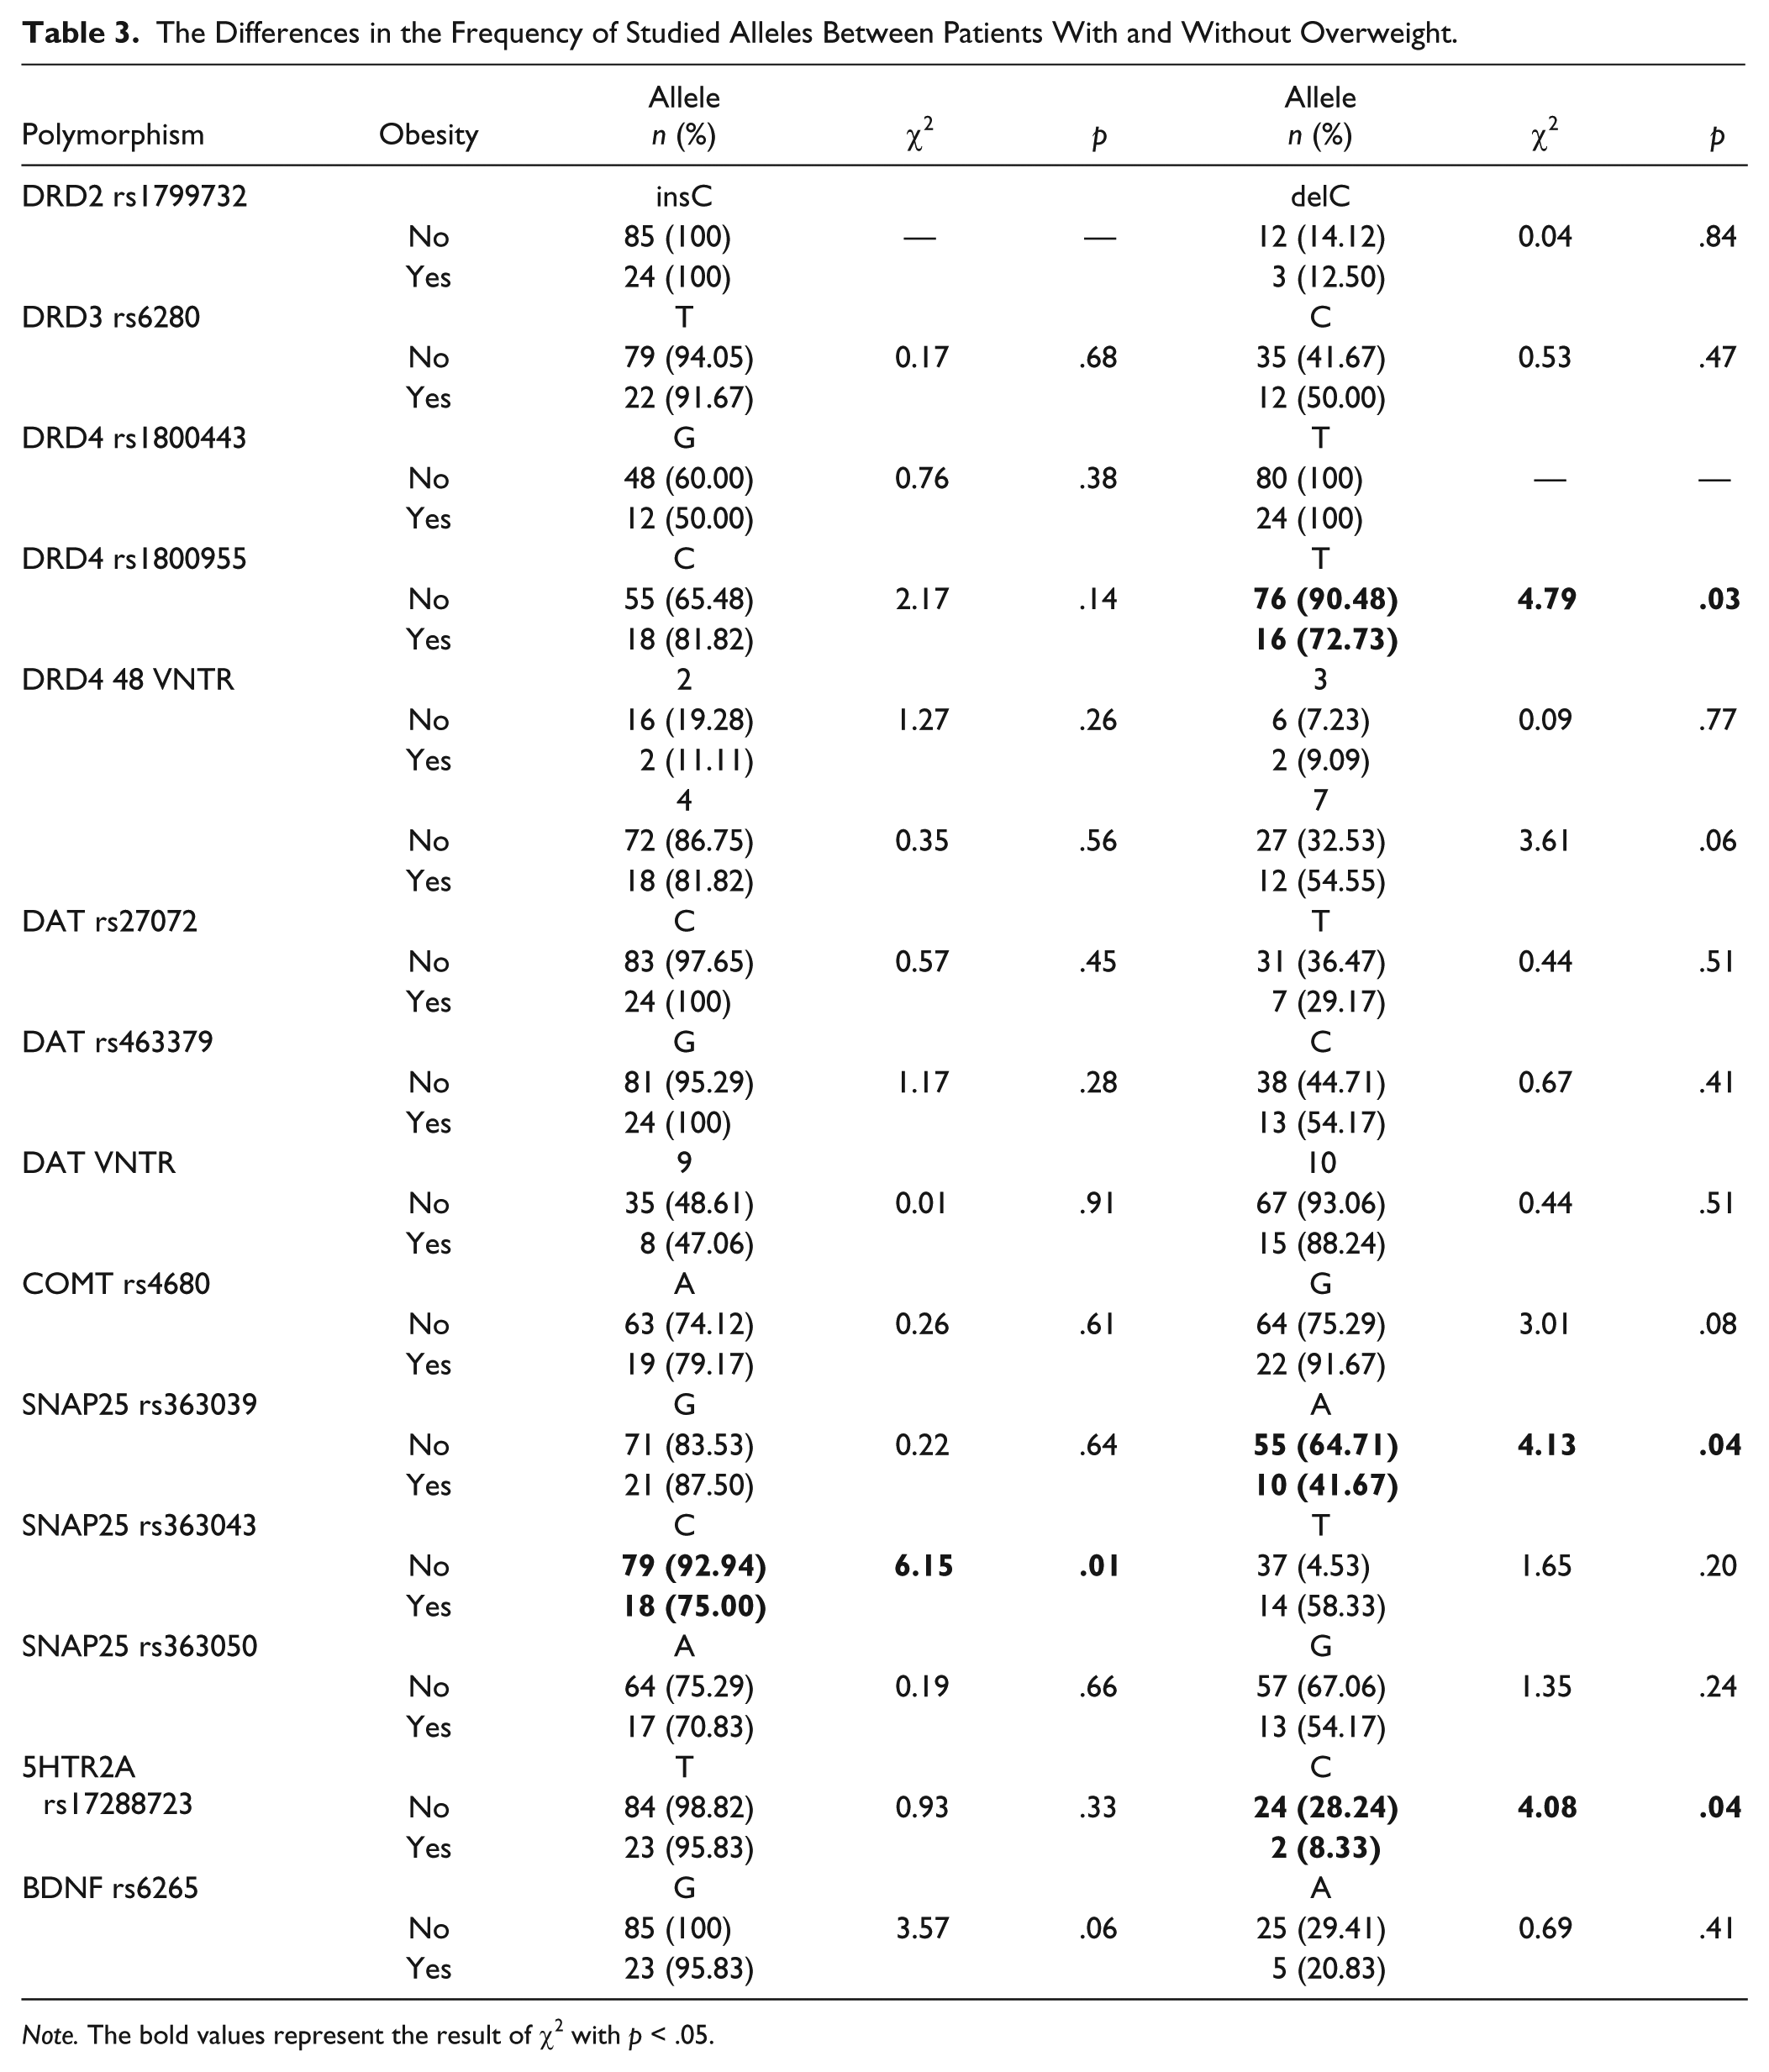
Note. The bold values represent the result of χ2 with p < .05.
The tests have shown significant diversity in the prevalence of genotypes of four polymorphisms between boys with and without overweight: DRD4 rs1800955 (for table 2 × 2, p = .03), SNAP25 rs363039 (for table 2 × 2, p = .03), rs363043 (for table 3 × 2, p = .04; for table 2 × 2, p = .02), and 5HTR2A rs17288723 (for table 2 × 2, p = .04; for table 3 × 2, p = .03). The analysis of the logistic regression demonstrated that the CT and TT genotypes of rs1800955 polymorphism of gene DRD4, odds ratio (OR) = 0.28, p = .03, were associated with lower prevalence of overweight than CC, and SNAP25 rs363039 genotypes GA and AA, OR = 0.39, p = .04, were significantly associated with lower risk of overweight than GG, whereas SNAP25 rs363043 genotype TT was significantly associated with elevated risk of being obese relative to TC and CC (OR = 4.38, p = .02; Table 4).
The Differences in the Frequency of Genotypes Between Patients With and Without Overweight.
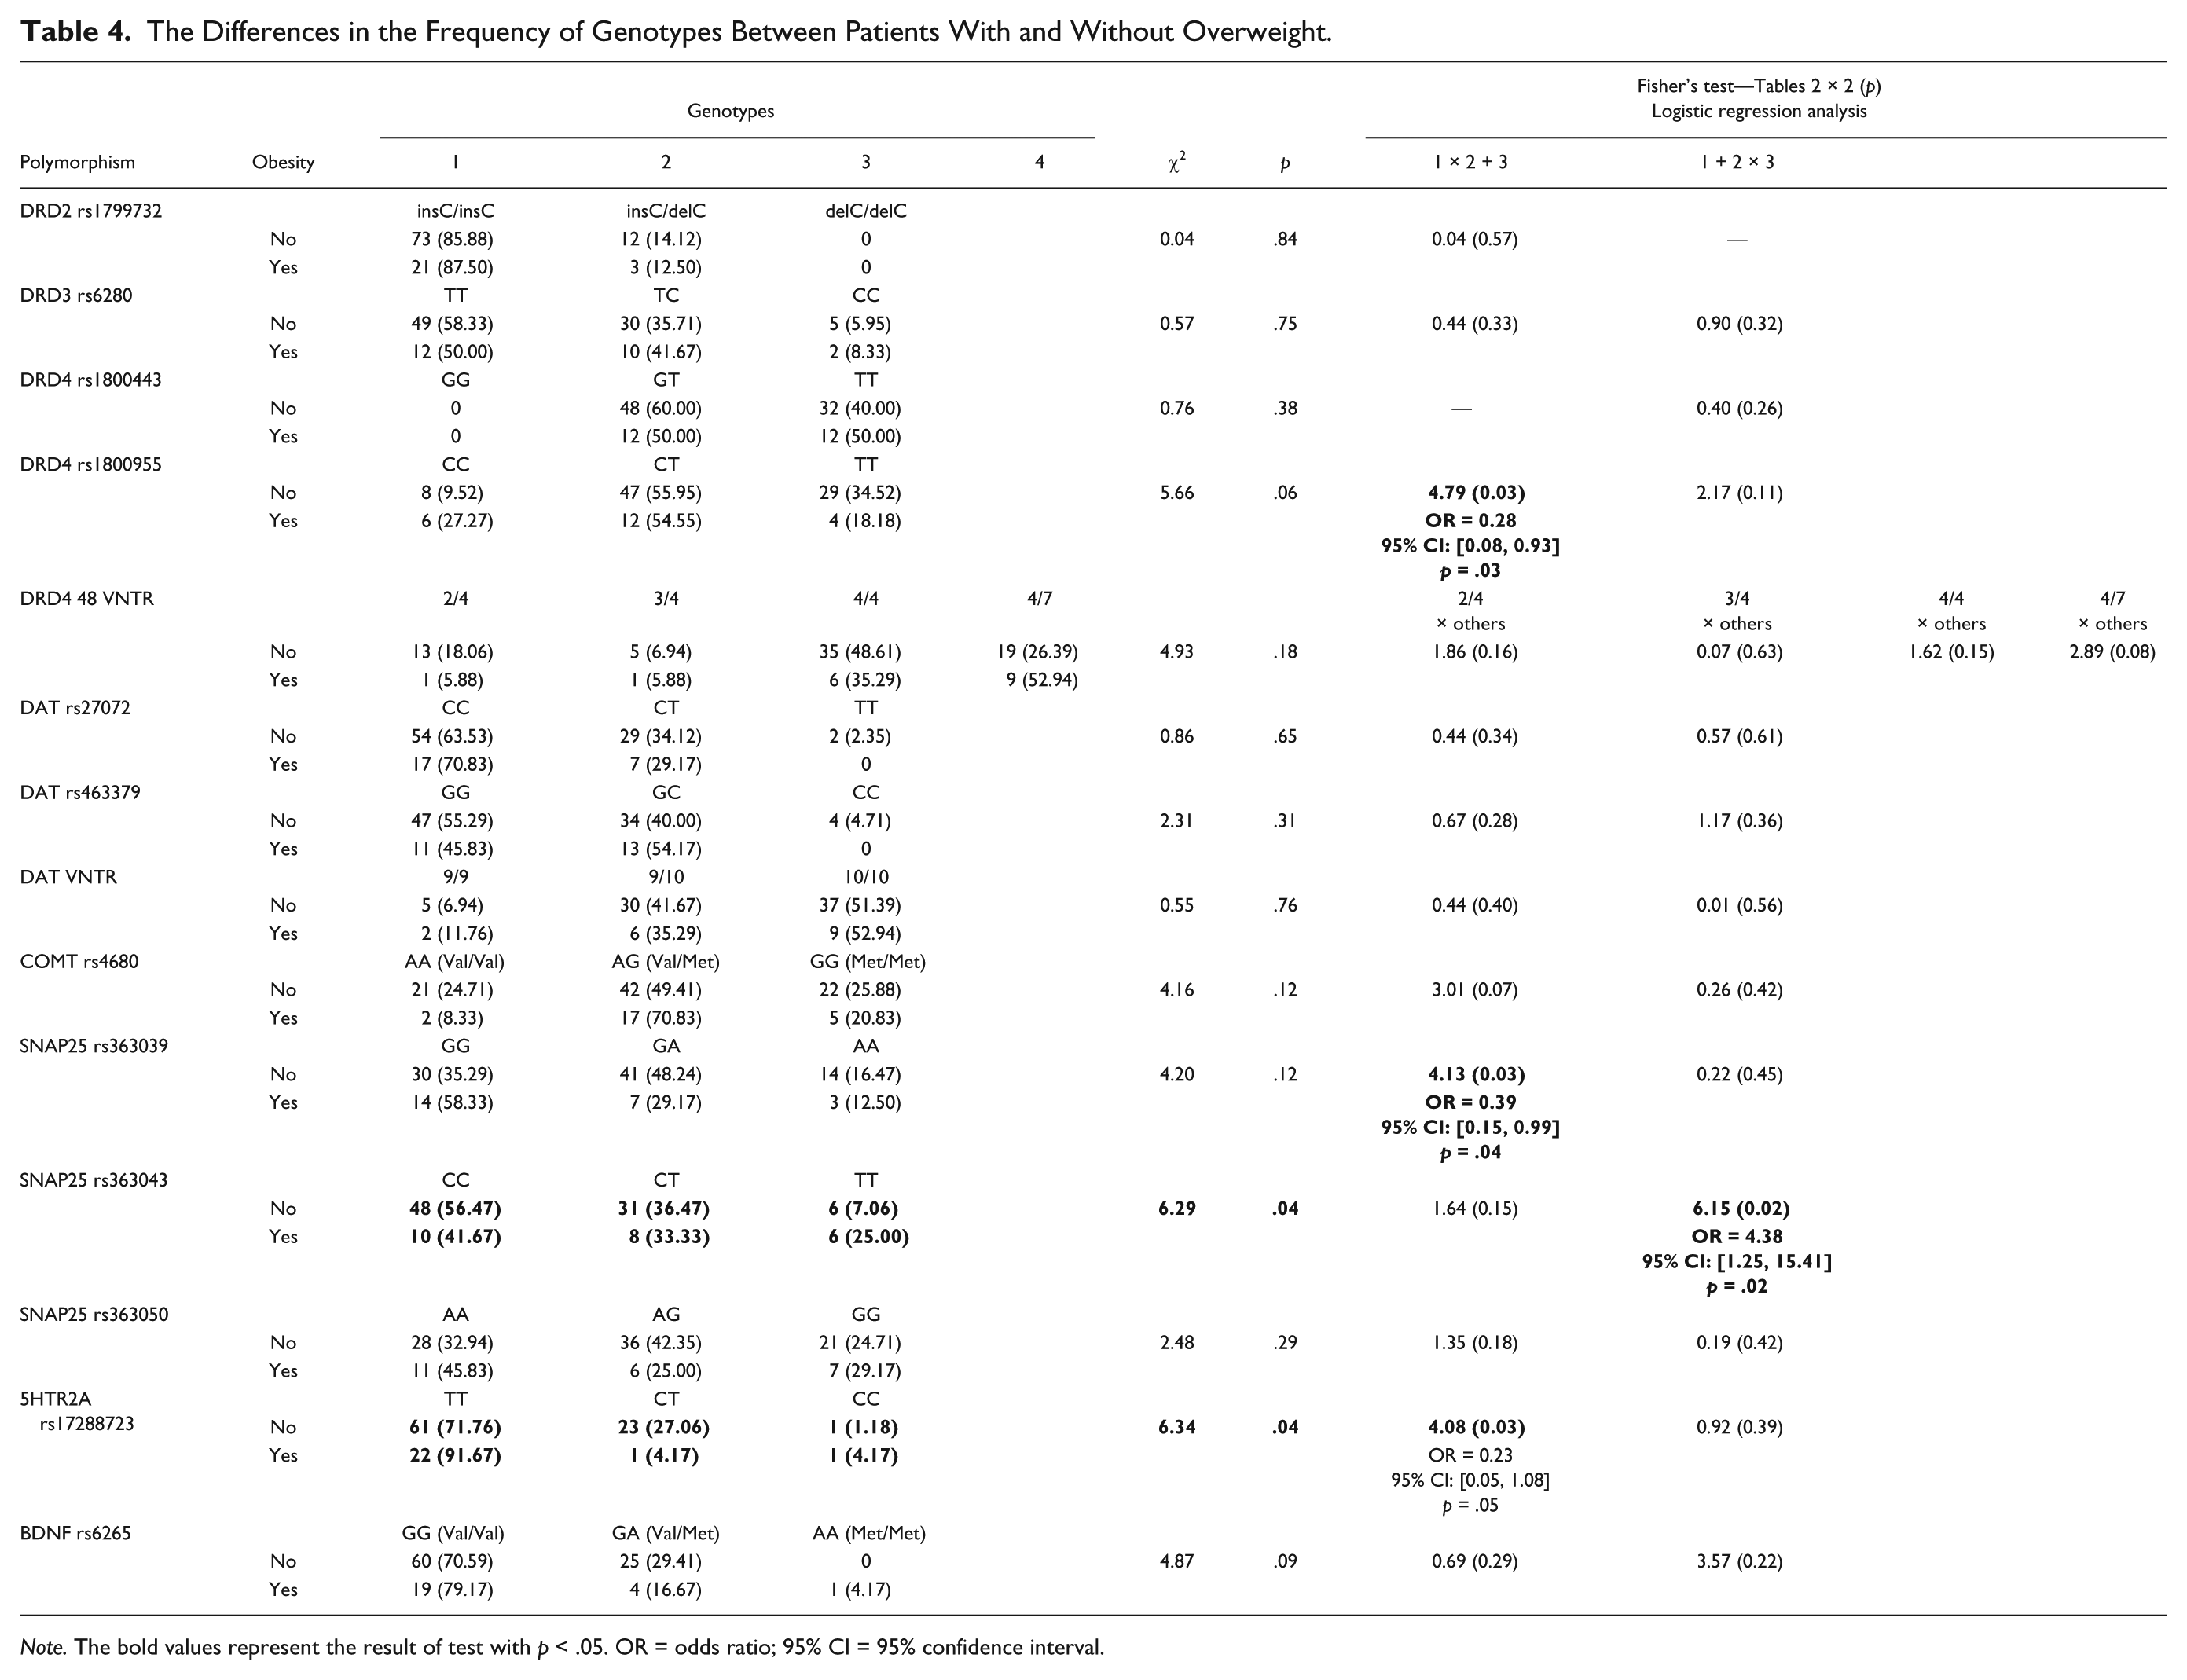
Note. The bold values represent the result of test with p < .05. OR = odds ratio; 95% CI = 95% confidence interval.
Neuropsychological Indicators and the Risk of Overweight
The Mann–Whitney U test was used to evaluate the differences in the level of the results of neuropsychological tests between patients with and without overweight. The analysis did not show any significant statistical differences between the groups (Table 5).
The Differences in Neuropsychological Tests Between Patients With and Without Overweight.
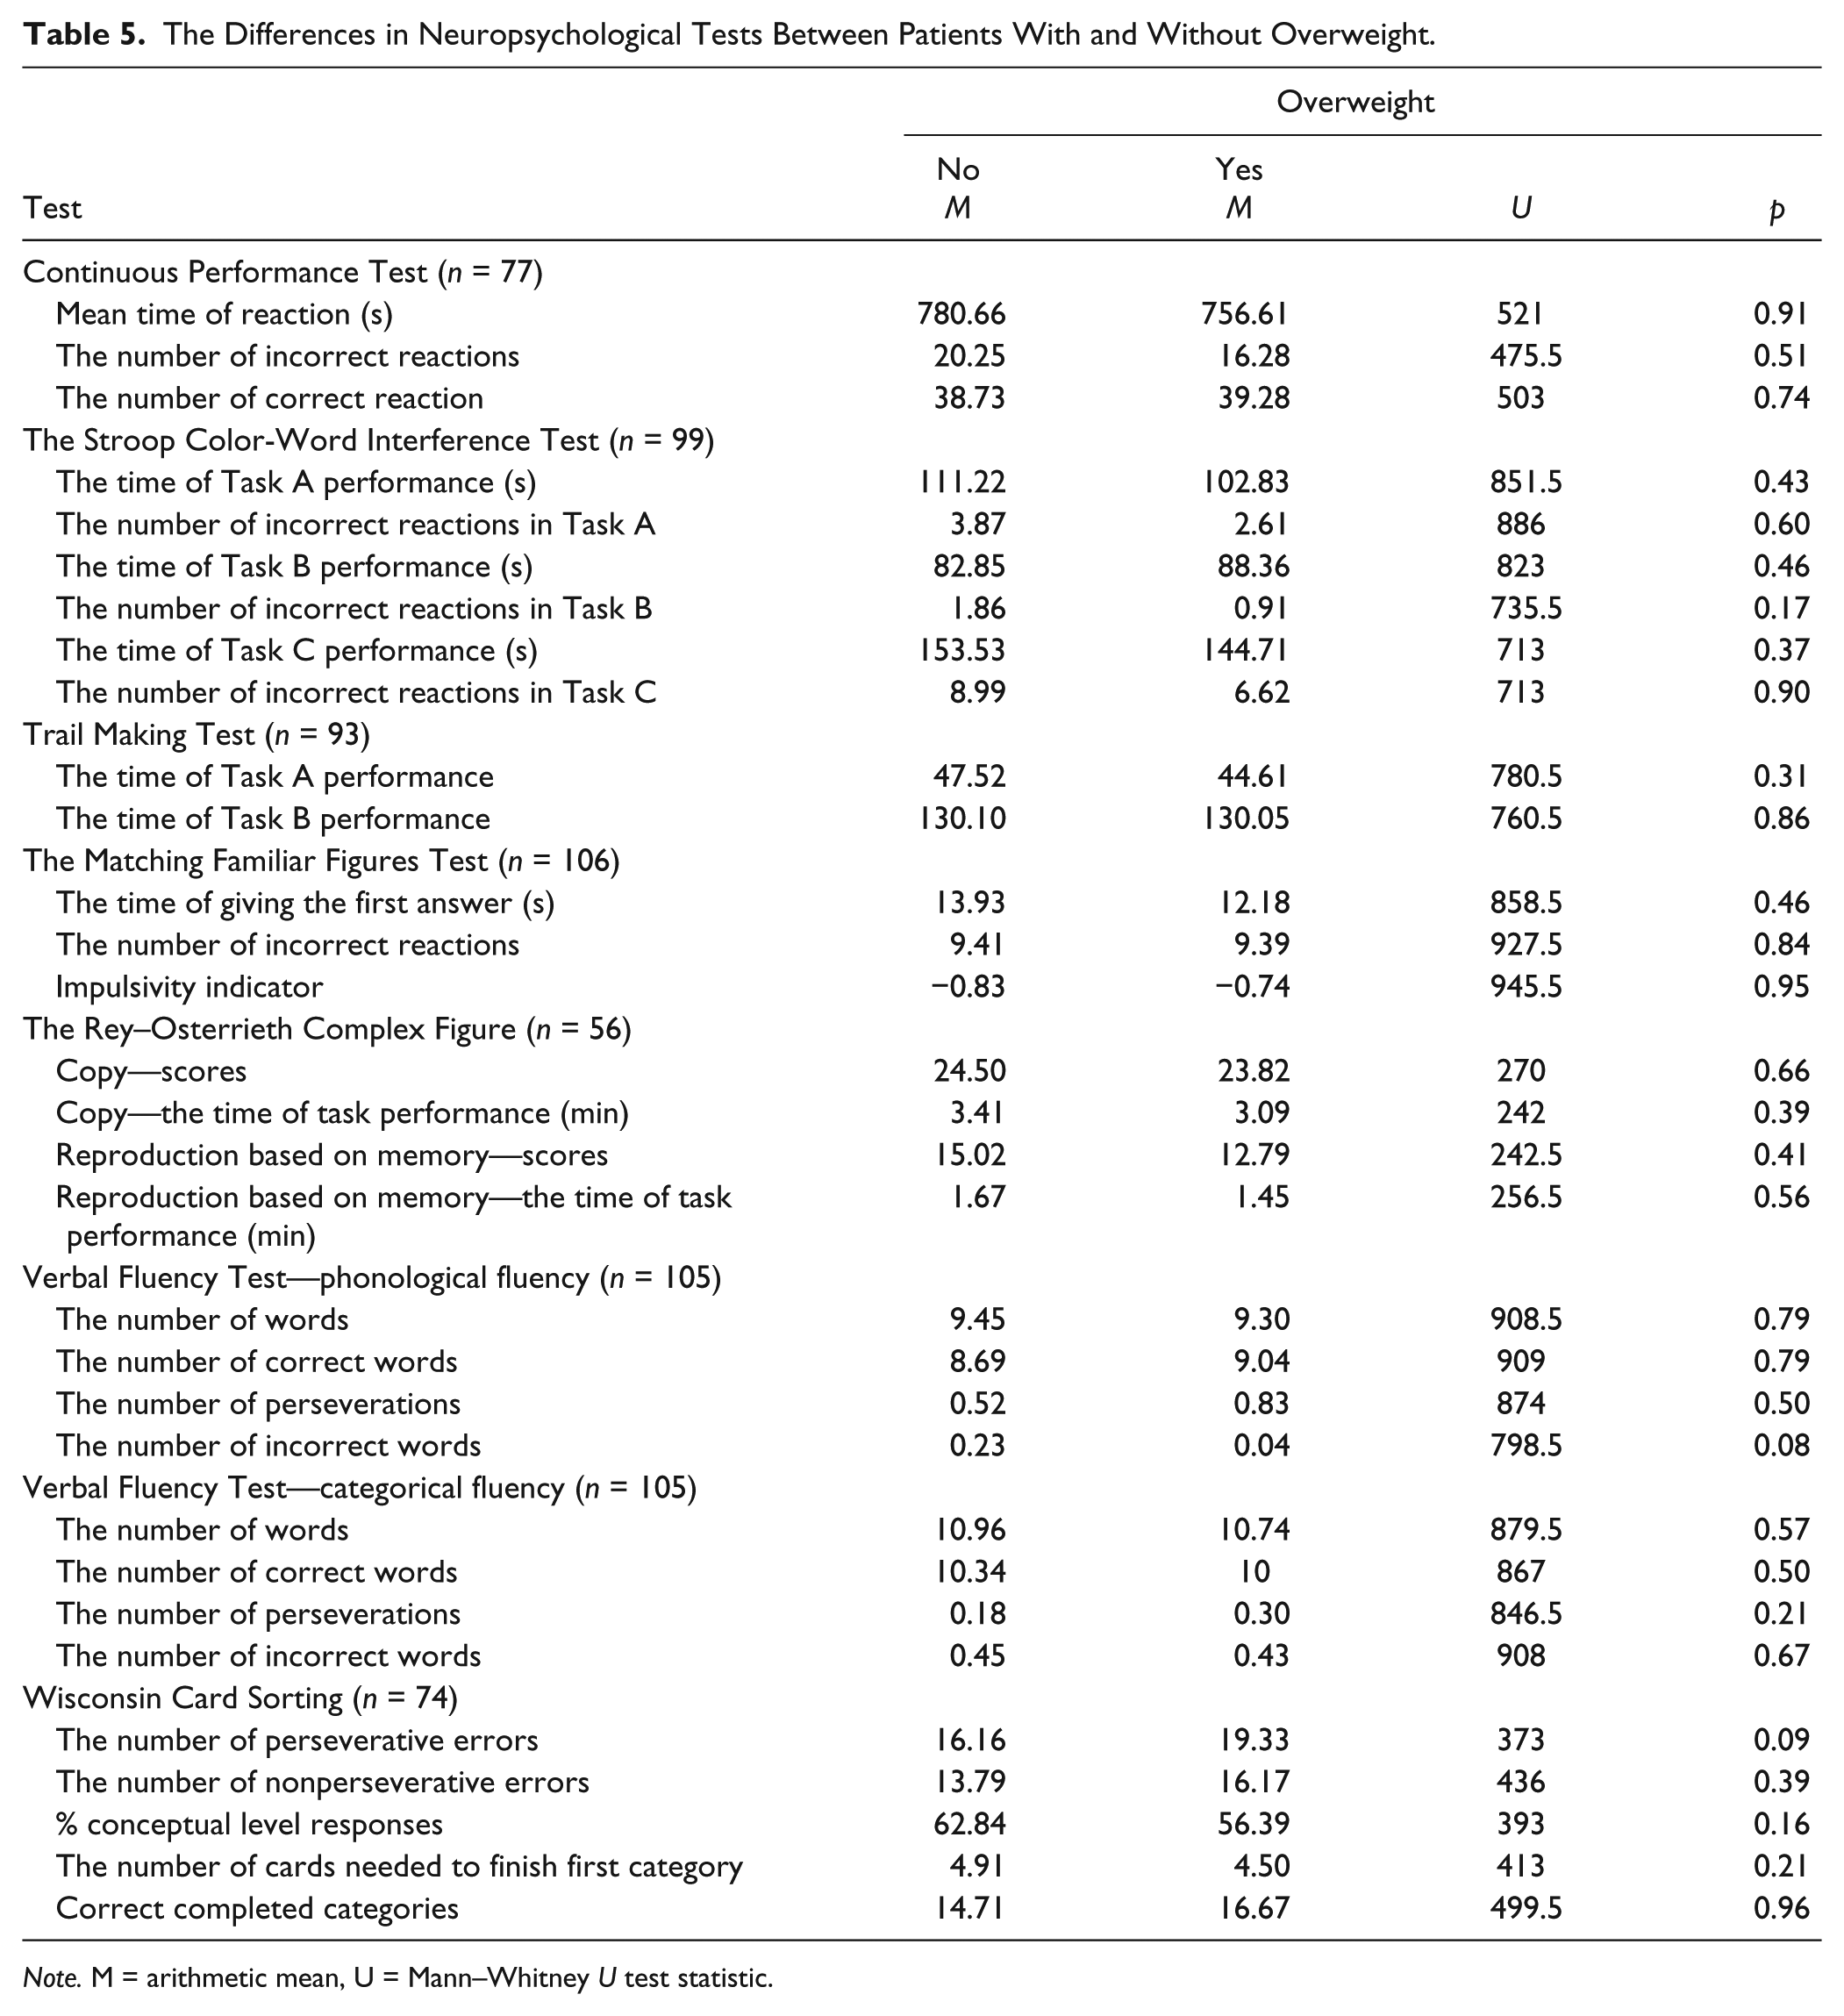
Note. M = arithmetic mean, U = Mann–Whitney U test statistic.
The chi-square test was then used to evaluate the prevalence of overweight in clusters representing patients with low and high levels of executive functions. In this case as well, the differences between clusters were not statistically significant (LLEF: 20.51% vs. HLEF: 21.43%, χ2 = 0.01, p = .91).
Discussion
The aim of the study was to evaluate the genetic and neuropsychological basis of the coexistence of ADHD and overweight. The study has indicated a relationship of overweight with polymorphisms DRD4 rs1800955, SNAP25 rs363039, rs363043, and 5HTR2A rs17288723, and strong association of most of the studied polymorphisms with the results of neuropsychological tests. Analysis did not show, however, any relationship of overweight with evaluated indicators of the level of executive functions.
In all, 13 out of 15 evaluated polymorphisms were connected with differences in the level of performance in the cognitive abilities tests. Polymorphisms of genes from the dopaminergic pathway, DRD4 rs1800443 and rs1800955, as well as DAT rs463379, had the most generalized effect on cognitive abilities, as evidenced by the differences in alleles or genotypes prevalence distribution between clusters distinguished by the level of executive functions (HLEF vs. LLEF; detailed discussion of the relationship between analyzed polymorphisms and executive functions have been described in Appendix 4 of the Online Supplement).
According to our knowledge, only two studies were carried out to test the relationship of neuropsychological test results with obesity in patients with ADHD. Graziano et al. (2011) evaluated 80 children and teenagers with ADHD (62 boys and 18 girls aged 4.5 to 18 years). The study revealed that children with ADHD and accompanying weight problems have the worst results in neuropsychological tests. Different results were obtained in the second study (Choudhry et al., 2013) on a larger sample (284 children: 210 boys and 74 girls with ADHD, aged 6 to 12 years). Children with normal weight, overweight, and obesity did not differ in terms of the level of test performance and motor activity. We obtained similar results in our study. The analyses we used did not indicate any important differences in the results of neuropsychological tests between patients with normal weight and those with overweight or obesity.
Because deficits of the evaluated executive functions do not explain the indicated relationship of polymorphisms with overweight in boys with ADHD, we must search for a different explanation. Advanced tests could evaluate mostly the “cool executive functions,” and only to a small degree, the “hot executive functions” that can be more strongly associated with increased food intake. Cool executive functions are described in the literature as goal and future-oriented skills, such as inhibition, flexibility, working memory, planning, and monitoring but which work in conditions void of context and not arousing any emotions. Hot executive functions are associated with completing tasks that arouse emotions, motivation, and tension, in which there is a choice between instant and delayed gratification (Peterson & Welsh, 2014). However, none of the tests we employed used any procedures that would, to a significant degree, activate any motivational-emotional processes in the patients.
Some of the studies indicate the presence of the reward-deficiency syndrome in both patients with ADHD (Blum et al., 1995; Heiligenstein & Keeling, 1995) and with obesity (Comings & Blum, 2000). This syndrome is connected not only with the tendency to choose immediate rewards and tendency toward risky behavior but also with improper diet. It is consistent with our hypothesis about engagement of hot executive functions in the development of overweight in boys with ADHD. Reward-deficiency syndrome is associated with alteration in the dopamine receptors DRD2 (Bazar, Yun, Lee, Daniel, & Doux, 2006) and DRD4 (Mitsuyasu et al., 2001; Tsai, Hong, Yu, & Chen, 2004), which are engaged in dopamine circuits of prefrontal attentional areas, impulse control, and reward pathways (Ariza et al., 2012); thereby, they can be connected with excessive weight gain in children and adults with ADHD (Cortese & Peñalver, 2010). Our study has confirmed the relationship of SNPs of DRD4 with overweight in the tested group. Other studies from recent years also indicated the involvement of not only DRD4 but also DAT1, in determining the development of excess body weight (Yokum, Marti, Smolen, & Stice, 2015). Among all, a relationship of DRD4 VNTR with the amount of food intake and the risk of obesity was demonstrated in children aged 3-5 and 7-8 years (Fontana et al., 2015; Silveira et al., 2014). However, among most recent studies on the genes of the dopaminergic system, there are also those that do not indicate a relationship of VNTR polymorphisms of genes DRD4 and DAT1 with obesity (Uzun et al., 2015). It is consistent with the results of our study, in which we demonstrated no association of VNTR polymorphisms of DRD4 and DAT1 with overweight in boys with ADHD.
Few studies have been conducted so far on the relationship of SNPs of SNAP25 with obesity. SNAP25 is a presynaptic plasma membrane protein, responsible for connecting synaptic vesicles with the neuron membrane, so that neurotransmitters can be secreted into the synaptic space. In a similar way, SNAP25 is connected with the regulation of insulin secretion by the pancreatic β cells (Takahashi et al., 2004). Studies published thus far have determined the relationship of polymorphisms of SNAP25 with the metabolic syndrome, including obesity and dysglycemia in patients with type 2 diabetes (Y. L. Chen et al., 2015) and in animal models (Valladolid-Acebes et al., 2015). Our studies are consistent with those results. We have demonstrated a relationship of SNPs of SNAP25 with a higher risk of overweight, which is connected perhaps with abnormalities in regulation of the sugar levels in blood.
Our study has also demonstrated a relationship of 5HTR2A rs17288723 with overweight in boys with ADHD. Many earlier studies have demonstrated a lowered food intake connected to increased serotonin signaling (Fox, French, Laporte, Blacker, & Murphy, 2010; Lam, Garfield, Marston, Shaw, & Heisler, 2010). The 5-HT2A receptor regulates the production of glucose in the liver, the insulin secretion and glucose intake by the tissues through regulating the adrenaline level (Kokubu et al., 2006). The increased activity of 5-HT2A leads to a higher blood sugar level and is often observed in patients with diabetes and obesity (Tsunekawa et al., 2003). The role of insulin level regulation, and thus the level of glucose in the blood, in conditioning the overweight in children with ADHD was confirmed in the latest studies. In recent years, the relationship of ADHD with a higher risk of type 2 diabetes, developing on the basis of insulin resistance, was demonstrated (H. J. Chen, Lee, Yeh, & Lin, 2013).
Limitation
The strength of this study is the inclusion of both genetic and neurocognitive factors as possible determinants of overweight in children with ADHD. In the study, we have also controlled other factors that could influence the obtained results, such as the type of ADHD, comorbid disorders, pharmacological treatment, socioeconomic status, parental education, and health status indicators in the neonatal period. The study, however, had some limitations. Among them were a small sample size and the lack of a control group. However, the study was powerful enough to detect large effects, and in the case of moderate effects, the power was relatively high (57%-75% depending on analyses type), whereas for small effects, it was definitely insufficient. The results (the level of p value) of the analyses were not corrected for multiple testing. It was justified by the exploratory character of the study. Nevertheless, all indicated relationships should be interpreted with caution, because of an increased probability of Type I error. Before definitive conclusions can be reached, independent replication based on adequately powered analyses on a larger sample should be done. Another limitation is that the evaluation of socioeconomic status was based on the subjective perception of the parents and not on objective indicators. Neuropsychological tests that we conducted could have engaged the cool executive functions to a higher degree, while the hot executive functions, connected to tasks arousing an emotional motivation, were not evaluated by adequate tests. In the study, we did not control for all other possible causes of overweight, such as the amount and caloric value of food intake, or limitation of physical activity. In the “Discussion” section, we refer to hormonal mechanisms that may underlie the overweight in the study group; we did not, however, have the data that could verify the hypotheses. Because the evaluation of the body size was not the main goal of the project, from which we have taken data we present in this article, the measurements of the body height and weight were performed as a part of the clinical evaluation of patients. Therefore, no procedures to evaluate the reliability of the measurements were planned. The measurement error remained outside control of our study.
Conclusion
We have demonstrated that overweight in boys with ADHD might be associated with SNPs of three candidate genes, that is, DRD4 rs1800955, SNAP25 rs363039, rs363043, and 5HTR2A rs17288723, however, not through conditioning of deficits in cool executive functions. Perhaps the tendency for overweight in people with ADHD might be connected to a lower level of hot executive functions and impaired control of absorption and metabolism of glucose. Those hypotheses require confirmation in next studies taking into account analyses of the levels of hormones and glucose in patients with ADHD.
Footnotes
Declaration of Conflicting Interests
The author(s) declared no potential conflicts of interest with respect to the research, authorship, and/or publication of this article.
Funding
The author(s) disclosed receipt of the following financial support for the research, authorship, and/or publication of this article: The data used in the research were acquired from the project funded under a Grant of the Polish Ministry of Science and Higher Education no.: 2P05E 131 29.