



Abstract
Introduction
AD/HD is one of the most common neurodevelopmental disorders in the Diagnostic and Statistical Manual of Mental Disorders (4th ed.; DSM-IV; American Psychiatric Association [APA], 1994) among children, and involves pervasive symptoms of inattention, hyperactivity, and impulsivity (APA, 2000). AD/HD is estimated to have a 5.29% worldwide prevalence (Polanczyk, de Lima, Horta, Biederman, & Rohde, 2007). The disorder often causes functional impairments such as academic, family, and social problems. It can also increase the risk of other psychiatric disorders (Biederman & Faraone, 2005). As it often begins in early childhood, AD/HD is commonly regarded as a childhood disorder. However, it has been shown that approximately two thirds of those diagnosed in childhood still meet AD/HD criteria in adulthood, leading to long-term negative effects for individuals (Karam et al., 2015).
The electroencephalogram (EEG) allows measurement of brain electrical activity and has been used in AD/HD research for decades (for a historical review, see Barry, Clarke, & Johnstone, 2003) revealing several abnormalities in those with AD/HD compared to healthy controls (Barry & Clarke, 2009). The most commonly used EEG analysis method is spectral power analysis in which the raw EEG is decomposed into different frequency bands. In childhood, compared to healthy controls, research typically reports that children with AD/HD have increased power in slow wave bands (e.g., absolute theta and delta, and relative theta) and reduced power in fast wave bands (e.g., relative alpha and beta) (Barry et al., 2003; Chabot &Serfontein, 1996). Together, this pattern leads to elevated theta/beta and theta/alpha ratios (Snyder & Hall, 2006; Snyder et al., 2008). As age increases toward adolescence, the EEG of children with AD/HD shows a typical developmental pattern but the differences remain—that is, increased slow wave and reduced faster wave activity (Barry & Clarke, 2009; Bresnahan, Anderson, & Barry, 1999; Clarke, Barry, McCarthy, & Selikowitz, 2001). In adulthood, the group differences in fast waves are typically absent, whereas the differences in slower wave activity remain (Barry & Clarke, 2009; Bresnahan & Barry, 2002).
Among the observations using EEG, increased theta/beta ratio (TBR) in children with AD/HD has been considered to be a robust and reliable group difference. Indeed, the U.S. Food and Drug Administration (2013) approved the utilization of theta/beta ratio to aid assessment of AD/HD. However, the use of this ratio in aiding diagnosis is debated. A systematic review revealed that the year of publication had a substantial influence on the reported group difference (Arns, Conners, & Kraemer, 2013). In contrast to earlier findings, recent studies did not find a difference in TBR between groups (Loo et al., 2013; Ogrim, Kropotov, & Hestad, 2012); a result mainly caused by that the TBR is increasing in healthy control groups (Arns et al., 2013). In addition, age may be a factor that moderates the effect. A study compared TBR between participants with AD/HD and healthy controls in children and adults, and reported that TBR differed in adults but not in children (Loo et al., 2013). However, further studies are needed as the adult controls were the parents of children with AD/HD in this study. Together, these recent findings suggest that the TBR may not be a reliable marker of AD/HD, and that an age effect exists—the difference may be more obvious in older groups. As a result, concerns about the diagnostic value of TBR are increasing (Arns et al., 2013; Lenartowicz & Loo, 2014; Saad, Kohn, Clarke, Lagopoulos, & Hermens, 2018) and more studies are needed to address the issue. Thus, in the current study, we firstly aimed to compare the TBR of AD/HD participants with healthy controls to determine whether TBR differs between groups. Participants were further classified into a child group and an adolescent group to determine whether the difference in TBR changes with age.
The relationship between EEG and behavior/symptoms is another important issue related to AD/HD (e.g., Barry, Clarke, Johnstone, McCarthy, & Selikowitz, 2009; Clarke, Barry, Dupuy, et al., 2011;Clarke, Barry, McCarthy, & Selikowitz, 2011). The most influential EEG model of AD/HD is the hypo-arousal model (Mann, Lubar, Zimmerman, Miller, & Muenchen, 1992; Satterfield & Cantwell, 1974). The model proposes that abnormalities in EEG indicate central nervous system (CNS) underarousal, which in turn causes behavioral deficiencies. The model can explain the deficit in alpha in AD/HD population (Barry, Clarke, Johnstone, & Rushby, 2008; Barry et al., 2004; van Dongen-Boomsma et al., 2010); however, empirical results have shown that differences in beta (Clarke et al., 2013) and TBR (Barry et al., 2009) in the AD/HD population cannot be explained in terms of arousal. Hence the model, attributing all CNS abnormalities to arousal issues, was too simplistic and the pattern of EEG differences between groups may indicate separate CNS issues (Clarke et al., 2013). Some studies have explored EEG in terms of AD/HD symptoms but the results are inconsistent. In a large sample, TBR was positively correlated with inattention symptoms in children, but negatively correlated in adults with AD/HD (Loo et al., 2013). This finding is in contrast to a study in which TBR in children was not correlated with inattention but theta was positively correlated with inattention (Ogrim et al., 2012). A correlation between theta and inattention was also reported by Clarke, Barry, McCarthy, and Selikowitz (2011); however, in their study TBR was significantly correlated to hyperactivity/impulsivity symptoms rather than inattention in boys with AD/HD. Overall, further studies are needed to clarify the behavioral meaning of EEG activity in AD/HD.
New functional insights are emerging from recent studies which examine the behavioral implications of the brain’s spontaneous resting activity. The brain’s resting state refers to the state where individuals are awake but not performing any task; this is significantly different to a sleep state (Larson-Prior et al., 2011). The nontask-specific “idling” EEG activity, which was previously regarded as relatively meaningless, is increasingly considered as being as informative as neural activity when engaged in a task (Cabral, Kringelbach, & Deco, 2014; Raichle & Snyder, 2007). The relationship between resting state and task could potentially be a biomarker of cognitive engagement/load or “work” (Cabral et al., 2014). This is supported by neuroimaging studies which reveal that the relationship between brain activation at rest and during tasks varies across tasks requiring lower- (Cox et al., 2010; Garrett, Kovacevic, McIntosh, & Grady, 2011;Koyama et al., 2011; Wang et al., 2010) and higher order cognitive process (Reineberg, Andrews-Hanna, Depue, Friedman, & Banich, 2015). In this context, it has been proposed that behavioral deficits in AD/HD may stem from an abnormal brain resting state (Castellanos &Proal, 2012; Sonuga-Barke & Castellanos, 2007).
To date, little research exists on the association between resting EEG and task performance in the AD/HD population. In the limited studies that do exist, most have explored the issue in terms of low-level cognitive tasks, for example, theta activity was related to performance in a Continuous Performance Task (Hermens et al., 2005; Shi et al., 2012) and an Oddball task (Hermens et al., 2005). With regard to executive functions (EFs), research is rarer and less consistent. EF refers to a set of top-down processes that regulate other, lower level cognitive processes (Diamond, 2013). In several models, some behavioral abnormalities in AD/HD are thought to result from executive dysfunctions (e.g., Barkley, 1997; Sergeant, 2005; Sonuga-Barke, 2005). TBR has been related to response inhibition (a component of EF), as measured by the Go/Nogo task in children with AD/HD (Loo et al., 2013; van Dongen-Boomsma et al., 2010); however, the relationship was not found when a questionnaire was used to measure inhibition (Ogrim et al., 2012). The relationship between EEG and other components of EF has not been studied. Hence, the second aim of this study was to examine the relationship between EEG bands and multiple components of EF.
Given the above literature review, it was predicted that: TBR in participants with AD/HD would differ from that of controls in adolescents whilst this may not be the case in children. Furthermore, based on the lack of directly relevant previous research, we will explore the correlations of EEG outcomes to AD/HD symptoms and task performance of EF in participants with AD/HD.
Method
Participants
The AD/HD participants were recruited between June 2014 and June 2015 at Peking University Sixth Hospital. They were assessed by experienced psychiatrists. All participants met the following inclusion criteria: (a) screened by the Clinical Diagnostic Interviewing Scales (Barkley, 1998), a structured clinical interview based on the DSM-IV; (b) no history of head trauma with loss of consciousness; (c) no history of neurological illness or other severe disease; (d) no history of psychiatric disorders described in the DSM-IV; (e) naïve to any pharmacological treatment; and (f) an IQ higher than 80 on the Wechsler Intelligence Scale III for children.
Fifty-three children (43 male, age range: 8-15 years, M = 11.24 years, SD = 2.15) with AD/HD were selected from 101 AD/HD cases in this study as they were aged from 8 to 15 years and had full neuropsychological testing reports. Thirty-two children with AD/HD were diagnosed with the predominantly inattentive type (ADHD-I) and 21 with the combined type (ADHD-C). Two age groups were formed: a child group ranging from 8 to 12 years and an adolescent group from 12 to 15 years. For children with AD/HD, 40 children were entered into the group analysis after balancing age and sex compared to controls. There were 24 participants in the child group (13 ADHD-I, 11 ADHD-C, 18 male, M = 10.20 years, SD = 0.70) and 16 (9 ADHD-I, 7 ADHD-C, 12 male, M = 13.45 years, SD = 0.60) in the adolescent group. In the correlational analysis, all children with AD/HD were considered.
Thirty-seven healthy controls (27 male, age range: 8-15 years, M = 12.09 years, SD = 1.68) participated in this study. There were 18 participants in the child group (14 male, M = 10.50 years, SD = 0.77) and 19 participants in the adolescent group (14 male, M = 13.60 years, SD = 0.38). Healthy controls were recruited from the hospital and local schools and were screened by the same psychiatrists with the same inclusion criteria applied but they did not meet the diagnostic criteria of AD/HD; they met less than four DSM-IV Inattention criteria and four DSM-IV Hyperactivity/Impulsivity criteria.
Procedure
Ethics approval was obtained from the Ethics Committee of Peking University Health Science Center and the University of Wollongong Human Research Ethics Committee. Informed consent was obtained from the parent or guardian of each participant prior to accessing any record or testing.
Participants were required to complete the testing protocol in 1 day. In the morning, participants were in a patient room accompanied by a psychiatrist. They completed psychometric assessments and the Cambridge Neuropsychological Test Automated Battery (CANTAB). These processes lasted about 2 hr. In the afternoon, resting EEG was recorded in a room which was free from distraction, with participants seated on a comfortable chair with dimmed lighting. This process lasted about 45 min.
CANTAB
CANTAB is a commercial computerized neuropsychological battery consisting of a wide range of cognitive tasks. Based on the research purpose of this study, five tasks related to EFs and deficiencies in AD/HD were used; see below. Each task contained several outcomes with the main measures reported here.
The Stockings of Cambridge (SOC) task measures spatial planning. Three colored balls are displayed in a spatial pattern and participants are required to move the other set of balls to repeat the pattern. Outcomes reported are (a) problems solved in minimum moves (PSMM), (b) mean initial thinking time (ITT): the mean time taken before moving the ball, and (c) mean subsequent thinking time (STT): the mean time taken after the initial move. The task lasts for about 10 min.
The Intra-Extra Dimensional Set Shift (IED) task measures cognitive flexibility. The task is similar to the Wisconsin Card Sorting test, and requires participants to learn a rule and then to shift from the well-learned rule to a new rule. Outcomes reported is stages completed (SC): the total number of successfully completed stages. The task lasts for about 7 min.
The Stop Signal task (SST) measures response inhibition. The task firstly builds up a tendency for participants to make an A or B response, and on a small percentage (e.g., 25%) of trials, participants are required to inhibit the activated response after hearing a tone (which is presented at various times poststimulus presentation; for example, 50 ms, 150 ms, and 300 ms). The primary outcome is stop signal reaction time (SSRT) which is an estimate of the time taken to inhibit the response. The task lasts for about 20 min.
The Spatial Working Memory (SWM) task measures the visuospatial ability of working memory. Tokens are spatially hidden in the task and participants need to find the token by trying different spatial locations. Outcomes include (a) between errors (BE): defined as revisiting the place in which a token has already been found, and (b) within errors (WE): defined as revisiting the place in which no token has already been found.
The Cambridge Gambling Task (CGT) measures decision making. Participants are presented with 10 boxes which are red and blue, and are required to guess whether a yellow token is hidden in a red box or a blue box. Outcomes are (a) delay aversion (DA): participants score higher if they are unable or unwilling to wait, and (b) betting proportion (BP): the overall proportion of bets across trials.
The SOC, IED, SST, and SWM tasks were used to measure differing components of EF. CGT was included as it measures decision making as a higher order function based on EF (Diamond, 2013). Full illustrations and demonstrations for each task are available in a review article (Chamberlain et al., 2011).
EEG Recording and Pre-Processing
Ten minutes of EEG was recorded in an eyes-closed resting condition. The recording was paused if the participant showed signs of fatigue or restlessness. The EEG was acquired using a 128-channel system (HydroCel Geodesic Sensor Net, Electrical Geodesics, Inc., Eugene, OR). The impedance of all electrodes was less than 50 kΩ. All electrodes were physically referenced to Cz (fixed by the EGI system). The EEG was amplified with a band pass of 0.01 to 200 Hz, which was digitized online at a sampling rate of 1,000 Hz. The EGI data were converted to allow analysis using EEGLAB and Neuroscan software Version 4.3.
Nineteen channels were selected based on the international 10-20 system. All channels were offline re-referenced to linked ears, and resampled at 256 Hz, filtered by a band-pass filter from 1 Hz to 70 Hz and a 50-Hz notch filter. Visual inspection was used to identify and exclude sections of EEG trace containing gross artifacts. The Independent Component Analysis function in EEGLAB (Delorme & Makeig, 2004) identified components related to eye and muscle movements and there were excluded; this is a semiautomatic process aided by a tool box in EEGLAB, ADJUST (Mognon, Jovicich, Bruzzone, & Buiatti, 2011). Then, in line with earlier resting EEG studies, the first 3 min were extracted from the artifact-free EEG data and were segmented into 4-s epochs. These epochs were Fourier transformed using a Hamming window. EEG band power was calculated for four frequency bands: delta (1.5-3.5 Hz), theta (3.5-7.5 Hz), alpha (7.5-12.5 Hz), and beta (12.5-25 Hz). The total power and relative power of four bands were used in the statistical analysis as these two indices are reliable to characterize EEG features in participants with AD/HD (Clarke, Barry, Dupuy, et al., 2011). Relative power was calculated by dividing absolute power in each frequency band by the total of bands.
Statistical Analysis
ANOVAs with between-subjects factors of Age (child, adolescent) and Group (AD/HD, control) and within-subjects topographic factors of Lateral (left, midline, right) and Sagittal (frontal, central, posterior) were conducted for the theta/beta ratio, and separately for each frequency band in relative power. Topographic effects were examined using an established method (Clarke et al., 2001). All electrodes were divided into nine regions: left frontal (F3, F7), midline frontal (Fz), right frontal (F4, F8), left central (T3, C3), midline central (Cz), right central (T4, C4), left posterior (T5, P3, O1), midline posterior (Pz), and right posterior (T6, P4, O2). The EEG data for each region were calculated by averaging all electrode(s) within the area. Planned contrasts were examined within the Sagittal and Lateral factors. Within the Sagittal factor, planned contrasts compared the frontal (F) and posterior regions (P), and the central region (C) with the mean of the frontal and posterior regions (F/P). Within the Lateral factor, the contrasts compared the left hemisphere (L) with the right (R), and the midline region (M) with the mean of the hemispheres (L/R). The contrasts are planned, and there are no more of them than the degrees of freedom for the effect, so no Bonferroni-type adjustment to α is required (Tabachnick & Fidell, 2007).
To examine the influence of age and IQ on behavioral performance, partial correlations separately examined the relationships between EEG band power/percentage and scores from the AD/HD Rating Scale (ADHD-RS) and task performance measures from the CANTAB with age and IQ co-varied. Only the Sagittal factor was entered into analyses to reduce the number of correlations and the risk of Type 1 error from testing multiple correlations. The significance level for the correlations was adjusted to a more conservative .01; meanwhile, the significance close to .01 is also reported as this is a preliminary study (p≤ .015).
Results
Demographic information for the groups is shown in Table 1. The children with AD/HD and controls did not differ significantly in age. A main effect of Group was significant for IQ, and indicated that participants with AD/HD (M = 103.98, SD = 11.36) had a lower IQ than controls (M = 123.92, SD = 8.98), F = 70.44, p< .001,
Demographic Information for the AD/HD and Control Groups.
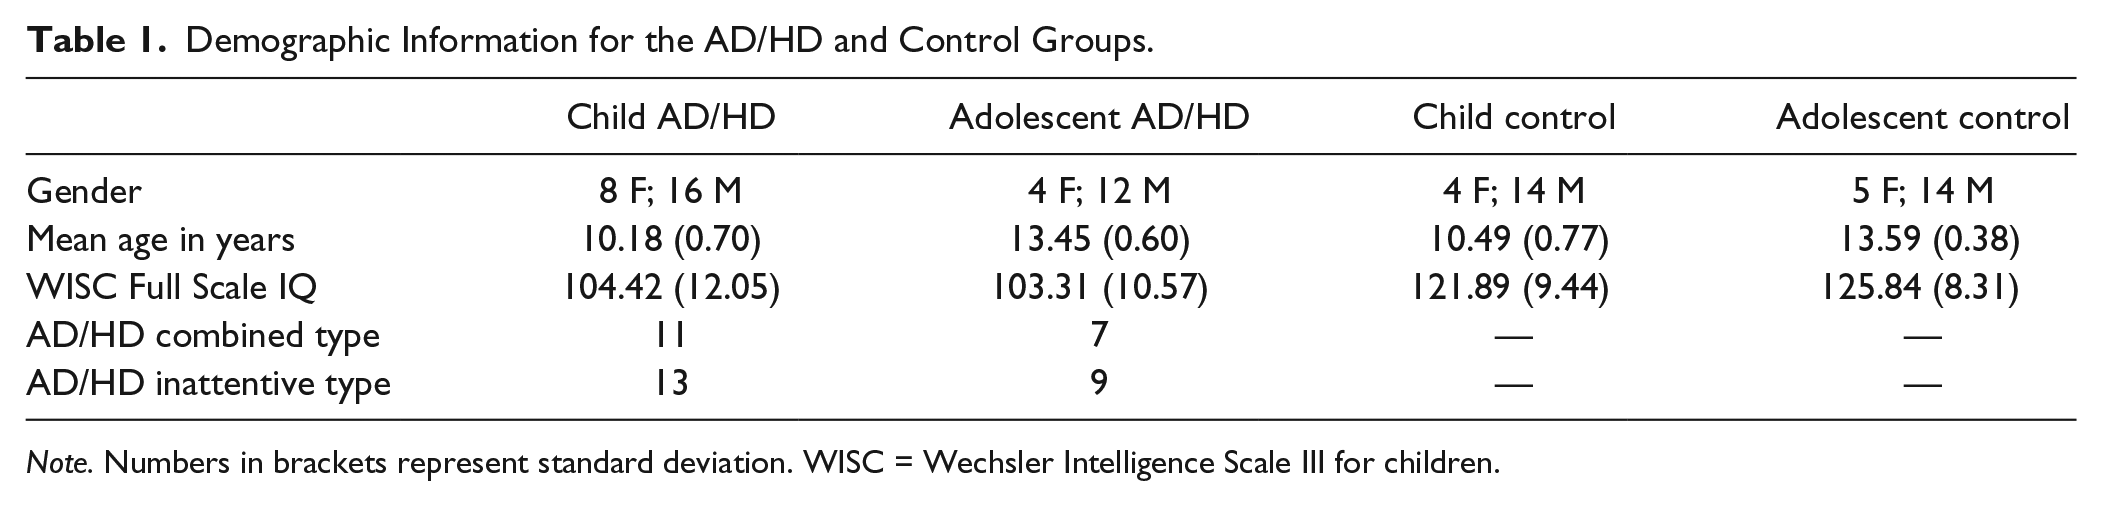
Note. Numbers in brackets represent standard deviation. WISC = Wechsler Intelligence Scale III for children.
Delta
Figures 1 and 2 display brain maps for the two groups for relative power of each EEG band, TBR and total power. A Sagittal main effect and planned contrasts (linear: F = 129.51, p< .001,
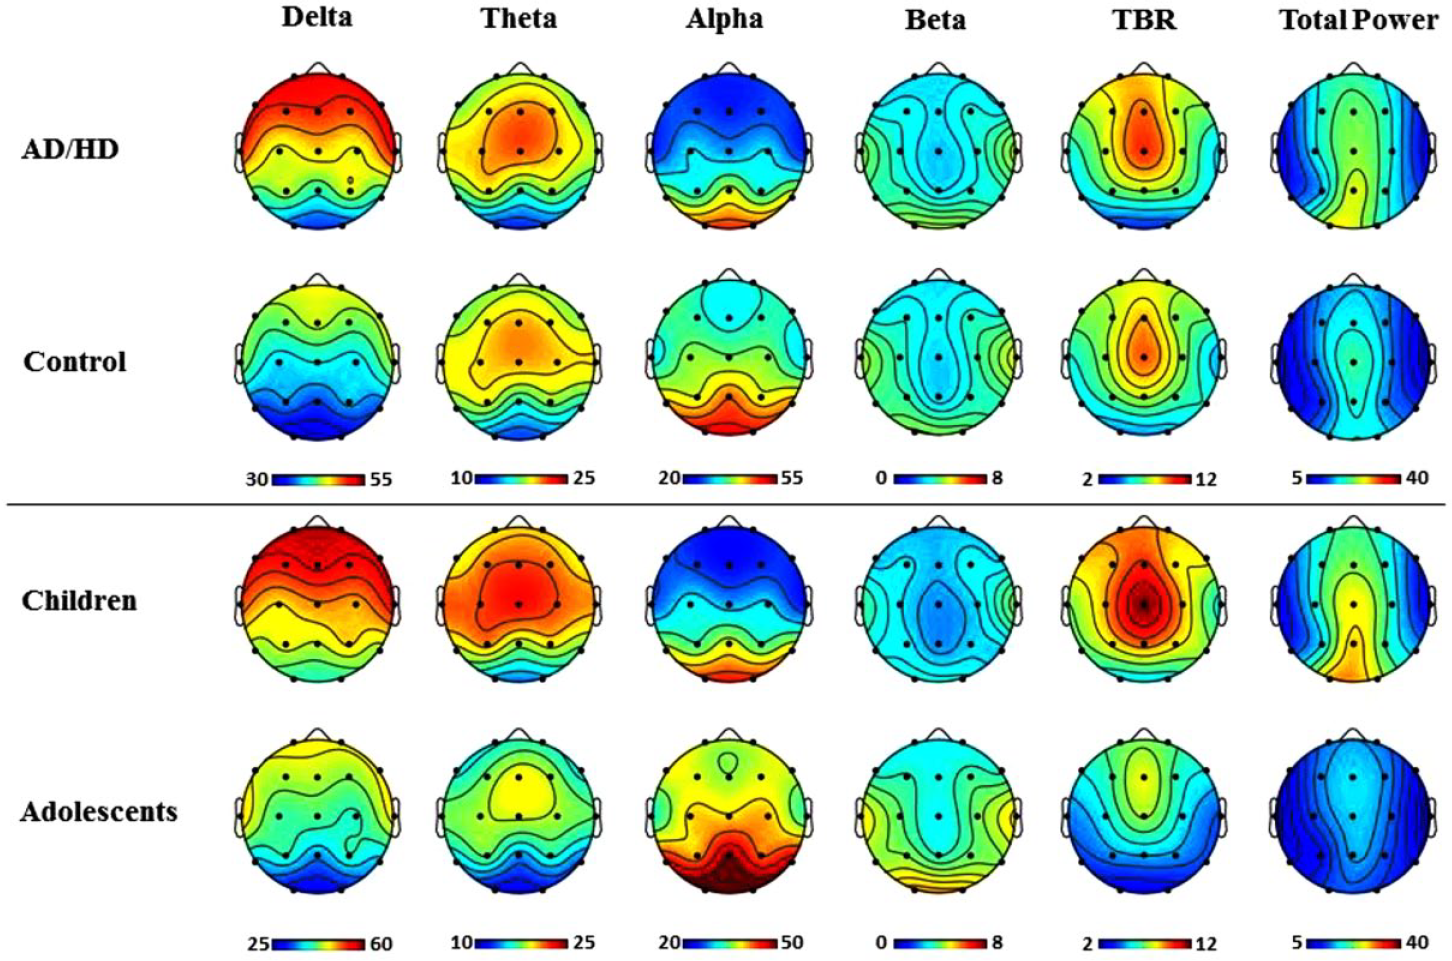
Topographic maps for relative power (%), TBR, and total power (µV) for each level of Group (top panel), and each level of Age (bottom panel).

Topographic maps for relative power (%), TBR, and total power (µV), for each level of Age and Group separately.
Theta
Laterally, theta was maximal in the midline region (quadratic: F = 47.061, p< .001,
Alpha
The Sagittal effect and contrasts (linear: F = 147.955, p< .001,
Beta
Laterally, beta was maximal in the hemispheres compared to the midline (quadratic, F = 164.212. p< .001,
TBR
TBR had a left-midline distribution along the Lateral dimension (linear: F = 5.519, p = .022,
Total Power
A Sagittal main effect and planned contrasts (linear: F = 12.376, p = .001,
Behavioral Correlates
Partial correlations were conducted among participants with AD/HD to analyze the relationship between EEG and the behavioral measures with age and IQ as covariates. The correlations are shown in Table 2.
Correlations Between EEG and Behavioral Measures.
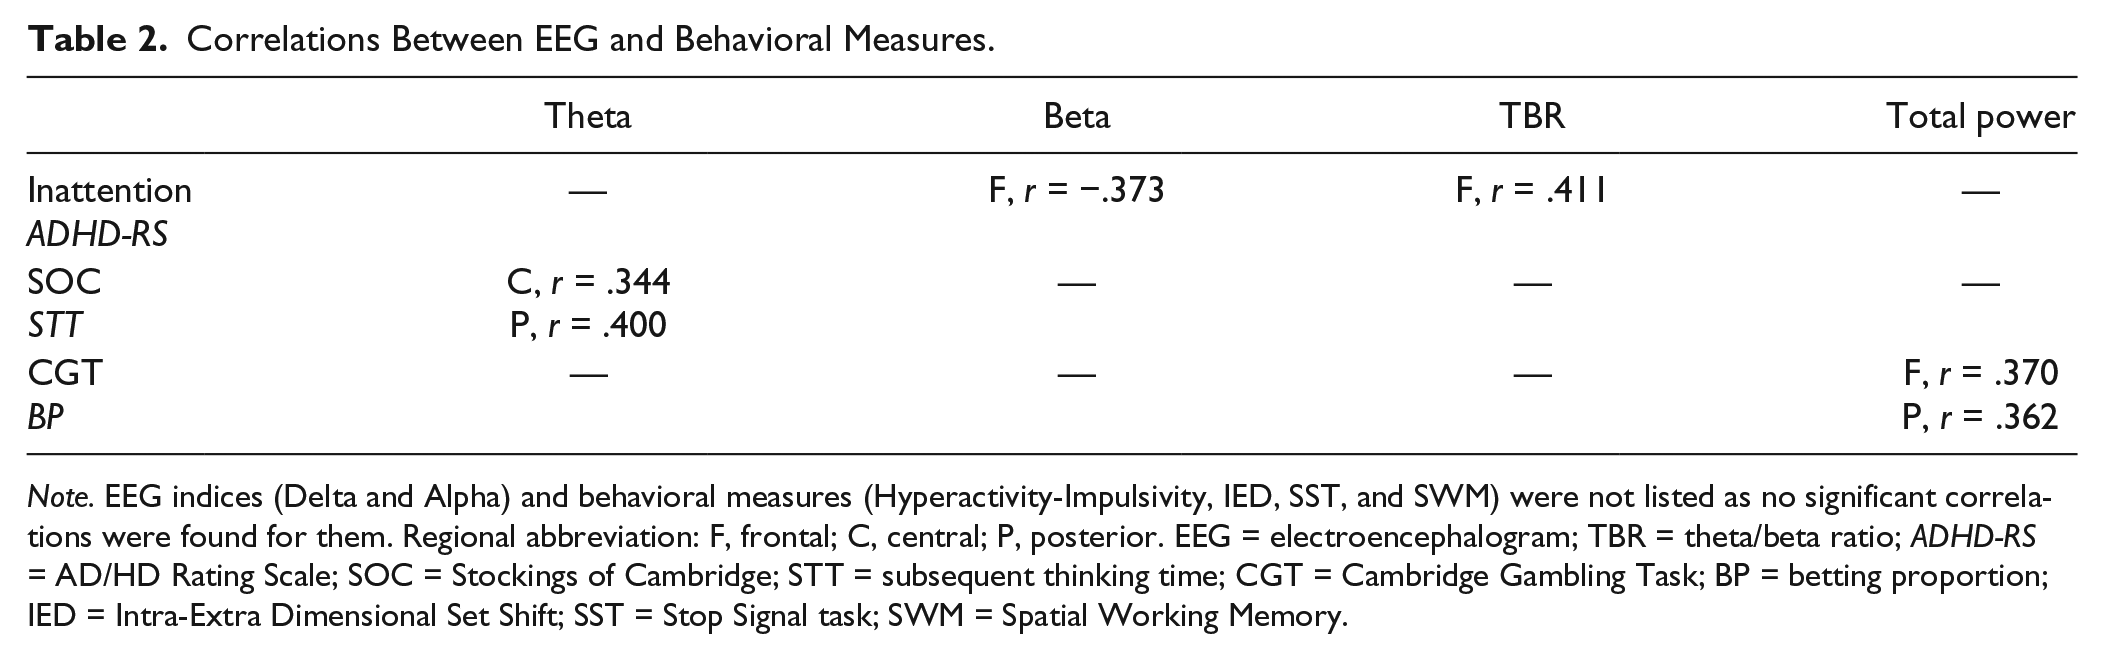
Note. EEG indices (Delta and Alpha) and behavioral measures (Hyperactivity-Impulsivity, IED, SST, and SWM) were not listed as no significant correlations were found for them. Regional abbreviation: F, frontal; C, central; P, posterior. EEG = electroencephalogram; TBR = theta/beta ratio; ADHD-RS = AD/HD Rating Scale; SOC = Stockings of Cambridge; STT = subsequent thinking time; CGT = Cambridge Gambling Task; BP = betting proportion; IED = Intra-Extra Dimensional Set Shift; SST = Stop Signal task; SWM = Spatial Working Memory.
With regard to symptoms, the inattention score measured by the ADHD-RS was significantly correlated with frontal beta power (r = −.373, p = .007), and frontal TBR ratio (r = .411, p = .003). No EEG outcome was related to hyperactivity and impulsivity measured by the ADHD-RS.
For EF, central (r = .344, p = .014) and posterior (r = .400, p = .004) theta power was positively correlated with STT in spatial planning (SOC); thus, increased frontal/posterior theta and posterior TBR are related to a slower response. For decision making (CGT), frontal (r = .370, p = .006) and posterior (r = .362, p = .008) total power were positively related to the amount of betting behavior, indicating an increased total power accompanied greater risk taking behavior. No relationship was found with the shifting, response inhibition, and working memory tasks.
Discussion
The diagnostic value of TBR has recently been questioned in the literature. Research shows that the difference in TBR between participants with AD/HD and healthy controls has decreased in recent years, and that age may affect the group difference. To investigate this further, the current study compared EEG spectral power, including TBR, between participants with AD/HD and healthy controls in child and adolescent groups. Moreover, we explored the relationship between resting EEG and a range of neuropsychological functions to further understand the behavioral relevance of brain resting activities.
Relative and Total Power
Previous studies report that, as age increases, higher frequency brain activity decreases and lower frequency activity increases, with decreased total power (Barry & Clarke, 2009). Consistent with previous results, the current study found reduced delta, theta, and total power, and increased alpha and beta in adolescents compared to children. With regard to the comparison between groups, participants with AD/HD showed more delta and less alpha, which is in line with past studies indicating that AD/HD is accompanied by increased slow wave activity and reduced faster activity (Barry & Clarke, 2009; Barry et al., 2003). The interaction between Group and Age for theta, which decreased slower in the AD/HD group than control group with increasing age, may indicate a developmental deviation. The result is in line with developmental EEG studies in which theta activity was still abnormal in adults with AD/HD whereas abnormalities in other bands approached normal levels (Barry & Clarke, 2009).
Frontal beta and frontal TBR were associated with the inattention score measure of the ADHD-RS. These results are consistent with recent reports on adults with AD/HD. Roh et al. (2015) and Roh, Park, Shim, andLee (2016)reported that inattention issues were linked to theta, beta, and also gamma activity. The multiple relationships between elements of the EEG and AD/HD symptoms fits well with comprehensive AD/HD models, such as Cognitive-Energetic Model (Sergeant, 2005) and multiple pathways model (Sonuga-Barke, 2005). These models commonly emphasize that different resources contribute to symptoms.
The relationship of EEG to EF task performance was also examined in the AD/HD group, with correlations found with spatial planning and decision making. These results are in line with recent developments in cognitive neuroscience that examine behavioral relationships with brain resting activity. The interest stems from the perspective that brain resting activity has consistent networks across individuals and the networks are varied when relevant tasks are presented (Cabral et al., 2014; Raichle & Snyder, 2007). The point was subsequently supported by imaging studies in which the resting networks were correlated with some attention and EF tasks (Cabral et al., 2014; Reineberg et al., 2015). Studies further classified the brain resting networks as “task-negative” or “task-positive.” The former refers to networks that are activated in resting state and will be decreased when tasks emerge, and the latter refer to other networks that are activated during rest but will be increased when tasks emerge (Cabral et al., 2014). In the present study, the resting state was measured by EEG, and correlations were found in AD/HD participants. To summarize (a) central and posterior relative theta was positively related to planning time; (b) frontal and posterior total absolute power were positively related to betting in decision making.
TBR
In the current study, TBR decreased with increasing age across groups, which is consistent with the developmental pattern revealed by other studies (Barry & Clarke, 2009). TBR did not differ between ADHD and control groups in either children or adolescents. This result contradicts early studies in which a significantly increased TBR was consistently observed in participants with AD/HD compared to healthy controls. In 2006, a meta-analysis reported that the effect size of the TBR group difference was 3.08 (Snyder & Hall, 2006). However, our results support a trend exposed by Arns et al. (2013) in which the effect size of the group difference was negatively related to the year of publication. This reduction was more obvious for the studies published after 2008. Consequently, two recent studies did not report a significant TBR difference between groups (Loo et al., 2013; Ogrim et al., 2012). In the current study, the lack of a group difference was replicated within two age-ranges (children: 8-12 years, adolescents: 12-15 years) in a Chinese population. Close inspection shows that the value of TBR is elevated in our controls whereas it remains similar in AD/HD group compared to previous studies, which supports the view that it is a change in controls over the years that has reduced the difference between groups (Arns et al., 2013). Arns et al. (2013) speculated that changes in living habits, such as decreasing sleep duration, may be responsible for this effect. As no data were recorded for sleep, this assumption cannot be examined in the current study.
TBR was positively correlated to inattention symptoms. This result matches the studies that support the relationship between TBR and AD/HD symptoms in children (e.g., Loo et al., 2013). The result is also in parallel with findings in the normal population. Putman, van Peer, Maimari, and van der Werff (2010) reported that higher frontal TBR was related to poorer attentional control and response inhibition performance. Although we did not find a relationship between TBR and response inhibition, this may be because of the difference in the task paradigms. A stop-signal task was used to measure response inhibition in the current study, while an emotional Go/Nogo task was used in the Putman study. However, the correlation between TBR and inattention is contrary to Ogrim et al. (2012) in which the relationship was not found, which may be attributed to methodological differences. The EEG was recorded under eyes-open condition and different frequency bands were used in our study compared to Ogrim et al. (2012).
Implications and Future Studies
Along with recent findings, our results do not support the diagnostic value of TBR among children with AD/HD (Arns et al., 2013; Lenartowicz & Loo, 2014). Given the age range of the present study (8-15 years), future studies may extend the findings to the later stage of adolescent. AD/HD symptoms are usually varied in children as compared to adults, with implications for EEG.The increasing ratio in controls over time is suggested to reduce the group difference (Arns et al., 2013). Further studies may examine whether changes of lifestyle and habits in healthy control children is leading to the increasing TBR, as suggested by Arns et al. (2013). It should be noted that no healthy controls in this study had substantial inattention symptoms (they met less than four DSM-IV inattention criteria), which also raises a question whether TBR has the same behavioral meaning in AD/HD and healthy populations, given the result that TBR was positively related to inattention symptom in AD/HD. In addition, the heterogeneous nature of TBR in the AD/HD population may contribute to the lack of difference in TBR (Arns et al., 2013). According to a cluster analysis, 35% of the AD/HD population was characterized as having a higher TBR and the others showed different EEG deficit patterns (Clarke, Barry, Dupuy, et al., 2011).
The heterogeneous feature was not only found in EEG studies but also in neuropsychological research (Nigg, Willcutt, Doyle, & Sonuga-Barke, 2005). The neuropsychological deficits in AD/HD were initially explained as a core inhibitory deficit (Barkley, 1997). However, researchers subsequently found that not all participants with AD/HD showed inhibitory deficits (Willcutt, Doyle, Nigg, Faraone, & Pennington, 2005) and a neuropsychological AD/HD subtype was suggested (Nigg et al., 2005). Given the neuropsychological correlations found in the current study, the heterogeneous EEG may be associated with the heterogeneous neuropsychological functions. In other words, individual differences in EEG may indicate differences in neuropsychological functions. It should be noted that spatial planning is regarded as a component of EF in CANTAB; however, planning ability, as decision making in the 3-component EF model, is considered a higher level cognitive function based on the three EF components (inhibition, shifting and working memory; Diamond, 2013; Miyake et al., 2000). In this study, EEG outcomes (theta power and total power) are associated with spatial planning and betting in decision making but none of the EEG outcomes are related to response inhibition, shifting and working memory. Following the EF model, the resting EEG measures are indicative of two higher cognitive functions (planning and decision making) rather than EF in AD/HD.
Practically, the behavioral correlations with EEG support the prognostic value of EEG in AD/HD. As EEG is doubtful in diagnosing AD/HD, a prognostic purpose is suggested for using EEG in AD/HD (Arns et al., 2013; Lenartowicz & Loo, 2014). The suggestion stems from the findings that EEG can predict the efficacy of stimulant treatment in patients with AD/HD (Arns, 2012; Clarke, Barry, McCarthy, & Selikowitz, 2002). Based on current results, EEG components may be prognostically used as biomarkers of neuropsychological functions. Theoretically, the correlations also support a neurobiological hypothesis in AD/HD (Castellanos &Proal, 2012; Sonuga-Barke & Castellanos, 2007). The hypothesis suggests the behavioral deficits in AD/HD are neurobiologically rooted in impaired spontaneous activities. Recently, Hsu, Benikos, and Sonuga-Barke (2015) and Hsu, Broyd, Helps, Benikos, and Sonuga-Barke (2013) reported that the resting state was linked to waiting-related behaviors in an AD/HD sample. Here, we have extended this to look at the relationship between resting state and EF and higher order cognitive functions. However, the current study used a different definition of resting state from that of Hsu and colleagues. Here, the resting state was defined in terms of traditional EEG spectrum bands. These bands have been shown to be activated in a similar pattern across individuals (Chen, Feng, Zhao, Yin, & Wang, 2008) and to relate to resting networks measured by functional magnetic resonance imaging (Mantini, Perrucci, Del Gratta, Romani, & Corbetta, 2007).In comparison, Hsu et al. (2015) and Hsu et al. (2013) directly adopted a similar methodology to imaging studies and operationalized the resting state by measuring the EEG oscillation in a narrow band of ‘very low frequency’ (below 0.2 Hz). Further studies may explore differences between these two ‘resting state’ measures in an AD/HD sample.
Limitations
A limitation of this study is that IQ in controls is higher than the AD/HD group and the typical population. Here, we followed a standard methodology that shows little influence of IQ in EEG group analyses (Barry et al., 2009; Clarke et al., 2006), and it would have been preferable to avoid such a difference. Also, given the preliminary nature of the behavioral correlational analysis in AD/HD, the neuropsychological functions were not recorded in the control groups and more information may have been obtained by comparing the behavioral correlations in the different groups. In addition, although CANTAB is a valid tool to measure a wide range of neuropsychological functions (Chamberlain et al., 2011), with regard to the complicated features of EF and higher order cognitive functions, measuring the functions by only one task in CANTAB leaves open the issue of task impurity (Diamond, 2013; Miyake et al., 2000). For example, the individual difference in response time on spatial planning may be caused by the variance on the lower order reaction process rather than on the planning per se. Factor analysis is accepted as a better way to extract the purer components (Miyake et al., 2000). Future studies may further explore the behavioral relationships of EEG by using factor analysis with a number of different tasks.
Conclusion
With recent debates on the diagnostic value of TBR in AD/HD, the aim of the current study was to compare TBR between AD/HD and control groups of children and adolescents. In line with recent studies, we did not find a group difference on TBR across the age range, which does not support the diagnostic value of TBR in AD/HD. However, inspired by recent findings in cognitive neuroscience, the current study explored the relationship between EEG spectral power and a range of neurophysiological tasks in participants with AD/HD. With the significant correlations, the results support the prognostic value of resting EEG which may be biomarkers of neuropsychological functions.
Footnotes
Declaration of Conflicting Interests
The author(s) declared no potential conflicts of interest with respect to the research, authorship, and/or publication of this article.
Funding
The author(s) disclosed receipt of the following financial support for the research, authorship, and/or publication of this article: This work was supported by the National Natural Sciences Foundation of China (81371496), the National Basic Research Program of China (973 program 2014CB846104), the National Key Technology R&D Program (2015BAI13B01). The Chinese Scholarship Council provided a scholarship for DW. Z.