



Abstract
The construct of Sluggish Cognitive Tempo (SCT) includes symptoms of slowness, mental confusion or “fogginess,” excessive daydreaming, apathy, and drowsiness (Becker et al., 2016). Although SCT was historically studied in association with ADHD, the two constructs are empirically distinct (e.g., Jacobson et al., 2012). Some studies support SCT as a single factor (e.g., Barkley, 2012; Becker, Luebbe, & Joyce, 2015; Willcutt et al., 2014), whereas other studies suggest that SCT consists of multiple distinct factors (e.g., Barkley, 2013; Fenollar Cortés, Servera, Becker, & Burns, 2017; Jacobson et al., 2012; McBurnett et al., 2014; Penny, Waschbusch, Klein, Corkum, & Eskes, 2009; Smith et al., 2018). Factor analyses with one of the more widely used SCT measures, the 14-item Penny et al. (2009) scale, have identified three separate dimensions: Slow (e.g., “is slow or delayed in completing tasks”), Sleepy (e.g., “seems drowsy”), and Daydreamer (e.g., “gets lost in his or her own thoughts”) for both parent- and self-report versions. These dimensions have been established in both typically developing and ADHD samples (Becker et al., 2015; Penny et al., 2009; Smith et al., 2018).
Much of the SCT research completed to date has focused on youth with ADHD because of the high comorbidity of SCT symptoms in this population (Becker et al., 2016). One clinically relevant question has been whether comorbid SCT symptoms truly matter in predicting the functional outcomes of youth with ADHD, above and beyond ADHD symptoms and other common comorbid conditions. The preponderance of evidence collected to date suggests that comorbid SCT symptoms predict both academic and social outcomes in youth with ADHD. For example, SCT predicts peer rejection, poorer homework performance, lower grades, and anxiety and depression even when accounting for ADHD symptoms (Bernad, Servera, Grases, Collado, & Burns, 2014; Fenollar Cortés et al., 2017; Langberg, Becker, & Dvorsky, 2014; Smith & Langberg, 2017). However, less is known about why this may be the case, or about the potential mechanisms underlying the association between SCT symptoms and impairment. One likely factor that has not been evaluated is the role of motivation. Indeed, multiple items on most SCT measures ask respondents to rate children’s “apathy” and “lack of interest,” which are often considered aspects of motivation. The construct of motivation is of particular interest in ADHD samples as theory suggests that deficits in motivation may be an underlying factor of the disorder (Barkley, 1997). Barkley’s (1997) executive functioning theory included self-regulation of motivation as one of the four core factors thought to be impaired in individuals with ADHD. To date, however, there has been no research exploring the interplay between SCT, motivation, and impairment in youth with ADHD.
One theory of motivation, the expectancy-value theory, suggests that motivation is comprised of individuals’ beliefs about their competence and efficacy (Eccles & Wigfield, 2002). Specifically, in this theory, individuals’ expectancies for success or failure with a task, belief in sense of control over the potential outcomes, and understanding and perception of why the task is necessary or important determines motivation (Wigfield, 1994; Wigfield & Eccles, 1992). For example, an individual’s perception of their ability to complete homework may be low, but they may understand the value of homework as a task; a profile with low ability/expectancy motivation and high values motivation. Furthermore, expectancies and beliefs, and therefore overall motivation within this framework, have repeatedly been shown to be task specific (e.g., sports vs. reading vs. math; Eccles & Wigfield, 2002; Modesto-Lowe, Chaplin, Soovajian, & Meyer, 2013; Wigfield & Eccles, 2000). Accordingly, in contrast to SCT measures that ask respondents about general feelings of apathy and interest, items on expectancy/belief measures ask about motivation for a specific task. Furthermore, individuals’ expectancies, values, and beliefs directly influence performance, persistence, and choice of task (Eccles & Wigfield, 2002). Although Wigfield and Eccles (2000) theorize that there were three factors within the expectancy-value theory of motivation (ability beliefs, expectancy beliefs, and task value and interest), only two factors have consistently emerged in studies with ADHD and typically developing samples through confirmatory factor analysis (CFA), with ability and expectancy beliefs merged into one factor (Langberg et al., 2017; Wigfield & Eccles, 2000).
One of the most common impairments experienced by youth with ADHD is problems with homework. Youth with ADHD are significantly more likely than their peers to have difficulties turning in and completing homework, recording assignments, and focusing to complete work efficiently (Boyer, Geurts, & Van der Oord, 2014; Coghill et al., 2008; Langberg et al., 2010; Power, Werba, Watkins, Angelucci, & Eiraldi, 2006). Studies in typically developing samples demonstrate that motivation to complete homework is associated with homework problems and other academic outcomes (Trautwein & Lüdtke, 2009; Trautwein, Lüdtke, Schnyder, & Niggli, 2006). Furthermore, a recent study in an ADHD sample found that young adolescents’ beliefs about their homework abilities significantly predict homework problems, completion, and performance (Langberg et al., 2017). As both motivation and SCT have been linked to academic impairment, it is important to parse out the pathways to impairment while controlling for other known factors, such as ADHD symptom severity, comorbid conditions, and intelligence. It is possible that symptoms of SCT are partially responsible for the lack of motivation to complete homework-related tasks that is common in youth with ADHD.
Present Study
Accordingly, the aims of this study were to evaluate which SCT factors are most strongly associated with homework motivation, and whether homework motivation mediates the path between SCT and academic impairment. For the first aim, associations between the Slow, Sleepy, and Daydreamer factors of SCT and homework motivation were evaluated, controlling for ADHD symptoms, comorbid psychopathology, age, and intelligence. It is important to control for comorbid symptoms of anxiety and depression as both can be associated with apathy and/or hesitation to complete tasks (Chelonis et al., 2012; Garber, 2006; Van Os, Jones, Lewis, Wadsworth, & Murray, 1997). Prior work has found that the SCT Slow factor is most strongly associated with academic impairment (Langberg et al., 2014; Smith & Langberg, 2017). As such, we predicted that the SCT Slow factor would be significantly associated with homework motivation, above and beyond the Sleepy and Daydreamer factors. This study will also explore whether the self-reported homework motivation factors mediate the relationship between SCT factors found to predict motivation in Aim 1 and teacher-reported homework performance. A strong cross-rater model was evaluated with self-report of homework motivation serving as the mediator between parent-report of SCT and teacher-report of homework problems.
Method
Participants were 285 middle school students (boys 209 and girls 76) in Grades 6 to 8 (ages 10-15 years; M = 11.97, SD = 1.03) who were comprehensively diagnosed with ADHD. Participants were recruited from six public middle schools in the Eastern United States. The sample was diverse with parents identifying 29.1% of the youth as African American (n = 83), 9.8% as Biracial (n = 28), 58.2% as White (n = 166), 2.6 % as another race (n = 7), and one participant choosing not to respond. In addition to race, 9.8% identified their youth’s ethnicity as Latinx or Hispanic (n = 28). Per procedures described next, 177 participants (62.1%) were diagnosed with ADHD, Predominantly Inattentive Presentation and 108 (37.9%) were diagnosed with ADHD, Combined Presentation. The average intelligence score for the sample was 98.96 (SD = 12.58) and the median family income was US$62,500. About 55% of the sample was taking ADHD medication.
Procedure
Participants who provided data for the current study were recruited as part of a larger study evaluating school-based intervention programs for middle school students with ADHD. Study procedures were approved by the university Institutional Review Board, and the caregivers of all participants provided signed consent and the adolescents provided assent. All data evaluated in the present study were collected at baseline, prior to participants receiving any intervention. Recruitment methods included study announcement letters mailed to all parents at participating middle schools, flyers posted in each school, and direct referral by school staff. Interested parents were scheduled for an inclusion/exclusion evaluation where adolescents and caregivers were independently administered the Children’s Interview for Psychiatric Syndromes (ChIPS; Weller, Weller, Fristad, Rooney, & Schecter, 2000) by doctoral-level psychology graduate students supervised by a licensed clinical psychologist. Parents and at least one teacher for each student also completed the Vanderbilt ADHD Diagnostic Rating Scale (VADRS; Wolraich et al., 2003) to assess symptoms of ADHD, oppositional defiant disorder (ODD), and conduct disorder (CD). Finally, adolescents were administered a brief battery assessing their cognitive and academic achievement abilities, including two subtests (i.e., Block Design and Vocabulary) from the Wechsler Intelligence Scale for Children–Fourth Edition (Wechsler, 2003), and four subtests (i.e., Word Reading, Pseudoword Decoding, Math Problem-Solving, and Numerical Operations) from the Wechsler Individual Achievement Test–Third Edition (Wechsler, 2009).
Participants were considered eligible for the study if they met five criteria: (a) attended a participating middle school, (b) met full Diagnostic and Statistical Manual of Mental Disorders (5th ed.; DSM-5; American Psychiatric Association [APA], 2013) diagnostic criteria for ADHD based on the combination of parent-report on the P-ChIPS and teacher-report, (c) experienced significant impairment due to ADHD symptoms based on parent and/or teacher-report, (d) had an estimated Full Scale IQ (FSIQ) of at least 80, and (e) did not meet diagnostic criteria for any bipolar disorder, psychosis, or obsessive-compulsive disorder (OCD). To maximize generalizability, students with comorbid diagnoses of ODD, CD, and anxiety and mood disorders were allowed to participate in the study. Parent report on the ChIPS was used for externalizing comorbidities, with 30.6% meeting criteria for ODD, 3.2% for CD, whereas adolescent report on the ChIPS was used for internalizing comorbidities, with 25.4% meeting for anxiety and 5.3% for depression.
Measures
ChIPS
The ChIPS (Weller et al., 2000) is a structured diagnostic interview for administration to parents and children (children ages 6-18 years) and has a parent (P-ChIPS) and child version (ChIPS). The ChIPS has shown high internal consistency and test–retest reliability (Fristad, Teare, Weller, Weller, & Salmon, 1998), and high convergent validity in relation to the Diagnostic Interview for Children and Adolescents—Revised–Child Version (DICA-R-C; Fristad et al., 1998). A recent review of child and adolescent diagnostic interviews (Leffler, Riebel, & Hughes, 2015) found five separate studies documenting that the ChIPS has good concurrent validity with other validated diagnostic interviews, including the DICA-R-C and the Schedule for Affective Disorders and Schizophrenia for School-Aged Children (Kaufman et al., 1997). Furthermore, the ChIPS has good construct validity, with the percent of agreement between a consensus panel of child psychopathology experts and the results from ChIPS interviews ranging from 97.5% to 100%. Sensitivity averaged 87% across diagnostic categories and specificity averaged 76%, with sensitivity and specificity for attention deficit disorder being 100% and 44%, respectively (Fristad et al., 1998).
VADRS
The VADRS is a Diagnostic and Statistical Manual of Mental Disorders (4th ed.; DSM-IV; APA, 1994)-based scale that includes all 18 DSM-IV symptoms of ADHD. Respondents rate how frequently each symptom occurs on a 4-point Likert-type scale (0 = never, 1 = occasionally, 2 = often, 3 = very often). The VADRS produces an Inattention score (sum of the nine inattention items) and a Hyperactivity/Impulsivity score (sum of the nine hyperactive/impulsive items). The VADRS has excellent psychometric properties. For example, the VADRS exhibits high concurrent validity with well-established ADHD interviews (Wolraich et al., 2003). In the present study, parent ratings on the Vanderbilt ADHD and ODD subscales are included in the models and internal consistencies were as follows: ADHD inattention (α =.87), ADHD hyperactivity-impulsivity (α =.89), ODD (α = .87), and anxiety/depression (α = .86).
SCT Scale
The parent and self-report version of the Penny et al. (2009) SCT Scale were used in this study. The SCT Scale consists of 14 items that are each rated on a 4-point scale from 0 = never to 3 = very often. As described above, CFAs have identified three factors for the parent- and self-report versions: Slow (e.g., “is slow or delayed in completing tasks,” “not interested in participating in activities”), Sleepy (e.g., “seems drowsy”), and Daydreamer (e.g., “gets lost in his or her own thoughts”; Smith et al., 2018). CFAs were conducted on an ADHD adolescent sample. The parent-report three-factor model had adequate fit—root mean square error approximation (RMSEA) = .118, comparative fit index (CFI) = .928, Tucker–Lewis index (TLI) = .912—and was significantly better than a one- or two-factor model, whereas the self-report three-factor model had excellent fit (RMSEA = .053, CFI = .979, TLI = .970) and was significantly better than a one- or two-factor model according to chi-square difference testing (Smith et al., 2018). These findings suggest a three-factor model best fits the scale. Invariance testing on this same group suggests that parent- and self-report may provide unique information, as parent- and self-report were not invariant (Smith et al., 2018). Test–retest reliability estimates range from 0.70 to 0.87 for the parent-report version. As in Becker et al. (2015) and Smith et al. (2018), the parent-report scale was modified for use as a self-report measure in the present study (e.g., instead of “does your child . . .,” “do you . . . ”). Each of the 14 items were changed to reflect the first person, and items were kept as similar as possible to the original parent-report version, but some words were changed to make it more understandable for children (e.g., instead of “lethargic,” use “don’t have energy”). In the present study, internal consistencies for parent and child total scores were α = .87 and α = .86, respectively. Internal consistencies for the subscales were α =.80, α =.86, and α =.83 for parent-report, and α =.71, α =.796, and α =.75 for self-report, for the Slow, Sleepy, and Daydreamer subscales, respectively.
Expectancy Value Theory of Motivation Measure–Student Version (ECTM)
The Wigfield and Eccles (2000) ECTM measure consists of 11 items that are each rated on a 5-point scale, with higher scores signifying higher levels of motivation. For this study, the measure was modified as a homework completion motivation measure instead of a scale measuring motivation for a specific subject. For example, instead of “How good at math are you?” the question was modified to be “How good at finishing and turning in homework are you?” As described above, studies have used a three-factor structure, Ability (N = 3 items), Expectancy (N = 2 items), and Value (N = 6 items), or a two-factor structure (Ability and Expectancy factors loading together; Langberg et al., 2017; Wigfield & Eccles, 2000). The two-factor structure, which was confirmed by CFA, Ability/Expectancy (e.g., “how good at completing and turning in homework are you?” “how well do you expect to do with completing and turning in homework this year?”), and Value (e.g., “in general, how useful do you find your homework assignments?”), was used in this study. This scale has been used in prior studies and demonstrated excellent convergent and discriminant validity (Wang & Eccles, 2013; Wigfield & Eccles, 2000). In the present study, adolescents completed the ECTM, and internal consistency was α = .86 for total scale, and α = .78 and α = .82 for the Ability/Expectancy and Values factors, respectively.
Homework Performance Questionnaire (HPQ)
The HPQ (Power, Dombrowski, Watkins, Mautone, & Eagle, 2007; Power, Watkins, et al., 2015) was completed by teachers. The 13 HPQ items that were administered in this study use a 5-point scale, each with corresponding percentages to indicate the amount of time a given behavior occurs. Items were worded in the positive so that 90% to 100% of the time indicates that the child does that behavior consistently well (e.g., student writes down homework assignments independently or manages homework time well). As such, higher scores on the HPQ signify better homework performance. The HPQ has demonstrated high internal consistency (α = .85-.91) and convergent validity with other measures of homework (Power, Dombrowski, et al., 2007; Power, Watkins, et al., 2015). In the current study, two core class teachers rated each student’s homework behaviors and scores were averaged, with internal consistency at α = .83.
Behavior Assessment System for Children–Second Edition (BASC-2)
The BASC-2 is a widely used, multidimensional clinical assessment tool that includes self-report and informant-based report forms to evaluate a wide range of behavioral and emotional experiences of youth. In the current study, parents and adolescents completed the BASC-2 (Reynolds & Kamphaus, 2004). Some items assess the frequency of experiences (rated from 0 = never to 3 = almost always), whereas others are true/false questions assessing the presence of thoughts and behaviors. The BASC-2 is widely used in mental health and educational settings, and has been normed on a large representative sample (Reynolds & Kamphaus, 2004). T scores representing age-normed domain scores were used for this study. T scores reflect a continuous distribution within the population, with a mean of 50 and a standard deviation of 10. BASC-2 authors suggest that t scores more than 60 (i.e., scores above the 86th percentile of the normative sample) represent potentially meaningful clinical elevations. In the current study, scales of particular interest were the anxiety and depression scales. For anxiety, self-report consists of 13 items (e.g., “I get nervous”). For depression, self-report consists of 12 or 13 items on the child and adolescent versions, respectively, including items such as “I feel sad.” Given the differences across the child and adolescent versions for the interpersonal relations scale and the depression scale, t scores were used in all analyses with the BASC to standardize across versions. For analyses, self-report on the BASC-2 anxiety and depression scales were used.
Data Analytic Plan
First, Little’s Missing Completely at Random (MCAR) test was run to ensure that data were not missing from subjects in a systematic manner, which could skew analyses and lead to an incorrect interpretation of data (Little, 1988).
After evaluating bivariate associations between variables, hierarchical regression analyses were conducted to examine whether SCT factors significantly predicted homework motivation broadly after controlling for other factors of psychopathology and IQ. Homework motivation was not separated into two factors for regressions to reduce the number of models and to ensure all items of motivation were included in the models. Parent and student ratings of SCT were examined in separate regression models. Then, mediation models were conducted using process modeling strategies (Hayes, 2013; Hayes & Preacher, 2014). The PROCESS macro for SPSS (Hayes, 2013) was used to test whether the associations between the significant SCT factors of homework motivation from the regressions and teacher-reported homework performance were mediated by either of the homework motivation factors, ability/expectancy, and belief motivation. The motivation factors were entered simultaneously into a multiple mediation model to determine the magnitude of their relative indirect effects. Homework motivation was separated for the mediation to explore multiple possible pathways to impairment. Bootstrapping with 5,000 replications was used in the current study, as bootstrapping tests of mediation are preferred over earlier recommendations for tests of mediation (Baron & Kenny, 1986) as bias-corrected bootstrapped estimates of the confidence intervals (CIs) for indirect effects do not assume normality of the distribution of sampled indirect effects like the Sobel tests does (Preacher, Cai, & MacCalum, 2007). For these analyses, 95% CIs were considered significant if they do not encapsulate zero.
Results
An exploration of all independent and dependent variables found that less than 4% of the data were missing. Little’s MCAR test resulted in a nonsignificant p value, which demonstrated that data were missing in a random fashion and are not significantly influenced by a confounding variable. Therefore, missing data were accounted for using listwise deletion.
Correlation Analyses
The correlation matrix showing bivariate relationships, means, and standard deviations of the independent and dependent variables can be seen in Table 1. Importantly, for both self- and parent-report of SCT, at least one SCT factor was associated with motivation and homework performance as well as with ratings of anxiety and depression. As expected, anxiety and depression were negatively correlated with at least one motivation factor (ability/expectancy factor) and higher levels of homework performance were associated with higher levels of homework motivation. Unexpectedly, intelligence was negatively correlated with motivation.
Correlation Matrix Showing Bivariate Associations Between SCT, Motivation, and Covariates Included in the Regression Models.
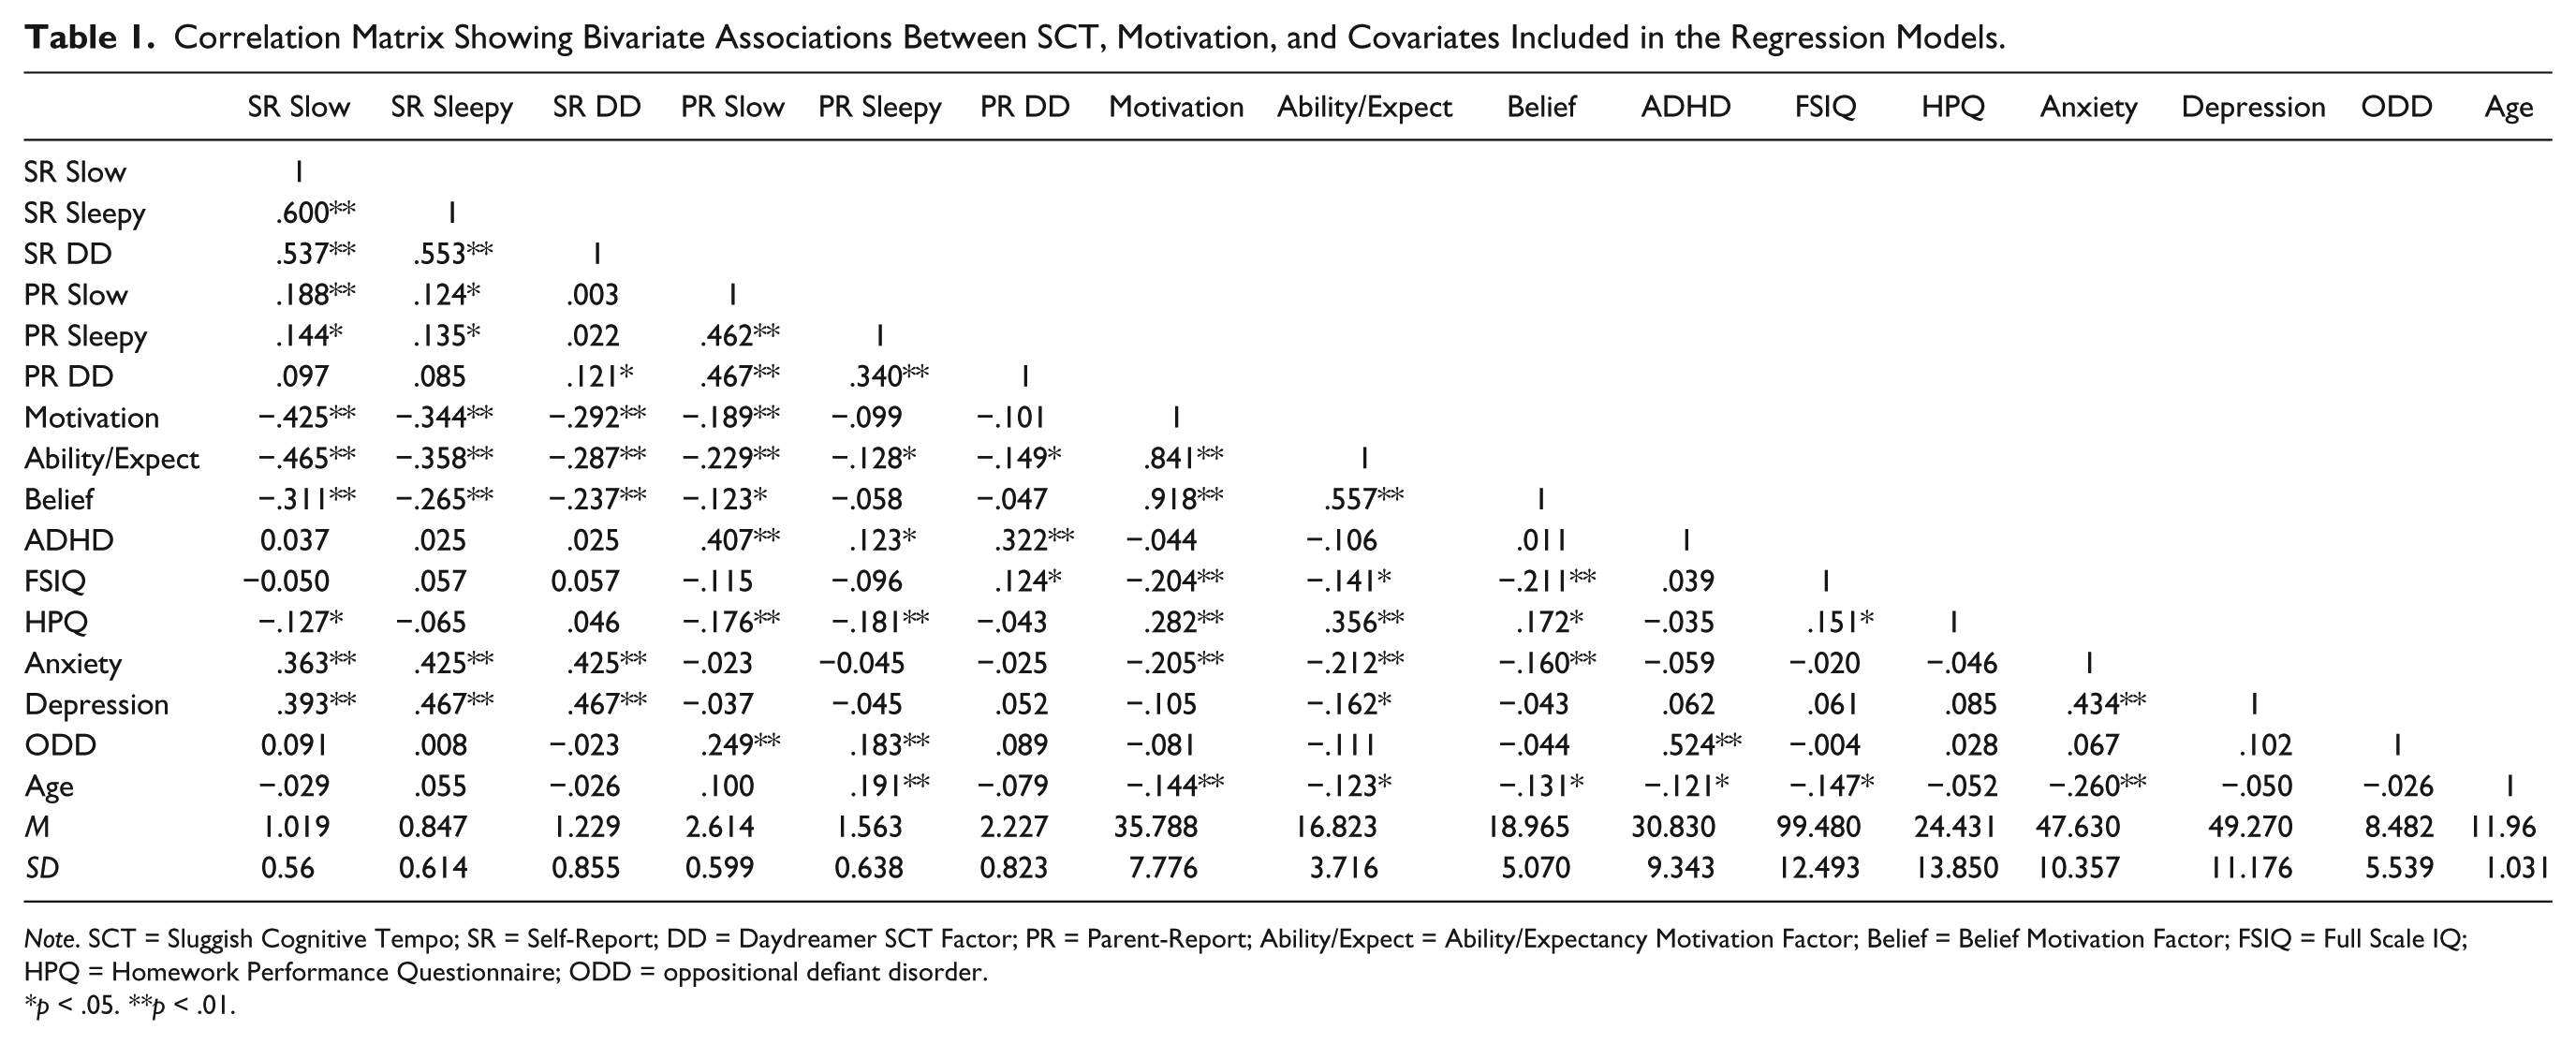
Note. SCT = Sluggish Cognitive Tempo; SR = Self-Report; DD = Daydreamer SCT Factor; PR = Parent-Report; Ability/Expect = Ability/Expectancy Motivation Factor; Belief = Belief Motivation Factor; FSIQ = Full Scale IQ; HPQ = Homework Performance Questionnaire; ODD = oppositional defiant disorder.
*p < .05. **p < .01.
Regression Analyses
For all data, assumptions of univariate and multivariate normality, linearity, and normally distributed errors were checked and met. Hierarchical regression analyses were conducted to examine whether self- and parent-reported SCT predicted homework motivation after controlling for ADHD, ODD, anxiety, depression, age, and FSIQ. These covariates were included due to their significant associations with motivation or SCT (see Table 1). Across all regression analyses, no variance inflator factor (VIF) were above 10 and no tolerance values were below .10, indicating that multicollinearity is not an issue (Cohen, Cohen, West, & Aiken, 2003).
Self-reported regression results can be found in Table 2. When the three self-reported SCT factors were entered on Step 2, these predictors explained an incremental 17.4% of the variance in homework motivation, ΔF(3, 268) = 19.80, p < .001, above and beyond the variance accounted for by ADHD, ODD, anxiety, depression, age, and FSIQ. The self-reported SCT Slow factor, β = −.357, t(268) = −5.180, semi-partial r2 = −.264, p < .001; anxiety, β = −.157, t(268) = −2.514, semi-partial r2 = −.128, p = .013; depression, β = .176, t(268) = 2.834, semi-partial r2 = .144, p = .005; age, β = −.223, t(268) = −4.075, semi-partial r2 = −.208, p < .001; and FSIQ, β = −.265, t(268) = −5.057, semi-partial r2 = −.258, p < .001, were the only significant predicts of homework motivation in Step 2. Contrary to the bivariate associations, higher levels of depression were associated with higher levels of self-reported homework motivation. Parent-reported regression results can be found in Table 3. When the three parent-report SCT factors were entered on Step 2, these predictors explained an incremental 4.1% of the variance in self-reported homework motivation, ΔF(3, 267) = 4.472, p = .004, above and beyond ADHD, ODD, anxiety, depression, age, and FSIQ. The parent-reported SCT Slow factor, β = −.236, t(267) = −3.282, semi-partial r2 = −.181, p < .001; anxiety, β = −.285, t(267) = −4.470, semi-partial r2 = −.246, p < .001; age, β = −.229, t(267) = −3.810, semi-partial r2 = −.210, p < .001; and FSIQ, β = −.284, t(267) = −4.949, semi-partial r2 = −.272, p < .001, were the only significant predictors in Step 2. Similar to the bivariate correlations, intelligence and motivation were negatively associated in the regression models.
Hierarchical Regression Model of SR SCT Predicting SR Homework Motivation.
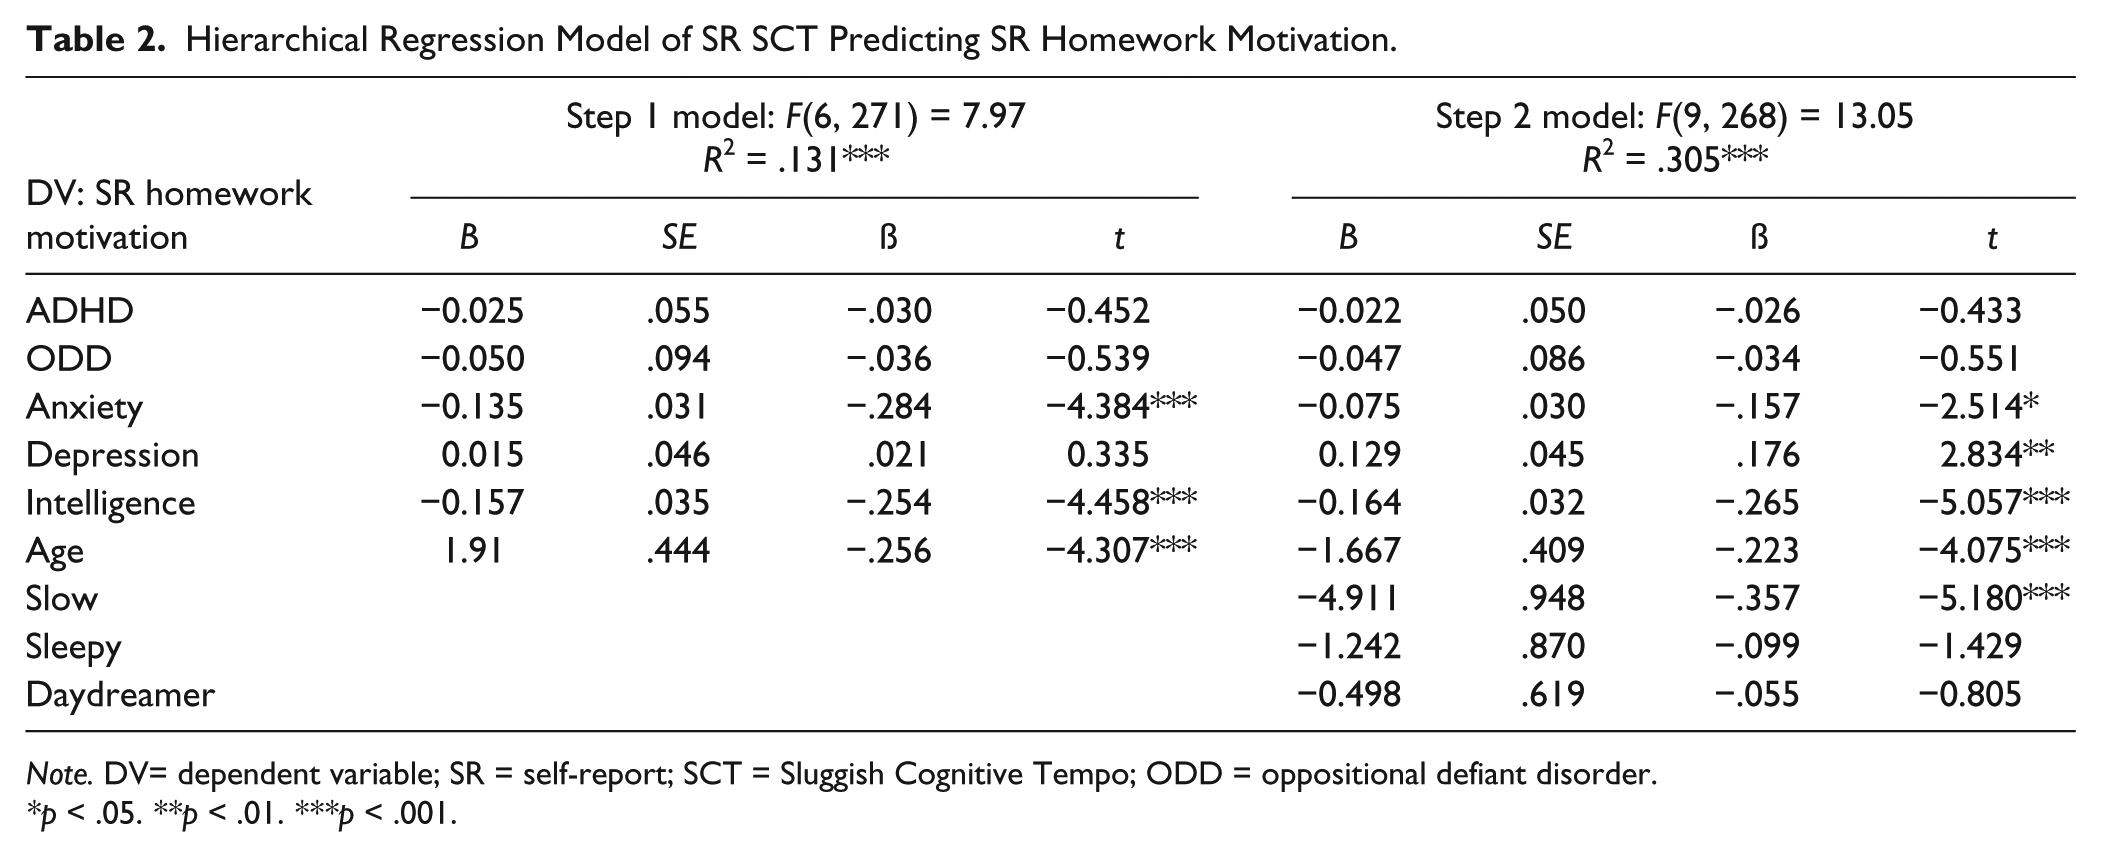
Note. DV= dependent variable; SR = self-report; SCT = Sluggish Cognitive Tempo; ODD = oppositional defiant disorder.
*p < .05. **p < .01. ***p < .001.
Hierarchical Regression Model of PR SCT Predicting SR Homework Motivation.
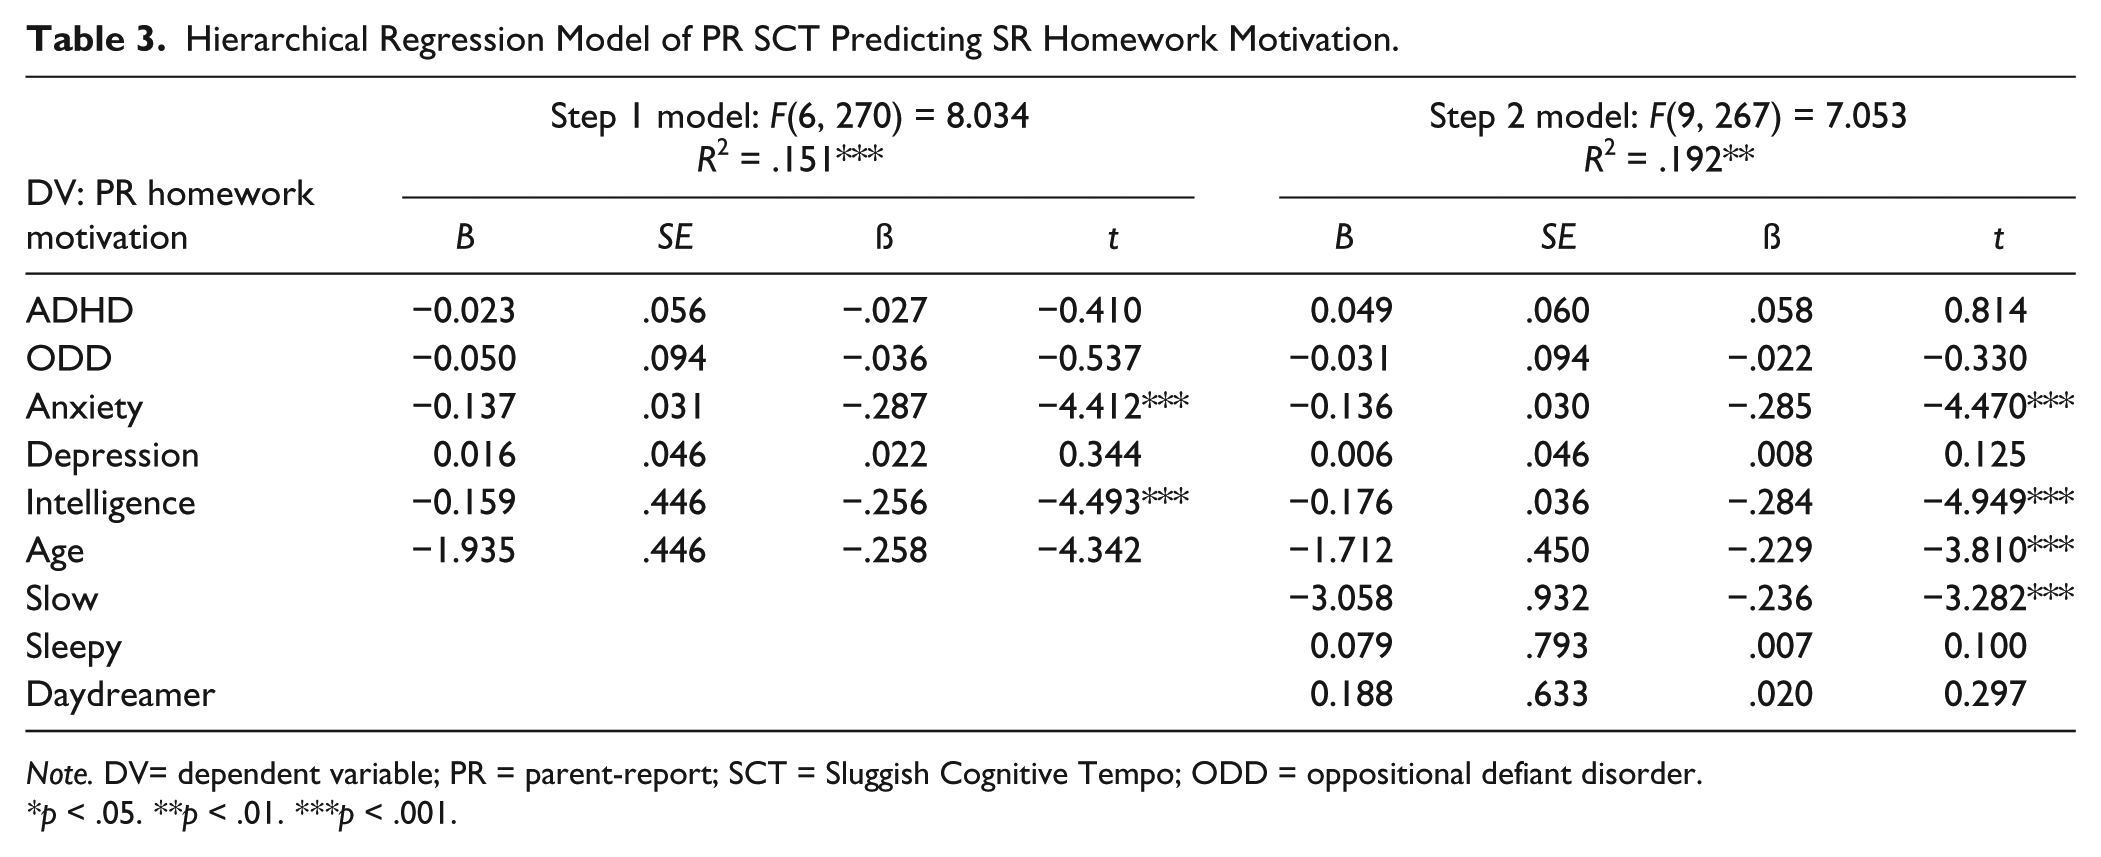
Note. DV= dependent variable; PR = parent-report; SCT = Sluggish Cognitive Tempo; ODD = oppositional defiant disorder.
*p < .05. **p < .01. ***p < .001.
Mediation Analyses
Bootstrapping analysis was conducted to examine the indirect effect of self-reported SCT Slow on teacher-reported homework performance via two motivation factors, ability/expectancy, and belief motivation, using PROCESS (Hayes, 2013). The overall model was significant, F(8, 264) = 7.47, p < .001. Although there was not a direct effect of self-reported SCT Slow to teacher-reported HPQ (b = -.579, SE = 1.71, p = .736), current mediation guidelines are clear that an indirect effect may exist in the absence of a direct effect (Hayes, 2013; Preacher et al., 2007). In line with this possibility and shown in Figure 1, the total indirect effects of the mediators were significant (b = −4.47, SE = .93, CI = [–.6.77, –3.05]). Examination of the specific indirect effects shows that there was a significant indirect effect from self-reported SCT Slow to teacher-reported homework performance via self-reported ability/expectancy motivation (b = −4.27, SE = .95, CI = [–6.81, –3.01]) but not through belief motivation (CI = [–1.12, 1.14]) over and above ADHD, anxiety, depression, ODD, age, and FSIQ. Ability/expectancy motivation was the only direct effect on teacher-reported homework performance. In addition, the path from self-reported SCT Slow to both motivation factors is significant, along with FSIQ.
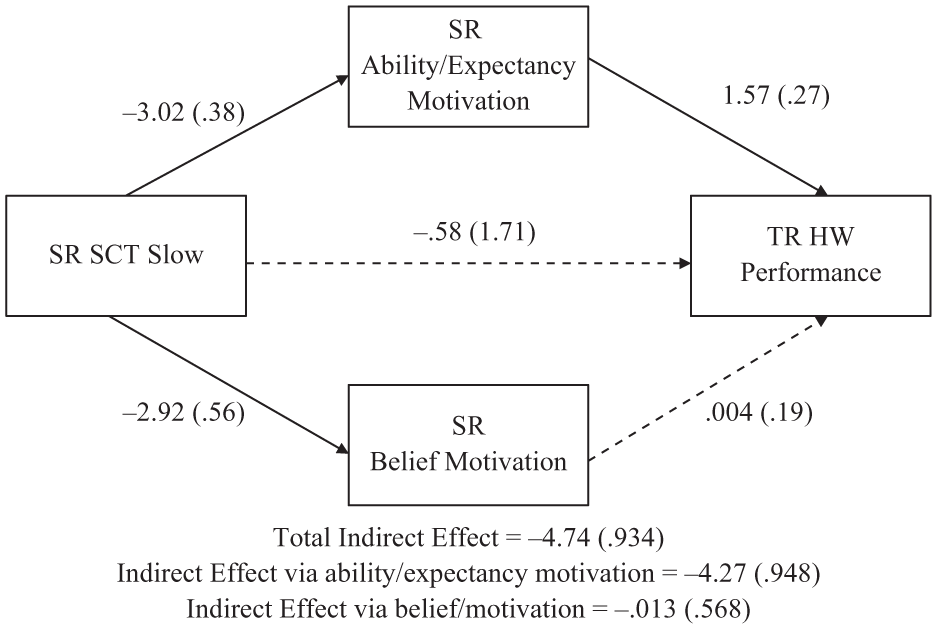
Indirect effects model of SR SCT Slow symptoms predicting TR homework performance via motivation factors.
When assessing the indirect effect of parent-reported SCT Slow on teacher-reported homework performance via ability/expectancy and belief motivation, the model was also significant, F(8, 265) = 9.67, p < .001. Similarly to self-report, there was not a direct effect of parent-reported SCT Slow to teacher-reported HPQ (b = −1.53, SE = 1.47, p = .299). The total indirect effects of the mediators were significant (b = −2.21, SE = .60, CI = [–3.54, –1.15]), as shown in Figure 2. There was a significant indirect effect from parent-reported SCT Slow to teacher-reported homework performance via self-reported ability/expectancy motivation (b = −2.23, SE = .63, CI = [–3.64, –1.17]) but not through belief motivation (CI = [–.50, .65]) over and above ADHD, anxiety, depression, ODD, age, and FSIQ show in Table 2. Only self-reported ability/expectancy motivation had a significant direct effect to teacher-reported homework performance. In addition, the path from self-reported SCT Slow to both motivation factors is significant, along with FSIQ and anxiety.
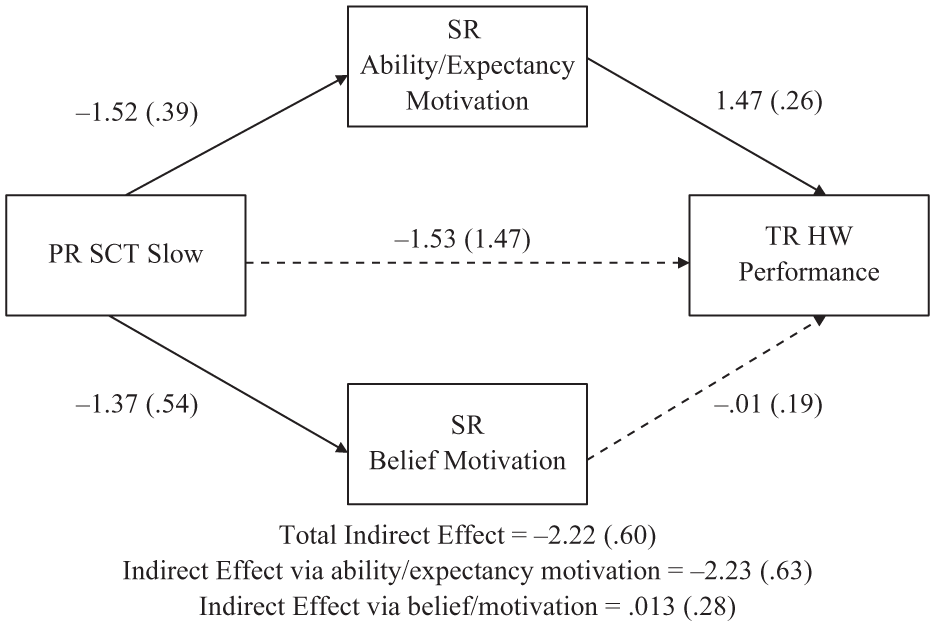
Indirect effects model of PR SCT Slow symptoms predicting TR homework performance via motivation factors.
Discussion
This is one of the first studies to evaluate associations between SCT and motivation despite obvious conceptual links. In this study, the association between SCT and homework motivation was evaluated in a sample of middle school students with ADHD. Homework motivation is important because youth with ADHD often exhibit homework problems and fail to turn in assignments, which leads to poor academic performance (Langberg et al., 2017). In the current study, multiple parent- and self-report SCT factors significantly predicted youth self-report of homework motivation (see Table 1). However, the association between the SCT Slow factor and homework motivation was most robust; significant above and beyond symptoms of ADHD, ODD, anxiety, depression, age, and intelligence. Indeed, adding self-report of SCT to the model explained an additional 17.4% of the variance in homework motivation. The mediation models tested in this study, although cross-sectional, were multi-informant and cross-rater (parent-report of SCT to self-report of motivation to teacher-report of homework problems), and suggest that low motivation may help explain the oft-cited association between SCT and academic impairment. These findings and clinical implications are discussed further in the subsequent sections.
The SCT Slow factor was a robust predictor of homework motivation in the regression models. This makes sense given that multiple items comprising the Slow factor (Becker et al., 2015; Penny et al., 2009; Smith et al., 2018) ask about behaviors directly relevant to motivation, including “Is apathetic; shows little interest . . .,” “Effort on tasks fades quickly,” and “Lacks initiative to complete work.” It has been theorized that these aspects of SCT may represent underlying executive function deficits (Smith & Langberg, 2017), as they parallel executive functions, such as difficulty initiating actions and delay aversion. Consistent with this assertion, metacognitive executive function deficits predict SCT Slow behaviors, accounting for age, sex, race, and ADHD symptoms (Becker & Langberg, 2014). Sonuga-Barke (2003) posits a dual pathway model of ADHD, which specifies that both executive functions (poor inhibitory control and cognitive flexibility, impaired time management, behavioral dysregulation) and motivational factors (delay aversion, preference for immediacy, altered reward sensitivity) underlie observable ADHD symptoms. Similarly, Castellanos, Sonuga-Barke, Milham, and Tannock (2006) classifies major neurocognitive difficulties associated with ADHD as either (a) “cool” executive functioning deficits associated with the ability to suppress automatic processes and maintain information in the mind while completing tasks or (b) “hot” deficits in rewards processing associated with risky decision making and motivational state. Thus, although the etiology of SCT is unknown, it is possible that current reward processing and motivation models of ADHD can be used to explain the frequent comorbid occurrence of SCT and ADHD symptoms. Overall, it seems likely that SCT, motivation, and reward processing are intertwined constructs, and longitudinal research is needed to help elucidate directionality of these associations.
In the present study, only the ability/expectancy motivation factor was a mediator of the relation between the SCT Slow factor and teacher-rated homework problems. Interestingly, SCT Slow did not directly predict teacher-rated homework problems in this sample, and the association was only present through the influence of homework motivation ability/expectancy beliefs. The ability/expectancy motivation factor measures students’ perceptions of their current (ability) and future (expectancy) competence at completing and turning in homework. In contrast, the task value and interest factor assesses how important and useful students find completing and turning in homework (Wigfield & Eccles, 2000). Accordingly, the present findings suggest that SCT does not necessarily lead students to value academic tasks less or have less interest in those tasks, but rather, that SCT may be associated with low self-efficacy about abilities. That is, youth with ADHD and SCT may not believe that they can be successful with tasks and, therefore, exhibit low motivation to complete those tasks even if they view them as important. Overall, the unique association between SCT Slow and motivation supports the clinical utility of measuring SCT as a multidimensional construct.
Limitations
The present study should be interpreted in light of several limitations. First, the cross-sectional nature of the data is a significant limitation as it prohibits conclusions about causality or direction of effects regarding SCT, motivation, and homework problems. Specifically, it is unclear whether SCT leads to impairment in motivation or vice versa. Although certainly limited, cross-sectional mediation was run in this study because theoretically and developmentally, there is a strong argument for psychopathology coming first, and having a detrimental impact on motivation. These analyses provide important information regarding the interplay between SCT, homework motivation, and homework problems, but longitudinal data are needed to confirm the direction of these associations. In addition, the present study used a sample of individuals with ADHD. Although SCT is highly prevalent in individuals with ADHD, the findings may not generalize to nonclinical samples with SCT. It is possible that there are important differences in development and impairment for individuals with and without ADHD who exhibit SCT symptoms.
Unexpectedly, depression in the self-reported SCT regression model was significantly, positively associated with homework motivation despite bivariate correlations suggesting the opposite. This is likely due to the number of variables simultaneously controlled for in the regressions and the overlap between some of these constructs. Similarly, intelligence exhibited a negative association with motivation, but in this case, the association was present both in the bivariate correlations and in the multivariate regressions. This finding clearly needs to be replicated before conclusions can be drawn. One possibility is that adolescents with ADHD and higher cognitive abilities have higher expectations for themselves (and/or their caregivers do), and are more self-aware, and accordingly, failure experiences have a more detrimental effect on motivation.
Clinical Implications and Future Directions
The task-specific nature of motivation that is seen in the typically developing literature may mean that the association between SCT and motivation will also be task specific. For example, the association between SCT and homework motivation may be different from the association between SCT and motivation to engage in extracurricular activities or to pursue and develop interpersonal relationships. Data in the present study do not inform this hypothesis, given the specific focus on homework motivation. Future research is needed to evaluate whether SCT is associated with a general motivation deficit that persists across domains, or whether SCT is uniquely predictive of decreased motivation in certain domains (e.g., academic functioning).
There are also likely important developmental differences in the association between SCT and motivation. In this study, age was negatively associated with homework motivation, suggesting that as youth with ADHD get older, their homework motivation decreases. Similarly, in typically developing youth and youth with ADHD, task-specific motivation (e.g., reading and math) decreases in middle school (Eccles et al., 1989; Lee & Zentall, 2017; Wigfield, Eccles, MacIver, Reuman, & Midgley, 1991). The sample in the present study included middle school students with ADHD; the middle school context demands increased motivation to self-manage and regulate behaviors in comparison with elementary school. For example, students are required to keep track of their own schedule and school materials, turn in assignments, and plan for long-term projects with reduced parent and teacher support (Eccles, 2004). Middle school students with ADHD may have reduced intrinsic and extrinsic academic motivation to perform these tasks due to perceived failures during elementary school (Loe & Feldman, 2007). Failure may create learned associations between academic work and aversive intrinsic (i.e., feeling incompetent, boredom) and extrinsic (i.e., reprimands from adults, being placed on academic probation, receiving a low grade) consequences. Although associations in this study suggest homework motivation decreases with age, future longitudinal research is needed to evaluate the developmental trajectories of symptoms of SCT and motivation to determine when, and in what order, problems are most likely to develop. In particular, future research should evaluate whether the association between motivation and SCT is cyclical in nature, with SCT symptoms leading to low motivation and academic impairment, which in turn leads to lower motivation and more severe SCT symptoms.
The present findings provide further support for the negative impact of comorbid SCT on the functional outcomes of students with ADHD. To date there has been no intervention developed specifically to target symptoms of SCT. Growing evidence supports the use of interventions directly targeting negative cognitions and motivation in combination with traditional behavioral strategies and academic skills training for adolescents with ADHD (e.g., Sibley et al., 2016; Sprich, Safren, Finkelstein, Remmert, & Hammerness, 2016). It is possible that a combination of skills training, motivational interviewing (MI), and cognitive behavioral therapy could be useful in addressing symptoms of SCT. This intervention could include a focus on reducing apathy and increasing task-specific motivation. This is important, as academic skills training alone may be insufficient for students who lack motivation. Future research is needed to evaluate whether comorbid SCT symptoms sufficiently decrease and normalize with these existing interventions.
Conclusion
In sum, the findings from this study suggest that SCT and motivation are significantly associated, and that motivation deficits may help explain the negative impact comorbid SCT has on academic functioning. Importantly, given the overlap often witnessed across types of psychopathology, the association between SCT Slow and homework motivation in this study was found above and beyond symptoms of ADHD, ODD, anxiety, depression, age, and intelligence.
Footnotes
Declaration of Conflicting Interests
The author(s) declared no potential conflicts of interest with respect to the research, authorship, and/or publication of this article.
Funding
The author(s) disclosed receipt of the following financial support for the research, authorship, and/or publication of this article: The research reported here was supported by the Institute of Education Sciences, U.S. Department of Education, through Grant R305A130011 to Virginia Commonwealth University. The opinions expressed are those of the authors and do not represent views of the Institute or the U.S. Department of Education.