



Abstract
Keywords
Across cognitive and social domains, it is important to effectively track information in our environment so that we have more accurate perceptions, judgments, and actions. Indeed, we encourage our children to make sure they have carefully read questions on tests and to try to attend to facial and social cues before deciding on a response or action. Research from cognitive development, however, has suggested that children generally tend to be more confident in their performance relative to their actual performance on several types of tasks, such as judgments of learning, performance, and metamemory (Desoete & Roeyers, 2006; Kuhn, 2000; Larkin, 2010; Metcalfe & Finn, 2013; Schneider & Lockl, 2008; Schneider, Visé, Lockl, & Nelson, 2000).
The ability to accurately monitor performance may be especially important for children with ADHD who have been reported to display less awareness of their competence and abilities relative to typically developing (TD) children (Hoza et al., 2004). In these studies, it has been reported that children with ADHD tend to overestimate their performance and abilities relative to parent and teacher ratings in several areas of social and academic functioning (Evangelista, Owens, Golden, & Pelham, 2008; Hoza et al., 2004; Scholtens, Diamantopoulou, Tillma, & Rydell, 2012). However, very little is known about how children with ADHD perform on paradigms where confidence ratings are elicited with direct reference to performance on a specific task (Owens, Goldfine, Evangelista, Hoza, & Kaiser, 2007). The current study expands on this existing research by comparing accuracy, confidence judgments, and a metacognitive index of resolution in children with ADHD and TD children on an emotion recognition task (ERT).
Metacognition and Emotion Recognition
The assessment of monitoring accuracy in developmental samples has predominantly used methods from the field of metacognition (Ackerman & Koriat, 2011; Koriat & Ackerman, 2010; Koriat, Ackerman, Lockl, & Schneider, 2009). The study of metacognition in the areas of cognition, memory and learning (Ackerman & Koriat, 2011; Dunlosky & Metcalfe, 2009; Koriat & Ackerman, 2010; Koriat et al., 2009), academic domains (Larkin, 2010), and theory of mind (Dunlosky & Metcalfe, 2009) has increased in developmental samples. The measurement of metacognition has to do with assessing knowledge about learning, monitoring the likelihood of success, and controlling or regulating activities based on input from one’s monitoring (Dunlosky & Metcalfe, 2009; Metcalfe & Dunlosky, 2008). Metacognition has also been examined in the context of emotional face recognition (Kelly & Metcalfe, 2011).
Several methods have been developed in the metacognitive literature to index knowledge of, monitoring, and controlling one’s cognitive evaluations. Confidence ratings have been used in studies on metacognition to index the child’s assessment of the likelihood that its solution is correct (Koriat, Ackerman, Adiv, Lockl, & Schneider, 2014). Presumably, an individual will be more inclined to choose or engage in an activity that is associated with high confidence. However, individual’s confidence ratings do not tend to precisely track actual accuracy (Dunlosky & Metcalfe, 2009; Stanovich, West, & Toplak, 2016). Relative accuracy indicators can be used to assess whether a person can discriminate between accurate versus inaccurate performance (Koriat, 2012).
As social information processing has been identified as a critical domain of functioning for children with ADHD, we used methods developed in the metacognitive literature to advance our understanding of how children with ADHD monitor their evaluations in the domain of emotion recognition. Specifically, we examined accuracy, confidence ratings, and a relative accuracy index (based on the amalgamation of accuracy and confidence ratings) to assess metacognitive monitoring on the ERT. We used the Goodman Kruskal gamma in the present study (Ackerman & Goldsmith, 2011; Nelson, 1996). Higher relative accuracy indicates better abilities in discriminating accurate from inaccurate performance.
Tracking Performance and Social Cognitive Functioning in ADHD
There is reason to believe that children with ADHD may show biases in how accurately they encode and monitor social information. Deficits in social information processing have been identified as fundamental to maladaptive interpersonal functioning for many children with ADHD (Andrade et al., 2012; King et al., 2009; Mikami, Lee, Hinshaw, & Mullin, 2008; Sibley, Evans, & Serpell, 2010). Self-perceptions of competence have been shown to be rated significantly higher by individuals with ADHD than by parents and teachers in several domains (Evangelista et al., 2008; Hoza et al., 2004; Scholtens et al., 2012). This literature describes the disparity or discrepancy between children’s self-report of their competence in comparison with other criteria reflecting actual competence (such as objective measures of performance or with parent and teacher ratings of competence), termed the Positive Illusory Bias (PIB; Hoza, Pelham, Milich, Pillow, & McBride, 1993; Jia, Jiang, & Mikami, 2016; Owens et al., 2007). According to these studies, children with ADHD tend to rate their self-perceptions of competence in scholastic, social, athletic, and behavior domains higher than their parents and teachers (Evangelista et al., 2008; Gerdes, Hoza, & Pelham, 2003; Hoza et al., 2004; Owens & Hoza, 2003; Scholtens et al., 2012). There have been debates whether a PIB is adaptive or maladaptive. Several explanations have been put forth to explain PIB, including cognitive immaturity, ignorance of incompetence, self-protection, and neurocognitive deficits (Owens et al., 2007). While moderate positive illusions have been suggested to be adaptive in enhancing motivation, performance, and task persistence, children with ADHD tend to struggle in these areas despite having a PIB (Owens et al., 2007). Thus, it seems that self-perceptions are elevated despite these children’s documented difficulty in these domains (Jia et al., 2016). However, recent findings are mixed with regard to PIB in children with ADHD, including whether all children with ADHD display global PIB and whether it is diagnostic of ADHD status (Bourchtein, Langberg, Owens, Evans, & Perera, 2017; McQuade, Breaux, Gómez, Zakarian, & Weatherly, 2016).
Given that social information processing is a core area of difficulty for children with ADHD (Andrade et al., 2012; Matthys, Cuperus, & Van Engeland, 1999; Sibley et al., 2010), we examined this domain from a metacognitive perspective. From this perspective, accuracy and confidence ratings are used to index one’s metacognitive judgment. That is, high confidence in a self-perception may influence a child’s certainty of another person’s emotional state, even if this interpretation is incorrect. For example, a child who is certain that a peer is demonstrating angry facial cues may be more likely to search for confirmatory evidence rather than alternative evidence to disconfirm this belief. Such selective attention to confirmatory social cues is consistent with past research in children with externalizing difficulties (Dodge & Tomlin, 1987; Schippell, Vasey, Caravens-Brown, & Bretveld, 2003). Additional evidence to support the possibility of inaccurate perceptions of competencies in children with ADHD comes from studies that have shown associations between ADHD symptoms and calibration indicators (Fefer, Ogg, & Dedrick, 2018; Hoza, Waschbusch, Owens, Pelham, & Kipp, 2001; Hoza, Waschbusch, Pelham, Molina, & Milich, 2000). Fefer and colleagues (2018) found that ADHD symptoms were highest in students who tended to be overconfident or to overestimate their abilities in social and academic domains. In another study, Hoza and colleagues asked children with ADHD to complete a social task and an academic task, and then predict their performance. The authors found that children with ADHD were overconfident in their performance predictions relative to TD control children (Hoza et al., 2001; Hoza et al., 2000). In the present study, we extend this work to emotion recognition.
Emotion Recognition
Facial expressions are a nonverbal means to communicate and express one’s emotions and recognize others’ emotional states (Collin, Bindra, Raju, Gillberg, & Minnis, 2013). Sensitivity to facial expressions is imperative for developing children’s social competence (Chronaki, Hadwin, Garner, Maurage, & Sonuga-Barke, 2015). Children who understand facial affect in social interactions are better able to form positive interpersonal relationships (Denham, Way, Kalb, Warren-Khot, & Bassett, 2013). Children with ADHD tend to perform poorly on ERTs compared with TD children (Collin et al., 2013; Da Fonseca, Seguier, Santos, Poinso, & Deruelle, 2009; Ibáñez et al., 2011; Kats-Gold, Besser, & Priel, 2007; Markovska-Simoska & Pop-Jordanova, 2010; Sjöwall, Roth, Lindqvist, & Thorell, 2013; Tye et al., 2013). Emotion recognition difficulties are associated with both ADHD symptoms and with social and emotional difficulties experienced by children with ADHD (Bora & Pantelis, 2016). Specifically, problems with inattention and impulsivity may underlie emotion recognition deficits in children with ADHD (Draeger, Prior, & Sanson, 1986; Singh et al., 1998). Children with elevated inattentiveness and impulsivity may fail to attend to aspects of the face that provide specific emotional information, may misjudge the nature of facial cues, and subsequently show difficulty with accurately interpreting others’ emotions (Cadesky, Mota, & Schachar, 2000; Dan & Raz, 2018; McAlpine, Singh, Ellis, Kendall, & Hampton, 1992; Serrano, Owens, & Hallowell, 2018). Emotion recognition deficits in children with ADHD may also be associated with the quality of their social experiences. Children with ADHD may not be able to accurately detect facial cues because of diminished social experiences or less exposure to a range of social emotions (McAlpine et al., 1992). However, past research also suggests that one’s ability to recognize emotions may be due in part to exposure to that emotion (McAlpine et al., 1992): Children with externalizing disorders such as ADHD may have more exposure to disapproval and negative facial expressions, so they may be primed for detection of emotions like anger and sadness.
Correlates of Metacognitive Monitoring
It has been suggested that cognitive and executive function abilities are important for self-awareness, self-reflection, and to accurately perceive task difficulty and effort expenditure (Barkley, 1996; Chan & Martinussen, 2016; Hervey, Epstein, & Curry, 2004). Considerable research has documented executive functioning (EF) deficits in children with ADHD (Hilton, Jarrett, McDonald, & Ollendick, 2017; Sjöwall et al., 2013; Willcutt, Doyle, Nigg, Faraone, & Pennington, 2005). Some evidence has been reported for associations between cognitive deficits and biased self-perceptions (McQuade et al., 2011), but a more recent study found no direct relationship (McQuade, Mendoza, Larsen, & Breaux, 2017). We examined the association between our indicators on the ERT with performance on intelligence and EF task (performance and ratings). For the performance-based tasks, we included a measure of inhibition (specifically interference control) and set-shifting to measure EF as these are core domains in models of EF (Miyake, Friedman, Emerson, & Witzki, 2000).
The present study extended the examination of estimations of competence using metacognitive methods in the domain of emotion recognition in a sample of children with ADHD. Specifically, we asked children to rate their confidence in relation to performance on a specific task: emotion recognition. We compared accuracy and confidence ratings across five common emotions (neutral, happy, afraid, angry, and sad). Resolution was calculated using the Goodman Kruskal gamma for the overall ERT. It was expected that children with ADHD may differ in accuracy but display higher confidence than TD children on emotion recognition. We also predicted that the TD group would display higher resolution or discrimination than the ADHD group on this task. That is, the TD group is expected to display higher correspondence between accuracy and confidence on the ERT than the ADHD group. Given that EFs have been implicated in self-awareness and perceiving task difficulty, we examined associations between resolution on the ERT with an executive function rating scale and two performance-based measures (interference control and set-shifting). We expected that higher resolution would be positively correlated with better developed EF. Finally, given the association between aggression and ODD symptoms with social information processing (Matthys et al., 1999), we examined ODD and CD symptoms as a covariate on our tasks.
Method
Participants
Eighty-one 8- to 12-year-old children (M = 119.89 months [9 years, 11months], SD = 14.92 months; 26 females) from a metropolitan city. All children were prescreened in a telephone interview to determine suitability for the current study; parents were asked about previous diagnoses, and children with a diagnosis of autism were excluded. Children were placed into two groups based on psychometically validated questionnaires and interviews, including a clinical group consisting of children with an ADHD diagnosis and a TD control group without ADHD. All children had cognitive functioning at or above the borderline range (IQ >70) on the Kauffman Brief Intelligence Task−2 (KBIT-2). Children were included in the ADHD group if they had a prior diagnosis of ADHD and met diagnostic criteria for ADHD on the Computerized Diagnostic Interview Schedule for Children–Parent Version (C-DISC; Shaffer, Fisher, Lucas, Dulcan, & Schwab-Stone, 2000) and had T-scores higher than 70 (i.e., clinical range) on the ADHD scale of the Child Behavior Checklist (CBCL). Children in the TD group did not have a prior diagnosis of ADHD and did not meet diagnostic criteria for ADHD on the C-DISC nor the CBCL.
Participants in the TD group (n = 42) were recruited by advertising the study in the community (M = 120.43 months [10 years, 0 months], SD = 14.73); 15 females and 27 males). Parents identified 78.6% children as Caucasian, 16.7% as having a mixed background, 2.4% as having a Latin American background, and 2.4% as Other. Parents reported that none of the TD children were taking psychotropic medication. One child was identified with a Learning Disorder.
The ADHD group (n = 39) was recruited from an outpatient mental health service, private psychological practices, and advertising on a website that provides education for families with children with ADHD (M = 119.31 months [9 years, 11 months], SD = 15.29 months; 11 females and 28 males). All of these children had a previous diagnosis of ADHD and we conducted procedures to confirm this diagnosis. Parents identified approximately half of the children as Caucasian (48.7%), 30.8% as mixed background, 17.9% as Other, and 2.6% as Latin American. Approximately, half of the children in the ADHD group were taking psychotropic medication (51.3%); 19 were taking psycho-stimulants only and two were taking medication in addition to the psychostimulant (a selective-serotonin reuptake inhibitor to treat anxiety, and homeopathic remedies for concentration). There were no significant differences between the medicated and unmedicated participants in the ADHD group on age corrected IQ (p = .84) or on emotion recognition accuracy (p = .36) or resolution (p = .45) measures examined in this study. Ten children in the ADHD group had a Learning Disorder (25.6%) and two children had Language Impairment (5.1%).
Measures
Screening and diagnostic measures
Kaufman Brief Intelligence Test, Second Edition (KBIT-2)
The KBIT-2 (Kaufman & Kaufman, 2004) consists of three subtests that measure verbal and nonverbal intellectual abilities. Verbal abilities were assessed with receptive and expressive vocabulary tasks. The Verbal Knowledge subtest is composed of 60 items and required participants to choose which of five-to-six pictures depict a word spoken by the examiner. The Riddles subtest had 48 items and required participants to solve a verbal riddle with a one-word answer (or identification of a picture for younger ages). Nonverbal ability was assessed with the Matrices Subtest that has 46 multiple choice items and required participants to identify which picture best completes a matrix. A composite, nonage corrected score of intelligence was obtained by summing the standardized z-scores of each raw score. Higher scores indicate higher abilities.
C-DISC
The C-DISC (Shaffer et al., 2000) is a structured interview designed to assess Diagnostic and Statistical Manual of Mental Disorders (4th ed.; DSM-IV; American Psychiatric Association [APA], 1994)/DSM-5 (5th ed.; APA, 2013) psychiatric disorders, symptoms, and level of impairment in children and adolescents aged 6 to 17 years. Parents answered questions about whether their child has experienced a specific symptom over the past year. The ADHD, Oppositional Defiant Disorder (ODD), and Conduct Disorder (CD) subscales were administered to parents by trained graduate students in clinical psychology supervised by a registered psychologist. The dependent variables used were the number of ADHD, ODD, and CD symptoms over the past year and impairment.
CBCL
This measure includes syndrome scales and DSM-5-oriented scales (Achenbach, 2013; Achenbach & Rescorla, 2001). Responses are provided by parents on a 3-point Likert-type scale ranging from 0 = absent, 1 = occurs sometimes, and 2 = occurs often. For an item to be endorsed, it must have been present in the past 6 months. The inter-interviewer and test–retest reliability of item scores were high, with ICCs ranging from .93 to 1.00. The DSM-5 ADHD, oppositional defiant problems, and conduct problems’ T-scores were used.
Impairment Rating Scale (IRS)
The IRS is a seven-item measure of child functioning and need for treatment in several domains, such as peer relationships, academic progress, self-esteem, general family functioning, and overall severity of problem behavior (Fabiano et al., 2006). Parents provide responses on a visual-analog scale anchored by no problems/no need for treatment to severe problems/definitely needs treatment. Ratings are converted to scores from 0 to 6. The IRS has shown cross-informant reliability of .78 and 1-year temporal stability correlations ranging from .54 to .76 (Fabiano et al., 2006). Convergent validity has been shown with ADHD symptoms on the C-Disk and IRS with correlations ranging from .58 to .79. The impairment rating was averaged across all seven items to characterize the level of impairment. A higher score indicates greater impairment.
Social cognitive tasks
ERT
This task was developed for the current study using the National Institutes of Mental Health (NIMH) Child Emotional Faces Picture Set (http://devepi.duhs.duke.edu/NIMH_Pictures.html; Egger et al., 2011), a large, publicly available, stimulus set with validated high-quality color images of children’s facial emotions. These stimuli were carefully developed using child actors and systematic methods for the purpose of being utilized for experimental research. The validity of each facial expression was established by using adult raters to select the emotion that best represented each facial expression. Emotion recognition has been examined in ADHD using several experimental paradigms, very similar to the paradigm used in the present study. We sought to include an ERT that met the following criteria: photographs of children/youth that depict an equal number of males and females, present images of the full face (not partial face or only of the eyes); used a multiple choice format for providing a response; had an adequate number of stimulus items (so that we could have a subset of 40 final items); provided subsets of images of different positive, negative, and neutral emotions (happy, afraid, angry, sad, and neutral); and had demonstrated evidence for the validity of the representations of specific emotional expressions (Egger et al., 2011).
Our task consisted of 40 items selected from these stimuli, with each emotion (neutral, happy, afraid, angry, and sad) represented eight times (four were female and four were male faces for each emotion). For each test item, participants were shown an image of a child’s face at the top of the page and the five emotions were listed at the bottom of the page. Participants first selected which emotion matched the image and then rated his or her confidence in their judgment of each item on a 10-point rating scale ranging from 1 to 10. There was a solid line to show this continuous scale, and the line at the bottom end of the scale was colored in blue and the line at the top of the scale was colored in red, to further signal to children whether they thought they were “cold” (far off in the blue section) or “hot” (close in their estimate in the red section). The number line was further anchored by the following labels: 1 = I’m not sure if I’m right, 5 = good chance I’m right, and 10 = I’m definitely right. This scale was adapted from confidence rating scales that have been used in developmental samples (Ackerman & Koriat, 2011; Koriat & Ackerman, 2010; Koriat et al., 2009). We examined mean accuracy and mean confidence ratings for the overall task and also separately for each of the emotions (neutral, happy, afraid, angry, and sad).
The Goodman Kruskal gamma is used for computing relative accuracy or resolution by correlating an individual participant’s judgments with test performance across items (Dunlosky & Metcalfe, 2009). The study of relative accuracy has been well-established in developmental samples (Ackerman & Koriat, 2011; Koriat & Ackerman, 2010; Koriat et al., 2009). The Goodman-Kruskal gamma (Ackerman & Goldsmith, 2011; Nelson, 1996) was used to assess whether confidence ratings differed between correct and incorrect items. A correlation is calculated between each confidence rating and the accuracy of each individual item, which is calculated within individuals. A score of 0 on the resulting gamma correlation indicates no accuracy in discriminating accurate from inaccurate performance, whereas a positive correlation indicates better accuracy in discriminating accurate from inaccurate performance (Metcalfe & Dunlosky, 2009). That is, a higher gamma index indicates higher confidence for accurate responses than for inaccurate responses. We used the gamma index for the ERT as an index of resolution for the overall task as gamma is the standard index used in the field (Dunlosky & Metcalfe, 2009) and remains stable across a large set of items (Ackerman & Goldsmith, 2011).
Executive Function Performance-Based and Rating Measures
Barkley Deficits in Executive Functioning Scale–Children and Adolescents (BDEFS-CA Short Form)
The BDEFS-CA (Barkley, 2012) Short Form has 20-items for parents to rate their child’s abilities in time management, organization and problem solving, self-restraint, self-motivation, and self-regulation of emotions. Cronbach’s alpha reliability in the current study was .89. This measure has been found to be reliable and valid (Barkley, 2012). An overall score was derived and higher scores indicated more deficits in EF.
The Trail Making Test
The Trail Making Test (Reitan, 1958) is a performance-based measure of mental flexibility that consisted of two parts with practice items for both parts. Part A required participants to connect 25 numbers circled in numeric order with a pencil. Part B consisted of 13 circled numbers and 12 circled letters on which the participant alternated between letters and numbers (1 to A, A to 2, 2 to B, and so on) until all of the circled numbers and letters were exhausted. The dependent measure on this task was the completion time on Part B minus the completion time on Part A (to control for processing speed). Higher scores indicated lower set-shifting ability.
The Stroop Task
The Stroop Task (Stroop, 1935) is a performance-based measure used to assess interference control, a type of inhibition (Friedman & Miyake, 2004). Interference control refers to the ability to filter out irrelevant information and to select relevant information. There were three different conditions: a word reading condition, a color naming condition, and an interference condition. In the word reading condition, participants were presented with a chart of 48 words that named four colors (red, green, blue, and yellow) displayed in a matrix of six columns and eight rows. Participants were asked to read the words as quickly as possible without making any errors. In the color naming condition, participants were presented with a chart of 48 patches of red, green, blue, and yellow colors displayed in a matrix of six columns and eight rows. Participants were asked to name the colors as quickly as possible without making any errors. In the interference condition, participants were presented with a chart of 48 words displayed in a matrix of six columns and eight rows. In this condition, the color naming words (red, green, blue, and yellow) appeared in a different color ink (red, green, blue, and yellow) than the color the word named. For example, the word “red” appeared in the color yellow. Participants were asked to name the color as quickly as possible without making any errors. The dependent variable was the total naming time for the interference condition minus the total naming time for the color naming condition (Strauss, Sherman, & Spreen, 2006). Higher scores indicated lower inhibition.
Procedure
For each testing session, informed consent and assent were first obtained from parents and children. One examiner administered the measures to the child and another examiner administered the parent measures. Study completion time ranged from 90 to 120 min and each participant received an honorarium of $20 Cdn. All procedures were approved by the institutional research ethics boards at the outpatient mental health hospital and university.
Results
Statistical Analyses
All statistical analyses were conducted using SPSS Version 24.0. The significance level for research questions was set at the standard p < .05. The normality of each of the variables measured was tested using the Shapiro–Wilk test of normality as well as visual inspection of histogram and Q-Q plots. The variables on the experimental tasks were negatively skewed, indicating that accuracy and confidence levels were relatively high on these tasks. Analyses were conducted using both parametric and nonparametric techniques, and we obtained parallel findings. One parent of a TD child did not complete the C-DISC, so the CBCL was used to determine inclusion in the control group. Data for three TD participants were missing on the C-DISC, CBCL, and/or BDEFS, and data were imputed based on group means.
Descriptive Statistics
Diagnostic frequencies
On the C-DISC, all participants in the ADHD group met diagnostic criteria for ADHD and 56.4% also met criteria for ODD, and 12.8% met criteria for CD. None of the participants in TD met criteria for ADHD, ODD, or CD.
C-DISC, CBCL, and IRS group differences
Table 1 provides the means and standard deviations for each group on symptoms and impairment measured by the C-DISC, CBCL, and IRS. The TD group showed significantly fewer symptoms and impairment compared with the ADHD group. Cohen’s d effect sizes indicate large effect sizes in terms of the clinically significant symptoms in the ADHD group. The ADHD and TD groups did not differ on the intelligencecomposite raw score, but the ADHD group displayed lower executive function skills based on the Trail Making, Stroop, and BDEFS-CA compared with the TD group.
Group Differences on Clinical and Experimental Tasks.

Note. TD = typically developing; C-DISC = Computerized Diagnostic Interview Schedule for Children; ODD = Oppositional Defiant Disorder; CD = Conduct Disorder; CBCL = Child Behavior Checklist; BDEFS-CA = Barkley Deficits in Executive Functioning Scale–Children and Adolescents.
p < .05. **p < .01. ***p < .001.
Group Differences on Accuracy, Confidence Ratings, and Resolution on Emotion Recognition
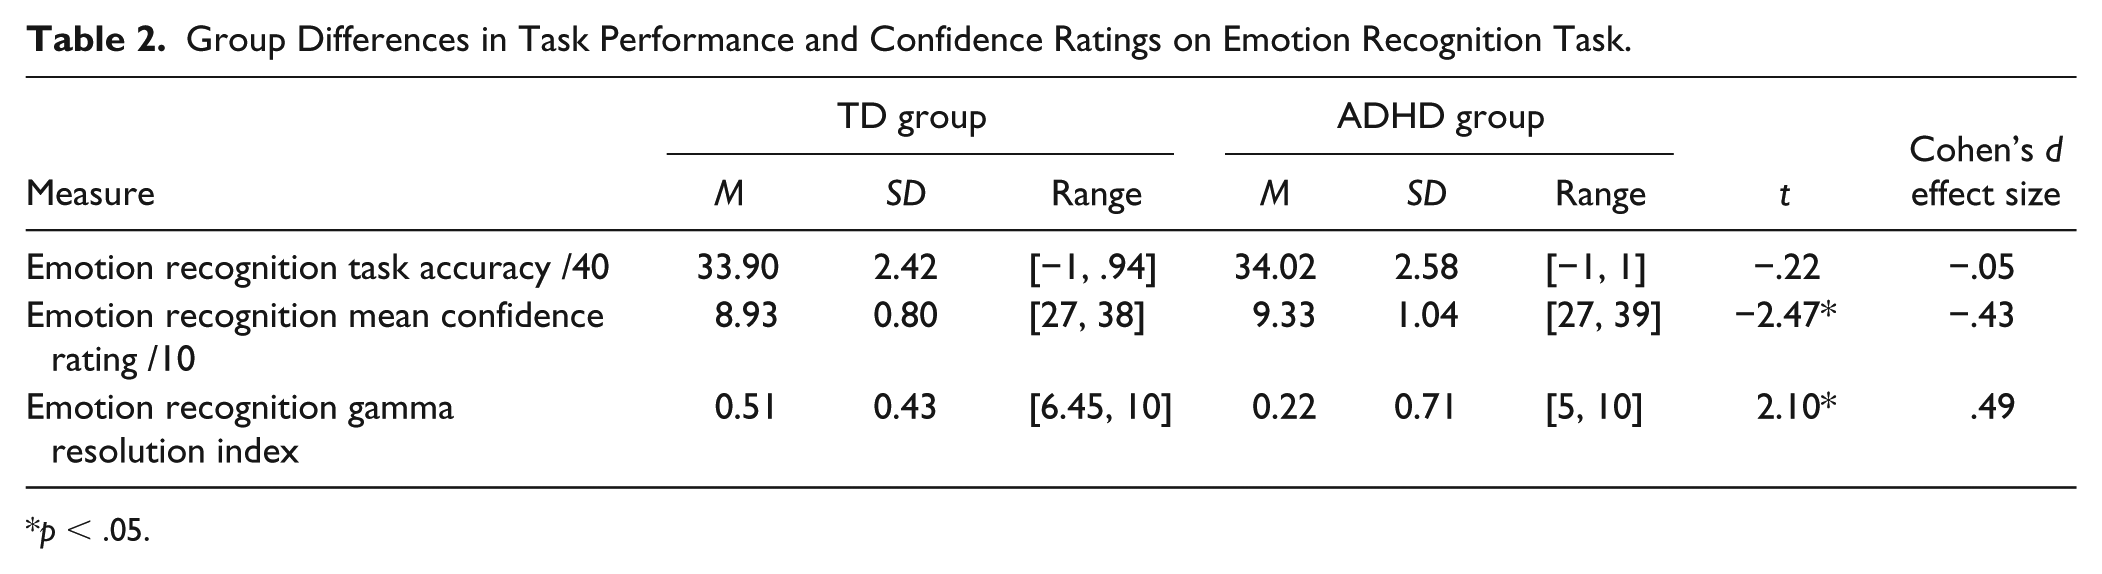
Group means and standard deviations for accuracy and confidence ratings are presented in Table 2. An examination of this Table makes apparent that accuracy was relatively high on the ERT task, ranging from 84.76% (33.90 out of 40) to 85.06% (34.02 out of 40) accurate in the TD group and clinical groups, respectively. Similarly, mean confidence ratings were relatively high, ranging from 8.93 to 9.33 in the TD group and clinical groups on a 10-point scale.
Group Differences in Task Performance and Confidence Ratings on Emotion Recognition Task.
p < .05.
We compared accuracy and confidence on the ERT between the TD and ADHD groups using a 2 × 2 ANOVA), F(2, 78) = 3.01, p = .05, η2 = .07. The TD and ADHD groups did not differ on emotion recognition accuracy, F(1, 79) = .05, p = .83, η2 = < .01. However, confidence ratings differed between the TD and ADHD groups, F(1, 79) = 6.10, p = .016, η2 = .07. Given the presence of comorbid ODD and CD symptoms in the ADHD sample, we covaried for these symptoms over the last year reported in the C-DISC. The overall group effect remained significant, F(2, 76) = 4.54, p = .014, η2 = .11. ODD symptoms did not enter as a significant covariate for accuracy, F(1, 77) = .30, p = .59, η2 = < .01, or for confidence, F(1, 77) = .03, p = .87, η2 = < .01. CD symptoms did not enter as a significant covariate for accuracy, F(1, 77) = < .01, p = .99, η2 < .01, but did enter as a significant covariate for confidence, F(1, 77) = 3.95, p = .05, η2 = .05.
We examined whether the ADHD and TD groups were accurate in discriminating between correct and incorrect responses using the gamma index. Each of these correlations was significantly greater than 0 (p < .001), indicating that the entire sample of participants were successful in discriminating between correct and incorrect answers.
When comparing gamma correlations between groups, the TD group (M = 0.51, SD = 0.43) had a significantly higher mean score than the ADHD group (M = 0.22, SD = 0.71), indicating that the TD group was significantly better at discriminating correct from incorrect responses than the ADHD group, t(67) = 2.10, p = .04. That is, the TD group rated higher confidence for correct than incorrect responses relative to the ADHD group, indicating better resolution in the TD than ADHD group. Notably, there was a reduction in the number of gamma correlations in the ADHD group, attributable to a lack of variability in their confidence ratings. Those participants are consequently excluded from this analysis, as this behavior may reflect shallow processing of the task instructions, but this has also a limitation that has been identified for the gamma index (see Fleming & Lau, 2014 for a more detailed discussion). Indeed, there were 870 ratings of 10 (highest level of confidence on this scale) on the confidence rating scale by the TD group relative to 1,205 ratings of 10 on the confidence rating by the ADHD group. These findings indicate that, overall, participants in the ADHD group endorsed significantly higher and consistent confidence ratings than the TD control group. We did not examine separate gamma indices for each type of emotion as there were not enough items for each emotion to calculate a reliable gamma index (Ackerman & Goldsmith, 2011).
Correlations Between ERT Variables, Clinical Symptoms, Intelligence, and EF Measures
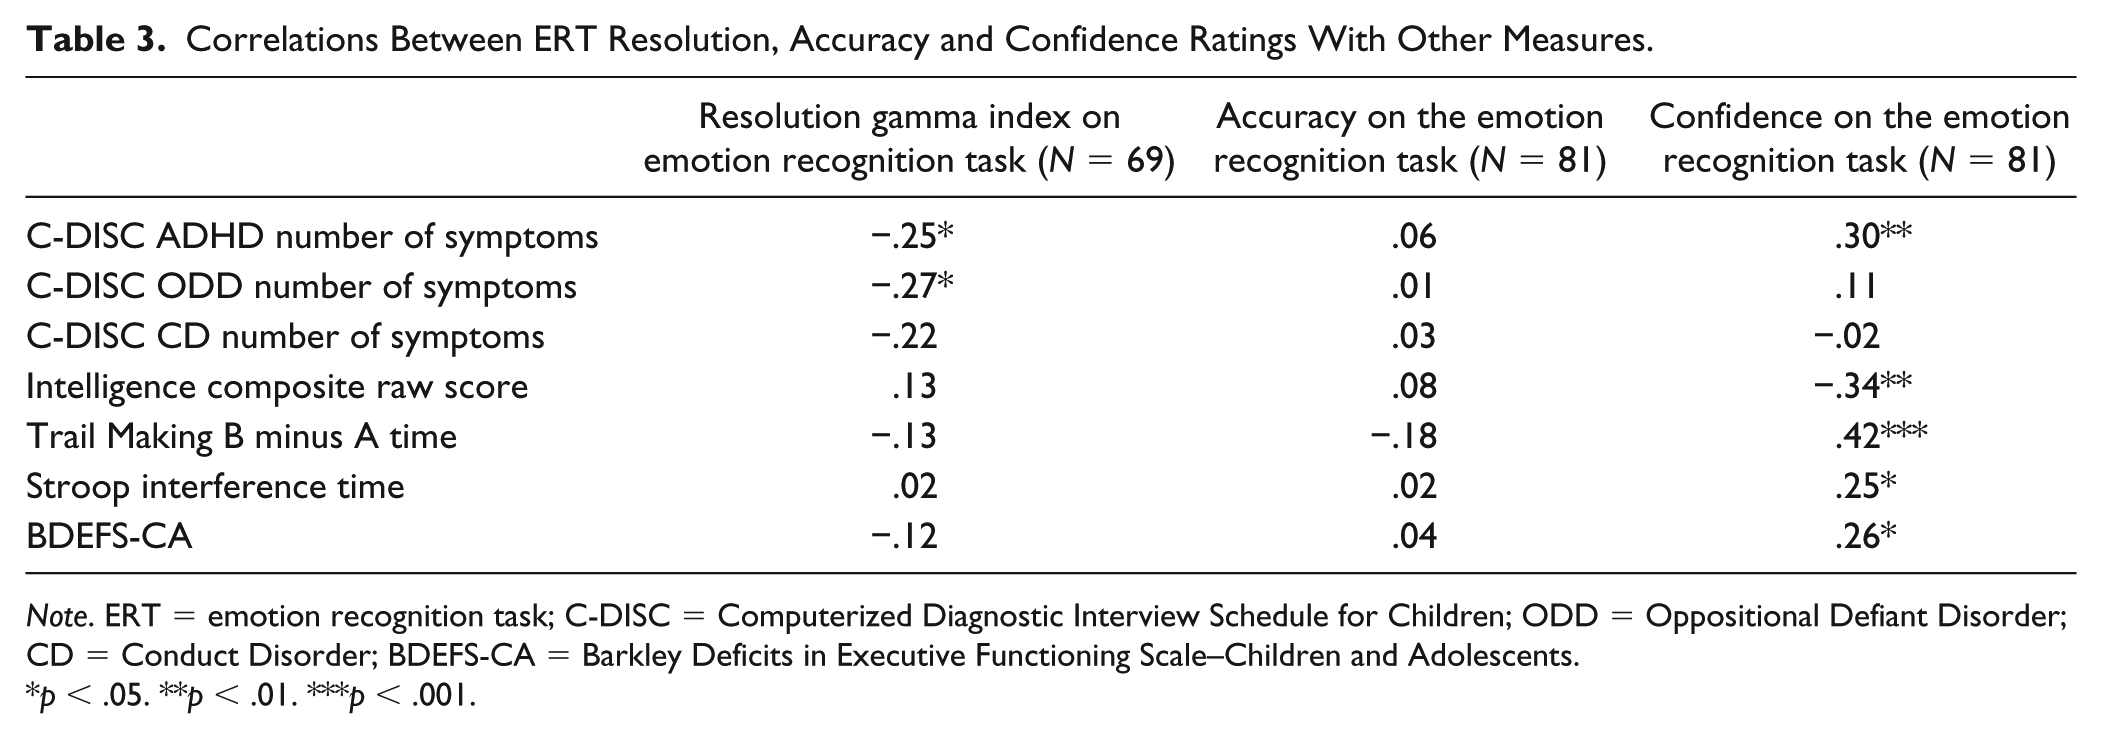
We examined correlations between the ERT and other measures within the entire sample, shown in Table 3. Specifically, we examined correlations between the ERT measures and intelligence composite raw score, executive functions task performance (response interference and set-shifting) and ratings of executive function within the entire sample. We also examined correlations between the ERT and symptoms of ADHD, ODD, and CD within the entire sample. Resolution was significantly negatively correlated with number of ADHD symptoms in the last year on the C-DISC, r = −.25, p = .036, number of ODD symptoms in the last year on the C-DISC, r = −.27, p = .023, but not significantly associated with number of CD symptoms in the last year. These correlations with the ADHD and ODD symptoms indicate that better resolution was associated with lower number of symptoms.
Correlations Between ERT Resolution, Accuracy and Confidence Ratings With Other Measures.
Note. ERT = emotion recognition task; C-DISC = Computerized Diagnostic Interview Schedule for Children; ODD = Oppositional Defiant Disorder; CD = Conduct Disorder; BDEFS-CA = Barkley Deficits in Executive Functioning Scale–Children and Adolescents.
p < .05. **p < .01. ***p < .001.
Resolution was not significantly associated with the performance-based measures of executive function (Stroop interference: r = .02, p = .88; set-shifting: r = −.13, p = .30) or with the ratings of executive function, r = −.12, p = .34. Similarly, resolution was not associated with intelligence, r = .13, p = .28. None of the correlations with ERT accuracy were significant, but higher confidence was correlated with more ADHD symptoms, r = .30, p < .05, lower intelligence, r = −.34, p < .01, lower executive function skills (r = .42, p < .001 for Trail Making and r = .25, p < .05 for Stroop), and lower executive function ratings, r = .26, p < .05.
Emotion Recognition and Valence of Emotion
We also examined whether group differences in accuracy and confidence on the ERT may vary depending on valence of emotion. We examined accuracy and confidence separately, using mixed between-within subjects ANOVA to assess differences between the TD and ADHD groups on the five different emotions in the ERT. For the accuracy analysis, there was no significant interaction between group and emotion type, F(4, 76) = 1.84, p = .13, η2 = .09, and no significant group effect, F(1, 79) = .05, p = .83, η2 = < .01. There was a significant effect of emotion type as accuracy on sad faces was significantly lower than on the other emotions based on pairwise comparisons (p < .001).
For the confidence rating analyses, there was a significant Group × Emotion type interaction, F(4, 76) = 6.67, p = < .001, η2 = .26. This interaction displayed that the ADHD group was more confident on angry (p < .001) and sad (p < .003) faces than the TD group based on pairwise comparisons. There was a significant effect of group, as the ADHD group rated higher levels of confidence than the TD group, F(1, 79) = 6.10, p < .016, η2 = .07. There was also a significant effect of emotion, where lower confidence was rated for sad faces compared with neutral, angry, and happy faces based on pairwise comparisons, p < .0001.
Given the high comorbidity of ODD and CD symptoms in the ADHD sample, we covaried for ODD and CD symptoms over the last year reported in the C-DISC for the confidence rating analyses. When we covaried for ODD symptoms, the Group × Emotion type interaction remained significant, F(4, 75) = 6.99, p < .0001, η2 = .27, the group effect remained significant, F(1, 78) = 5.70, p < .019, η2 = .07, and ODD symptoms did not enter as a significant covariate. When we covaried for CD symptoms, the Group × Emotion type interaction remained significant, F(4, 75) = 4.43, p = .003, η2 = .19, the group effect remained significant, F(1, 78) = 10.94, p = .001, η2 = .12, and CD symptoms also entered as a significant covariate, F(1, 78) = 4.61, p = .035, η2 = .06.
Gender Differences
We examined gender differences by comparing males and females on emotion recognition accuracy and on the resolution index. We also made these comparisons within clinical and control groups. We did not find any differences in overall accuracy on emotion recognition, t(79) = −.96, p = .34, Male = 84.45 (6.50), Females = 85.87 (5.52), N = 81, or across the five different emotions. There were no significant differences in overall accuracy in emotion recognition or across the five different emotions within the clinical, t(37) = −.79, p = .44, Male = 84.55 (7.14), Females = 86.36 (4.24), N = 39, or control groups, t(40) = −.59, p = .56, Male = 84.35 (5.91), Females = 85.50 (6.42), N = 42.
We also did not find any significant gender differences in resolution for the entire sample, t(67) = −1.10, p = .28; Males = .34 (.60), Females = .50 (.52), N = 69. However, we did find a difference between males and females in resolution in the control group, t(38) = −2.05, p = .047; Males = .41 (.50), Females = .70 (.17), N = 40, but not in the clinical group, t(27) = .16, p = .88, Males = .23 (.72), Females = .19, N = 29. Females in the TD group displayed higher resolution than males in the TD group.
Discussion
In the current study, we investigated differences in accuracy and confidence ratings between children with ADHD and TD children on an ERT. As hypothesized, the ADHD group was significantly more confident in its recognition of emotions compared with the TD group, but these groups did not differ in their overall accuracy on this task. The ADHD group was more confident in identifying angry and sad faces than the TD group. Furthermore, the ADHD group showed lower resolution than the TD children in their emotion recognition, indicating that the TD group was significantly better at discriminating correct from incorrect responses than the ADHD group. Resolution was not significantly correlated with the executive function measures (performance-based and ratings) or the intelligence composite raw score but was significantly correlated with lower ADHD and ODD symptom ratings in the past year.
Overall, our findings are similar to what has been reported in the PIB literature. We found that children with ADHD tend to be more confident in their self-evaluations than TD children (Evangelista et al., 2008; Gerdes et al., 2003; Hoza et al., 2004; Hoza et al., 1993; Jia et al., 2016; Owens & Hoza, 2003; Scholtens et al., 2012). The novel contribution of this study was to use a method from the metacognitive literature where children rate their confidence in relation to their performance on a specific task. The use of the relative accuracy or resolution indicator from this literature suggests that children with ADHD do not perceive the gap between their self-assessment of their performance and their actual performance. Notably, both the ADHD and TD groups did not differ in their overall accuracy, but rather in their evaluation or confidence in their accuracy. Specifically, the TD group was significantly better at discriminating correct from incorrect responses than the ADHD group. As such, confidence ratings were not as discriminative for the ADHD group compared with the TD group. This study was a first step in using methods from the metacognitive literature to better quantify how accurately children with ADHD track their knowledge and performance. Further extensions of this work will be useful to advance our understanding of metacognitive knowledge, monitoring, and control in children with ADHD.
An additional finding on the ERT was that the ADHD and TD groups were similarly confident in their recognition of “neutral,” “happy,” and “afraid” facial emotions. However, children with ADHD were significantly more confident with their recognition of anger and sadness. We posit that heightened confidence of negative emotions, such as anger and sadness, in children with ADHD in the present study may be explained in several ways. First, past research suggests that one’s ability to recognize emotions may be due in part to exposure to that emotion (McAlpine et al., 1992) and children with externalizing disorders such as ADHD and ODD may experience more disapproval and negative facial expressions. This exposure may then prime these children to attend to these pieces of social information, especially when emotionally aroused (De Castro, Veerman, Koops, Bosch, & Monshouwer, 2002). Other research has shown that children with ADHD were less accurate in their recognition of emotions compared with TD children and that children with disruptive behavior tended to misinterpret negative emotions as anger (Cadesky et al., 2000). If children with disruptive behavior are sensitive to detecting negative emotions, it would follow that they would be more confident in identifying actual instances, but they may also overinterpret situations and incorrectly detect negative affect in other situations. High confidence in anger or sadness cues, for example, may more likely lead the child to search for confirmatory rather than alternative evidence to disconfirm this belief. Given that the majority of the ADHD group in the present study were recruited from a clinic for children referred because of disruptive behavior, and more than half met criteria for a disruptive behavior disorder, it is possible that comorbidity in our sample influenced the findings; however, our findings remained significant after statistically controlling for ODD and CD symptoms. Of note, due to the high confidence of recognition of anger and sadness emotions by the ADHD group, relative to the TD children, it cannot be determined whether overall higher confidence by the ADHD group is driven by high confidence in these two salient emotional categories. Distilling this finding will be important for future studies.
It should be noted that the ADHD group was not less accurate in recognizing any of the facial emotions studied. This finding differs from other research showing that children with ADHD are less accurate in their recognition of facial emotions than TD children (Cadesky et al., 2000; Shapiro, Hughes, August, & Bloomquist, 1993). We speculate that findings from this study differ from those found previously; the range of emotions on the faces may not have been difficult enough or not complex enough to elicit differences in accuracy. The items were intentionally selected to be easier so that we could focus on variability in confidence ratings rather than on accuracy between groups in this study. As such, these findings for accuracy are preliminary; future studies that use experimental methods and include items that are more difficult are important to build on findings from the present study. Second, the sample size provided sufficient power to test the hypotheses set out; however, the sample size did not permit more elaborate analyses or comparisons of within group differences. As there was a high number of children with comorbid behavior difficulties, all analyses statistically controlled for ODD and CD symptoms; however, despite this control, it cannot be established whether differences in accuracy and confidence between the ADHD and TD groups are exclusively due to ADHD. Furthermore, children with ADHD also experience high rates of internalizing symptoms (Bloemsma et al., 2013). Although beyond the scope of this study, future research may define groups of children with or without internalizing symptoms, conduct problems, or other common comorbidities to determine differences in social cognition. In addition, examining associations between our metacognitive methods with indicators of actual social functioning will also be useful in future research.
Furthermore, results of the present study build on research from related areas of social- cognition that show that children with ADHD may have difficulties with self-awareness and reflection (Barkley, 1996) or the perception that one is doing better than other rater reports (Evangelista et al., 2008; Gerdes et al., 2003; Hoza et al., 2004; Owens & Hoza, 2003; Scholtens et al., 2012). Confidence ratings may be considered a potential index to assess self-awareness. In traditional models of ADHD (Barkley, 1996; Hervey et al., 2004), self-awareness has been proposed to be related to executive functions. We included both performance-based and rating measures of executive function, and we found that resolution was not significantly associated with either performance-based or ratings of executive function. Similarly, better resolution was also not associated with higher intelligence. Resolution was significantly associated with ADHD and ODD symptoms, which is consistent with other studies that have shown poor calibration in social and academic domains (Fefer et al., 2018).
Clinical Implications
Why measure confidence ratings and use indicators like resolution? Accuracy of performance has been the predominant indicator of competence on tasks such as emotion recognition in ADHD (Collin et al., 2013; Da et al., 2009; Ibáñez et al., 2011; Kats-Gold et al., 2007; Markovska-Simoska & Pop-Jordanova, 2010; Sjowall et al., 2013; Tye et al., 2013). It is the findings with the resolution index that illustrate why confidence ratings matter. If confidence is not aligned more strongly with correct than incorrect choices, this may reflect poor tracking of knowledge in the world. Our results suggest that children with ADHD have difficulty in tracking their accuracy in recognizing emotions depicted on faces. To our knowledge, this is the first study to demonstrate how confidence ratings in relation to task performance may importantly contribute to the clinical presentation of ADHD.
Cognitive-behavioral approaches to the treatment of ADHD have involved self-reinforcement, problem solving, self-instruction, and self-redirection to cope with errors (Toplak, Connors, Shuster, Knezevic, & Parks, 2008). Helping children to self-reflect on the accuracy and judgments of their performance in social situations may provide an avenue to improve children’s decision making and social competence (Baron & Brown, 1991; Weller, Levin, Rose, & Bossard, 2012). For instance, strategies that encourage the consideration of alternate decisions (Larrick, 2004), problem solving (Webster-Stratton, Reid, & Beauchaine, 2011), or requiring that the child justify his or her decision to another or to take an alternate perspective (Lerner & Tetlock, 1999; Lochman & Wells, 2004) may reduce overconfidence in unhelpful strategies. Building explicit coaching into social behavioral programs to include consideration of indicators of performance calibration, such as confidence ratings, may be another useful treatment component to enhance social functioning of children with ADHD.
Footnotes
Declaration of Conflicting Interests
The author(s) declared no potential conflicts of interest with respect to the research, authorship, and/or publication of this article.
Funding
The author(s) disclosed receipt of the following financial support for the research, authorship, and/or publication of this article: This research was supported by a grant from the Social Sciences and Humanities Council to M. Toplak.