
Abstract
Keywords
Introduction
ADHD is one of the most common neurobehavioral disorders in children and is often characterized by pervasive, persistent, and debilitating problems in attention, hyperactivity, and impulsivity (American Psychiatric Association [APA], 2013). Prevalence of ADHD in children and adolescents was reported to be 5.9% to 7.1% (Willcutt, 2012). In India, the prevalence of ADHD was 11.32% among primary school children and the prevalence was highest among 9 to 10 years age group (Venkata & Panicker, 2013).
ADHD is associated with poor academic performance and associated symptoms such as low self-esteem, aggressiveness, emotional immaturity, and so on play a major role in how the child and the family adapts to ADHD in their daily life. Thus, there is a great impact on the quality of life of a person with ADHD (Danckaerts, Sonuga-Barke, & Banaschewski, 2010). Studies have concluded that the presence of a child with ADHD results in increased likelihood of disturbances in a family particularly when ADHD is co-morbid with conduct problems (Johnston & Mash, 2001). Hence, the early identification and intervention of this condition is important as it not only helps the children to do better in academics, but also helps in prevention of co-morbid conditions (Witcher et al., 2003). Stimulants (amphetamine, methylphenidate) and nonstimulant (atomoxetine) drugs are used in the treatment of ADHD, often along with intervention such as parent/teacher administered behavior therapy (American Academy of Pediatrics, 2011; Biederman & Spencer, 2008; Greenhill, Pliszka, & Dulcan, 2002).
The diagnosis of ADHD clinically depends upon the assessment of behavioral patterns and characteristics, using different questionnaires and information gathered from close observers of the child’s behavior. There are no biological markers for ADHD and efforts are being made to find one. Several studies have suggested that electroencephalography (EEG) can aid in the diagnosis of ADHD with sensitivity ranging from 86% to 97% and specificity ranging from 84% to 98% (Loo & Barkley, 2005; Monastra, Lubar, & Linden, 2001); in some countries, EEG is used as diagnostic tool for ADHD (Lenartowicz & Loo, 2014).
A biomarker that can aid in the diagnosis of ADHD as well as predict the response to treatment would be of great use in selecting the appropriate pharmacotherapy. Quantitative EEG (QEEG) has been proposed to be useful in evaluation of ADHD (Nuwer, Buchhalter, & Shepard, 2016) and has often been recommended to aid in its diagnosis as well as in prediction of response to treatment in recent times (Clarke et al., 2003). However, the fact that the theta/beta ratio (TBR) test (which is considered in QEEG) should be used cautiously as mandated by Food and Drug Administration (FDA) and the recommendations by the American Academy of Neurology (AAN) probably limits the extensive use of QEEG in routine practice (Nuwer et al., 2016). Nevertheless, the use of QEEG has been able to throw some light in predicting response to drugs used for the treatment of ADHD. EEG and QEEG were used to demonstrate that these can predict response to stimulant medications: those with excess slow wave activity and large amplitude evoked potentials were most likely to respond to stimulant medication (Satterfield, Cantwell, Saul, Lesser, & Podosin, 1973), those with increased theta and increased theta/beta (θ/β) ratios had better outcomes with stimulants (Clarke, Barry, McCarthy, & Selikowitz, 2002; Suffin & Emory, 1995), and also that an excess beta group responded well to such medicines (Chabot, di Michele, Prichep, & John, 2001; Clarke et al., 2002; Hermens et al., 2005). In a recent study, investigators concluded that electrophysiological parameters can predict the response to stimulants in ADHD and that the responders were associated with prefrontal lobe hypoactivation (Ogrim et al., 2014).
Although studies pertaining to the use of stimulants and exploring the response to treatment using EEG are there (Chabot et al., 2001; Clarke et al., 2002; Ogrim et al., 2014; Suffin & Emory, 1995), the role of EEG in predicting response to treatment with atomoxetine, a nonstimulant, has been less explored. A study examined the QEEG differences between the ADHD patients who were responders and nonresponders to long-term treatment with atomoxetine at baseline and after 6 and 12 months of treatment. There was increased absolute power in alpha and delta in frontal and temporal regions and absolute power values moved toward normal values in the responders. On the contrary, the nonresponders showed increased absolute power in all frequency bands and the absolute power values remained at baseline values after the treatment (Chiarenza et al., 2016).
Cordance is a measure of regional brain activity using EEG, which is useful in knowing about the activity of monoamine reuptake inhibitor as well as mixed reuptake inhibitor such as venlafaxine (Leuchter et al., 2008). In a study involving young adults (18-30 years) with ADHD, it was seen that left temporoparietal cordance in the theta frequency band after 1 week of treatment with atomoxetine was associated with improvement in ADHD symptoms (Leuchter, McGough, Korb, & Hunter, 2014). Thus, it will be worthwhile to see whether atomoxetine (a monoamine reuptake inhibitor) is able to bring about similar changes, particularly in children with ADHD, after just 1 week of treatment so that one can predict response to the drug as early as 1 week using QEEG, considering the fact that atomoxetine takes some time to act; the median time to improvement was about 3.7 weeks (Witcher et al., 2003). As stimulants may not bring about the desired responses in many of the children with ADHD (Barry et al., 2009), so the use of atomoxetine as an alternate agent is promising; in certain instances, it can even be the drug of first choice (Childress, 2015). Even better would be to predict the response of atomoxetine in children with ADHD using noninvasive technique such as EEG as early as possible, something which has not been addressed by the earlier studies (Barry et al., 2009; Chiarenza et al., 2016).
Materials and Methods
The study was conducted by recruiting consecutive patients of ADHD diagnosed as per the Diagnostic and Statistical Manual of Mental Disorders (5th ed.; DSM-5; APA, 2013) who attended the Child Guidance Clinic (CGC) of the Department of Psychiatry, Government Medical College & Hospital (GMCH), Chandigarh, from April 2016 to April 2017.
CGC in GMCH was started in 1998 and caters to the service needs of not only the people of Chandigarh, but also the adjoining areas of the state of Punjab, Haryana, Himachal Pradesh, Uttarakhand, and western parts of Uttar Pradesh. Total patients attending this clinic in 2017 were 1,790, of which 530 were new cases. This clinic runs once a week on every Thursday (2:00-5:00 p.m.). It is headed by a consultant psychiatrist and other staff includes psychiatrist, clinical psychologists, psychiatric social workers, and trainees of MD psychiatry (posted on rotation basis).
At the first contact, a psychiatrist (Senior Resident) attends to the cases, makes a provisional diagnosis, and gives appointment for a detailed assessment (within 7 days). In the second visit, the case is enrolled in CGC and given a CGC number. Then the case history is discussed in detail by the CGC team headed by the consultant-in-charge, wherein final diagnosis and management plan is made. Plan is also made for some of the cases that require further assessment. After this, the case is followed up keeping the patient and caregiver’s needs and convenience at the forefront.
Inclusion Criteria
Drug naïve children with ADHD, between 6 and 14 years of age, were included in the study after acquiring assent as well as written consent from their guardian/parents.
Exclusion Criteria
Children with ADHD who were on medicines that may affect EEG changes; who had history of physical illness such heart disease, seizures, febrile convulsions, and so on; and who had any co-morbid mental illness such as bipolar affective disorder, psychosis, pervasive developmental disorder, oppositional defiant disorder, conduct disorder, substance abuse, anxiety, mental retardation or tic disorder, and any organic condition were excluded from the study.
Study Design
It was a prospective study with an intent to treat and assess the early response of atomoxetine in children with ADHD through EEG changes. Fifty consecutive children attending the CGC and fulfilling the selection criteria were inducted in the study.
Patients’ sociodemographic and clinical details were recorded on the Sociodemographic Performa routinely used for children in the Department of Psychiatry and the Clinical Performa designed for the study, respectively. Children were assessed on four separate occasions, that is, on baseline, 1st week, 4th week, and at the end of 6th week.
EEG was conducted by the primary researcher who got adequate training for 3 months under a neurologist in the Department of Medicine of the same institute. The International 10–20 System of electrode placement was used for measuring spontaneous EEG (details given under “EEG Data Acquisition” section). EEG data were recorded for 5 min with eyes open and for 5 min with eyes closed. Three minutes of EEG data without artifacts was taken each from eyes-open and eyes-closed recordings. EEG was done before starting medication (baseline) and then after 1 week of atomoxetine treatment and the data were recorded.
Treatment with atomoxetine was started in the dose of 10 mg/day. Atomoxetine available in the hospital supply as 10 mg capsule was used for the treatment. It was given once daily in the morning after breakfast. Thereafter, on 7th day, EEG was recorded in the morning after 2 hr of taking the last dose of atomoxetine. Whenever the dose of atomoxetine was increased based on clinician’s assessment later on (i.e., after 7 days), it was documented.
Pre and posttreatment EEG changes were compared. These EEG changes were correlated with treatment response of the patients with ADHD at 6 weeks. Forty percent reduction in symptoms on Vanderbilt ADHD Parent Rating Scale (VADPRS; Wolraich et al., 2004) or Vanderbilt ADHD Teachers Rating Scale (VADTRS; Wolraich, Feurer, Hannah, Baumgaertel, & Pinnock, 1998) was considered as response.
EEG Data Acquisition
EEG was recorded by placing 19 electrodes manually, using a 36-channel enhanced version of the International 10–20 Electrode Placement System and referenced to linked earlobes. All electrode impedances were maintained below 5 KU to acquire the best possible data. The EEG amplifiers had a bandpass from 0.5 to 70 Hz (3 dB points). Data were sampled at a rate of 256 Hz with 12-bit resolution. To avoid drowsiness during EEG recordings, instructions were given to the children to remain awake and similar conditions were maintained throughout the different sessions.
The patient’s parents were briefed about the procedure of study. They were told about the investigations and treatment part. Children of those who were willing for the participation of their wards in the study and gave written consent were inducted in the study. They were also told about the duration of the study. Assent was taken from these children. They had complete independence to withdraw from the study. Of the 63 patients inducted, 13 dropped out after baseline assessment, and 50 patients completed the total study duration including the 6 weeks follow-up period (Figure 1).

Flowchart depicting intake of patients and their status during the study.
Tools
“Sociodemographic profile”—to note details of patients and immediate family members such as age, gender, highest level of educational qualification, and so on.
Clinical Performa—for recording data such as weight, complete hemogram, serum electrolytes, liver function tests and kidney function tests, and so on.
“Adverse effects checklist”—for recording the adverse effects due to atomoxetine at 7th day, 4th week, and 6th week.
VADTRS—to rate the severity of problem behavior of children with ADHD in the school setting by teachers.
VADPRS—to rate the severity of problem behavior of children with ADHD by parents.
Assessment
The baseline assessment was carried out by applying VADPRS and VADTRS for severity of symptoms. Follow-up assessment was carried out at the end of 7th day, 4th week and 6th week using the same tools. The children were also assessed for the presence of any adverse effect by using the adverse effect checklist at 7th day, 4th week and 6th week.
Statistical Analysis
The statistical analysis included ANOVA for quantitative data and chi-square test for qualitative data. Paired-sample t test was applied to compare individual assessments. Pearson correlation was applied to compare the different frequencies of EEG. Wilcoxon signed rank test was applied after appropriate transformation for the heterogeneous data. The data were analyzed by using SPSS version 17.0. This was represented in mean, percentage, and standard deviation. Significance level was p < .05. For the analysis of EEG data, Student’s t test and two-way mixed ANOVA were applied. ANCOVA was applied to find the effect of medicine on different features extracted from EEG signals across different brain regions.
Ethical Considerations
The purpose and the design of the study were explained to the children and their parents. They were told about pre-treatment and post-treatment EEG. They were told that the cost incurred on the treatment was to be borne by the institution. The children and their parents had every right to withdraw any time from the study without giving any reason. However, the children would continue to receive appropriate treatment even after they had withdrawn from the study. The confidentiality of the information obtained would be maintained and revealed only to the invigilator and supervisors of this study. The study complied with the principles enunciated in the Declaration of Helsinki (World Medical Association, 2013) and Indian Council of Medical Research (2006). Institutional Ethical Clearance was obtained for the study and Clinical Trial Registry–India number for the study is CTRI/2017/02/007888.
Results and Observations
A total of 63 consecutive patients of ADHD who met inclusion and exclusion criteria were recruited for the study. Out of these, 13 patients dropped out of the study due to various reasons (parents refused, child refused, intolerable side effects, etc.; Figure 1) after baseline investigations and EEG. Most of the children with ADHD who dropped out from the study were from middle socioeconomic status (84.61%). Apart from this, there was no significant difference among those who completed the study and those who dropped out with respect to age, gender, birth order, and area of residence. No statistically significant difference was found on the composite scores on VADPRS and VADTRS between the two groups at baseline.
The maximum dose of atomoxetine administered was 20 mg/day. At 4 weeks of study, 30 patients were on 15 mg/day of medication. At 6 weeks of study, five patients were on 15 mg/day and 25 patients were on 20 mg/day of medication.
Fifty children with ADHD completed the study duration of 6 weeks. At therapeutic dose (1.6 mg/kg/day), for 6-week duration, four patients (8%) did not show any response, and 18 patients (36%) did not achieve 40% symptom reduction on VADPRS scores.
Total of nine patients (18%) had side effects of atomoxetine during the first week of medication. Most common side effect was abdominal discomfort and nausea (8% each), followed by loss of appetite (4%) and somnolence (2%).
While comparing the sociodemographic profile of responders (the patients who had shown significant improvement, that is, more than 40% of reduction in symptoms in VADPRS score) and nonresponders (the patients who had not achieved 40% reduction in symptoms in VADPRS scores) group, it was seen that the responders were younger in age compared with the nonresponders and female patients responded better than male patients. There was no significant difference in the socioeconomic and residential status between the two groups (Table 1).
Comparison of Responders and Nonresponders on Sociodemographic Profile.

Note. SES = socioeconomic status; MSES = middle socioeconomic status; LSES = low socioeconomic status.
p < .05. **p < .01. ***p < .001.
There was no significant difference in the baseline clinical profile of the patients who had responded to medication as compared with nonresponders. There was nonsignificant change in weight from baseline to 6 weeks in both the groups (data not shown).
There was significant improvement in the symptoms of the patients belonging to responder group as compared with nonresponder group on the VADPRS and VADTRS composite score. Responders group had more significant improvement in symptoms reduction on VADTRS composite scores as compared with VADPRS composite scores (Table 2).
Comparison of Responders and Nonresponders on VADPRS and VADTRS Composite Score.
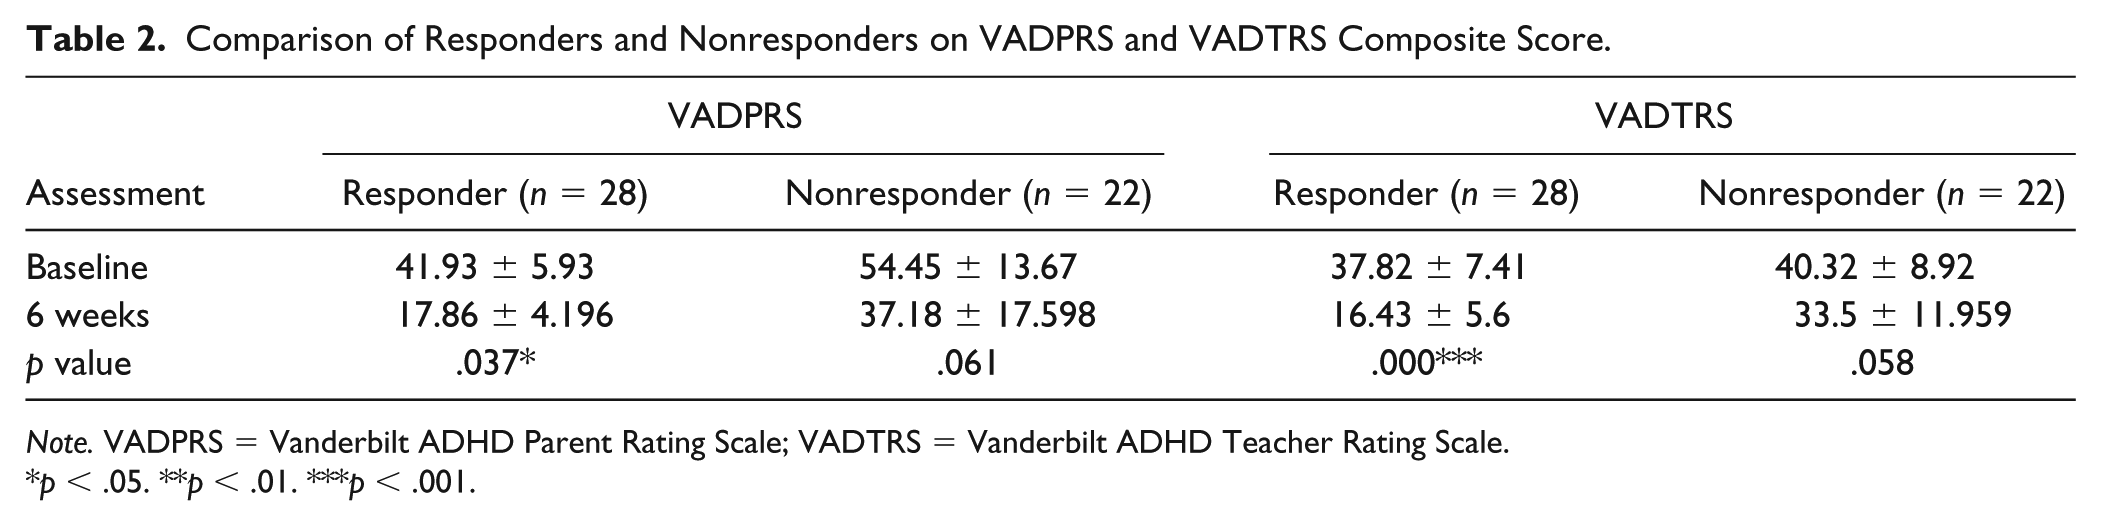
Note. VADPRS = Vanderbilt ADHD Parent Rating Scale; VADTRS = Vanderbilt ADHD Teacher Rating Scale.
p < .05. **p < .01. ***p < .001.
EEG Analysis
The raw EEG data were visually edited by the investigator to identify and eliminate biological (e.g., muscle movement) and nonbiological (e.g., any noise in the room) artifacts. The filtered data were augmented by a computerized artifact detection algorithm. EEG data of total of 8 min, that is, 4 min each of eyes closed and eyes-open (eyes open = 4 min, eyes closed = 4 min), in excel sheet format were imported in the MATLAB array format in MATLAB R2012b platform. EEG data (.mat files) of each patient were then imported in EEGLab toolbox v 13.1.1 of MATLAB to apply artifact removal (standard thresholding) techniques to get noise-free signals. Clean EEG data were bandpass filtered between 0.5 Hz and 50 Hz using digital Butterworth IIR filter of order 4 to remove high frequency noise. The epochs left after artifact rejection in each case under eyes-open and eyes-closed conditions were analyzed. Different spectrum and cordance features were calculated from EEG data such as absolute and relative power in four frequency bands—mainly delta (0.5-4 Hz), theta (4-8 Hz), alpha (8-13 Hz), and beta (13-20 Hz), respectively.
The absolute power indicates the energy intensity in a selected single frequency band (primary frequency domain). The relative power is representative of the energy in a selected single frequency band relative to all the frequency bands (secondary frequency domain). The relative power represents a fraction or the percentage of power in the selected single frequency band relative to the absolute power in all frequency bands.
Cordance is a measure of regional brain activity using EEG, which combines complementary information from absolute (the amount of power in a frequency band at a given electrode) and relative power (the percentage of power contained in a frequency band relative to the total spectrum) of EEG spectra. Cordance values were calculated for delta, theta, alpha, and beta band power. Discrete wavelet transform with mother wavelet “db8” is applied to decompose signal up to six levels and then power spectral density in frequency range of interest is obtained using Fast Fourier Transform. Extracted features from 16 channels are grouped according to four regions—left anterior (FP1-F3, F3-C3, FP1-F7, F7-T3), right anterior (FP2-F4, F4-C4, FP2-F8, F8-T4), left posterior (C3-P3, P3-O1, T3-T5, T5-O1), and right posterior (C4-P4, P4-O2, T4-T6, T6-O2).
The Student’s t test was employed to check for null hypothesis that there was no significant change in different signal features of ADHD children after medicine in each condition (eyes open/eyes closed) and in each region (left anterior, left posterior, right anterior, and right posterior) at 5% significance level. The null hypothesis was rejected for theta cordance values in left posterior region under both conditions (h = 1, p < .05). In addition, there was also a significant difference between theta cordance values before and after medicine in right anterior region under eyes-closed condition (h = 1, p = .01). No significant difference is found for absolute and relative power features (h = 0, p > .05).
Regression analyses on each clinical variable of interest were run using each electrode, for each power and cordance measure (baseline, 1 week, and change), and in each of four frequency bands (delta, theta, alpha, beta). Absolute power, relative power, and cordance values for baseline, 1 week, and change from baseline to 1 week were assessed independently for association with clinical outcome (reduction in VADPRS scores). Because of the large number of statistical comparisons while analyzing data from individual electrodes, we combined electrodes to form regions of interest (ROI).
A two-way mixed ANOVA with repeated measures was conducted to investigate the impact of group and rest condition on absolute delta power, absolute theta power, absolute alpha power, absolute beta power, relative delta power, relative theta power, relative alpha power, and relative beta power. There was not a significant main effect of group on absolute delta, theta, alpha, and beta power. Also there was no significant effect of group on relative delta, theta, alpha, and beta power. While analyzing cordance powers, there was no significant effect of group on delta, alpha, and beta cordance in any specific region.
There was a significant main effect of group on theta cordance in left posterior region when we analyzed all the patients at baseline and at 1 week after giving medication (Table 3). However, there was not a significant effect of condition on theta cordance in left anterior region. So, we identified one ROI for cordance at Week 1 in the theta band, which comprised of four left temporoparietal electrodes (Cp3, Tp7, P3, and T5; Figure 2).
Comparison of Responders and Nonresponders With Cordance Theta Values Before and After Medication at Left Posterior Region.
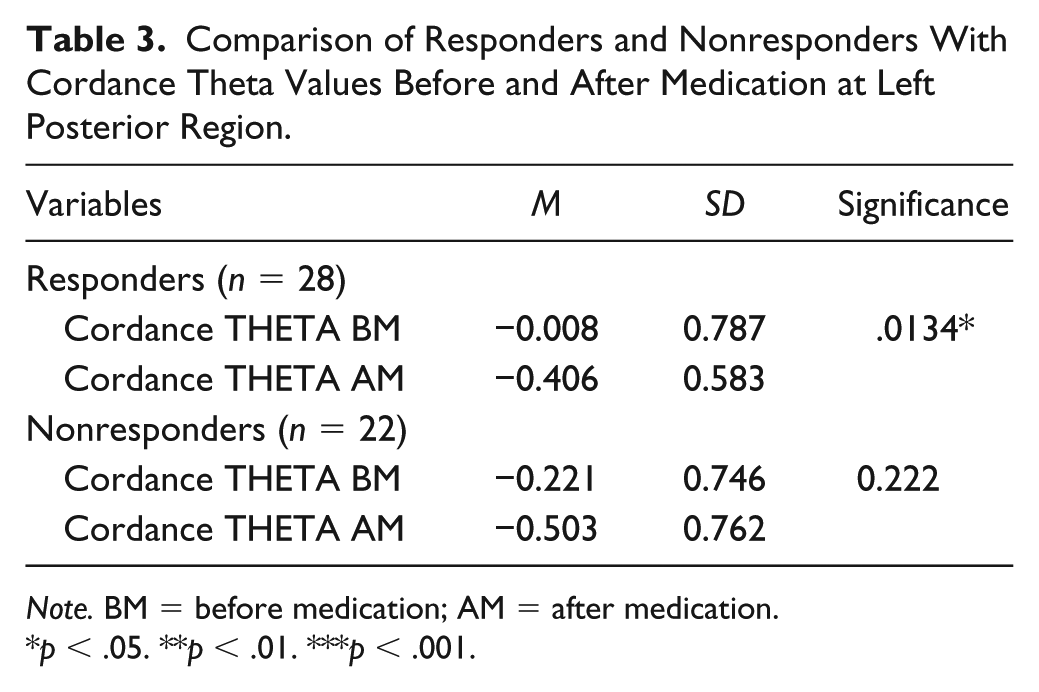
Note. BM = before medication; AM = after medication.
p < .05. **p < .01. ***p < .001.
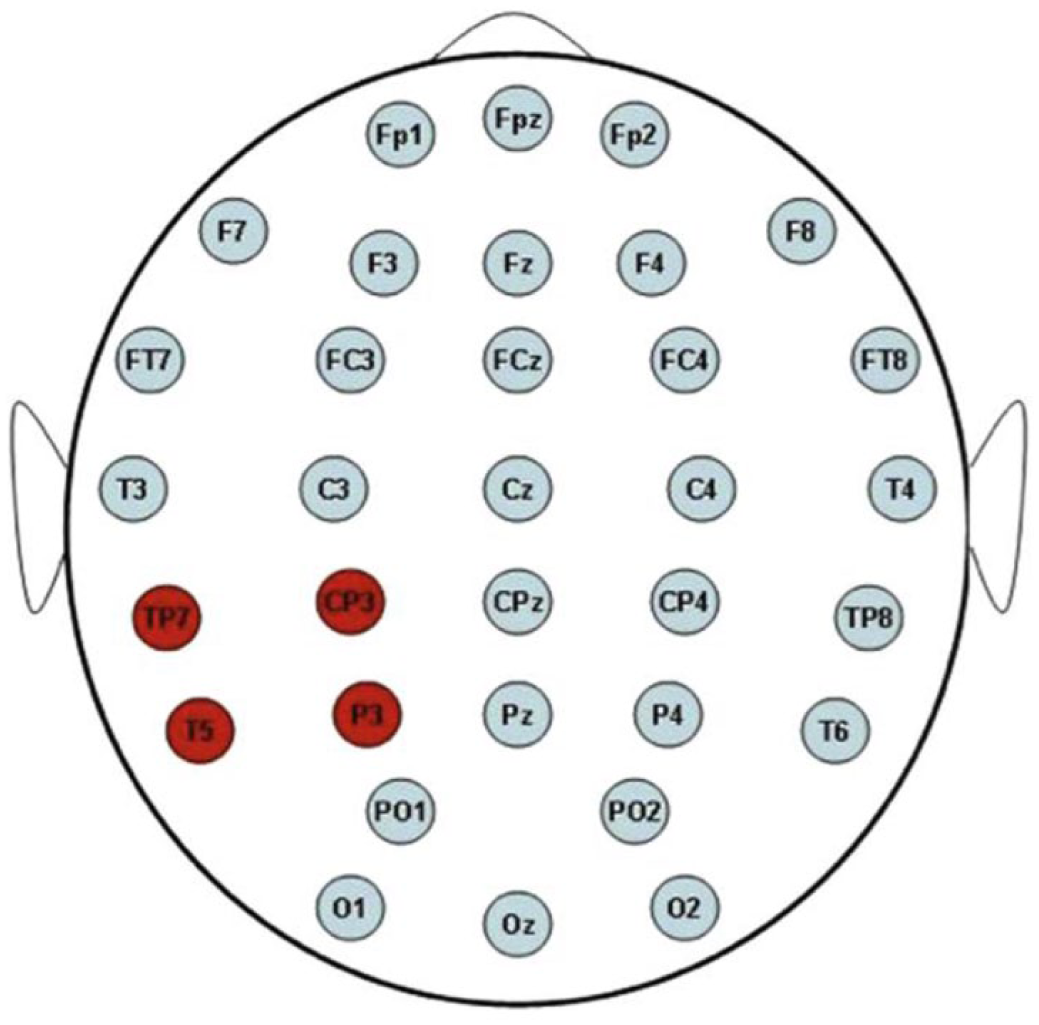
Electrode map showing ROI.
Although there was a significant main effect of group on theta cordance in right anterior and posterior region, none was seen on interaction between before and after medication. There was a significant effect of condition on theta cordance in left posterior region before and after medication .
While comparing the differences between the cordance theta values of responders and nonresponders, there was significant difference of change in the responders group. There was significant decrease in the theta cordance values after 1 week of medication under eyes-closed condition in the responders group (Table 4).
Differences Between Theta Cordance Values in Responders and Nonresponders.

Note. BM = before medication; AM = after medication.
p < .05. **p < .01. ***p < .001.
Discussion
The current study was carried out to predict the early response to atomoxetine using EEG in children with ADHD.
A total of 50 children with ADHD completed 6-week duration of the study. On the basis of response to atomoxetine, 28 cases (56%) were classified as “responders” and 22 cases (44%) that showed a partial remission of ADHD symptoms or no response were designated as “nonresponders.” These results are in agreement with a previous study (Kelsey et al., 2004) reporting that the effect size for atomoxetine treatment in ADHD patients ranges from 0.63 to 0.71 and the response to atomoxetine treatment ranges from 59.5% to 69% while remission ranges from 27% to 28.6%.
In the present study, although there was not much difference between the responders and nonresponders in the sociodemographic variables such as place of residence, socioeconomic status, and birth order, it was seen that responders were relatively younger than the nonresponders and somehow the females responded better to atomoxetine in comparison with males. This serendipitous finding is somehow difficult to explain at this stage and may require exploration with a bigger sample size and long period of intervention. The current study used atomoxetine in the dose range which was already used in a previous study in the same facility (Garg, Arun, & Chavan, 2014). Also as both the responders and nonresponders did not have significant differences in their clinical profile (including weight),hence the possibility of the older and thus heavier children being underdosed does not appear to be there in the current study. However, contrary finding with respect to age has been reported in a study, although the authors have mentioned that the smaller number of cases could have resulted in imprecise measurement (Savill et al., 2015). Some studies do report that response to atomoxetine is similar in boys and girls, although, in a meta-analysis involving nine randomized placebo-controlled trials, there was less reductions in symptoms of ADHD in males (Savill et al., 2015), a finding akin to our study.
In the present study, there was improvement in the symptoms of ADHD in the responders group after 1 week of treatment. This finding is similar to other studies that initially symptoms may decrease at 1 week of initiation of atomoxetine, although there was no further change in core ADHD symptoms in 4 to 6 weeks (John & Prichep, 2006). Nine patients (18%) had side effects of atomoxetine during the first week of medication. Most common side effects were abdominal discomfort and nausea, followed by loss of appetite and somnolence. This was comparable with a study (Chiarenza et al., 2016) where patients aged 6 to 16 years were prescribed atomoxetine at a dosage of 1.2 mg/kg/day and 8% patients had side effects—most commonly headache, abdominal discomfort, and loss of appetite. In the current study, the patients reporting side effects were closely monitored and all were continued on same medication but the dosages were divided into morning and evening dose.
In the present study, at 6 weeks, there was significant improvement in the symptoms of the patients belonging to the responder group compared with nonresponder group on the VADPRS and VADTRS composite score. Responder group had more significant improvement in symptom reduction on VADTRS composite scores as compared with VADPRS composite scores. In a study on drug therapy of ADHD children (Garg & Arun, 2013), it was observed that the benefit was achieved within 2 to 8 weeks of initiation of atomoxetine. The dosage was used according to the weight of the patient and the maximum dose used was up to 1.4 mg/kg/day.
The present study found that theta cordance from the left temporoparietal region after 1 week of treatment with atomoxetine was significantly associated with 6-week change in ADHD symptoms. The patients treated with atomoxetine who had lower theta cordance values at Week 1 as compared with baseline showed significantly greater improvements in ADHD symptoms overall, as well as decrease in hyperactivity, impulsivity, and inattention symptoms scores on VADPRS and VADTRS, than those with higher theta cordance values. Similar finding of left temporoparietal cordance in theta frequency and its association with improvement in ADHD symptoms following 1 week of atomoxetine therapy has also been reported by a double-blind placebo-controlled study (Leuchter et al., 2014). However, unlike our study, this study involved patients who were aged 18 to 30 years.
Atomoxetine responders showed significantly lower levels of temporoparietal theta cordance at Week 1 as compared with baseline than atomoxetine nonresponders. We found that early changes in theta cordance values in left posterior region at 1 week were having direct correlation with improvement in ADHD symptoms at 6 weeks. Absolute power, relative power, and cordance values at baseline, and change from baseline to Week 1, were not associated with 6-week outcome. Although this study does demonstrate the early change in the theta cordance values in left posterior region at 1 week of treatment with atomoxetine, as the dose used was as per the study protocol, one is not able to comment whether higher doses of atomoxetine could have resulted in such changes at the end of 1 week. This issue can be explored in future studies. Moreover, with an intention to treat, doses were increased only after 1 week; for initial 1 week, all children received the same dose and we only wanted to see whether final response can be predicted based on the EEG changes at 1 week.
Clarke et al. (2002) showed that in ADHD and attention-deficit disorder (ADD), good responders to stimulant medication were characterized by increased theta and increased TBRs. The results of the present study were similar to this study. Suffin and Emory (1995) conducted a prospective, randomized, multiple blinded, controlled pilot study to test clinical efficacy of the QEEG model, and found that pre-treatment QEEG data predicted medication response with high accuracy in treatment-resistant child and adolescent depression. In our sample, responders to atomoxetine had baseline QEEG theta excess localized to temporoparietal regions and these abnormal findings decreased after 1 week of treatment. Nonresponders showed no change in QEEG abnormalities after 1 week of medication.
In a study by Chiarenza et al. (2016), QEEG differences were examined between the ADHD patients who were responders and nonresponders to long-term treatment with atomoxetine at baseline and after 6 and 12 months of treatment. QEEG and Swanson, Nolan, and Pelham–IV Questionnaire (SNAP-IV) scores (to classify responders, nonresponders, and partial responders) were recorded at baseline and after treatment. The responders showed increased absolute power in alpha and delta in frontal and temporal regions, whereas nonresponders showed increased absolute power in all frequency bands. The absolute power values moved toward normal values but the nonresponders remained at baseline values after the treatment. This was different from our study, as, in our study, EEG was compared at baseline and 1 week after treatment and results have shown change in theta cordance in the responders. There was no significant effect on absolute theta, beta, alpha, and delta powers at the end of 1 week in comparison with baseline.
EEG can also serve as a putative neurophysiological predictor in the outcome of ADHD. At 1 week, there was no clinical improvement in the patients but changes were found in the EEG at 1 week after medication, which can aid us in predicting the response to atomoxetine by correlating with the decrease in theta cordance values. The theta cordance measurements and their change may be useful for differentiation between participants who will and those who will not have a satisfactory clinical response to atomoxetine. So we can change the medication in case it is found that atomoxetine is not going to be useful. This is of great significance as we need not wait for the duration of 1 month of treatment with atomoxetine to conclude whether this drug will work or otherwise.
This study which was conducted using robust methodology has some limitations like, for example, having a relatively small sample size and short duration of follow-up. This study also did not have a placebo-controlled group. However, it will be worthwhile to add here that from ethical point of view, it may not have been possible to keep a child with moderate to severe dysfunction off medications and so using a placebo-controlled cohort may have been quite challenging. A way to negate this issue, at least partly, could have been the use of a comparator group, which can be contemplated in future similar studies. Another limitation was that the study investigators were nonblinded. However, due to the fact that scales such as VADTRS (rated by teachers) and VADPRS (rated by parents) were used in the study, the chances of bias on the part of the investigators get curtailed to a large extent. Despite these shortcomings, the study throws open new vista for further exploration on the use of noninvasive neurophysiological markers in the treatment outcome of ADHD. To conclude, the fact that by measuring theta cordance in left posterior region after 1 week of atomoxetine administration, clinical response and treatment outcome can be predicted is a promising finding and has ramification while planning the treatment strategy in ADHD.
Footnotes
Acknowledgements
The authors are grateful to the patients and family members who participated in the study.
Declaration of Conflicting Interests
The author(s) declared no potential conflicts of interest with respect to the research, authorship, and/or publication of this article.
Funding
The author(s) received no financial support for the research, authorship, and/or publication of this article.