
Abstract
Objective:
To investigate whether single nucleotide polymorphisms (SNPs) in the ADGRL3, DRD4, and SNAP25 genes are associated with and predict ADHD severity in families from a Caribbean community.
Method:
ADHD severity was derived using latent class cluster analysis of DSM-IV symptomatology. Family-based association tests were conducted to detect associations between SNPs and ADHD severity latent phenotypes. Machine learning algorithms were used to build predictive models of ADHD severity based on demographic and genetic data.
Results:
Individuals with ADHD exhibited two seemingly independent latent class severity configurations. SNPs harbored in DRD4, SNAP25, and ADGRL3 showed evidence of linkage and association to symptoms severity and a potential pleiotropic effect on distinct domains of ADHD severity. Predictive models discriminate severe from non-severe ADHD in specific symptom domains.
Conclusion:
This study supports the role of DRD4, SNAP25, and ADGRL3 genes in outlining ADHD severity, and a new prediction framework with potential clinical use.
Keywords
Introduction
ADHD is a neurodevelopmental disorder characterized by a complex pattern of persistent clinical symptoms of inattention, hyperactivity, and impulsivity, in association with the development of chronic functional impairment (Association, 2002a, 2002b, 2013). ADHD affects 8% to 18% of children and adolescents, and ~1% to 7% of adults worldwide (Cornejo et al., 2005; Faraone & Biederman, 2005; Pineda et al., 1999; Polanczyk et al., 2014), and persists into adulthood in 40% to 50% of cases (Thapar et al., 1999, 2016). ADHD is a major risk factor for the appearance of disruptive (externalizing) disorders, including conduct disorder (CD), oppositional defiant disorder (ODD), and substance use disorder (SUD) (Molina et al., 2007; Sibley et al., 2011). Children with ADHD have a higher predisposition to poor educational achievement, low-income, underemployment, legal problems, and impaired social relationships (Molina et al., 2007; Sibley et al., 2011).
A diagnosis of ADHD requires that a specific set of criteria outlined in the Diagnostic Statistical Manual for Mental Disorders (DSM) are met (Association, 2002a, 2002b, 2013). According to the number of symptoms exhibited by each subject in different environments, and in coherence with a detailed cognitive clinical evaluation and comparison between previous and current symptoms, each subject is assorted to ADHD subtypes (Acosta López et al., 2013; Acosta et al., 2011; Luo et al., 2019; Posner et al., 2020). These symptoms relate to the presence or absence of 18 items (operational criteria of the DSM), which are registered using a binary scale (0: absence; 1: presence), and grouped by domain (inattention symptoms: items 1–9; hyperactivity/impulsivity symptoms: items 10–18). These symptoms provide a differential categorical diagnosis into four subtypes: ADHD of predominantly inattentive type, ADHD of predominantly hyperactive/impulsive type, ADHD of combined type, and ADHD unaffected (Fernandez-Jaen et al., 2018; Schachar et al., 2000). However, this dichotomous classification approach to ADHD diagnosis (0: unaffected; 1: affected) excludes the existence of intermediate spectrum ADHD classes (Cuthbert & Insel, 2010; Insel, 2014; Larsson et al., 2012) and inexorably defines a minimum-required number of symptoms to classify individuals (Acosta et al., 2004, 2011; Arcos-Burgos & Muenke, 2004; Acosta et al., 2011; Cuthbert & Insel, 2010; Larsson et al., 2012; Lilienfeld & Treadway, 2016).
The use of machine learning (ML) algorithms and multivariate analyzes allows for the identification and classification of individuals with subtle differences in symptoms. This is achieved by constructing symptom profiles (i.e., indicators) to predict ADHD diagnosis and eventually resolve ADHD severity (Casey et al., 2014; Insel, 2014; Kautzky et al., 2020; Tenev et al., 2014; Yasumura et al., 2017). In addition, these ADHD severity indicators allow for the construction of more precise and intelligent diagnostic schemes to characterize individuals within extreme forms of the disorder, either moderate or severe, which confers higher power and resolution in identifying the causes underpinning ADHD (Tandon et al., 2016).
Recent ADHD studies suggest the presence of subtle but significantly independent subgroups within ADHD classical subtypes, mainly characterized by a differential severity of symptoms and the presence/absence of externalizing symptoms (i.e., CD and ODD) (Acosta et al., 2004; Andrews et al., 2009). This system leads to a complex diagnosis based on severity and persistence (Acosta et al., 2016; Jain et al., 2011). There is also evidence that ADHD severity is influenced to some degree by gender, psychiatric comorbidity, family environment, conduct symptoms, and poor anger management (Ramy et al., 2018). The identification of these intermediate and extremely hidden classes is important, as individuals with severe ADHD forms are associated with poor academic achievement, moderate to poor pharmacological treatment response (Kotte et al., 2013; Owens & Jackson, 2017), development of externalizing symptoms and comorbidities that persist across the life span (Korsgaard et al., 2016; Lee et al., 2020).
Longitudinal family- and twin-based genetic studies estimate ADHD heritability at ~75% (Curran et al., 2001; Faraone & Biederman, 2005), strongly linking genetic factors to the etiology of ADHD and its comorbidities (Acosta et al., 2004, 2006; Arcos-Burgos, Castellanos, Pineda, et al., 2004; Arcos-Burgos, Jain, et al., 2010; Jain et al., 2011; Puentes-Rozo et al., 2019). Genetic studies have identified genetic variation in DRD4, DRD5, DAT1, SNAP-25, FGF1, HTR1B, 5-HTTLPR, SLC6A3, TTC12, NCAM1, and ADGRL3 to be associated with ADHD and/or ADHD severity (Acosta et al., 2016, 2011; Arcos-Burgos, Jain, et al., 2010; Arcos-Burgos & Muenke, 2010; Bruxel et al., 2020; Faraone & Mick, 2010; Franke et al., 2010; Gizer et al., 2009; Jain et al., 2011; Kotte et al., 2013; Martinez et al., 2016; Mastronardi et al., 2016). We showed that variants in ADGRL3 (also known as LPHN3) interact with gene variants harbored at chromosome 11q (in a region spanning the NCAM1-TTC12-ANKK1-DRD2 genes) to dramatically increase ADHD risk and severity in young children (Acosta et al., 2016, 2011; Arcos-Burgos, Jain, et al., 2010; Bruxel et al., 2020; Jain et al., 2011). Most of these associations have been replicated in samples of Caucasian, Asian, and Latino descent, but remain to be tested in populations with a predominantly African ancestry.
In this report, we assess the genetics of ADHD severity using analytical methods of linkage and association on a cohort of 113 nuclear families ascertained from a Caribbean community (Cervantes-Henriquez et al., 2018; Pineda et al., 2016; Puentes-Rozo et al., 2019). This community has one of the largest African genetic components in the Caribbean, Central America and South America (Barragán-Duarte, 2007). We hypothesize that a new phenotypic construct of ADHD severity based on ML algorithms may reduce intrinsic biases associated with its clinical heterogeneity to enhance the performance of ADHD diagnostic tools. This approach has potential applications in precision and personalized medicine in understudied populations.
Patients and Methods
Patients
During the last 12 years, we prospectively recruited and clinically characterized 408 individuals (175 [43%] females and 233 [57%] males; 236 [58%] affected with ADHD) belonging to 120 nuclear families with at least one child affected with ADHD (proband) whose members were born in Barranquilla, Colombia, and its metropolitan area. Because of the African Diaspora across the Americas during the last five centuries, this community exhibits a strong genetic admixture among aboriginal Amerindian communities, Spaniards, and Africans (Barragán-Duarte, 2007; Puentes-Rozo et al., 2019). Admixed populations from South America and the Caribbean are often grouped into a single racial construct by the American census, which fails to grasp the distribution of genetic variation among these populations in health disparity studies (Tishkoff & Kidd, 2004). This is important as individuals of African ancestry suffer from a disproportionate burden of morbidity and disability associated with common chronic diseases (Ezzati et al., 2008).
The demographic, ascertainment, clinical, and genotyping data collection methods are reported elsewhere (Cervantes-Henriquez et al., 2018; Pineda et al., 2016; Puentes-Rozo et al., 2019). Briefly, 120 nuclear families comprising 408 individuals, ascertained from probands affected by ADHD, participated in our clinical and genetic studies of ADHD. Families of size three (n=74; 65.4%), four (n=33; 29.2%), five (n=4; 3.5%), and six (n=2; 1.8%) were present. Participant ages ranged between 6 and 60 years (average age=26.6±15.4 years), and 233 (57.1%) were affected with ADHD. A total of 246 (60.3%) were adults (aged 18 or older) of whom 97 (39%) were affected with ADHD (14.5% females) and 149 unaffected (35.7% females). In children and adolescents (ages 6–18, n = 162), 136 (84%) individuals were affected with ADHD (including 34 [25%] females) and 26 (16%) were unaffected (15 [57.6%] females). No children or adults were treated with medication for ADHD at initial assessment (Cervantes-Henriquez et al., 2018; Pineda et al., 2016; Puentes-Rozo et al., 2019). ADHD diagnosis was assessed in all individuals using the structured Diagnostic Interview for Children and Adults (DICA) version IV (Reich, 2000). The DICA-IV considers the A criterion of the DSM-IV and uses a systematic approach to collect clinical information about the ADHD symptoms exhibited by an individual, and uses a binary classification (0 = absent; 1 = present) and has been extensively used by our group and others in genetic studies of ADHD (Acosta et al., 2008, 2011; Arcos-Burgos, Castellanos, et al., 2004; Arcos-Burgos, Jain, et al., 2010; Palacio et al., 2004). Parents or guardians were administered the Spanish version of the DICA-IV interview for parents (DICA-IV-P). Parents and teachers of school-age children also provided behavior rating scales. Adult participants completed the modified DICA-IV-P disruptive behavior module to retrospectively collect information about the beginning, severity and duration of their current behaviors and conduct (Palacio et al., 2004).
In this study, we included 113 out of the 120 nuclear families from the original cohort; seven families were excluded because genotyping data were not available (Puentes-Rozo et al., 2019). The average family size was 3.4 ± 0.65 (74 trios, 33 families with four members, four families with five members, and two families with six members). Adult participants signed a written informed consent and individuals under 18 years of age were signed for by their parents or legal guardians. Ethics approval was obtained from the Ethics Committee of Universidad Simón Bolívar at Barranquilla, Colombia (approval # 00032, October 13, 2011).
Definition of Severity
Severity of symptoms was defined with unsupervised machine learning (ML) algorithms aimed at identifying latent subgroups of individuals with distinctive symptom profiles based on clinical data. Individuals were classified as “severe” or “not severe” based on the number of clinical symptoms that are likely to occur more often within specific clinical profiles (Acosta et al., 2011). ADHD symptom data was collected during the clinical assessment stage, where 11 schools were visited (seven of medium socio-economic stratum). Meetings were held with teachers of children aged between 6 and 11 years old to explain the objective of the study. Teachers were asked to identify children about whom they had concerns that might affect their academic performance and/or behavior in the school environment. Screening for ADHD symptoms was performed using the teachers’ version of a brief questionnaire (checklist) based on the DSM-IV A criterion questions. This questionnaire has previously been standardized for Colombian children and adolescents. Possible ADHD cases for further investigation were selected based on a standard score T = 50 ± 9. Thus, children who scored T ≥ 60 were suspected of having ADHD per Colombian norms.
Clinical profiles were derived with Latent Class Cluster Analysis (LCCA) (Vermunt & Magidson, 2002), as implemented in Latent GOLD 4.0 (Statistical Innovations, Belmont, MA, USA), using clinical symptoms as defined by the DSM-IV (DSM-IV, 2002) diagnostic criteria and the DICA interview. LCCA is an unsupervised ML algorithm widely used to identify subgroups of individuals from mixed data in which records of variables of different nature are available. Symptoms were registered using a binary system that assessed the presence or absence of 20 clinical symptoms from a symptom-based questionnaire completed by all participants (0: absence; 1: presence), which were further used as indicators in all LCCA models. For children, questionnaires were answered by the parents or legal guardians. We explored LCCA models, with up to 10 subgroups for all symptoms (questions 1–20) and those specific to the inattention (questions 1–10), hyperactivity (questions 11–16), and impulsivity (questions 17–20) domains separately. In these models, demographic information such as sex and age group (children: 4–11 years; adolescents: 12–17 years; adults >17 years) (Arcos-Burgos et al., 2010) were used as covariates. Because of the family-based structure of our data, LCA models were adjusted to account for the non-independence of individuals within families. The number of clusters was selected using a likelihood ratio test (LRT) and their statistical significance was assessed via parametric bootstrap with B = 500 replicates. Further, individuals are assigned to each cluster based on the highest posterior probability of belonging to each cluster according to their symptoms’ profile.
To classify individuals as “severe” or “not severe” (i.e., the severity phenotype) according to the DSM-IV criteria, we derived the clinical profile associated with the clusters identified by LCCA. Individuals within a particular LCCA-derived cluster were defined as “severe” if the number of questions with probability of occurrence above 50% was higher than half of the total number of domain-specific questions. For example, in the inattention domain, which assessed 10 clinical symptoms, a particular cluster (and therefore all individuals belonging to it) will be classified as “severe” if at least six questions have an occurrence probability greater than 50%. From that point on, individuals with severe symptoms were labeled as “cases” or as “controls” otherwise.
Demographic Characterization
Measures of central tendency and dispersion were employed to summarize continuous variables. Frequencies and proportions were estimated for categorical variables. Potential confounders were controlled with logistic regression, and odds ratios (OR) with 95% confidence intervals (CI) were used to summarize results. Unless otherwise stated, statistical analyzes and plotting were performed in R version 3.6.2 (R Core Team, 2019). The false discovery rate (FDR) was used to control type I error derived from multiple testing (Benjamini & Hochberg, 1995; Vélez et al., 2014).
Hierarchical clustering (HC) was used to evaluate grouping of symptoms severity. This method, in contrast with the Spearman correlation coefficient, uses an agglomerative algorithm that joins the most similar component features, and sequentially joins the next most similar with the first two converted to a new combined unit (Venables & Ripley, 2002). Clusters were generated via complete linkage; their uncertainty was assessed using approximately unbiased (AU) and bootstrap probability (BP) values as implemented in the R pvclust (Suzuki et al., 2019) package. The AU p-values and the BP values were computed by multiscale and by normal bootstrap resampling, respectively, with the former being a better approximation to unbiased p-values. For this analysis, a total of 10,000 bootstrap samples were generated. Thus, AU p-values > 95% strongly support the existence of a cluster structure.
Genetic Analysis
DNA extraction and genotyping
DNA extraction and genotyping were performed as described elsewhere (Puentes-Rozo et al., 2019). Briefly, genomic DNA was isolated from blood samples using the MasterPure® DNA Purification Kit (Epicentre Biotechnologies, Chicago, IL, USA) according to the manufacturer’s protocol. DNA concentrations were measured using a NanoDrop™ 2000 spectrophotometer (Thermo Fisher Scientific, Waltham, MA, USA). Genotyping was performed at the University of Arizona Genetics Core using the multiplex Sequenom® Technology on Agena Bioscience’s MassARRAY® MALDI-TOF instrument.
Family-based association analysis
Genetic association and linkage analyzes were performed using the generalized family-based association test (FBAT) model, which provides a unified framework for the transmission disequilibrium test (TDT) (Laird et al., 2000; Spielman et al., 1993). FBAT accounts for different genetic models, family-based ascertainment designs, complex phenotypes (diseases) architecture, missing parents, and different subtypes of null hypotheses, (Laird et al., 2000) while being minimally affected by non-causal SNPs (Brookes et al., 2006). We used the FBAT model as implemented in the PBAT module of SNP Variation Suite (SVS) 8.8.3 (Golden Helix, Inc., Bozeman, MT, USA). Briefly, several genetic models of inheritance were explored (additive, dominant, recessive, and heterozygous advantage). Haplotype tests for selected combinations of phenotypes and markers were applied because PBAT automatically controls for both the type I error rate generated by multiple comparisons (Rabinowitz & Laird, 2000) and the problem of genetic stratification (Benjamini & Hochberg, 1995; Laird et al., 2000; Lange et al., 2004; Lunetta et al., 2000; Vélez et al., 2014). Another advantage of the FBAT design is that low genotype call rates in probands can be compensated by imputation from parental genotypes, and Mendelian inconsistencies are generally removed from analyzes (Lange & Laird, 2002a, 2002b). As age and sex are known to impact ADHD susceptibility (Mowlem et al., 2018; Oerbeck et al., 2019; Ramtekkar et al., 2010; Skogli et al., 2013), both variables were included as covariates under the hypothesis of no linkage and no association. As a result, inclusion of these covariates substantially improved FBAT statistical power (Lange & Laird, 2002a, 2002b).
Predictive Genomics Models of Symptoms Severity
We used ML algorithms to construct predictive models of symptom severity for different symptom domains (i.e., global, inattention, hyperactivity, and impulsivity). The set of predictors consisted of demographic variables, and genetic markers. Several ML methods were explored, including Logistic Regression, Classification and Regression Tree (CART) (Breiman et al., 1984), Random Forest (RF) (Breiman, 2001; Satterfield et al., 1974), Support Vector Machine (SVM) (Cortes & Vapnik, 1995; Salazar et al., 2012), and Tree Boosting (XGBoost) (Chen & Guestrin, 2016; Chen et al., 2020). The full list of ML algorithms is provided in Table S1 of the Supplementary Material.
Construction, validation, and testing of these predictive models were performed using the methods implemented in the R caret (Kunh, 2020) package. Initially, models were constructed and tuned with 70% of the data (training data) using a 10-fold cross-validation procedure with five repetitions. In the construction stage, models were tuned with the training data set to identify the best combination of parameters for each ML algorithm that maximized the model’s accuracy for predicting symptom severity in a particular domain. Finally, models were validated using the remaining 30% of the data set (testing data) and a measure of balanced accuracy was derived. This measure was calculated as the percentage of individuals correctly classified. On average, the training and testing data sets were composed of 241 and 115 individuals, respectively. Models were assessed using the Receiver Operating Characteristic (ROC) (Metz, 1978) curve and the area under the ROC curve (AUC) as performance measures. In addition, the sensitivity (Se), specificity (Sp), correct classification rate (accuracy), positive predictive value (PPV), negative predictive value (NPV), false discovery rate (FDR), and false positive rate (FPR) performance measures, were also calculated.
Results
Severity of Symptoms
Of the 386 patients studied, 224 (58%) were affected by ADHD. The distribution by sex and age of the 386 individuals was as follows: 218 (56.5%) males and 168 (43.5%) females; 120 (31.1%) were children (6–11 years), 34 (8.8%) adolescents (12–17 years), and 232 (60.1%) adults (>17 years). We identified six significantly different latent class clusters using all items of the DSM-IV criteria, three clusters within the inattention domain, three clusters within the hyperactivity domain, and two clusters within the impulsivity domain (Table 1 and Figure 1). Fit statistics for LCCA models, the average posterior probabilities for each cluster and the distribution of the total number of symptoms by LCCA-derived cluster are presented in the Supplementary Material. We identified that the number of DSM-IV symptoms differ by LCCA-derived clusters (Figure 1S; Supplementary Material).
Demographic and Clinical Characteristics of Clusters Derived using Latent Class Cluster Analysis Based on DSM-IV Symptomatology.
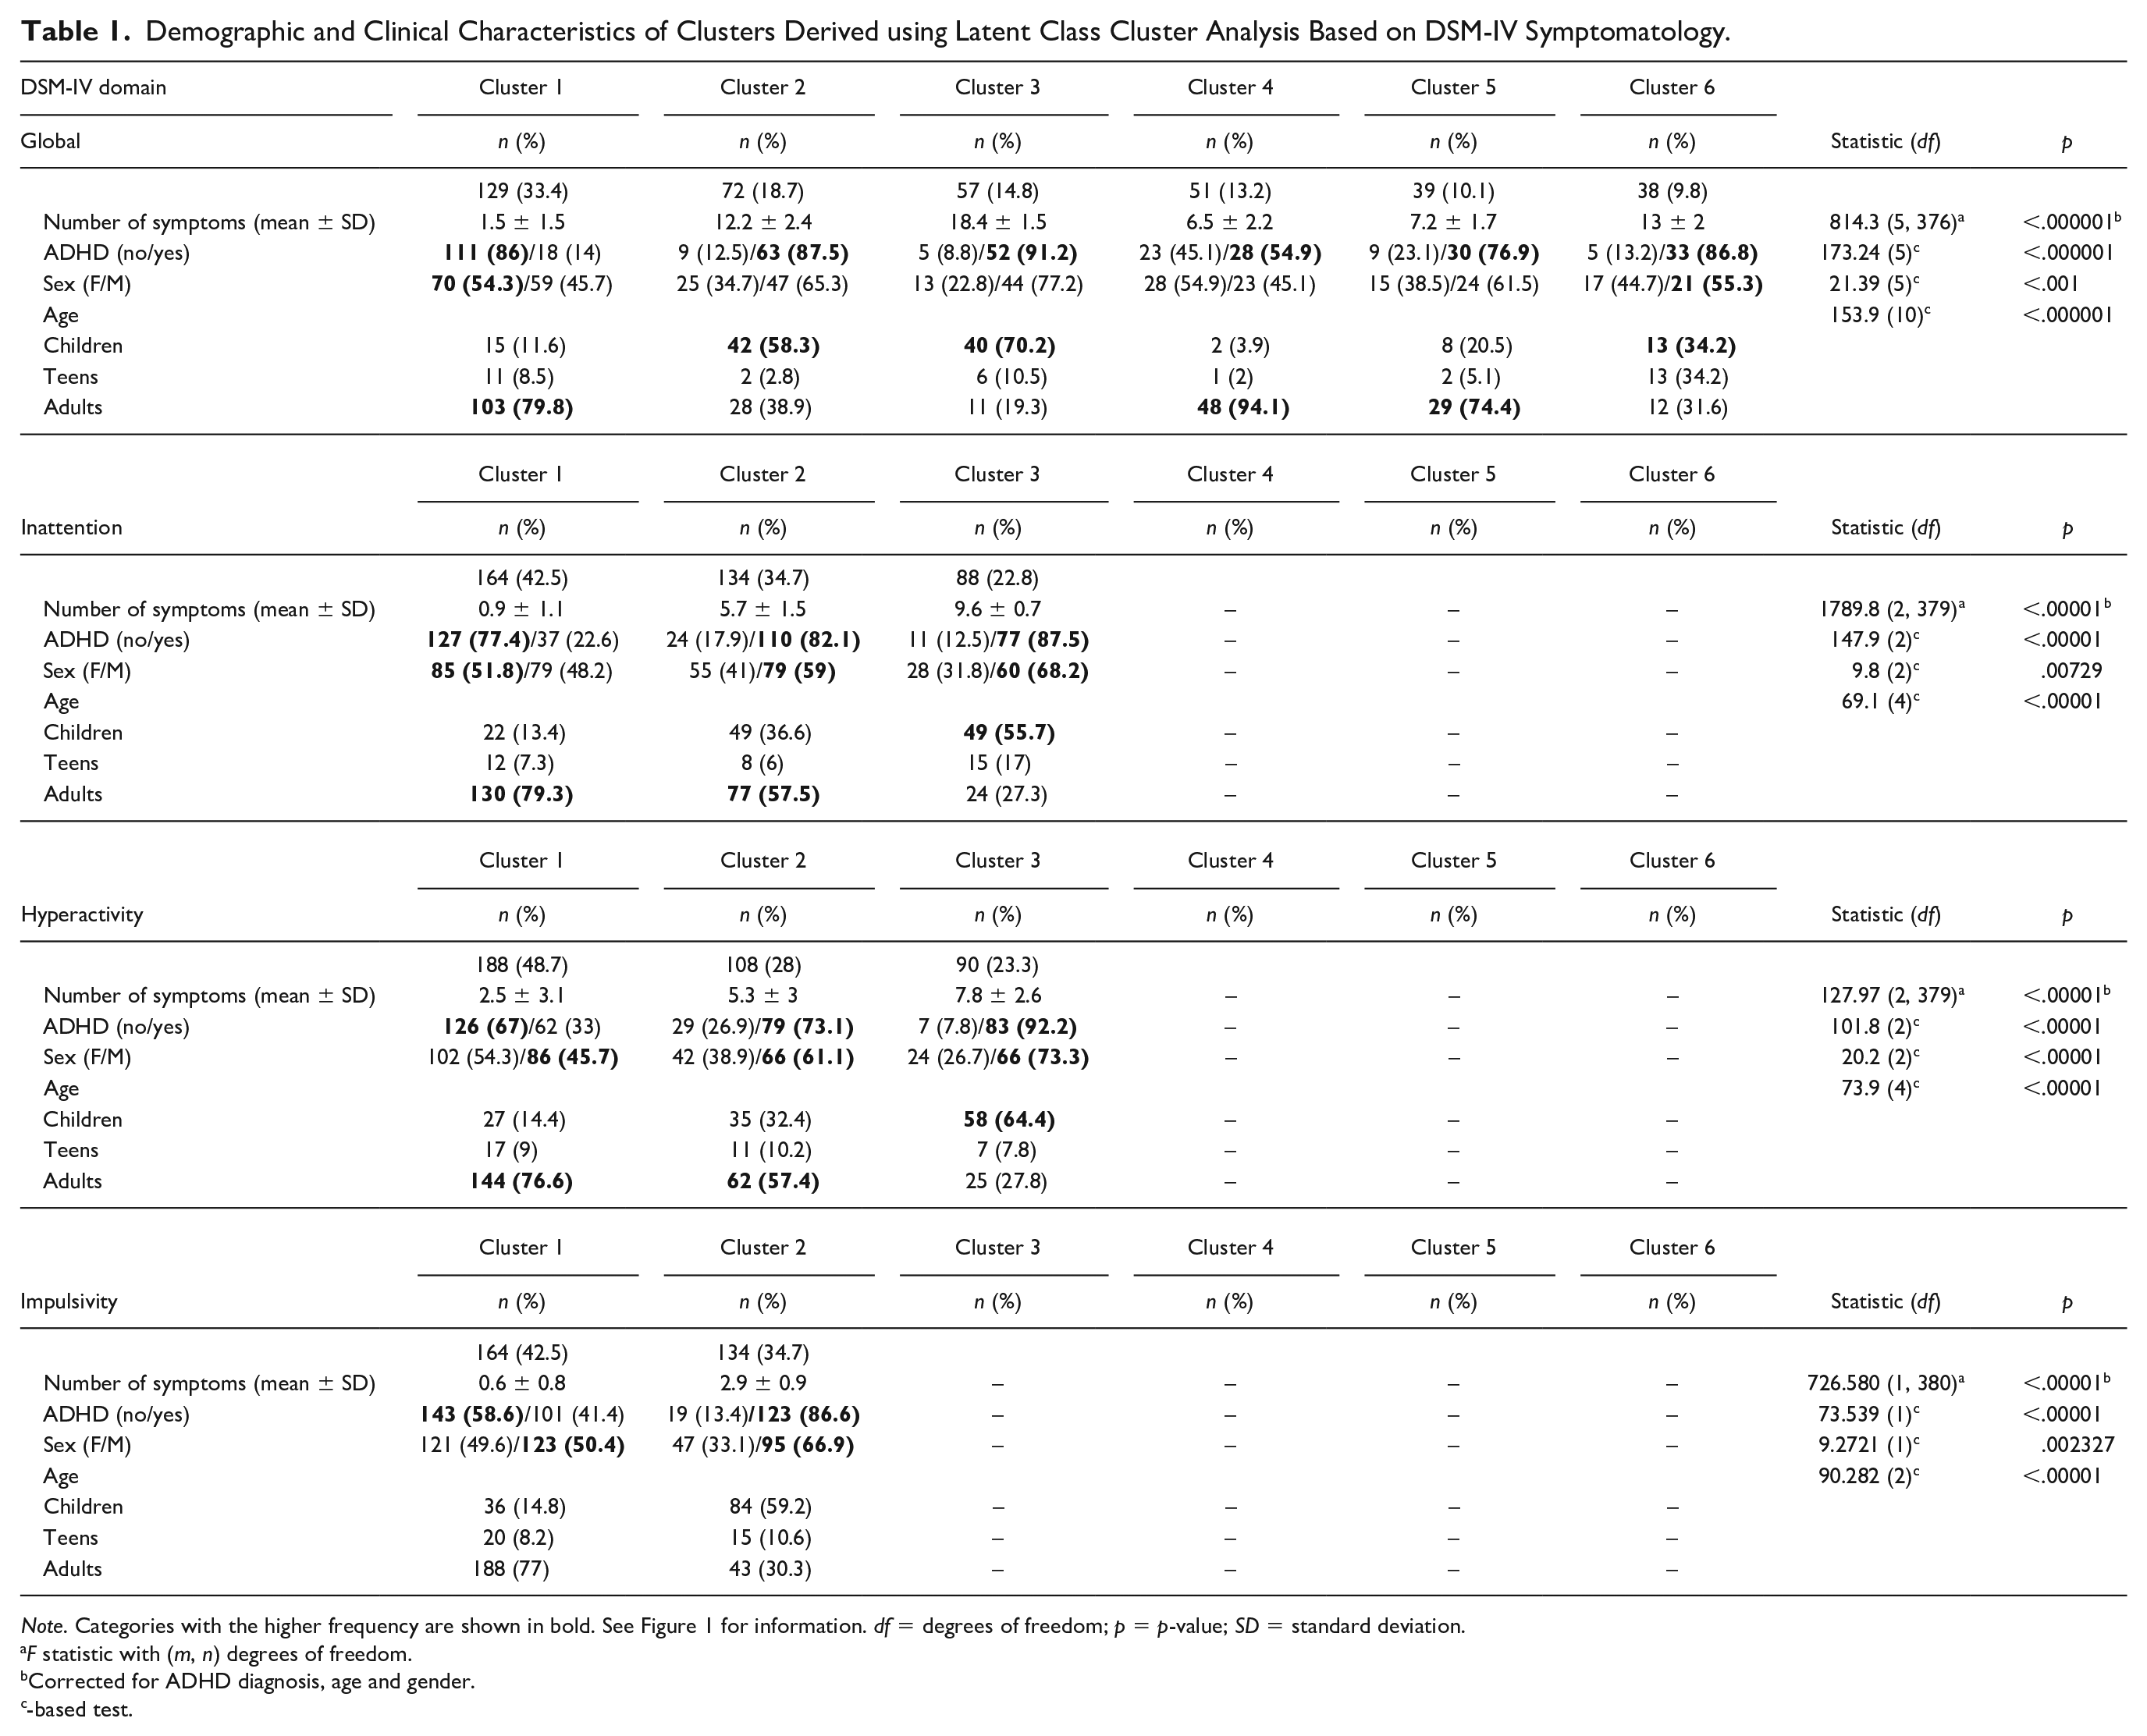
Note. Categories with the higher frequency are shown in bold. See Figure 1 for information. df = degrees of freedom; p = p-value; SD = standard deviation.
F statistic with (m, n) degrees of freedom.
Corrected for ADHD diagnosis, age and gender.
-based test.
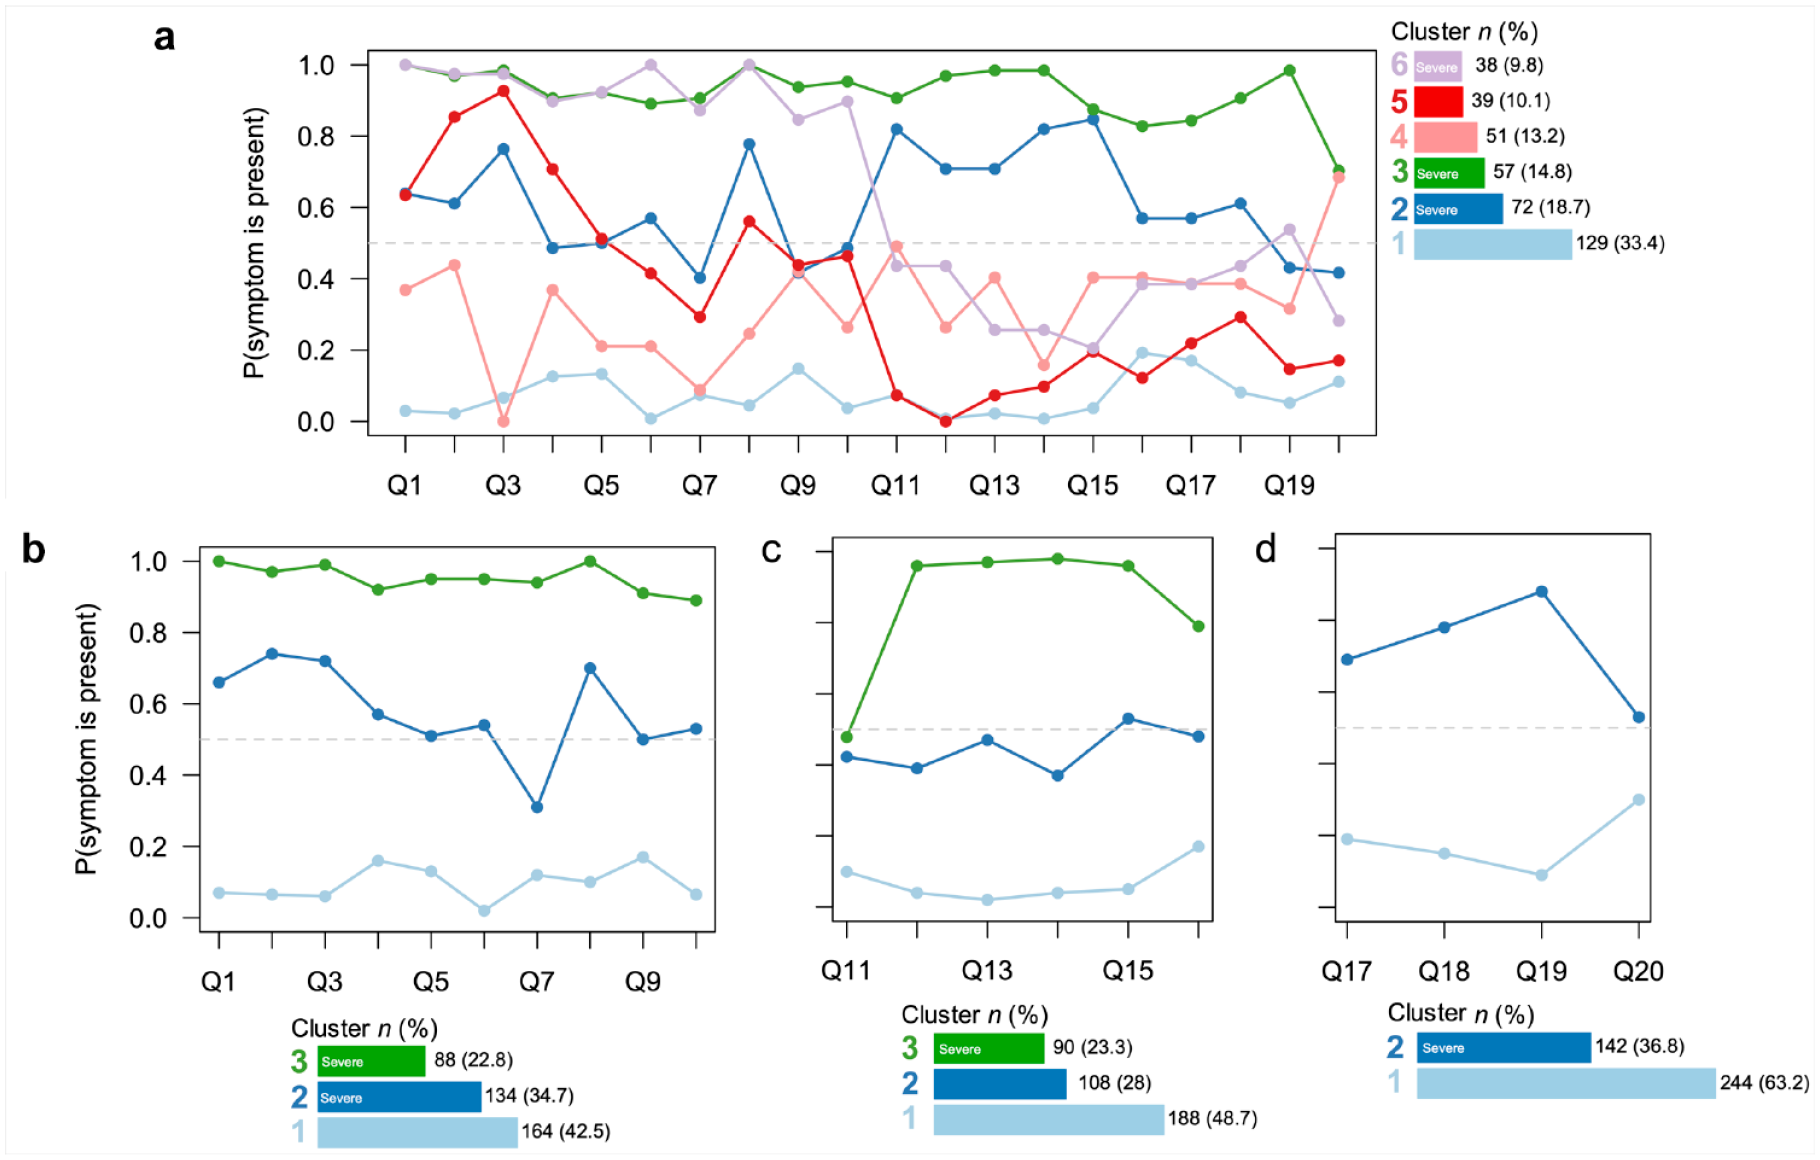
Profile plots derived using latent class cluster analysis applied to ADHD symptoms derived from DSM-IV criteria. Results are shown for: (a) all items (Q1–Q20), (b) inattention items (Q1–Q10), (c) hyperactivity items (Q11–Q16) and (d) impulsivity items (Q17–Q20). The number of individuals per cluster is also shown. Individuals exhibiting a severe phenotype correspond to clusters 2, 3 and 6 in (a), clusters 2 and 3 in (b), cluster 3 in (c), and cluster 2 in (d).
Following our approach, individuals assorted to clusters 2, 3, and 6 based on the full set of items globally exhibit severe symptoms (n = 167, 43.4%; Figure 1a); individuals classified in clusters 2 and 3 based on the inattention items exhibit severe symptoms in this domain (n = 222, 57.5%; Figure 1b); individuals assorted in cluster 3, based on the hyperactivity items, were classified as severely affected in this domain (n = 90, 23.3%; Figure 1c); and individuals assorted in cluster 2 based on impulsivity items were classified as severely affected in this domain (n = 142, 36.8%; Figure 1d). Regardless of the domain, severely affected clusters are predominantly constituted by male children with a positive ADHD diagnosis (Table 1). Overall, individuals exhibiting a complex severity phenotype show higher number of DSM-IV symptoms (Figure 2S; Supplementary Material). Further analyzes of age within LCCA-derived (Figure 3S; Supplementary Material) and severity phenotype (Figure 4S; Supplementary Material) indicate that children, adolescents and young adults (age < 25) are severely affected, while the group of not severe individuals is mostly constituted by adults (age > 25).
Logistic Regression analyzes revealed that individuals with ADHD are 8.9 times more likely to display a severe phenotype based on global items (95% CI = 4.9–16.6). As expected, children and adolescents exhibited the highest risk of developing global-based severe symptoms (odds ratio [OR] = 7.3, 95% CI = 4.1–13.4; OR = 4.9, 95% CI = 2.1–11.7, respectively). Interestingly, 19 (11.4%) individuals identified as severely affected (Figure 1a) were not diagnosed with ADHD (six children, two adolescents, and 11 adults; Table S4 and Figure 5S; Supplementary Material).
In the inattention domain, individuals with a positive ADHD diagnosis were 14.9 times more likely to exhibit severe inattention than controls, regardless of sex (95% CI = 8.6–26.5). In addition, children were more likely to have severe inattention than adults (OR = 2.1, 95% CI = 1.1–4.1), while adolescents were equally likely (OR = 1.8, 95% CI = 0.7-4.7). Of the individuals with severe inattention symptoms (Figure 1b), 35 (15.8%) were not diagnosed with ADHD (six children, two adolescents, and 27 adults; Table S4 and Figure 5S; Supplementary Material).
In the hyperactivity domain, individuals with a positive ADHD diagnosis were 6.9 times more likely to have severe hyperactivity symptoms than adults, regardless of sex (95% CI = 3.2–17.7) (Figure 2c). In contrast, adolescents and adults were equally likely to suffer from severe hyperactivity symptoms (OR = 1.4, 95% CI = 0.53–3.8). Of individuals exhibiting severe inattention symptoms (Figure 1c), 7 (7.7%) were not diagnosed with ADHD (two children, one adolescent, and four adults; Table S4 and Figure 5S; Supplementary Material).

Correlation-based dendrograms for the severity of global, inattention, hyperactivity and impulsivity symptoms by ADHD diagnosis. Approximately unbiased (AU) and bootstrap probability (BP) values are shown in red and green, respectively. AU p-values greater than 95% suggest that the clustering structure is strongly supported by the data. Node numbers appear in gray. The vertical dotted line represents the optimal number of clusters for the ADHD group. We identified two different co-occurrence configurations in ADHD affected individuals (cases), and only one mechanism in unaffected individuals (controls). However, this latter mechanism was not supported by the data.
In the impulsivity domain, individuals with a positive ADHD diagnosis were 4.8 times more likely to have severe inattention symptoms (95% CI = 2.7–8.7). In addition, children (OR = 4.8, 95% CI = 2.7–8.7), and adolescents (OR = 2.5, 95% CI = 1.1–5.7) were more likely than adults to be severely affected in this domain. Of all individuals with severe impulsivity (Figure 1d), 20 (13.9%) were not diagnosed with ADHD (four children, four adolescents, and 12 adults; Table S4 and Figure 5S; Supplementary Material).
Differential Clinical Signature on Severity
Hierarchical clustering of the LCCA-derived severity phenotypes revealed a differential clinical signature in our cohort (Figure 2). Our data suggests that individuals diagnosed with ADHD manifest severity of symptoms in two seemingly independent configurations. The first configuration involves a combination of global severity symptoms, while the second configuration involves symptom severity ascribed exclusively to the hyperactivity-impulsivity domain (Figure 2; left). Bootstrap validation suggests that these two configurations are statistically distinct (strongly supported by the data) and differ from that manifested by individuals without an ADHD diagnosis (Figure 2; right). Both the impulsivity and hyperactivity severity of symptoms were different between individuals with ADHD and controls, with no support for a particular clustering pattern of severe symptoms in the control group (Figure 2; right).
Markers Conferring Susceptibility to Severe Symptoms
Table 2 shows the main results of the FBAT analysis. We found significant linkage and association of either global or domain-specific severity with markers DRD4-rs916457, SNAP25-rs362990, ADGRL3-rs2122642, and ADGRL3-rs10001410. In particular, DRD4-rs916457 and SNAP25-rs362990 were associated with both global and inattention symptom severity; ADGRL3-rs2122642, ADGRL3-rs10001410, and DRD4-rs916457 were found to be associated with severity of hyperactivity symptoms; and DRD4-rs916457, ADGRL3-rs2122642, and SNAP25-rs362990 were associated with the severity of impulsivity symptoms under different genetic models of inheritance (Table 2).
Results of the FBAT Analysis Applied to Symptoms Severity by Domain.

Note. For interpretation purposes, positive p-values indicate susceptibility. Chr=chromosome; HA = heterozygous advantage; NIF = number of informative families; FBAT = family-based association test.
UCSC GRCh37/hg19 coordinates.
Predictive Genomics Framework for Severity of Symptoms
Figure 3 shows the accuracy of the ML algorithms used to predict ADHD severity. We found that the SVM with polynomial kernel (svmPoly), linear discriminant analysis (lda), gradient boosting machine (gbm), and CART (rpart2) ML algorithms provide the highest accuracy for predicting global, inattention, hyperactive and impulsivity severity, respectively (Figure 3a).

Performance measures for ML algorithms used to construct predictive genomics models for ADHD symptom severity: (a) Balanced accuracy based on the 10-fold cross validation (CV) procedure. Segments represent 95% confidence intervals. The best performance was achieved by the Support Vector Machine (SVM) with polynomial kernel (svmPoly), linear discriminant analysis (lda), gradient boosting machine (gbm) and Classification and Regression Tree (rpart2) ML algorithms when predicting global, inattention, hyperactivity and impulsivity severity, respectively, (b) ROC curves for the 10-fold CV procedure and the training and testing data sets. The 10-fold CV procedure was performed using five repetitions for each fold. The training and testing data sets data sets consisted of 70% (n = 271) and 30% (n = 115) of the data, respectively, and (c) variable importance for the predictive models derived in our cohort. A brief description of the ML algorithms is provided in the Supplementary Material.
ROC analysis indicates that, in all cases, the AUC provides a moderate ability of the predictive models to discriminate severe from non-severe individuals based on demographic and genetic data, with accuracy values ranging between ~70% and 82% for the derived models (Table 3 and Figure 3b). These models also provide competitive Se, Sp, PPV, NPV, FDR, and FPR values, which make them a suitable alternative to diagnose ADHD symptom severity in the clinical setting (Table 3).
Performance Measures for ML-Based Predictive Models of ADHD Severity Based on Demographic and Genetic Data.

CV = cross-validation; Se = sensitivity; Sp = specificity; PPV = positive predictive value; NPV = negative predictive value; FDR = false discovery rate; FPR = false positives rate; AUC = area under the ROC curve.
The confusion matrix is formatted as i/j/k/l, where i is the number of severe individuals correctly classified, j is the number of severe individuals classified as non-severe, k corresponds to non-severe individuals classified as severe, and l to the number of non-severe individuals correctly classified.
The 10-fold CV procedure was performed using 5 repetitions for each fold based on 70% of the data (training data set; n = 271 on average). Testing was performed using the remaining 30% (testing data set; n = 115 on average). See methods for more information.
Analyzes of variable importance indicate that, overall, age, sex, and severity-associated SNPs are important predictors of derived latent class clusters (Figure 3c). Among those SNPs (Table 2), marker SNAP25-rs362990 is similarly ranked in terms of variable importance for predicting global, inattention, and hyperactivity symptom severity, and ranked as least for predicting impulsivity severity (Figure 3c). Interestingly, ADGRL3-rs10001410 also produces a similar effect, although to a lesser extent, for predicting inattention and hyperactivity severity, while marker ADGRL3-rs2122642 is the third most important predictor of hyperactivity severity, and the fourth most important to predict impulsivity severity (Figure 3c). On the other hand, marker DRD4-rs916457 was identified as the most important genetic predictor of impulsivity severity, and ranked last for predicting the severity of the remaining symptoms (Figure 3c).
Discussion
ADHD and related behaviors fit better a classification system based on a continuous spectrum of symptom severity, rather than in a discrete category with a dichotomous affection status (i.e., affected and unaffected) (Asherson & Trzaskowski, 2015). Indeed, the severity of ADHD symptoms is significantly correlated with neuropsychological functioning (Rajendran et al., 2013) and represents a major risk factor for major depression disorder and ODD (Tandon et al., 2016). These aspects might represent important factors to define ADHD natural history and its implications for the clinical practice (Acosta et al., 2011; Brown et al., 2017; Fletcher & Wolfe, 2009; Shaw et al., 2012). Thus, proper and early identification of individuals at risk for severe ADHD may facilitate assessment, diagnosis, treatment, and follow-up (prediction, prevention and intervention) (Kotte et al., 2013; Owens & Jackson, 2017). Altogether, these findings highlight the importance of assessing the severity of symptoms, especially at young ages, for the definition and selection of appropriate therapeutic strategies to reduce ADHD burden.
In this study, a phenotypic classification system based on the severity of ADHD symptoms was derived from the identification of latent classes using unsupervised ML algorithms. We argue that this severity phenotype, in conjunction with ML algorithms, is suitable for and should be preferred when dissecting causes and building predictive frameworks, as it reduces global heterogeneity and enhances more precise, unique and personalized demographic, cultural, clinical, and biological features(Acosta et al., 2008, 2011; Jain et al., 2007; Larsson et al., 2012; Owens & Jackson, 2017; Pineda et al., 2016). By using different ML, we were able to build a diagnostic tool for ADHD severity with the ultimate goal of identifying, based on training data and a cross-validation strategy, which of them had the best prediction accuracy. These ML algorithms (Table S1; Supplementary Material) are particularly useful to construct predictive models when the response variable (i.e., outcome of interest) is of binary. Considering that individuals are classified as “severe” or “not severe” based on the number of symptoms with probability of occurrence above 50%, the choice of such ML algorithms was justified. In the near future, those ML best-performing algorithms could easily be implemented in an intelligent information system that facilitates the identification of individuals with one or more ADHD severity patterns.
Our findings suggest the presence of one or more independent groups subtly integrated as part of the ADHD phenotype that correlate with ADHD symptoms and functional impairment (Kupper et al., 2012; Theule et al., 2013) ADHD severity, and parenting problems (Anastopoulos et al., 1992; Faraone & Larsson, 2019; Graziano et al., 2011; Palacios-Cruz et al., 2014; Rajendran et al., 2013). In line with previous studies correlating ADHD diagnosis with long-term outcome and poorer neuropsychological functioning (Helfer et al., 2019; Owens & Jackson, 2017; Rajendran et al., 2013), we found that a positive ADHD diagnosis is a risk factor for symptoms severity either globally or domain-specific. We also identified two seemingly independent symptoms severity configurations in individuals with ADHD that differ from those observed in unaffected individuals (Figure 2). Altogether, these findings suggest that symptoms severity is distinct in individuals with ADHD, but may also have important implications for those without a positive ADHD diagnosis. This could be partially explained by the fact that some individuals are below a well-accepted threshold for ADHD diagnosis (Larsson et al., 2012).
Previously, we identified that SNPs in the ADGLR3, DRD4 and SNAP25 and FGF1 genes confer susceptibility to ADHD in the same families evaluated in this study (Puentes-Rozo et al., 2019). Here, we explored the association between those SNPs and ADHD symptom severity. We found that markers DRD4-rs916457, SNAP25-rs362990, ADGRL3-rs2122642, and ADGRL3-rs10001410 are in linkage and association with the severity of either global or domain-specific symptoms under different genetic models of inheritance (Table 2). To the best of our knowledge, this is the first report describing an association between genetic variants within these genes and the severity of ADHD symptoms in a population of predominantly African ancestry.
Marker DRD4-rs916457 was previously associated to ADHD susceptibility in the families evaluated in this study (Puentes-Rozo et al., 2019) and in families from the Paisa genetic isolate from Antioquia, Colombia (Arcos-Burgos, Castellanos, Konecki, et al., 2004). Here, this variant was found to be associated with the severity of global, hyperactivity and impulsivity symptoms (Table 2), and an important predictor of symptom severity in our predictive genomics framework (Table 3 and Figure 3). The role of the DRD4 in ADHD etiology has been studied extensively (DiMaio et al., 2003). Variants in this gene are an important predictor of preschool aggression and a moderator of family environmental effects, stressful life events, and inattention severity among adults with ADHD, as well as parental and youth ADHD outcomes (Farbiash et al., 2014; Martel et al., 2011; Nikolas & Momany, 2017; Sanchez-Mora et al., 2015). Furthermore, DRD4 variants have been associated with ADHD symptom severity (Tabatabaei et al., 2017; Tahir et al., 2000; Tovo-Rodrigues et al., 2013) and play a significant role in the default mode, executive control and sensorimotor networks in children with ADHD (Qian et al., 2018). Altogether, these findings support the role of DRD4 not only in the etiology of ADHD, but also in the prediction of ADHD symptom severity. These results contribute to our understanding of the genetic basis of ADHD severity in this understudied population.
SNAP25 has been extensively implicated in the etiology of ADHD (Barr et al., 2000; Brophy et al., 2002; Feng et al., 2005; Galvez et al., 2014; Gizer et al., 2009; Herken et al., 2014; Kim et al., 2007). It plays an important role in the synaptic function of specific neuronal systems. SNAP25 is an essential component of the soluble N-ethylmaleimide-sensitive factor attachment protein receptor (SNARE) complex, which is involved in the exocytotic release of neurotransmitters during synaptic transmission (Antonucci et al., 2016). More recently, SNAP25 variants were reported to be associated with working memory (Wang et al., 2018) and neuropsychological performance in individuals with ADHD (Kim et al., 2017) Evidence also suggests that SNAP25 is differentially expressed in the prefrontal cortex of animal models of ADHD and of children with ADHD when compared to controls (Li et al., 2009). Having previously identified that marker SNAP25-rs362990 conferred susceptibility to ADHD (Puentes-Rozo et al., 2019) and finding that this same variant is associated with the severity of inattention and impulsivity symptoms (Table 2) expands our understating of the role of SNAP25 in ADHD etiology. Variable importance analyzes revealed that this marker is an important predictor of severity latent phenotypes when included in the ML-based predictive framework (Figure 3 and Table 2). The fact that a SNAP25 variant is associated with impulsivity symptoms severity in our study supports the findings by Nemeth et al. (2013), who reported an association between impulsivity and a polymorphic microRNA binding site on the SNAP25 3’UTR region. Furthermore, considering that our sample exhibits ADHD predominantly of inattentive and impulsivity component (Cervantes-Henriquez et al., 2018; Pineda et al., 2016; Puentes-Rozo et al., 2019), our findings support the role of genetics in influencing the severity of these symptoms, at least in individuals from this Caribbean population.
Variant ADGRL3-rs2122642 was previously associated with increased ADHD susceptibility in our cohort and is harbored in a susceptibility haplotype formed by markers rs1565902, rs10001410, and rs2122642 (OR = 1.74, Ppermuted = 0.021) (Puentes-Rozo et al., 2019). Variants in ADGRL3, a member of the latrophilin family of adhesion G protein-coupled receptors (Martinez et al., 2011; Moreno-Salinas et al., 2019), increase the risk of developing ADHD, externalizing disorders, including CD, ODD, and SUD, and adverse long-term outcomes (Acosta et al., 2016; Arcos-Burgos et al., 2010, 2012, 2019; Jain et al., 2007, 2011). Finding that ADGRL3-rs2122642 confers susceptibility to more severe hyperactivity and impulsivity symptoms and that ADGRL3-rs10001410 is associated with an increased severity of global symptoms (Table 2 and Figure 3) highlights the importance of ADGRL3 as a pivotal gene in ADHD. Although this effect has previously been shown in the Paisa genetic isolate (Jain et al., 2007), this is the first time it is reported for a community with a predominantly African genetic background.
Despite our encouraging results and the possibility of rapidly applying our findings in the clinical setting, some limitations need to be acknowledged. First, it is frequent in this culture to find unmedicated ADHD children. Consequently, neither children nor adults included in this study were medicated because they were untreated incidental cases. Although it may be possible to observe the same medication pattern in other cultures, this is not necessarily the norm and imposes some restrictions when extrapolating our results to the general population. In the same vein, a second limitation is the representativeness of the sample across different age groups due to the family-based design utilized for recruiting the sample. In our case, 94/386 individuals were children, 34/386 adolescents and 232/386 adults, and age ranged between 6 and 60 years, which indicates that individuals are not uniformly distributed across age groups. Thirdly, the use of the same assessment methods across age groups. We clinically assessed all individuals in our genetic studies of ADHD using a multimodal approach (Cervantes-Henriquez et al., 2018; Palacio et al., 2004; Pineda et al., 2016). However, we are aware that using the same assessment methods across age groups may not be ideal. Thus, future studies may use different or complementary assessment strategies across age groups, especially in order groups, as some participants may have difficulties with episodic memory and hence may not be able to assess ADHD symptoms retrospectively. A fourth limitation is the use of related individuals in the LCCA cluster analysis. Even though clustering methods designed for related individuals exist, LCCA methods for dissecting hidden structures was initially proposed for unrelated individuals. While we used each individual's family membership to reduce the impact of individuals' relatedness in the resulting clusters derived by LCCA, the use of other clustering methods for identifying complex structures in data with related individuals is yet to be explored. Finally, our sample is comprised of nuclear families characterized by a predominantly African ancestry, which may represent both a limitation and a strength of this study. It would be interesting to compare the severity patterns in our cohort and those reported in other populations around the world.
In summary, our study supports the role of the DRD4, SNAP25, and ADGRL3 genes in the etiology of ADHD severity in a Caribbean community of predominantly African ancestry. The identification of variants within these genes previously reported to confer susceptibility to ADHD sheds light into the genetic basis of ADHD severity, especially in this understudied population. We argue that future genetic studies of ADHD may greatly benefit from our findings. In fact, such studies could use the severity of symptoms to elucidate how individuals with symptoms in different domains—inattention, hyperactivity, impulsivity—perform neuropsychological tasks (i.e., measures of working memory, cognitive function, and executive function) (Jimenez-Figueroa et al., 2017; Pineda-Alhucema et al., 2018; Suarez et al., 2020), and to determine the contribution to ADHD severity of genetic variants that confer susceptibility in Caucasian populations (Demontis et al., 2019). Although these candidate variants have not been replicated in genome-wide analyzes, their utility as risk variants for ADHD needs further investigation. In addition, these complex severity phenotypes may be used to identify at-risk populations using ML approaches (Table 3 and Figure 3) or genetic markers already identified to confer susceptibility to ADHD via GWAS. In the latter case, ML methods (i.e., clustering and dimensionality reduction techniques) may be applied to identify individuals with severe and subtle forms of ADHD based on clinical information. Further, such ML-derived phenotypes may be used as the trait of interest in future genetic association studies either by evaluating the partial contribution of each genetic marker or by calculating polygenic risk scores (Du Rietz et al., 2018). Ultimately, the combination of clinical data, genetic association analyzes and ML techniques may contribute to elucidate the molecular basis of ADHD symptomatology utilizing a multi-omics approach, and the development of predictive tools with potential clinical application (Tenev et al., 2014; Vahid et al., 2019).
Supplemental Material
sj-docx-1-jad-10.1177_10870547211015426 – Supplemental material for Machine Learning Prediction of ADHD Severity: Association and Linkage to ADGRL3, DRD4, and SNAP25
Supplemental material, sj-docx-1-jad-10.1177_10870547211015426 for Machine Learning Prediction of ADHD Severity: Association and Linkage to ADGRL3, DRD4, and SNAP25 by Martha L. Cervantes-Henríquez, Johan E. Acosta-López, Ariel F. Martinez, Mauricio Arcos-Burgos, Pedro J. Puentes-Rozo and Jorge I. Vélez in Journal of Attention Disorders
Footnotes
Acknowledgements
We express our highest sentiment of appreciation to all families enrolled in this study.
Declaration of Conflicting Interests
The author(s) declared no potential conflicts of interest with respect to the research, authorship, and/or publication of this article.
Funding
The author(s) disclosed receipt of the following financial support for the research, authorship, and/or publication of this article: This study was financed by COLCIENCIAS, project “Fenotipos Complejos y Endofenotipos del Trastorno por Déficit de Atención e Hiperactividad y su Asociación con Genes Mayores y de Susceptibilidad”, grant 1253-5453-1644, contract RC 384-2011, awarded to Grupo de Neurociencias del Caribe, Universidad Simón Bolívar, Barranquilla. M.L.C.H received a PhD scholarship from Universidad Simón Bolívar, Barranquilla; M.L.C.H, J.E.A.L and J.I.V were partially supported by research grant FOFICO 32101 PE0031 from Universidad del Norte. M.L.C.H is a doctoral student at Universidad del Norte; some of this work is to be presented in partial fulfilment of the requirements for the PhD degree.
Supplemental Material
Supplemental material for this article is available online.
Author Biographies
References
Supplementary Material
Please find the following supplemental material available below.
For Open Access articles published under a Creative Commons License, all supplemental material carries the same license as the article it is associated with.
For non-Open Access articles published, all supplemental material carries a non-exclusive license, and permission requests for re-use of supplemental material or any part of supplemental material shall be sent directly to the copyright owner as specified in the copyright notice associated with the article.