
Abstract
Objective:
This study aims to quantify the potential age bias in screening of hyperactive/impulsive presentations of ADHD in children ages 5 to 12 through comparison of age-based and overall percentiles in screening.
Method:
A referred clinical sample of 307 children ages 5 to 12 with behavioral concerns completed the Vanderbilt Attention Deficit-Hyperactivity Disorder Diagnostic Parent Rating Scale (VADPRS) and were formally evaluated for ADHD with a diagnostic interview. Analysis utilizing logistic regression and receiver operating characteristic (ROC) curves was performed to compare the screening performance of agebased and overall percentiles.
Results:
The age-based percentiles demonstrated no improvement in the analyzed models compared to overall percentiles in hyperactive presentation ADHD screening. This finding was present in the overall sample and in the sub analysis of the 5 to 6 year old children.
Conclusions:
This study identifies no improvement in modeling of hyperactive/impulsive ADHD screening when considering a child’s age using age-based percentiles.
One area of debate which seems to have arisen to greater prominence as the general literature on Attention Deficit-Hyperactivity Disorder (ADHD) has increased is the role of age in diagnosing ADHD. The diagnostic criteria for ADHD require the presence of six or more of nine inattentive symptoms for a predominantly inattentive presentation, six or more of nine hyperactive/impulsive symptoms for a predominantly hyperactive/impulsive presentation, or meeting both sets of criteria in order to qualify for a combined presentation diagnosis. The diagnosis requires symptoms to be present in at least two distinct settings and the individual diagnosed with ADHD must exhibit functional impairment as a result of their symptoms (American Psychiatric Association, 2013). The incorporation of age in the formal diagnosis is two-fold. First, symptoms must have been present before the age of twelve in order to qualify for a diagnosis of ADHD. The second incorporation of age is indirect but is present as a requirement that symptoms are “inconsistent with developmental level.” It is this latter addressing of age and developmental level that seems to have motivated much of the debate about the role of age in ADHD screening and diagnosis. These debates over age take multiple forms including discussions over prevalence and incidence in younger children as well as the difference in diagnostic rates among same grade peers.
Absolute Age Differences
Significant attention has focused on the high diagnostic rates of ADHD in younger children, particularly in preschool and early elementary school (Leopold et al., 2016; O’Neill et al., 2017). These higher rates of diagnosis can be logically reasoned through the recognition that ADHD requires presence of symptoms and impairment in two or more distinct settings (Diagnostic and statistical manual of mental disorders, 5th edition, 2013). For many children, the two sites are at home and at school. Hence, the high diagnostic rates in children as they first enter preschool or kindergarten and first display impairment due to their hyperactive and inattentive symptoms makes logical sense (Wilens et al., 2002). Though the natural progression of ADHD is variable in its remission as a child ages, the incidence of ADHD does appear to decline consistently with age (O’Neill et al., 2017). However, explaining the higher diagnostic rates of ADHD at ages 5 to 6 compared to older children through school entrance may not account entirely for the different rates. The symptom burden, defined as a higher number and frequency of ADHD diagnostic behaviors, is higher for younger children than for older children, and while only some cases of ADHD remit with aging, the overall symptom burden does decrease. Recently published national norms of the popular Vanderbilt Attention Deficit-Hyperactivity Diagnostic Parent Rating Scale (VADPRS) demonstrated higher symptom burden, as indicated by higher scores on the nine DSM-5 hyperactive/impulsive symptoms of ADHD in younger children than their older peers (i.e., 8.8 in 5–6 year olds vs. 6.5 in 11–12 year olds on VADPRS subscale raw scores) irrespective of ADHD diagnosis (Anderson et al., 2022). This higher rate of hyperactive/impulsive symptoms in younger children raises concerns that perhaps age does play a role in ADHD screening and eventual diagnosis. Despite the guidance to “consider development” when conducting screening for ADHD (NICHQ, 2002), it is possible that clinicians might treat some developmentally typical behavior for pathology in determining whether a child should be given an ADHD diagnosis. Other epidemiological studies, however, report incidence of ADHD peaking slightly later in elementary school age children (Leache et al., 2021) while others have larger age groupings with peak incidence from 6 to 11 years of age (Bitsko et al., 2022). Taking these studies together, the role of absolute age in ADHD diagnosis is unclear.
Relative Age
The conversation regarding age and ADHD diagnosis rates goes beyond absolute age (i.e., preschool and early elementary school children vs. older children) to focus heavily on relative age differences (i.e., children in the same grade with different birth months). Many studies have attempted to characterize these age differences, largely by examining school children cohorts and birth date cut-offs for kindergarten. Though these cut-offs vary by state and country, the overall design is similar: An analysis is performed to compare rates of ADHD symptom burden or diagnostic rates between the relatively younger children (those with birth dates immediately preceding the cutoff date) and the relatively older peers in the same grade (those with birth dates immediately following the cutoff date). Some of these studies have demonstrated higher rates of ADHD diagnosis or symptom burden in children with a younger relative age (Layton et al., 2018; Morrow et al., 2012). Others have found no difference in relative age rates (Biederman et al., 2014). Still others provide a more nuanced lens and observe the effect of relative age as present in early childhood but diminishing in later childhood and adolescence (Bonati et al., 2018; Chen et al., 2016). A recent comprehensive review article, which included several of the above studies out of the twenty reviewed, noted a similar pattern of mixed results as well as variance between countries in the presence and effect of relative age on ADHD diagnosis with significant heterogeneity (Holland & Sayal, 2019).
US national norms for the Vanderbilt ADHD Diagnostic Parent Rating Scale (VADPRS) were recently published (Anderson et al., 2022). The VADPRS is a widely used scale in clinical practice for ADHD screening, due in large part to its ease of use and alignment with DSM-5 diagnostic criteria (Wolraich et al., 2003). When used with the teacher version, the Vanderbilt ADHD Diagnostic Teacher Rating Scale (VADTRS), the two-setting requirement for symptom presence and impairment can be assessed (Wolraich et al., 2004; Wolraich, Feurer, et al., 1998). The established VADPRS national norms document higher scores on the nine-item hyperactive/impulsive subscale in younger children compared to older children. Given the differences in scores between age groups, overall percentiles and age-based percentiles for the hyperactivity subscale were published. With no significant difference in scores between age groups on the inattentive subscale, age-based percentiles for the inattentive subscale were not published and are not available. Guidance to the clinician and researcher was provided that consideration of age is warranted in interpreting hyperactive/impulsive VADPRS scores, but additional utility or clinical significance of the age-based percentiles could not be provided.
Present Study
The present study aims to determine whether age-based VADPRS norms result in a different rate of ADHD hyperactive/impulsive presentation diagnosis than non-age-normed scores. By evaluating the performance of VADPRS screening with and without the consideration of age, we can attempt to clarify whether age does introduce a bias in hyperactive/impulsive ADHD screening. While many studies have examined the difference in diagnostic and screening rates for ADHD based on age, no study to our knowledge evaluates an age-based screening methodology. This important contribution to the literature attempts to quantify the potential bias of age on hyperactive/impulsive ADHD screening and diagnosis.
Method
Overview
This study consisted of secondary data analysis of baseline data (N = 321) collected as part of a larger project studying intervention for children with behavioral concerns (Kolko et al., 2014). This project consisted of evaluation of the effectiveness of Doctor Office Collaborative Care (DOCC) model of patient care versus Enhanced Usual Care (EUC) for children referred by a pediatrician or self-referred for behavioral concerns including ADHD. The participants were randomized to either DOCC or EUC and followed for 18 months with baseline testing repeated every 6 months. The baseline testing included many inventories of child behavior and functioning. For the present analysis, only de-identified demographic data, ADHD diagnostic data, and baseline VADPRS scores were analyzed. The current project was granted a secondary data analysis exemption by the University of Pittsburgh IRB.
Participants
Participants for the original study were recruited through either PCP or self-referral for behavioral concerns (N = 321). Children ages 5 to 12 who screened positive for behavioral concerns were invited for full intakes. At the full intake, if eligibility was confirmed, the child and parent completed multiple self-report forms, including the VADPRS, and underwent a diagnostic/clinical interview for formal ADHD and comorbid disorder diagnoses. Details of the full study and recruitment process are published elsewhere (Kolko et al., 2014). Study participants were 65% male and 35% female, 81% White, and 21% Black with an average age of 8.0 years (SD = 2.0). Seven children identified as Hispanic (2%), and no children identified as American Indian or Alaskan Native, Asian, or Native Hawaiian or Pacific Islander; 42% of parents report having completed a 4-year college degree.
Of the 321 study subjects, 44 (14%) had a predominantly inattentive ADHD diagnosis, 38 (12%) had a predominantly hyperactive ADHD diagnosis, and 112 (35%) had a combined ADHD diagnosis. 12 had an “unspecified” ADHD diagnosis that could not be categorized into one of the primary presentations of inattentive, hyperactive/impulsive, or combined presentation of ADHD. Given the aims of the current study to evaluate for hyperactive/impulsive symptoms and diagnoses, these participants were excluded from analysis. Two additional participants (both with no ADHD diagnosis) had incomplete hyperactive/impulsive VADPRS subscale data and were excluded. These exclusions resulted in 307 study participants, of whom 49% had a diagnosis of hyperactive/impulsive or combined presentation ADHD.
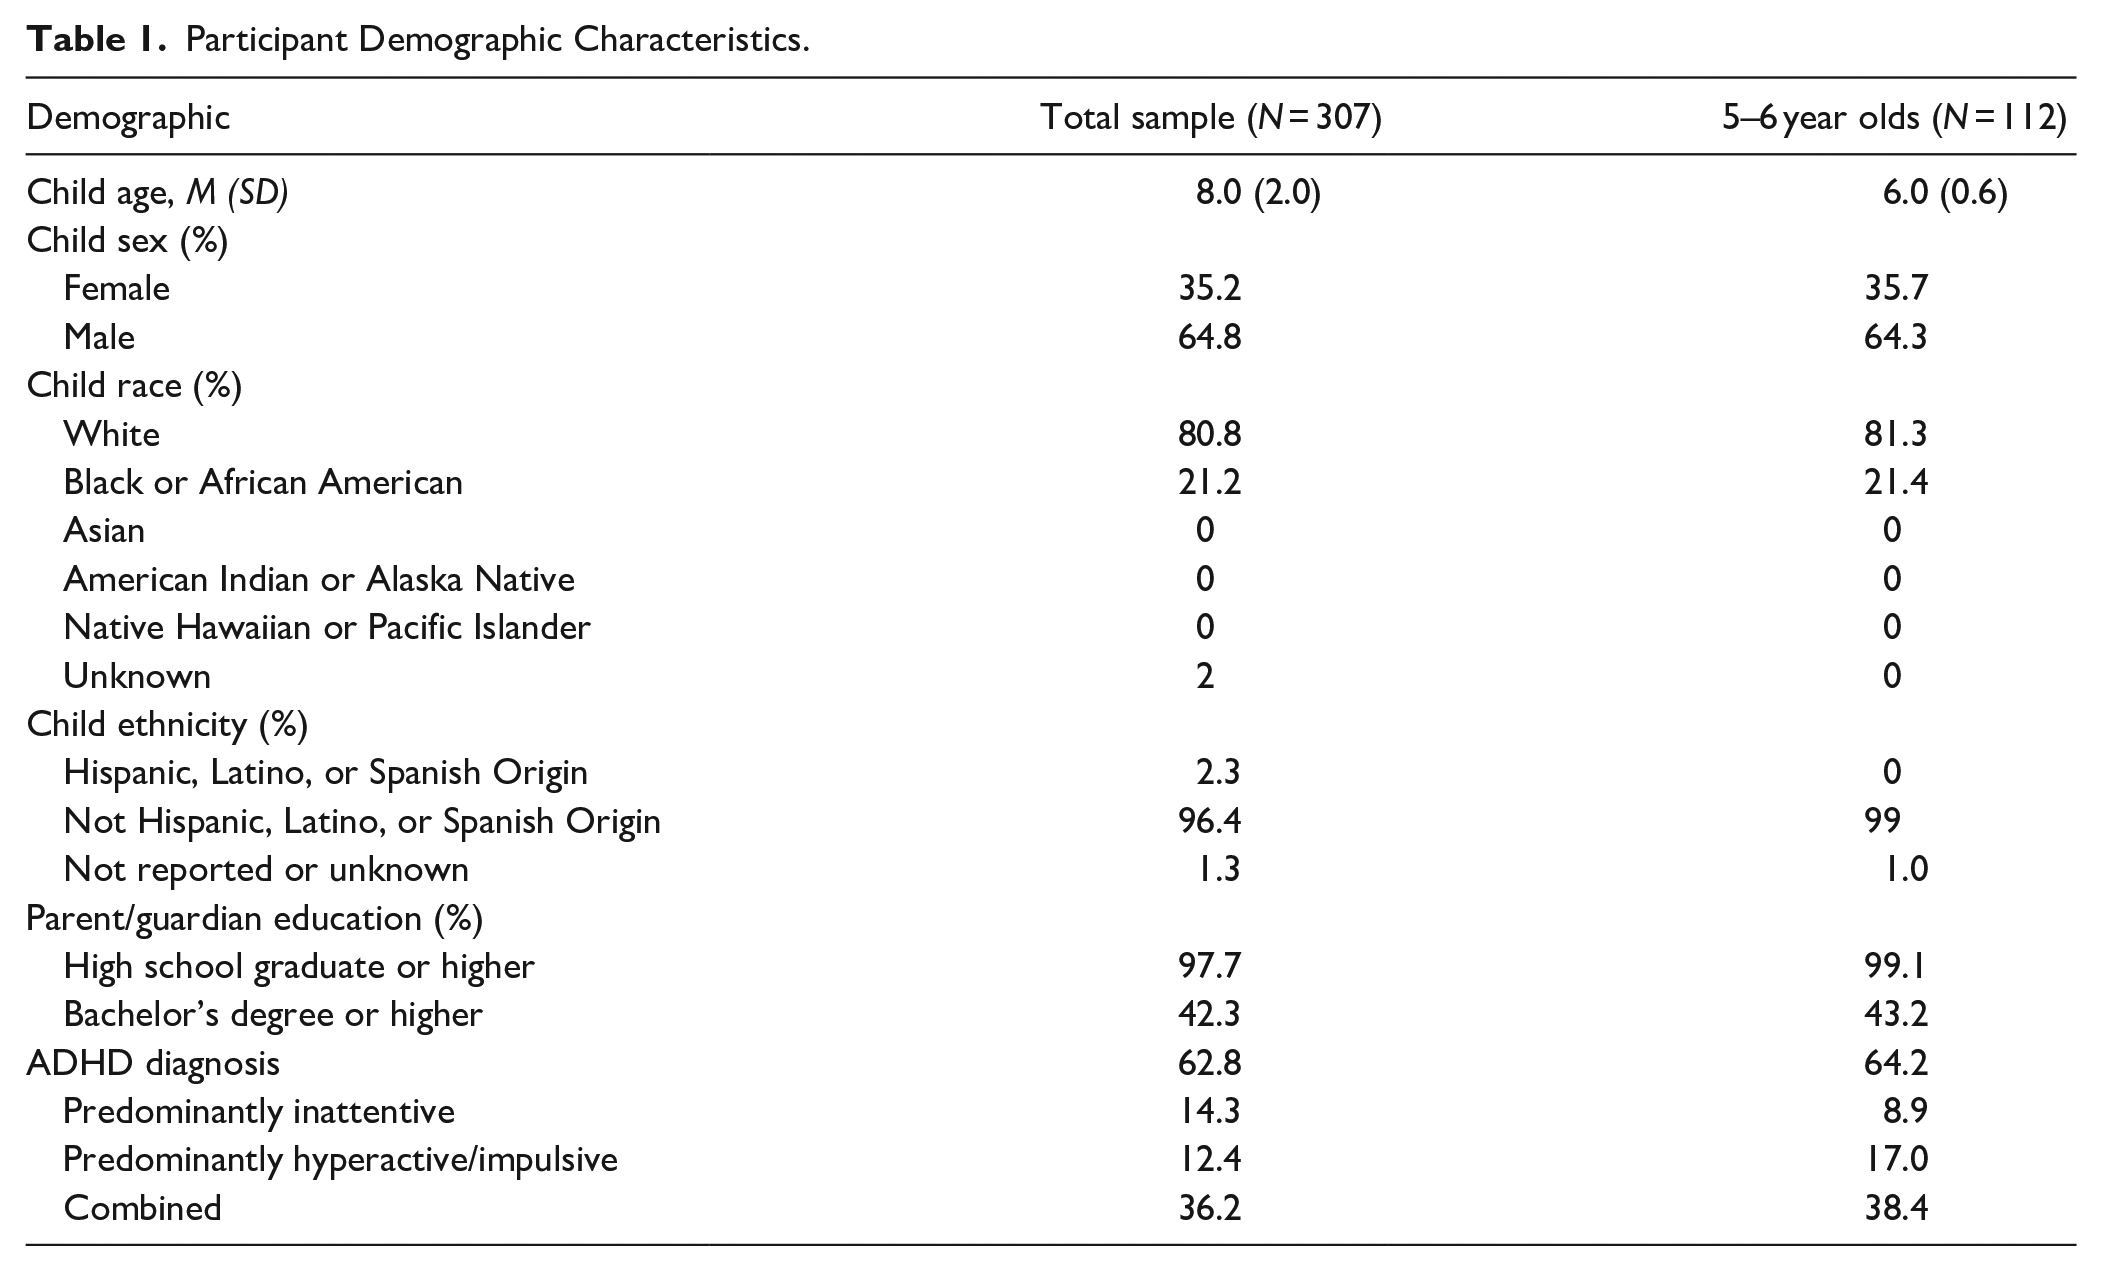
A subsample of all the 5- to 6-year-old children was used for age-group analysis. This 5 to 6 year old subsample was created in an attempt to evaluate the potential bias of age in the younger age group in which the findings would be expected to be most pronounced. This size group was chosen to provide adequate sample size for evaluation while remaining fully within the range where the greatest effect was present in other studies (Bonati et al., 2018; Chen et al., 2016). In this subsample there were 112 children, of whom 55% had a hyperactive/impulsive or combined presentation ADHD diagnosis. The subsample was 64% male and 36% female, 81% White, and 21% Black. No parents reported their child as having Hispanic ethnicity, American Indian or Alaskan Native, Asian, or Native Hawaiian or Pacific Islander racial identity. 43% of the parents of these children report having completed a 4-year college degree. Full participant demographics for the full sample and 5 to 6 year old subset are presented in Table 1.
Participant Demographic Characteristics.
Measures
Vanderbilt Attention Deficit-Hyperactivity Disorder Diagnostic Parent Rating Scale (VADPRS)
ADHD symptom screening was performed using the Vanderbilt Attention Deficit-Hyperactivity Disorder Diagnostic Parent Rating Scale (VADPRS) (Wolraich et al., 2003; Wolraich, Hannah, et al., 1998). This scale consists of 45 total items to assess for the presence of symptoms associated with ADHD and several common comorbidities including oppositional defiant disorder (ODD), conduct disorder (CD), and anxiety and depression. All of the items are scored on a Likert scale of 0 to 3 to score the presence of the listed symptom (0 = never, 1 = sometimes, 2 = often, 3 = very often). For the published scoring, a symptom is considered present if the Likert score is 2 or 3. The first 18 items assess for ADHD symptoms, the first nine of which assess for inattentive symptoms while the second nine assess for hyperactive-impulsive symptoms. The scale does additionally include eight functional impairment questions on an extended 0 to 5 Likert scale to assess the impact of the child’s behavior on their functioning.
Kiddie-Schedule for Affective Disorders and Schizophrenia (K-SADS)
The diagnostic “gold standard” utilized in our study was determined by an abbreviated version of the K-SADS (Kaufman et al., 1997). This diagnostic interview was conducted separately with the child and parent at the study onset and the results were used to establish baseline diagnoses. While additional disorders were diagnosed with the K-SADS, the present study only incorporated the ADHD diagnoses into analysis.
Data Analyses
The deidentified data was extracted and supplemented with recoded overall percentiles and age-based percentiles (Anderson et al., 2022) using R language (R Core Team, 2022) and prepared for analysis. All subsequent analyses were performed in SPSS v.28, IBM Corp. Baseline descriptive statistics were calculated. Following baseline calculation, each analysis was performed upon two distinct groups: the overall sample (N = 307) and all 5 to 6 year old children (N = 112).
To evaluate the role of age-based percentiles, VADPRS raw data was recoded into both overall percentiles irrespective of age and age-based percentiles which were recently published (Anderson et al., 2022). Logistic regression, with age as the predictor and ADHD hyperactive or combined diagnosis as the outcome, was performed for each of the groups described above for both the overall percentiles and age-based percentiles, with Nagelkerke’s pseudo-R square statistic (R2), unstandardized regression coefficient (B), and the regression coefficient standard error (SE) reported. The area under the ROC curve (AUC) was also calculated for each of the analyses. Confidence intervals for the AUC were calculated and used to evaluate for significant differences between the models.
To evaluate the effectiveness of the VADPRS, simple statistics of the VADPRS of sensitivity and specificity were calculated for both the total sample and the 5 to 6 year old subgroup, as well as the positive predictive value (PPV) and negative predictive value (NPV) for our sample population. Binary logistic regression, with the same predictor and outcome, was also performed for each above-defined group for the symptom count scoring, with the same analysis and fit statistics reported.
Results
Participant scoring on the hyperactivity/impulsivity subscale of the VADPRS (raw scores: 0–27, symptom count: 0–9) are included in Table 2. The participants had a mean raw score of 14.6 (SD = 6.7) for the overall sample, with the 5 to 6 year old group having a mean score of 16.2 (SD = 6.0). These scores correspond to symptom counts of 4.8 (SD = 3.0) for the entire sample and 5.5 (SD = 2.9) for the 5 to 6 year old group. Overall, the VADPRS performed well with sensitivity of 81% and specificity of 87% for the overall sample. With 49% of the sample having a hyperactive/impulsive or combined presentation ADHD diagnosis, the PPV and NPV of the hyperactivity subscale were 85% and 83%, respectively.
VADPRS Hyperactive Subscale Scoring.

Note. Sensitivity and specificity utilize symptom count cut-off of 6. PPV = positive predictive value; NPV = negative predictive value.
Age-Based Modeling Comparison
Logistic regression analysis was then performed on the total sample and the subset of children age 5 or 6 using both the overall percentiles and age-based percentiles. Full results are presented in Table 3 and the ROC curves are included as Figure 1. For the full sample, the overall percentile logistic regression was significant with omnibus chi-square statistic of 151.4 (p < .001). The Nagelkerke pseudo-R square value was R2 = 0.519, with unstandardized regression coefficient (B) of 0.125, SE = 0.016, p < .001. Calculation of the AUC [95% CI] yielded 0.906 [0.872, 0.939]. For the same total sample, the age-based percentile logistic regression was unchanged, with chi-square 159.9 (p < .001), R2 = 0.541, B = 0.126, SE = 0.017, p < .001 with a calculated AUC of 0.908 [0.875, 0.940].
Age-Based Regression Analysis with Age as Predictor and Diagnosis as Outcome.

Note. R2 = Nagelkerke’s Pseudo-R square statistic; B = unstandardized regression coefficient; SE = standard error of regression coefficient; AUROC = area under receiver operating characteristic curve.
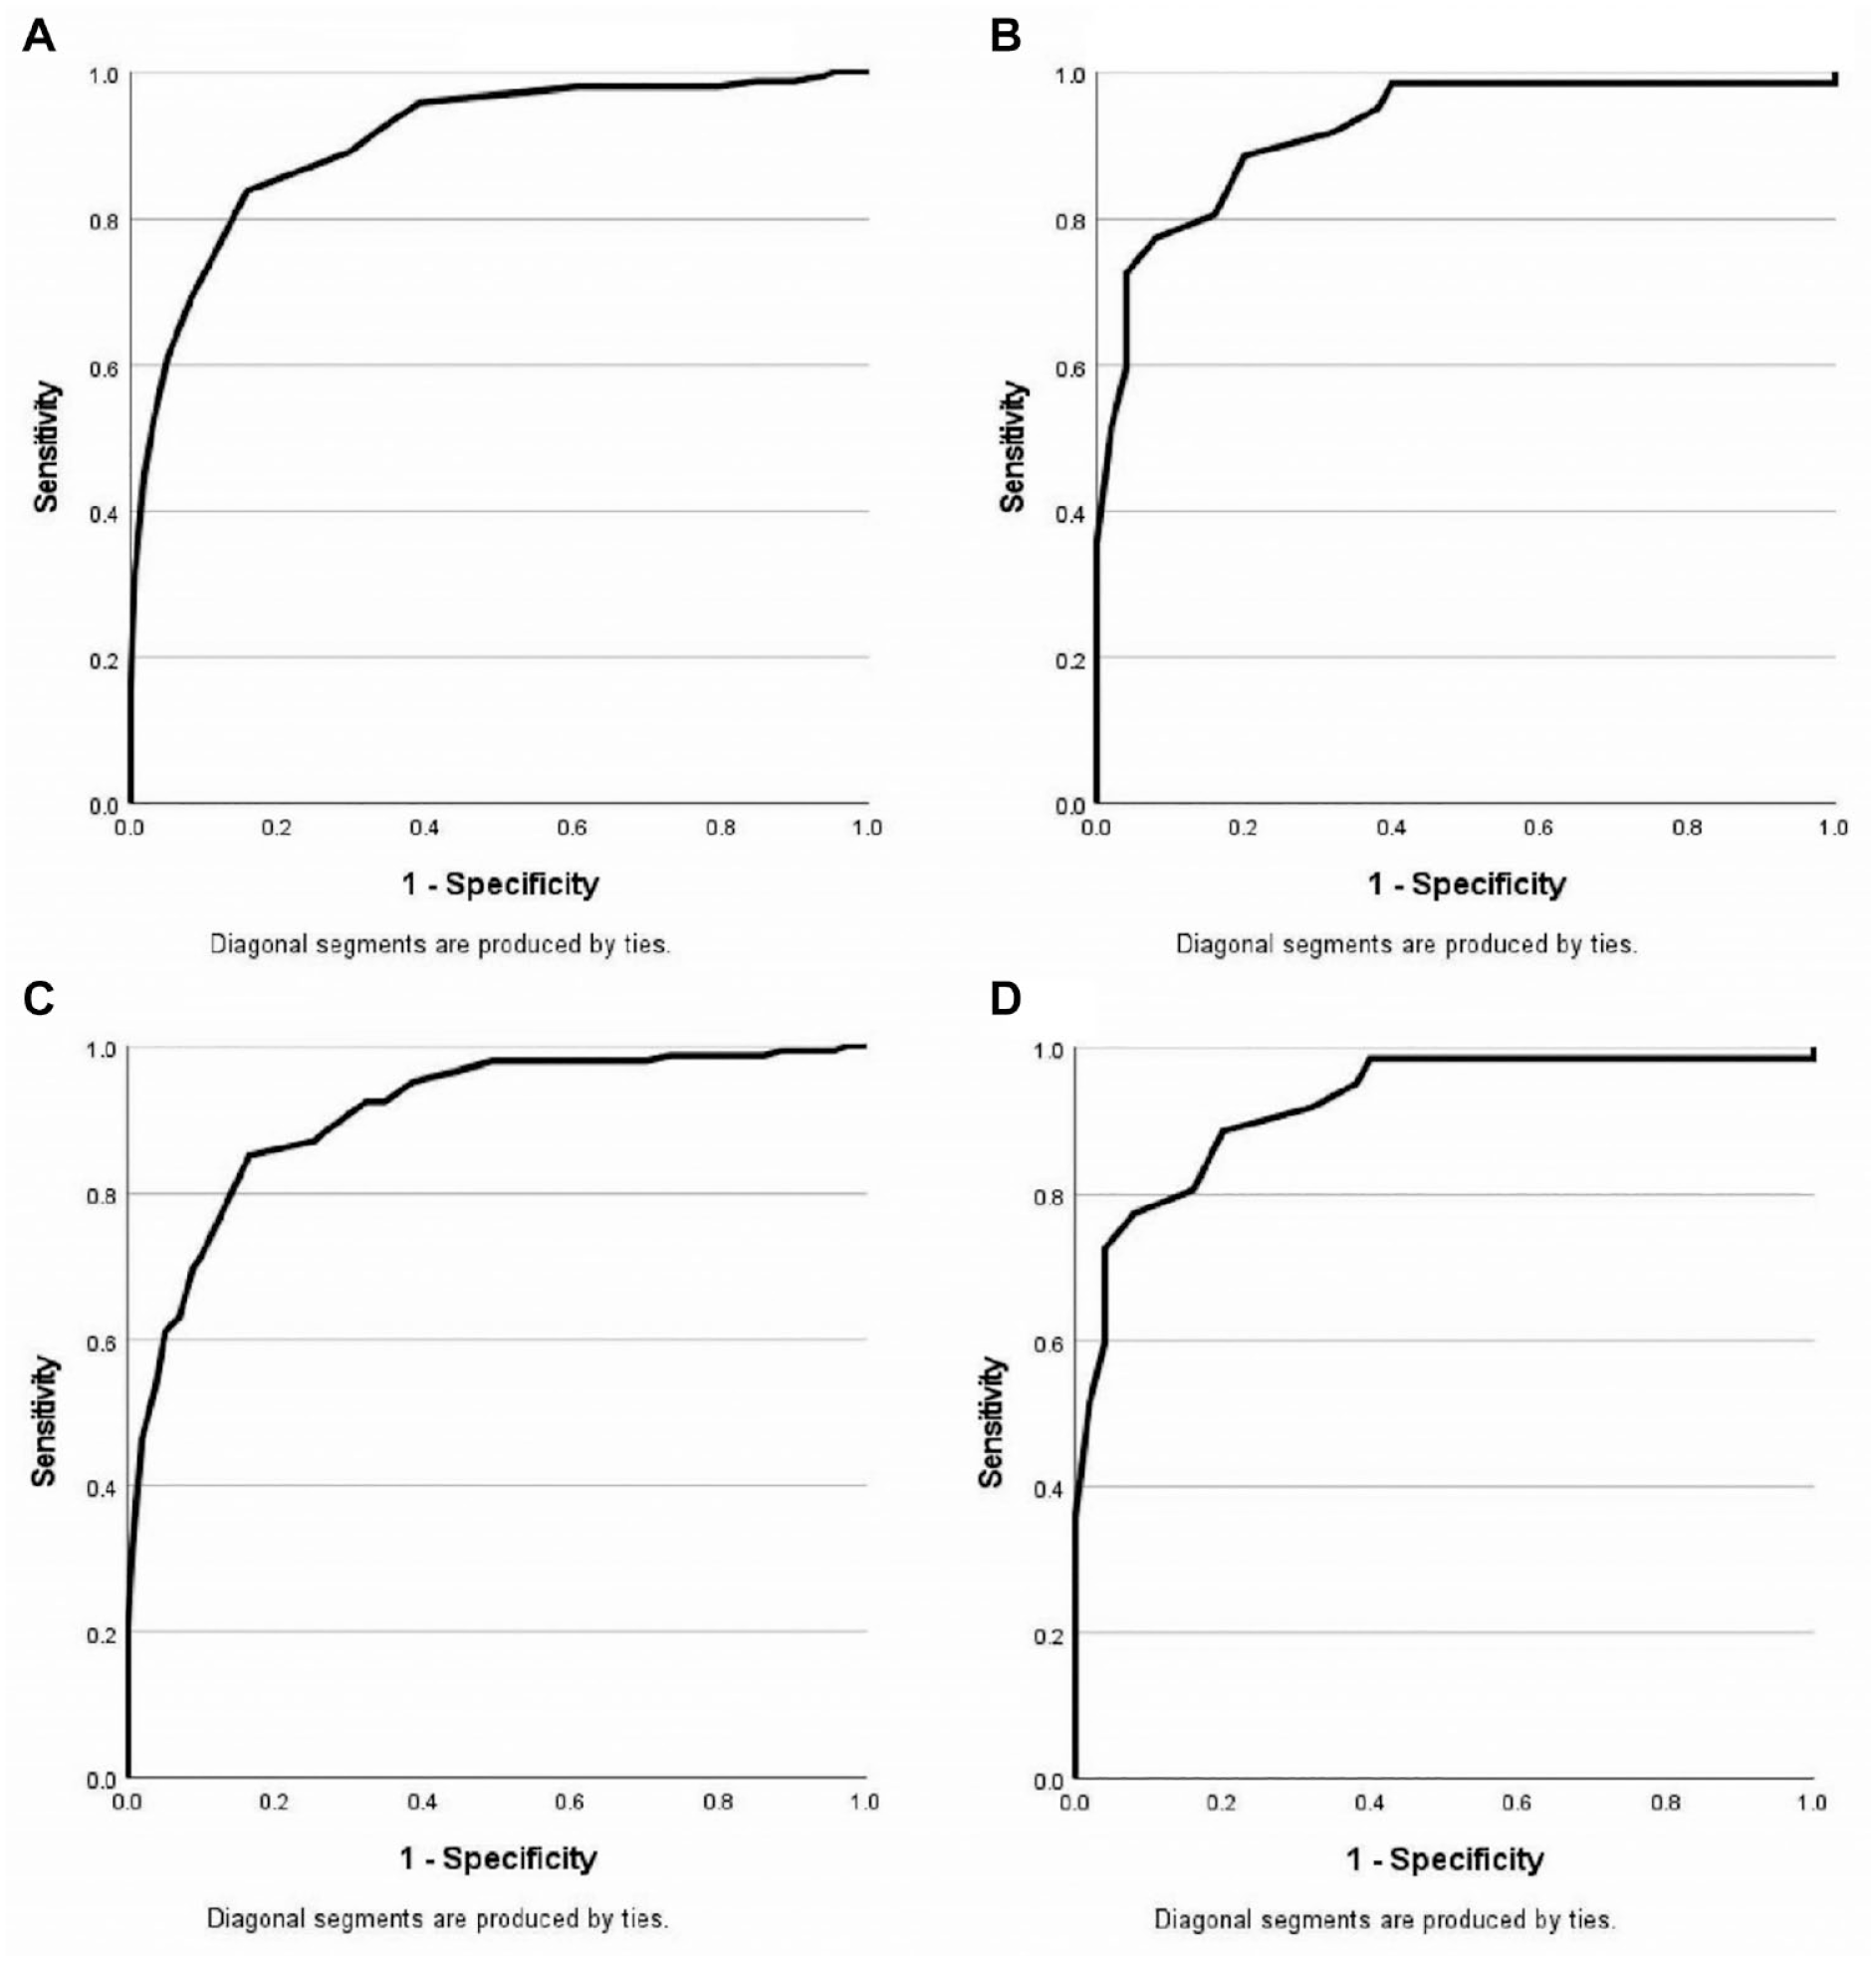
Age-based ROC curves.
For the younger age group of 5 to 6 year old subjects, the overall models were again both significant in omnibus tests. The R2 value was R2 = 0.517, B = 0.151, SE = 0.032, p < .001 for the overall percentiles with the AUC = 0.921 [0.871, 0.972]. For the age-based percentiles, the results were similar with overall model significance, R2 = 0.531, B = 0.131, SE = 0.028, p < .001, and AUC = 0.921 [0.871, 0.972].
VADPRS Symptom Counts
Logistic regression was performed on the whole sample, as well as in the 5 to 6 year old age group, in order to evaluate the predictive utility of the symptom count scoring of the hyperactivity/impulsivity subscale of the VADPRS in screening for an ADHD hyperactive/impulsive or combined presentation diagnosis. Results are included in Table 4 and ROC curves are included as Figure 2. The logistic regression models were both significant. The full sample regression analysis yielded R2 = 0.618, B = 0.765, SE = 0.079, p < .001, and AUC = 0.909 [0.876, 0.942]. For the 5 to 6 year old subset values were not statistically significantly different due to overlapping confidence intervals, with R2 = 0.637, B = 0.823, SE = 0.143, p < .001, and AUC = 0.919 [0.869, 0.969].
VADPRS Scoring Regression Analysis with Age as Predictor and Diagnosis as Outcome.

Note. R2 = Nagelkerke’s Pseudo-R square statistic; B = unstandardized regression coefficient; SE = standard error of regression coefficient; AUROC = area under receiver operating characteristic curve.
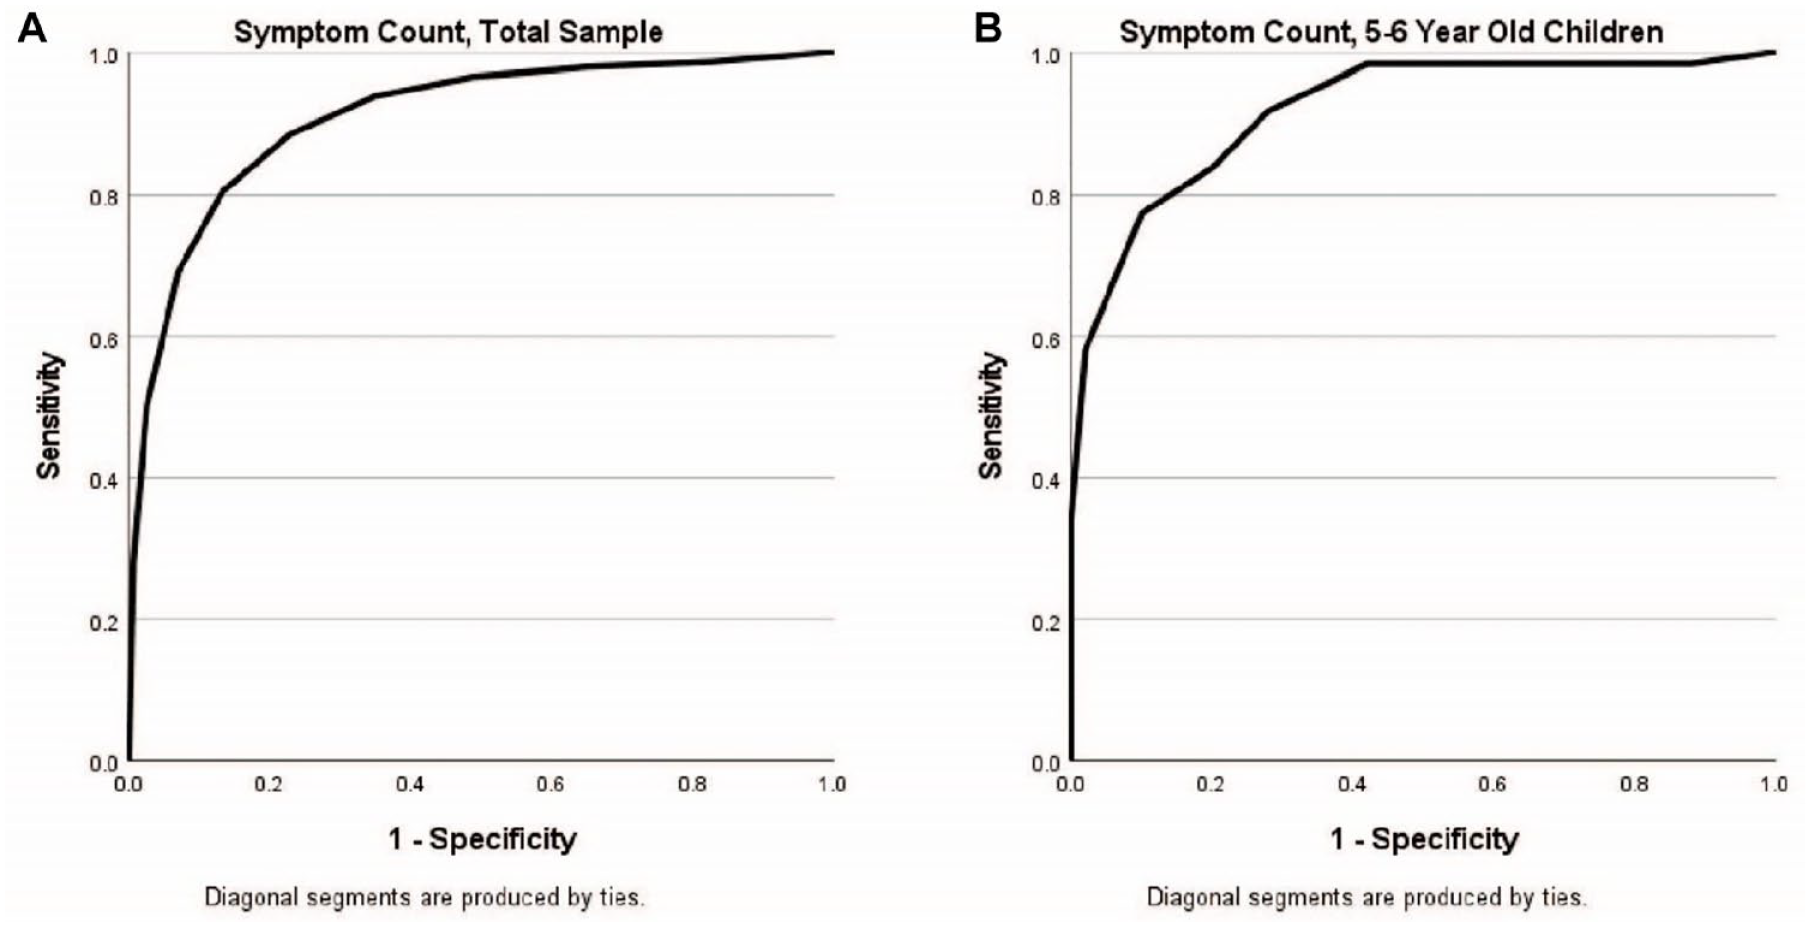
VADPRS scoring ROC curves.
Discussion
Age-based Bias
The analysis of the data in regards to potential age-based bias yields no difference between age-based percentiles and overall percentiles in evaluating hyperactive presentations of ADHD. The logistic regression fit statistics were similar between the age-based percentiles and the overall percentile classification with overlapping AUC confidence intervals, indicating no statistical difference between the two models. The similarity of fit statistics and overlapping AUC confidence intervals persist when evaluating 5 to 6 year old children as a subset.
The finding of no difference between the models when using the hyperactivity/impulsivity subscale overall percentile or age-based percentiles provides helpful context to age-based differences in ADHD scoring on the VADPRS. The percentiles recently published in the literature could still serve a purpose in clinical evaluation of ADHD and monitoring of improvement in symptom burden over time or with treatment, but the present findings demonstrate that age-based differences in scoring do not have utility in screening for ADHD. Even in younger children, where the age-based bias has been identified as of greater magnitude (Bonati et al., 2018; Chen et al., 2016), age-based percentiles do not improve modeling of ADHD hyperactive/impulsive presentation diagnosis and do not offer incremental utility in clinical screening for hyperactive/impulsive presentations of ADHD.
Effectiveness of the VADPRS
The VADPRS is commonly used for ADHD screening due to both its ease of use and its alignment with the diagnostic criteria for ADHD. The symptom count scoring of the VADPRS analyzed in the same format as the percentiles above demonstrated good model fit in both the entire sample and the 5 to 6 year old subsample when assessed with a gold standard of diagnosis of hyperactive/impulsive or combined presentation ADHD. The good model fit is not surprising given that the ADHD subscales of the VADPRS are aligned perfectly with the diagnostic criteria for ADHD, leading to a closer alignment between the gold standard of diagnosis and the symptom count screening scores in our study population.
The hyperactivity/impulsivity subscale of the VADPRS performed well in our sample with its traditional symptom count cutoffs, with overall sensitivity of 81%—roughly equivalent to published values (80%)—and improved specificity (87% vs. 75%) (Bard et al., 2013). These features provide further support for the effectiveness of the use of the hyperactivity/impulsivity subscale of the VADPRS in its current form without need for further age-based considerations. Diagnosticians appear to be appropriately considering age and developmental appropriateness when making a diagnosis of hyperactive/impulsive or combined presentations of ADHD.
Strengths and Limitations
This study benefits from its ability to analyze the hyperactivity/impulsivity subscale of the VADPRS in comparison to a gold standard diagnosis of ADHD through a structured interview. The sample size is large enough to comfortably allow for the analysis of the age-based percentiles in both the 5 to 12 year old patient range as well as in a smaller subsample of the youngest children. Though the sample size is more than adequate for the analysis performed, evaluation of relative age bias could not be reliably performed in a similar manner given the small number of individuals in each birth month. With substantial focus in the literature on relative age, such analysis would have been of interest and is an area of potential future inquiry.
Conclusion
Evaluation of the VADPRS in a clinical population demonstrates strong performance of the hyperactivity subscale of the VADPRS in screening of children who have a predominantly hyperactive/impulsive or combined presentation ADHD. Evaluation of the hyperactivity/impulsivity subscale of the VADPRS with respect to age yields no difference from the general evaluation, thus providing reassurance against concerns of potential age-based bias in the use of the hyperactive subscale of the VADPRS.
Footnotes
Declaration of Conflicting Interests
The author(s) declared no potential conflicts of interest with respect to the research, authorship, and/or publication of this article.
Funding
The author(s) disclosed receipt of the following financial support for the research, authorship, and/or publication of this article: This data analyzed in this manuscript were collected during a study supported by National Institute of Mental Health grant 063272, directed by David Kolko.