
Abstract
A quantitative structure-activity relationship (QSAR) model has been developed between cytotoxic activity and structural properties by considering a data set of 119 podophyllotoxin analogs based on 2D and 3D structural descriptors. A systematic stepwise searching approach of zero tests, a missing value test, a simple correlation test, a multicollinearity test, and a genetic algorithm method of variable selection was used to generate the model. A statistically significant model (r train 2 = 0.906; q cv 2 = 0.893) was obtained with the molecular descriptors. The robustness of the QSAR model was characterized by the values of the internal leave-one-out cross-validated regression coefficient (q cv 2) for the training set and r test 2 for the test set. The overall root mean square error (RMSE) between the experimental and predicted pIC50 value was 0.265 and r test 2 = 0.824, revealing good predictability of the QSAR model. For an external data set of 16 podophyllotoxin analogs, the QSAR model was able to predict the tubulin polymerization inhibition and mechanistically cytotoxic activity with an RMSE value of 0.295 in comparison to experimental values. The QSAR model developed in this study shall aid further design of novel potent podophyllotoxin derivatives.
Keywords
Introduction
P
QSAR is one of the most important methods in chemometrics, which gives information that is useful for drug design and medicinal chemistry. 6,7 It correlates the biological activity of the molecules to their physical or chemical parameters. 8,9 There are many examples available in literature in which QSAR models have been used successfully for the screening of compounds for biological activity. 10-13 Although comparative molecular field analyses (CoMFA) are statistically excellent and offer good predictive performance, they are inherently limited to the need to align with the database molecules correctly within 3D space. Nevertheless, especially for structurally diverse molecules, unambiguous 3D alignment to initiate the CoMFA process is still a difficult task. The determination of the “active” conformation that each compound will retain is a critical issue due to the unavailability of X-ray structure. We should have some knowledge or hypothesis regarding active conformations of the molecules under study as a prerequisite for structural alignment. Hence, the developed models based on CoMFA may not suit the drug design because of a false conformational hypothesis. However, we were motivated to explore possible alternatives that would use alignment free descriptors derived from 2D or 3D molecular topology and thus alleviate frequent ambiguity of structural alignment typical of 3D QSAR methods. Accordingly, in this QSAR study, we have applied E-state, electronic, structural, topological, quantum mechanics, and physicochemical-based descriptors, which can be calculated without structural alignments. The behavior of QSAR model is examined with a variety of statistical parameters, 14 and the contribution of various descriptors is analyzed.
Materials and Methods
Core structure of podophyllotoxin
The scaffold structure of the natural podophyllotoxin consists of 5 rings—namely, the A, B, C, D, and E rings (
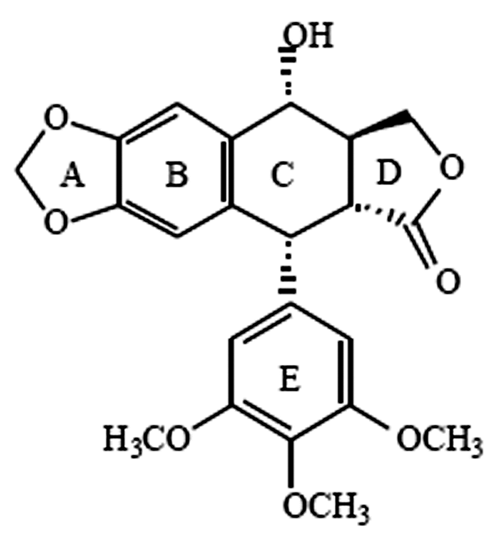
The scaffold structure of podophyllotoxin.
Data set
A total of 119 podophyllotoxin analogs were used in the study and were taken from various sources belonging to different ring modifications. These molecules were divided randomly into 81 molecules in the training set and 38 molecules in the test set. The analogs included in
Podophyllotoxin Derivatives (Tetraline Lactones) with Cytotoxic Activities against the P-388 Cell Line


Podophyllotoxin Derivatives (Nonlactonic Tetralines) with Cytotoxic Activities against the P-388 Cell Line and New Proposed Structural Derivatives with Unknown Cytotoxic Activity

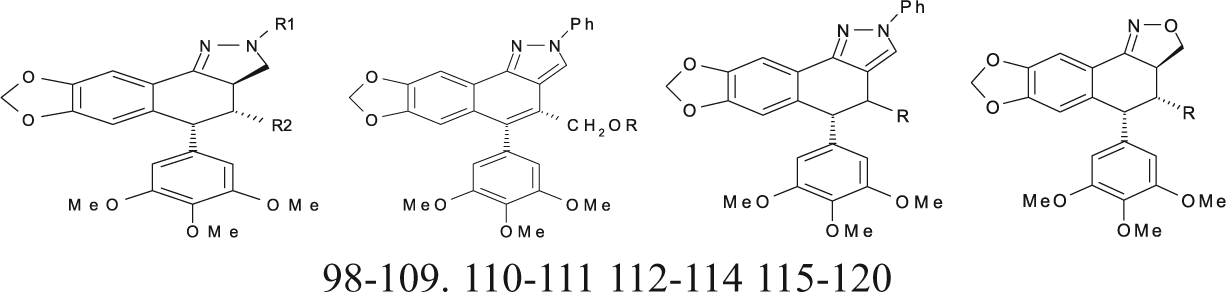
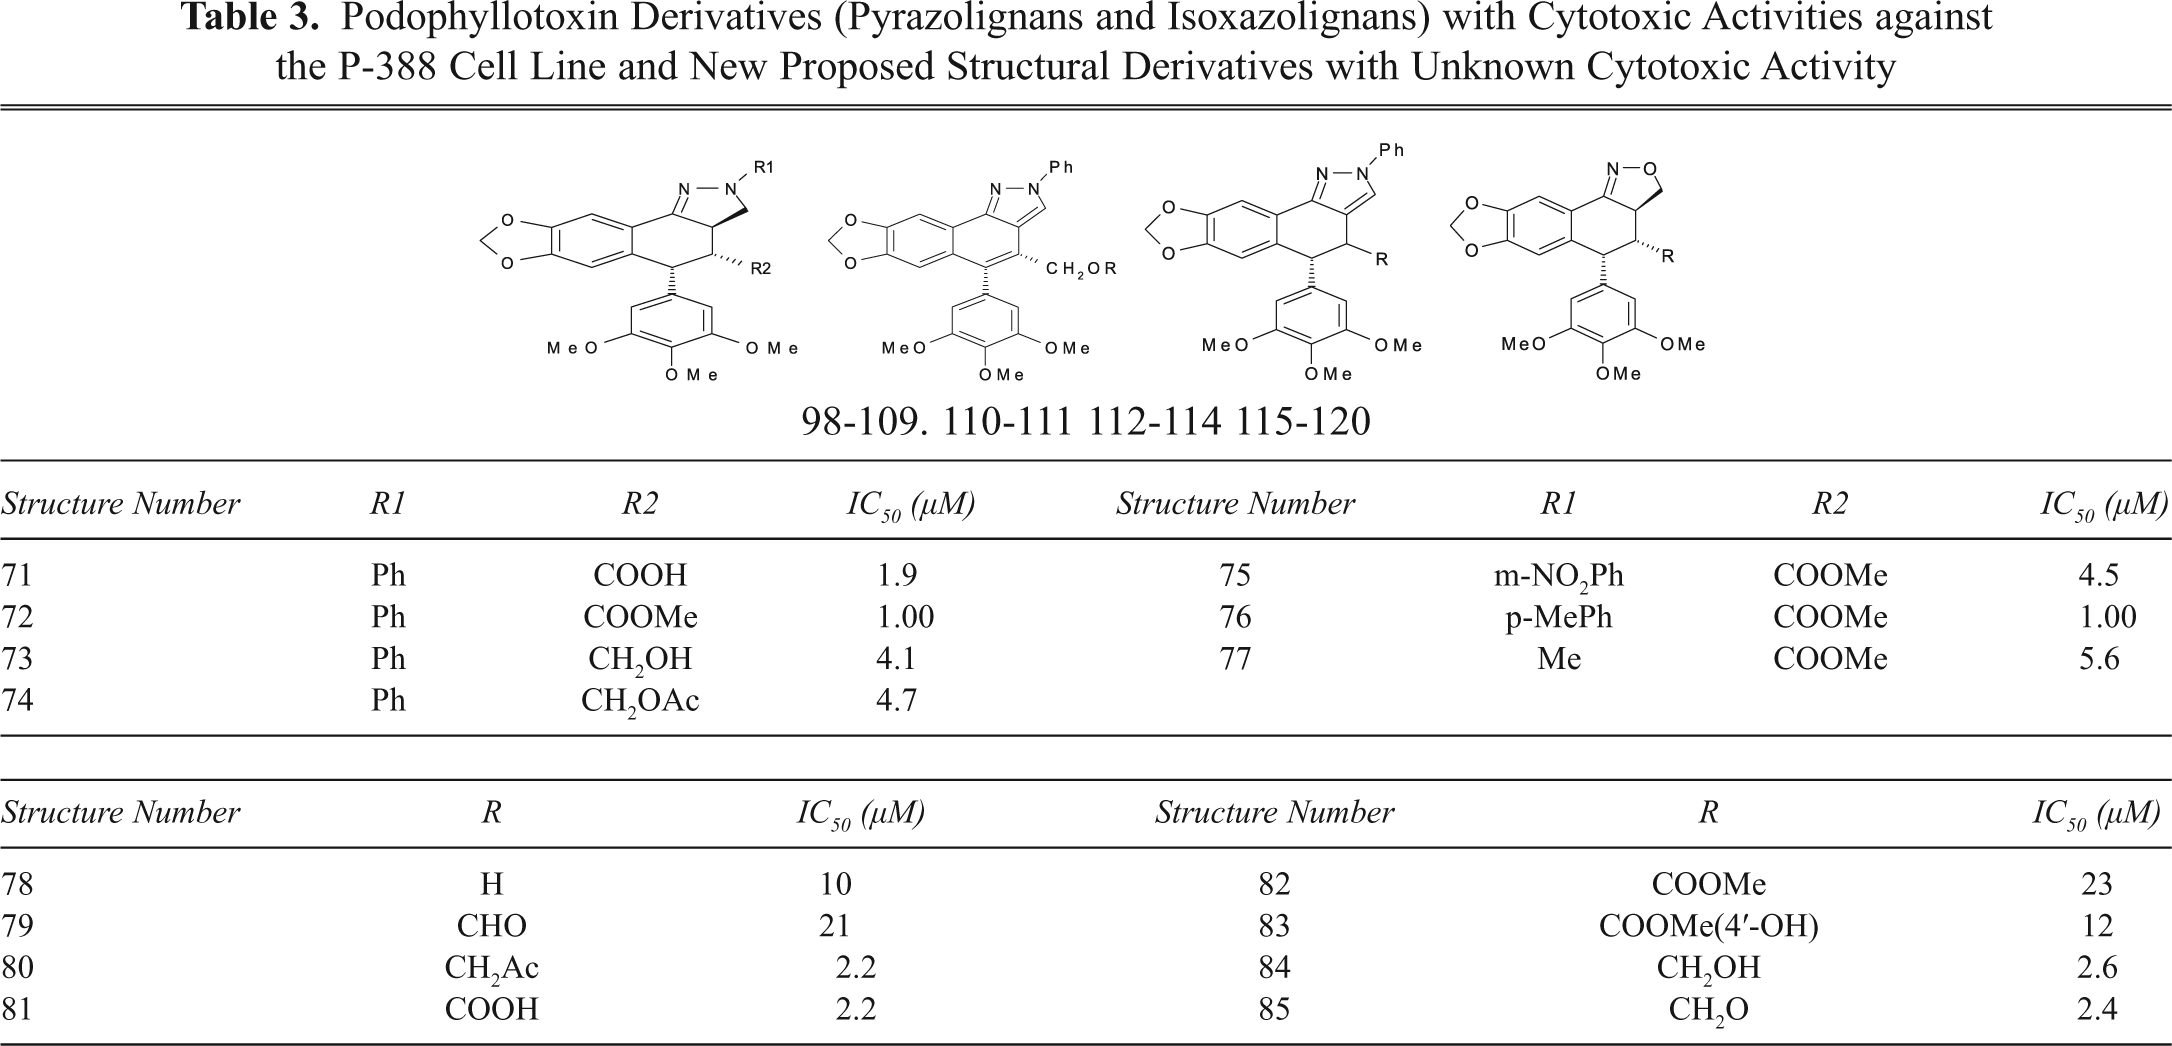
Podophyllotoxin Derivatives (Pyrazolignans and Isoxazolignans) with Cytotoxic Activities against the P-388 Cell Line and New Proposed Structural Derivatives with Unknown Cytotoxic Activity
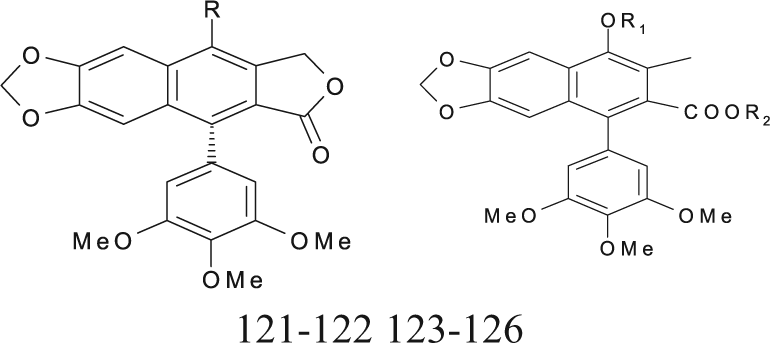
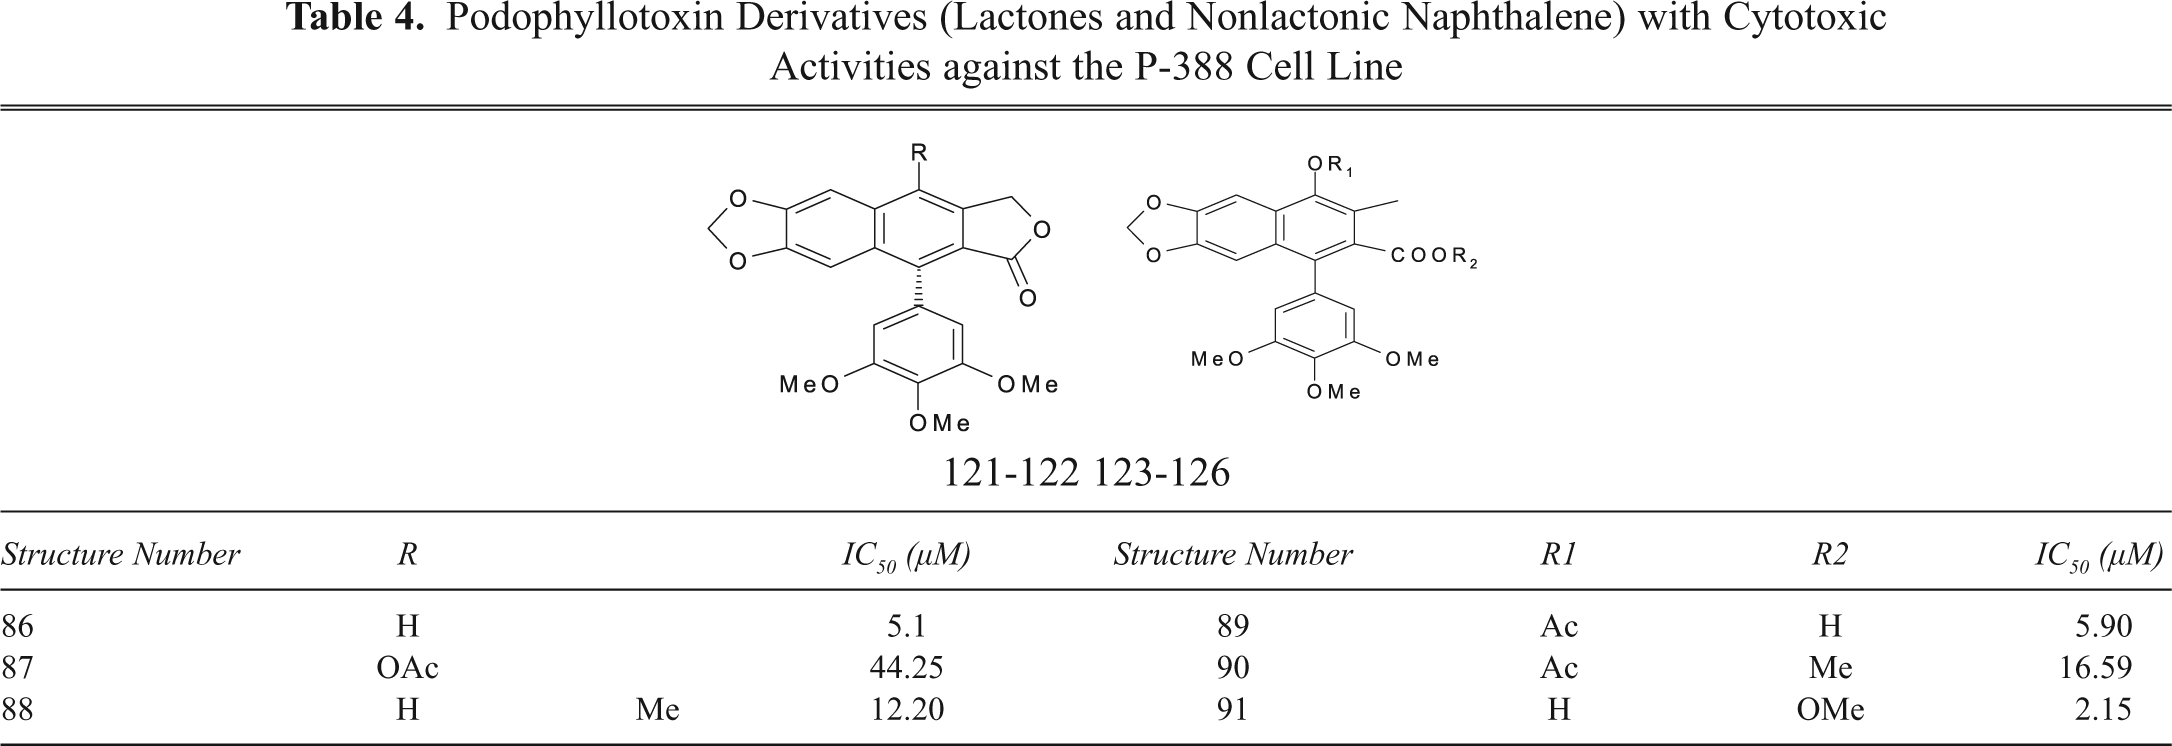
Podophyllotoxin Derivatives (Lactones and Nonlactonic Naphthalene) with Cytotoxic Activities against the P-388 Cell Line
Aza-Podophyllotoxin Derivatives with Cytotoxic Activities against the P-388 Cell Line
Sublib-I, commonly known as tetralinelactones, consists of 29 compounds (1-29;
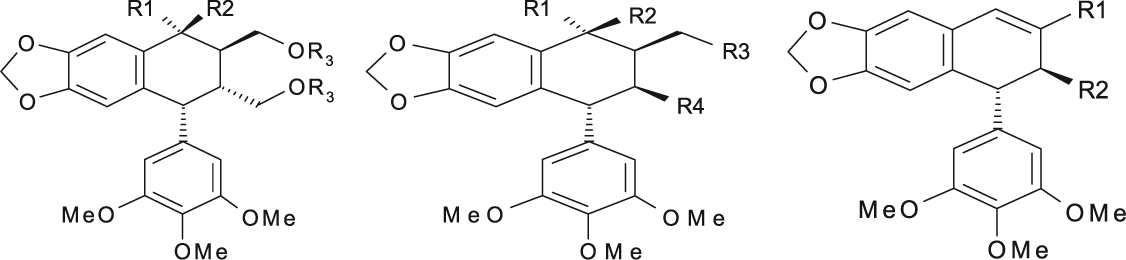
Sublib-II contains compounds (30-70) known as nonlactonic tetralines (
Sublib-III also includes a group of lignans (71-85) that have heterocyclic rings fused to the cyclolignan skeleton (
Sublib-IV includes the compounds (86-91) commonly called lactonic and nonlactonic naphthalene (
Sublib-V contains compounds (92-119) commonly known as aza-podophyllotoxin analogs (
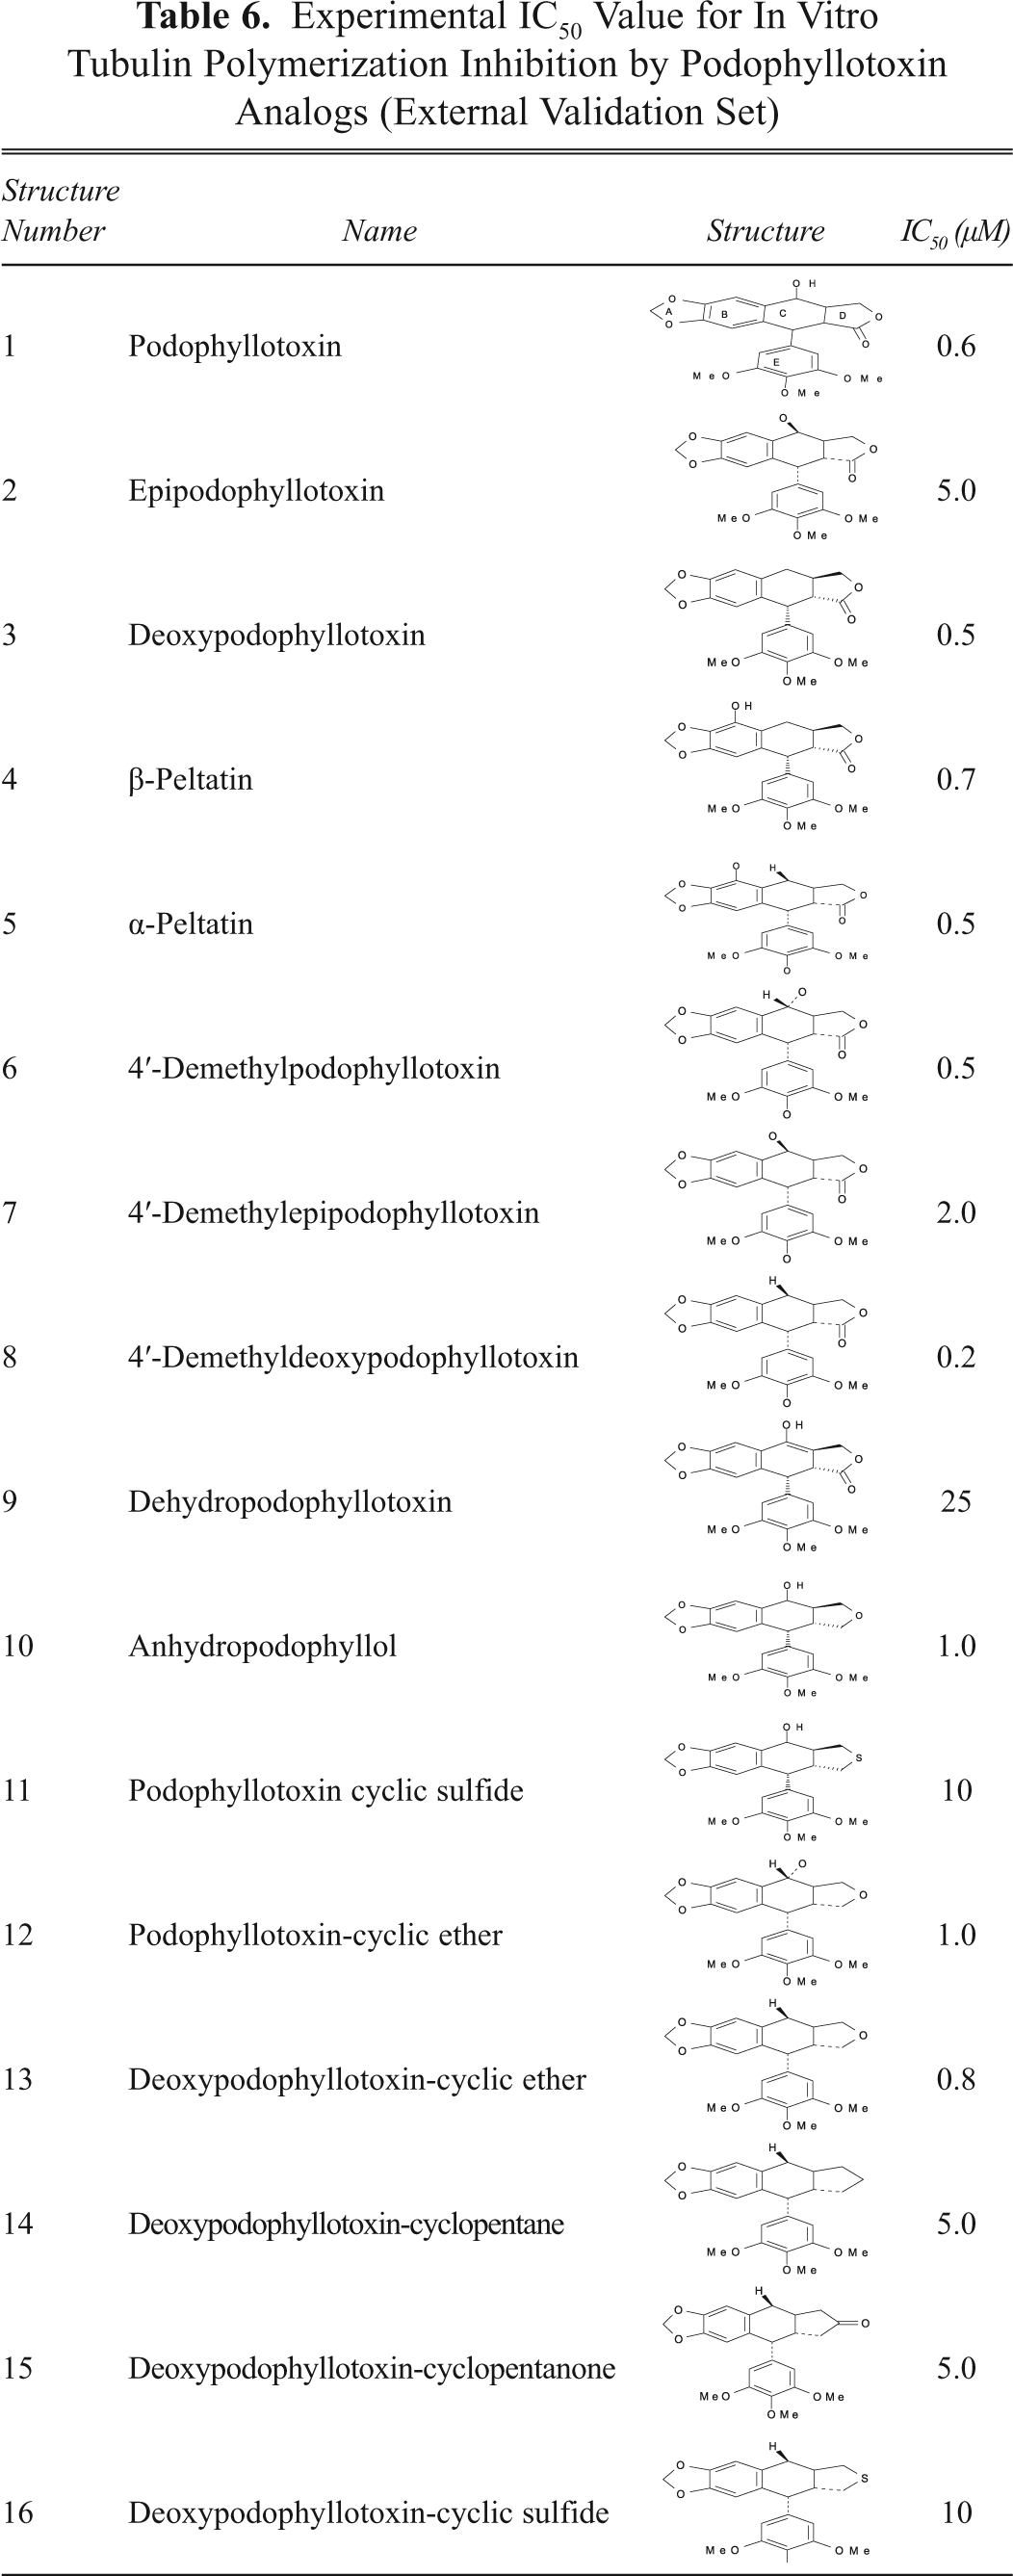
To use the QSAR model developed in this study for prediction of tubulin polymerization inhibition (TPI), we used an external data set of 16 podophyllotoxin derivatives that is included in
Experimental IC50 Value for In Vitro Tubulin Polymerization Inhibition by Podophyllotoxin Analogs (External Validation Set)
Building of molecular structures
All these podophyllotoxin analogs were built from the scaffolds by different ring modification and substitution of functional groups, as mentioned in
Descriptor calculation
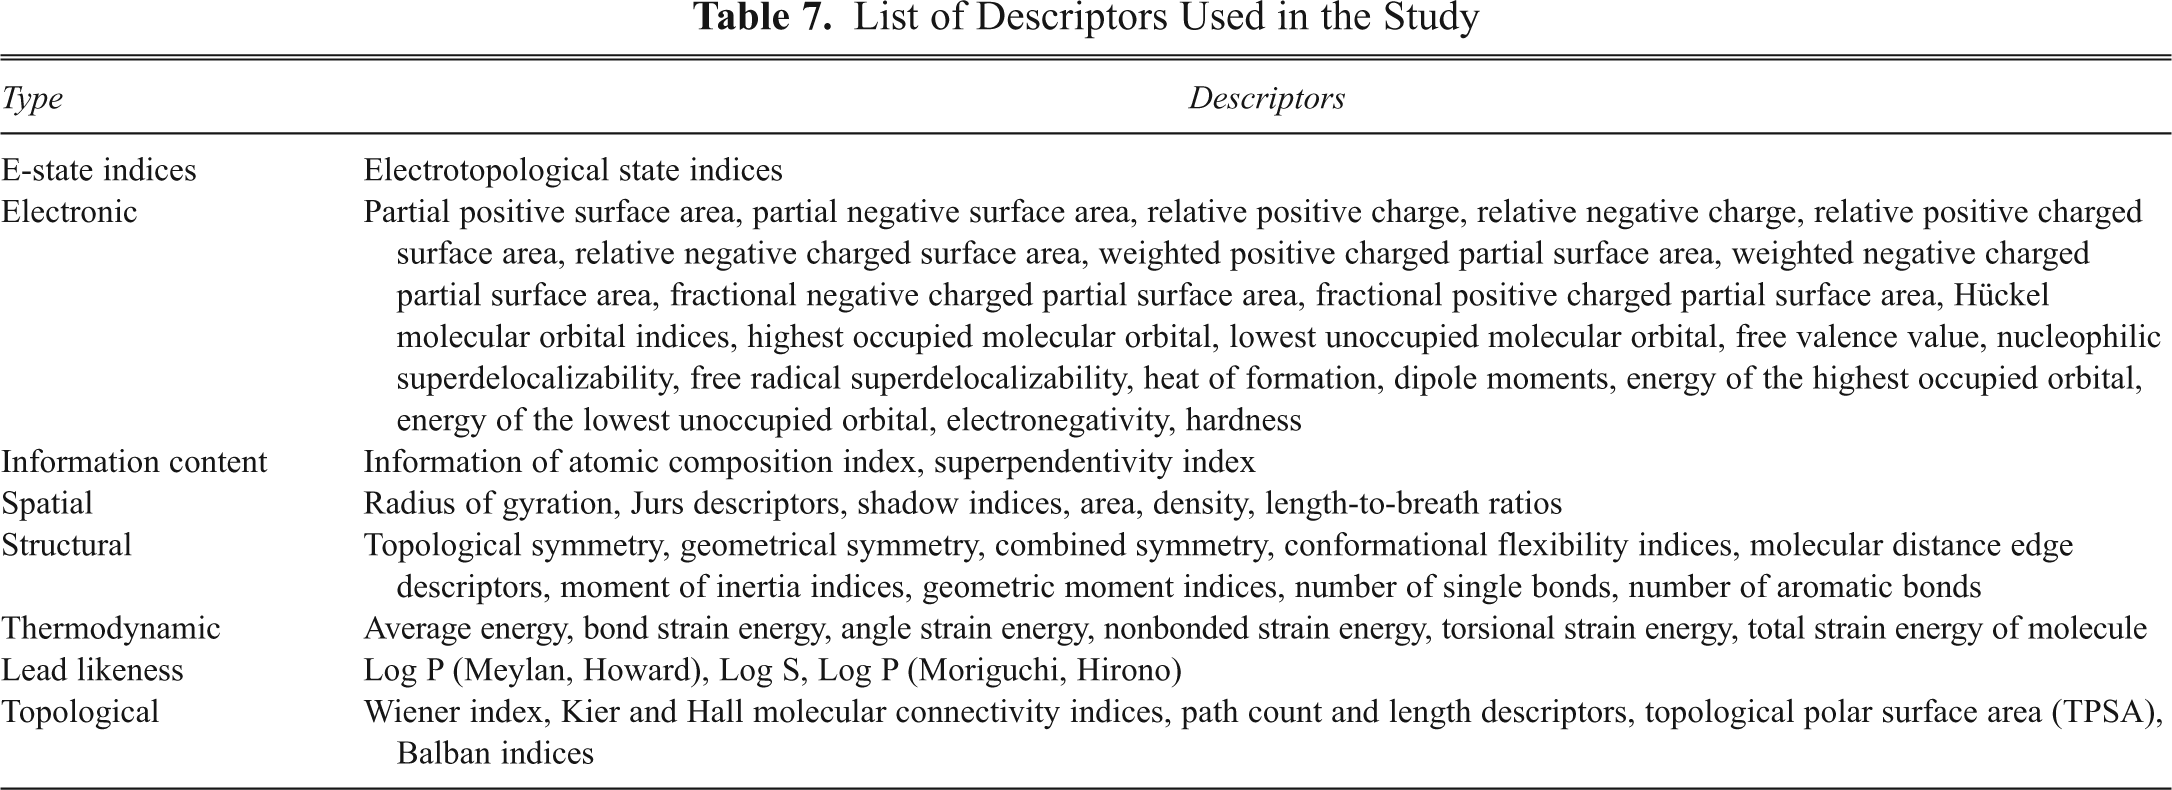
All the molecular descriptors such as E-state indices; log P; superpendentic index; structural, symmetrical, topological, lead likeness, electronic Wang-Ford atomic charge, and extended Hückel partial charge functions; bulk; moments; orbital energies; molecular connectivity indices; gravitational indices; hydrophobicity; steric and thermodynamic factors; and topological descriptors were calculated using ADME Model Builder software package (version 4.5).
20
These descriptors help differentiate the molecules mostly according to their size, degree of branching, flexibility, and overall shape. Some of the descriptors included in the study are listed and described in
List of Descriptors Used in the Study
Screening of descriptors and development of the QSAR model
A set of 372 molecular descriptors was calculated using the ADME Model Builder software package (version 4.5). A systematic search in the order of missing value test, zero test, correlation coefficient, multicollinearity, and genetic algorithm was performed to determine significant descriptors using the ADME Model Builder (version 4.5) software package. Any parameter that was not calculated (missing value) for any number of the compounds in the data set was rejected in the first step. Some of the descriptors were rejected because they contained a zero value for all the compounds (zero tests). To minimize the effect of collinearity and to avoid redundancy, a correlation matrix was developed with a cutoff value of 0.6 and the variables physically removed from the analysis that showed exact linear dependencies between subsets of the variables and multicollinearity (high multiple correlations between subsets of the variables). From the descriptors, the set of descriptors that would give the statistically best QSAR models was selected by using a genetic function approach implemented in the ADME Model Builder (version 4.5) software package. The genetic algorithm (GA) starts with the creation of a population of randomly generated parameter sets. The usage probability of a given parameter from the active set is 0.5 in any of the initial population sets. The sets are then compared according to their objective functions. The parameters set used for the GA includes mutation 0.1, crossover 0.9, population 300, number of generations 1000, r 2 floor limit 50%, and objective function r 2/N_par. The form of the objective function favors sets that have r 2 as high as possible while minimizing the number of parameters used as descriptors. The higher the score, the higher the probability that a given set will be used for the creation of the next generation of sets. Creation of a consecutive generation involves crossovers between set contents, as well as mutations. The algorithm runs until the desired number of generations is reached. Equations were developed between the observed activity and the descriptors. The best equation was taken based on statistical parameters such as squared regression coefficient (r 2) and leave-one-out cross-validated regression coefficient (q cv 2).
Validation of the QSAR model
The predictive capability of the QSAR equation was determined using the leave-one-out cross-validation method. The cross-validation regression coefficient (q cv 2) was calculated by the following equation:
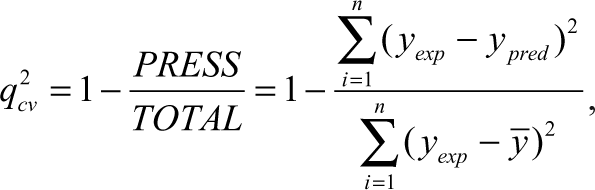
where y pred , y exp , and ỹ are the predicted, experimental, and mean values of experimental activity, respectively. Also, the accuracy of the prediction of the QSAR equation was validated by F value, r 2, and r adj 2. A large F indicates that the model fit is not a chance occurrence. It has been shown that a high value of statistical characteristics is not necessary for the proof of a highly predictive model. 21,22 Hence, to evaluate the predictive ability of our QSAR model, we used the method described by Golbraikh and Tropsha 21 and Roy and Roy. 22 The values of the correlation coefficient of predicted and actual activities and the correlation coefficient for regressions through the origin (predicted vs. actual activities and vice versa) were calculated using the regression of analysis Tool-pak option of Excel, and other parameters were calculated as reported by the above authors. 21,22 The determination coefficient in prediction, q test 2 , was calculated using the following equation 22 :
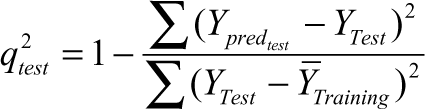
where Y predtest and Y Test are the predicted value based on the QSAR equation (model response) and experimental activity values, respectively, of the external test set compounds. Ȳ Training is the mean activity value of the training set compounds. Further evaluation of the predictive ability of the QSAR model for the external test set compounds was done by determining the value of rm 2 by the following equation 22 :
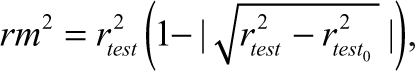
where r test 2 is the square correlation coefficient between experimental and predicted values and r 2 test 0 is the squared correlation coefficient between experimental and predicted values without intercept for the external test set compounds. The values of k and k′, slopes of the regression line of the predicted activity versus actual activity and vice versa, were calculated using the following equations 21 :
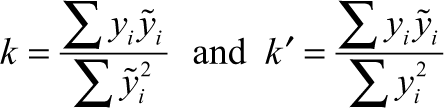
where y i and y i are the predicted and experimental activities, respectively.
Further statistical significance of the relationship between activity and the descriptors was checked by randomization test (Y-randomization) of the models. The Y column entries were scrambled and new QSAR models were developed using same set of variables as present in the unrandomized model. We have used a parameter, R p 2, 23 which penalizes the model R 2 for the difference between squared mean correlation coefficient (R r 2) of randomized models and squared correlation coefficient (R 2) of the nonrandomized model. The R p 2 parameter was calculated by the following equation:

This parameter, R p 2, ensures that the models thus developed are not obtained by chance. We have assumed that the value of R p 2 should be greater than 0.5 for an acceptable model.
To check the intercorrelation of descriptors, variance inflation factor (VIF) analysis was performed. The VIF value is calculated from 1/(1 − r 2), where r 2 is the multiple correlation coefficient of one descriptor’s effect regressed on the remaining molecular descriptors. If the VIF value is larger than 10, information of descriptors can be hidden by correlation of descriptors. 24,25
Results and Discussion
The 119 active compounds with their acute cytotoxicity (IC50 values in µM) to the P-388 cell line were randomly divided into a training set of 81 compounds and a test set of 38 compounds. With the wide range of difference between the IC50 values and the large diversity in the structures, the combined data set of 81 molecules and 38 molecules is ideal as a training and test set, as both sets do not suffer from bias due to the similarity of the structures. The various molecular descriptors (372 in total) as described in
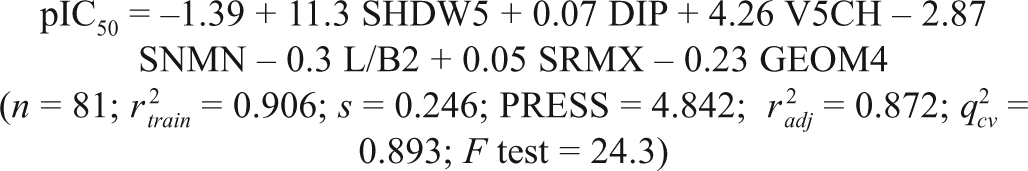
where n is the number of compounds in the training set, r
train
2 is the squared correlation coefficient, s is the estimated standard deviation about the regression line, r
adj
2 is the square of the adjusted correlation coefficient for degrees of freedom, F test is the measure of variance that compares 2 models differing by 1 or more variables to see if the more complex model is more reliable than the less complex one (the model is supposed to be good if the F test is above a threshold value), and q
cv
2 is the square of the correlation coefficient of the cross-validation using the leave-one-out cross-validation technique. The QSAR model developed in this study was statistically ( r
train
2 = 0.906, q
cv
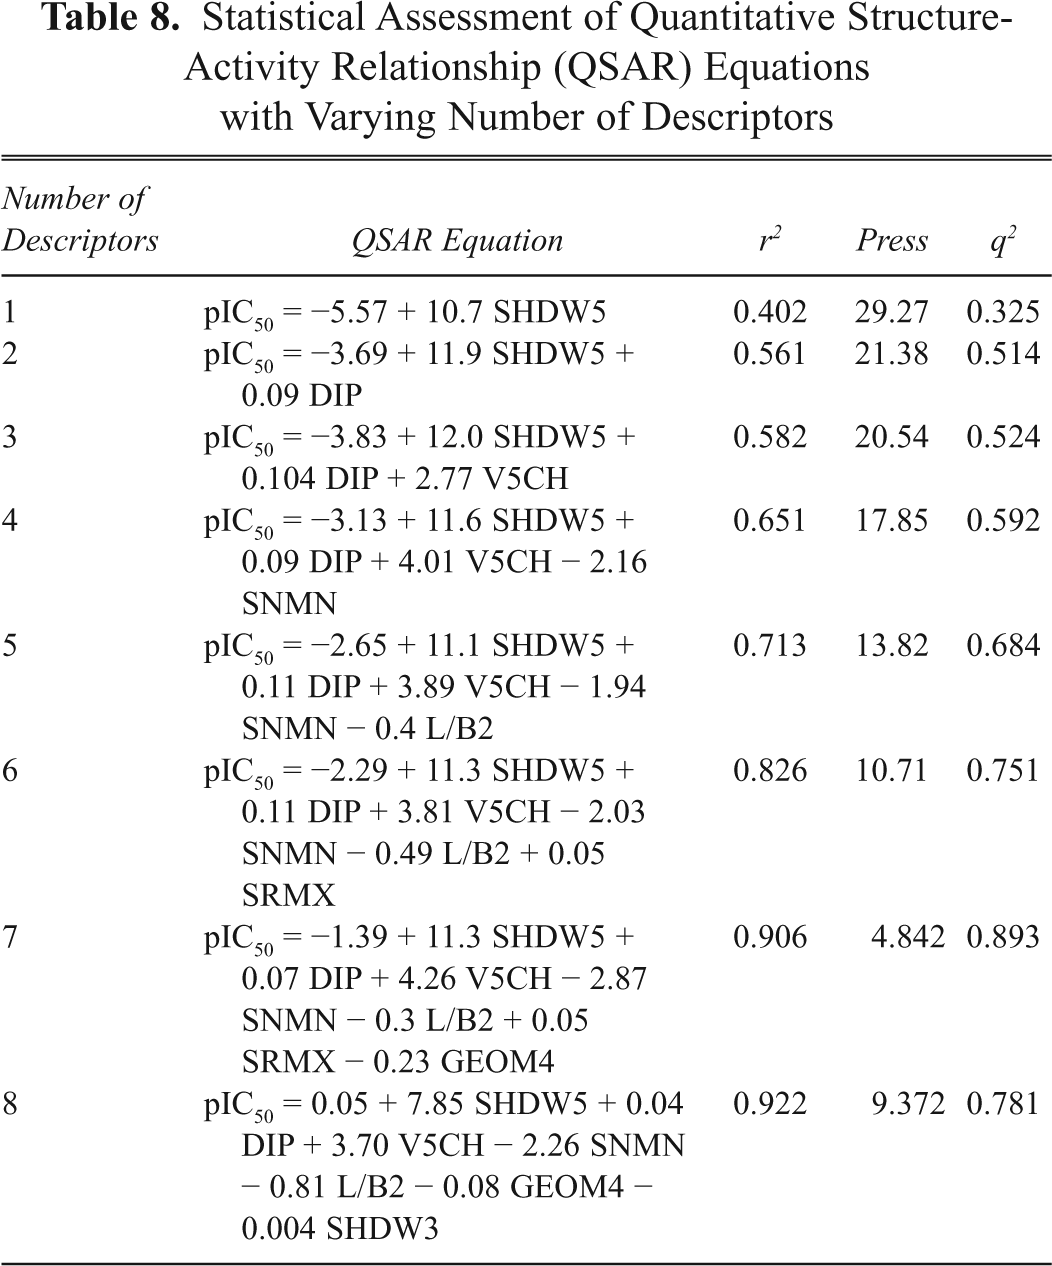
2 = 0.893, F test = 24.3) best fitted and consequently was used for prediction of cytotoxic activities (pIC50) of training and test sets of molecules, as reported in
Statistical Assessment of Quantitative Structure-Activity Relationship (QSAR) Equations with Varying Number of Descriptors
Observed and Predicted Cytotoxic Activity to the P-388 Cell Line of the Training Set of Podophyllotoxin Derivatives

pIC50 = −log IC50.
Observed and Predicted Inhibitory Activity to the P-388 Cell Line of the Test Set of Podophyllotoxin Derivatives

pIC50 = −log IC50.

Relationship between predicted and experimental activities as per equation (1) of the training set compounds.
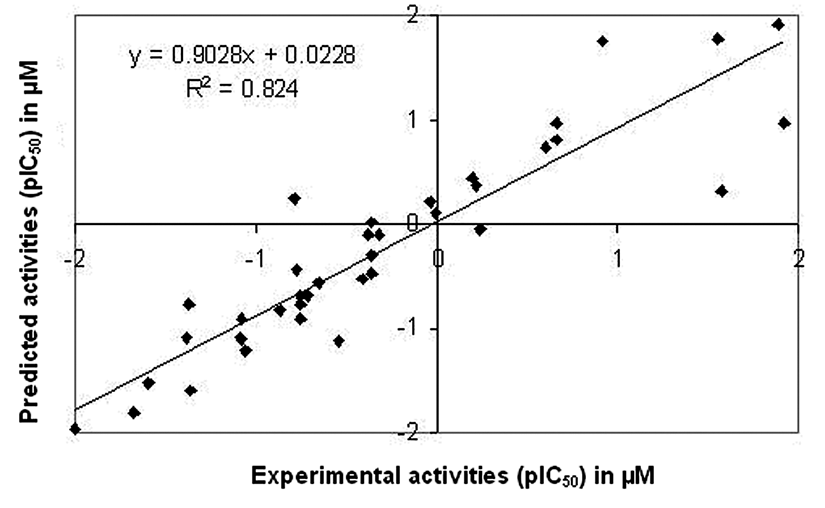
Relationship between predicted and experimental activities as per equation (1) of the test set compounds.
The intercorrelation of the descriptors used in the QSAR model (1) was very low (below 0.6), which is in conformity to the study that, for a statistically significant model, it is necessary that the descriptors involved in the equation should not be intercorrelated with each other. 14 To further check the intercorrelation of descriptors, VIF analysis was performed. In this model, the VIF values of these descriptors are 1.337 (SHDW5), 1.527 (DIP), 1.091 (V5CH), 1.143 (SNMN), 1.302 (L/B2), 1.091 (SRMX), and 1.727 (GEOM4), which are less than the threshold value of 10. 24,25
Satisfied with the robustness of the QSAR model developed using the training set, we have applied the QSAR model to an external data set of podophyllotoxin analogs constituting the test set. As the experimental values of IC50 for these inhibitors are already available, this set of molecules provides an excellent data set for testing the prediction power of the QSAR model for new ligands.
Podophyllotoxin is a clinically effective anticancer agent that represents perhaps the most significant addition to the pharmacopoeia of cancer chemotherapeutic agents in the past decade.
26
However, new findings related to its activities, mechanism of action, and pharmacological properties have been unveiled. The accepted mechanism of action of podophyllotoxin and its structural derivatives revealed that these molecules preferentially inhibit tubulin polymerization, which leads to arrest of the cell cycle in the metaphase and thus induces cytotoxicity to cancer as well as normal cells. Mechanistically, TPI is the cause, and the cytotoxicity is its response, and one can be predicted from the other. Therefore, a separate data set consisting of 16 analogs of podophyllotoxin (
Observed and Predicted Inhibitory Activity to Tubulin Polymerization of the Validation Set of Podophyllotoxin Derivatives
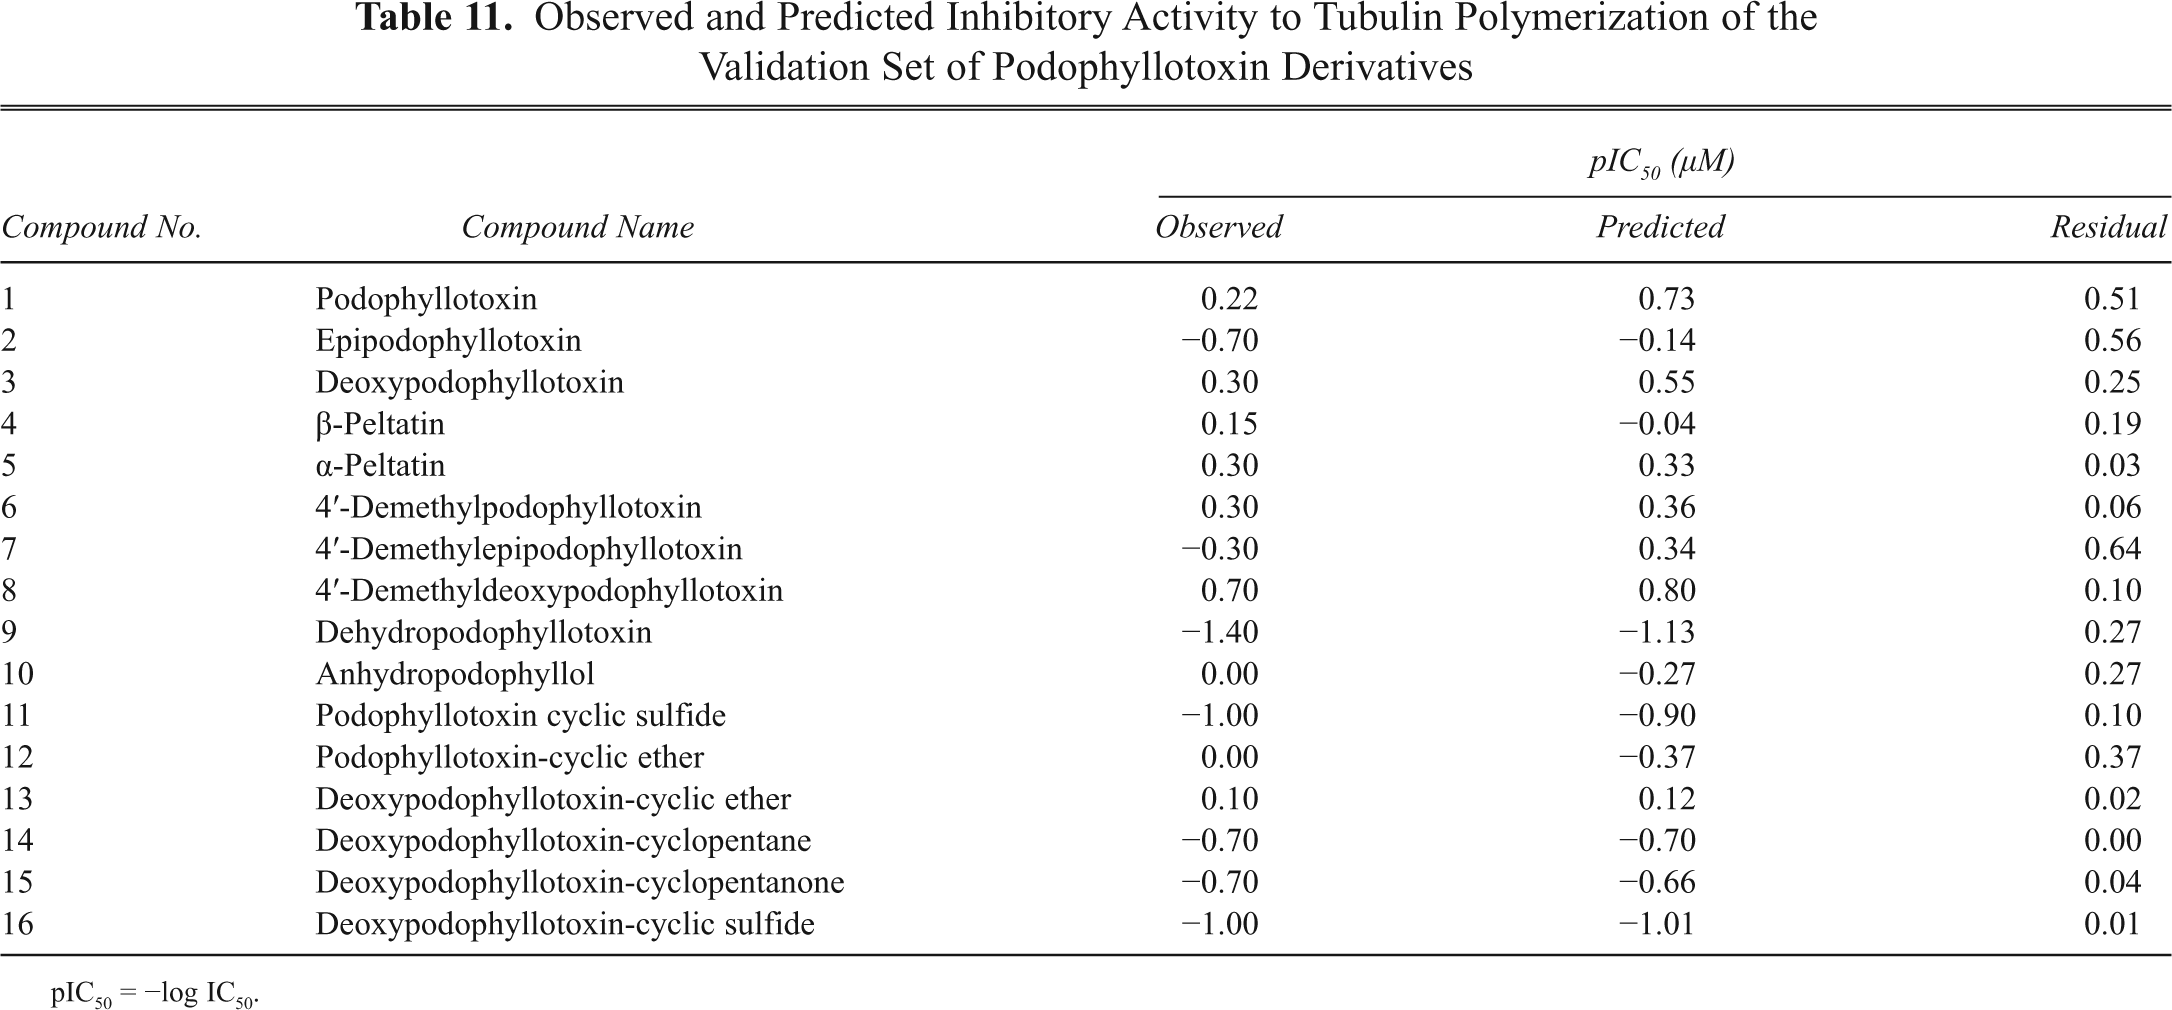
pIC50 = −log IC50.
Descriptors interpretation
Based on the developed QSAR model, it is observed that the important parameter that contributes to the potentiating activity is SHDW5, which is a set of geometrical descriptors. It indicates standardized shadow area 5, relating to the size and shape of molecules. It is calculated by projecting the molecular surface on 3 mutually perpendicular planes, XY, XZ, and YZ, assuming van der Waals radii for atoms. 27-29 Basically, a molecule is flatted into a plane by disregarding the third dimension: the area of the molecule that is projected onto the remaining 2 dimensions defines the shadow area of interest. SHDW5 descriptor is calculated as follows:

L X and L Z are the maximum dimensions of the molecular surface projections.
V5CH is the fifth-order chain molecular connectivity index; this descriptor contains information about the size and the degree of branching in a molecule. The descriptors SNMN and SRMX measure minimum nucleophilic superdelocalizability and maximum free radical superdelocalizability of the compounds (calculated using the Hückel calculation). Superdelocalizability is an indication of the electronic “richness” or “poorness” of a specific atom. Nucleophilic superdelocalizability looks at the concentration of unoccupied orbitals at each atom, and the radical superdelocalizability measures the concentration of all orbitals, occupied and unoccupied, at each atom. Occurrence of nucleophilic and radical superdelocalizabilities indicates that 2 reactivity mechanisms can occur in the data set and may be the possible causes of the cytotoxicity. L/B2 is the length-to-breadth ratio of compounds calculated by rotating the molecule in the Z-axis in increments of N degrees. GEOM4 is the mass weighted length/width descriptor. The calculation involves diagonalization of the covariance matrix formed from the (x,y,z) coordinates of the atoms, translated to the center of mass of the structure. The contribution of each atom is weighted by its mass, and the resulting eigenvalues encode the magnitude of length, width, and thickness of the structure, taking into consideration atomic mass. DIP signifies dipole moment (calculated using single-point MOPAC [AM1]–based semiempirical quantum mechanical methods); this descriptor considers only interactions of valence π electrons for adjacent atoms.
The descriptors used for the constructed QSAR model in this work encoded electronic, geometrical, and topological aspects of molecules. Appearances of these descriptors in the model reveal the role of electronic and steric interactions in inducing cytotoxicity to cancer cells.
Conclusion
We have compiled a virtual library of podophyllotoxin analogs built through structural modification of scaffold structure of natural podophyllotoxin. We have demonstrated that the QSAR model developed in this study can be applied to estimate the cytotoxic activity with a high level of accuracy for a diverse set of podophyllotoxin analogs. Using a combination of topological and electrotopological state indices, as well as electronic and thermodynamic descriptors of chemical structures, we have built several robust QSAR models with high values of q cv 2 (for training sets) and predictive r test 2 (for test sets). Moreover, the QSAR model makes a credible prediction model of tubulin polymerization inhibition possible. The calculated cytotoxic activity of a set of structural analogs demonstrates excellent linear correlation to the experimental cytotoxic activity. This model could be useful to predict the range of activities for new podophyllotoxin analogs. The information we have expressed in this study may lead to designing (synthesis) more potent podophyllotoxin derivatives for inhibition of tubulin polymerization, and thus the cytotoxic activity should guide the design of focused libraries based on the podophyllotoxin skeleton and facilitate the search for related structures with similar biological activity from large databases.
Footnotes
Acknowledgements
We are thankful to the support by the Department of Science and Technology, India under the project SR/FT/L-44/2005. We thank Scube Scientific Software for supplying ADME Model Builder for a trial period.