
Abstract
This article addresses the impact of asphalt type and roughness on paint pavement marking retroreflectivity. Marking retroreflectivity and pavement roughness data were collected on two-lane highways in North Carolina. A t test was used to analyze the data. It was found that the mean values of the retroreflectivity measurements for the plant mixed pavements are significantly higher than those for the bituminous surface treatment (BST; chip seal) pavements. The mean left-wheel international roughness index (IRI) values and right-wheel IRI values for plant mixed pavements are lower than for the BST pavement. The conclusion is that marking crews should consider applying higher-quality paint markings (thicker paint and more glass beads) on BST pavements to achieve the same service life as the markings on plant mixed pavements. This would provide drivers with a more consistent and uniform marking retroreflectivity and the agency or municipality with a more consistent marking schedule.
Introduction
Traffic markings and markers are considered to be traffic control devices having the function of controlling traffic and encouraging safe and efficient vehicle operation according to the American Association of State Highway and Transportation Officials (AASHTO, 2004). For highways and streets three general types of markings are in use: pavement markings, object markers, and delineators. Pavement markings include centerline stripes, lane lines, and edge lines. These may be supplemented by other pavement markings such as approaches to obstructions, stop and crosswalk lines, and various word and symbol markings (AASHTO, 2004). The Manual on Uniform Traffic Control Devices for Streets and Highways (MUTCD) specifies that pavement markings are commonly placed using paint and thermoplastic materials, although other suitable marking materials can also be used (Federal Highway Administration [FHWA], 2009). This article addresses center and edge-line pavement markings.
The first-time installation and later restriping of pavement markings impose a high cost on transportation agencies. Pavement markings generally have a shorter service life than the pavement on which the markings are applied. Markings need to be restriped when their retroreflectivity values fall below a minimum level or when a portion of the markings are worn away by traffic. The U.S. nationwide annual pavement marking expenditure was estimated to be approximately US$2 billion in 2007 (Carlson, Park, & Andersen, 2009). In North Carolina, pavement markings cost approximately US$14.5 million a year in contractor-performed work alone, which represents 2% of the US$700 million NCDOT (North Carolina Department of Transportation) highway maintenance budget (Craig, Sitzabee, Hummer, & Rasdorf, 2007).
Pavement marking retroreflectivity is used to describe the amount of light returned back to a source, such as the amount of light from a vehicle’s headlight that is reflected back toward the driver. The reflected light provides the driver with roadway information and enables a safer drive at night. Thus, retroreflectivity is highly related to roadway safety. Several previous studies reported the relationship between pavement marking retroreflectivity and traffic safety (Bahar, Masliah, Erwin, & Tan, 2006; Donnell, Karwa, & Sathyanarayanan, 2009; Smadi, Souleyrette, Ormand, & Hawkins, 2008). Retroreflectivity is represented by a measure referred to as the coefficient of retroreflected luminance (RL), expressed in units of millicandelas per square meter per lux (mcd/m2/lux; American Society for Testing Materials [ASTM], 2001). The current ASTM standard requires that retroreflectometers use a 30-meter geometry (ASTM, 2005).
A Congressional mandate, Section 406 of the 1993 Department of Transportation and Related Agencies Appropriations Act, directed the Secretary of Transportation to revise the MUTCD to include a standard for minimum levels of retroreflectivity that must be maintained for traffic signs and pavement markings (Vereen, Hummer, & Rasdorf, 2004). The minimum retroreflectivity levels and recommended maintenance methods for traffic signs were published in Revision 2 of the 2003 version of the MUTCD. The final rule has been effective since January 2008 and has been included in the 2009 MUTCD (FHWA, 2009). The FHWA is working with other research agencies to establish a similar minimum retroreflectivity standard for pavement markings. The minimum retroreflectivity requirement for pavement markings is expected to be included in a future version of the MUTCD.
It is important to determine the impacts of various factors on pavement marking retroreflectivity. This study evaluates two of the impacting factors, pavement type and roughness. Previous studies typically treated pavement type as a category variable in retroreflectivity degradation models and classified pavement type as either concrete pavement or asphalt pavement (Bahar et al., 2006; Sarasua, Clarke, & Davis, 2003; Sasidharan, Karwa, & Donnell, 2009). This study is one of the first to investigate two pavement types under the asphalt pavement category and to use international roughness index (IRI) to quantify pavement roughness.
Literature Review
Previous research revealed that many factors might have impacts on pavement marking retroreflectivity values and degradation rates. Those factors include but are not limited to the following:
Age of markings, type of pavement marking materials, and marking color;
Glass bead type, glass bead density, and quality control during marking installation;
Annual average daily traffic (AADT), type of traffic, heavy vehicle percentages, and road speed limit;
Pavement type, pavement surface roughness, and roadway geometry; and
Weather/climate, snowplowing, salt and sand use, and studded tires.
Several research projects have been conducted to evaluate the impacts of these factors on pavement marking retroreflectivity values and establish degradation models. We review a few of those studies in this section.
Pavement marking age has long been recognized as one of the most important factors affecting pavement marking retroreflectivity degradation. Most previous studies agreed on that pavement marking retroreflectivity values decrease over time. Some studies suggested that retroreflectivity had a linear relationship to marking age (Lee, Maleck, & Taylor, 1999; Sitzabee, Hummer, & Rasdorf, 2009). Other studies proposed using an exponential transform (Perrin, Martin, & Hansen, 1998) or logarithmic transform (Andrady, 1997) of marking age as an independent variable in degradation models.
Pavement marking material type was normally identified as a categorical variable in degradation models. Waterborne paints and thermoplastics are the most commonly used pavement marking types, making up 59.9% and 22.7% of the total (82.6%) pavement marking mileages in the United States (Migletz & Graham, 2002). Normally, paint markings are applied on secondary routes where traffic volumes are relatively low. Other types of pavement marking materials such as epoxy, polyurea, preformed plastics, and polyester are also widely used. The estimated lifecycles and degradation rates for these various marking materials vary in a wide range (Migletz & Graham, 2002). However, paint materials normally have lower initial retroreflectivity measurements and degrade at a faster rate than other marking materials.
Previous research has shown that white and yellow markings have different levels of retroreflectivity. White markings generally have higher retroreflectivity measurements than yellow markings (assuming the same materials were applied; Craig et al., 2007). However, the degradation rate of yellow markings was found to be slower than white markings. Thus, it is possible that white and yellow markings may provide approximately the same lifecycles. Other studies also considered marking color as a factor in their models (Migletz & Graham, 2002; Sarasua et al., 2003; Sasidharan et al., 2009).
Many traffic engineers believe that traffic volumes (or AADT estimates) have an impact on marking retroreflectivity values. One study found this impact to be significant and included traffic volume as an independent variable in a multiple linear regression degradation model (Sitzabee et al., 2009). A study by Abboud and Bowman (2002) proposed a logarithmic model that multiplied the AADT and time and referred the resulting variable as vehicle exposure. Vehicle exposure was defined as the estimated total number of vehicles that had passed along the road in each lane since the installation of the new pavement markings. However, the values of traffic volume as a variable were constantly changing and accurate traffic counting data over time were normally unavailable for most of the roads.
Another study found that bead density had a correlation with paint marking retroreflectivity measurements (Zhang et al., 2009). Bead density was defined as the surface percentage of glass beads partially exposed above the paint marking material. Higher bead density led to higher paint marking retroreflectivity measurements.
Scope and Objective
The pavement type and roughness study reported herein was part of an overall research effort to evaluate paint pavement marking performance in NC (Rasdorf, Zhang, & Hummer, 2009). While collecting field marking retroreflectivity data on paint markings for the initial study, it was observed that pavement markings applied on smooth asphalt pavement surfaces generally have higher retroreflectivity measurements than those applied on rough surfaces. The observation led to a pavement type and roughness data collection initiative to systematically investigate this observation.
The scope of this article is limited to the waterborne paint pavement markings applied on two-lane highways with flexible pavements. The data collection efforts were made on two-lane highways because two-lane highways comprise the majority of the highway system. In North Carolina, 74,015 of the total 79,042 roadway miles (93.6%, maintained by the NCDOT) are two-lane highways (NCDOT, 2007). Data collection was also much easier and safer on two-lane highways than on other types of highways.
The collected data were analyzed for both plant mixed and bituminous surface treatment (BST) pavements. Pavement roughness data were also collected on those roads. The impact of roughness on marking retroreflectivity was then evaluated. This study is the first to examine the pavement type and roughness impacts on marking retroreflectivity. No similar research or similar roughness data were reported in literature.
Method
In this section, we describe how we collected the marking retroreflectivity and pavement roughness data and how we classified pavement types. We also discuss measurement and data characteristics, and we present the field collected data.
Data Collection
The pavement marking retroreflectivity data were collected by North Carolina State personnel, and the pavement roughness data were collected by the NCDOT Pavement Management Unit. The data collection procedures are described in the following sections.
Pavement marking retroreflectivity data collection
A handheld LTL 2000 retroreflectometer was used for data collection. This retroreflectometer uses a 30-meter geometry, which is the geometry required by ASTM Specification E 1710-05 (ASTM, 2005). The standard operating procedure prescribed by the instrument manual was strictly followed during field data collection. Field calibration of the LTL 2000 at each site was conducted before measurements were taken.
A global positioning system (GPS) device was used to record the coordinates of starting and ending points at each retroreflectivity measurement location. The GPS coordinates were later imported into a geographic information system (GIS) map to geographically show their position. In addition, they were superimposed onto the roughness measurements that were collected on the same roadway section. The purpose of doing so was to geometrically correlate the retroreflectivity measurements with the roughness measurements. Having georeferenced both data sets also supports additional future data collection at these same locations so that a time-based analysis might be conducted at some future time.
Paint data were collected on secondary roads in four different highway divisions in NC. The selected roads have low traffic volumes, with AADT of less than 4,000 vehicles per day on most roads . All measured roads were two-lane highways with asphalt pavement surfaces. Test locations were not selected on road sections with sharp horizontal or vertical curves but were otherwise randomly chosen. Test locations were about 200 feet in length. The same paint material and glass bead were applied on the testing sites because they were all from the same manufacturer. The paints were applied 15 mil thick when wet and the bead rates were 6 pounds per gallon.
Figure 1 shows a typical data collection–site layout. Pavement marking retroreflectivity data on one white edge line and two yellow center lines were used in this study. The right-wheel-track and left-wheel-track lines illustrate the location where the roughness data were collected. The circles indicate where GPS coordinates were collected.
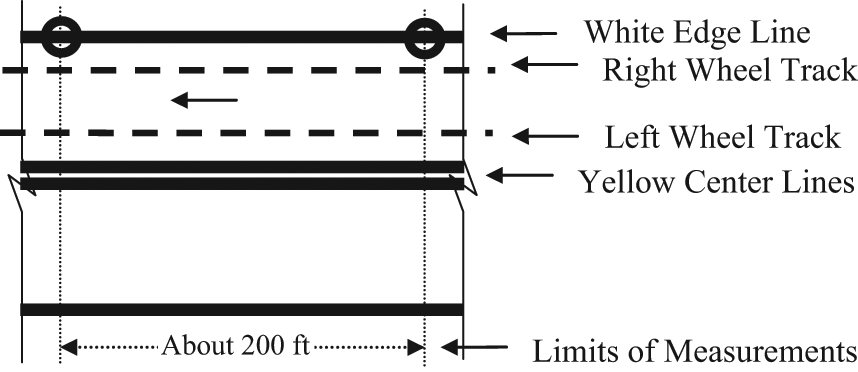
Field data collection–site layout.
Twenty retroreflectivity measurements, approximately evenly distributed along the 200-foot segment, were taken for each white edge pavement marking line in the direction of travel. The 20 measurements were averaged to obtain an RL value for the line. However, a previous study found that paint centerline retroreflectivity values measured in the direction of paint striping are significantly higher than values measured in the opposite direction (Rasdorf, Hummer, Zhang, & Sitzabee, 2009), so the centerlines were measured in each direction. The centerlines on two-lane highways could be either solid or skip lines. A total of 20 measurements for solid lines and 10 measurements for skip lines were taken in each direction of each yellow centerline. The four sets of measurements (two lines and two directions) were all averaged to obtain an RL for the yellow centerline. The averages are presented in Tables 1 and 2.
Marking RL and Pavement Roughness Values on Plant Mixed Pavements.

Note: IRI = international roughness index; RL = coefficient of retroreflected luminance. The RL values are in units of mcd/m2/lux. The IRI values are in units of inches/mile.
Marking RL and Pavement Roughness Values on BST Pavement.
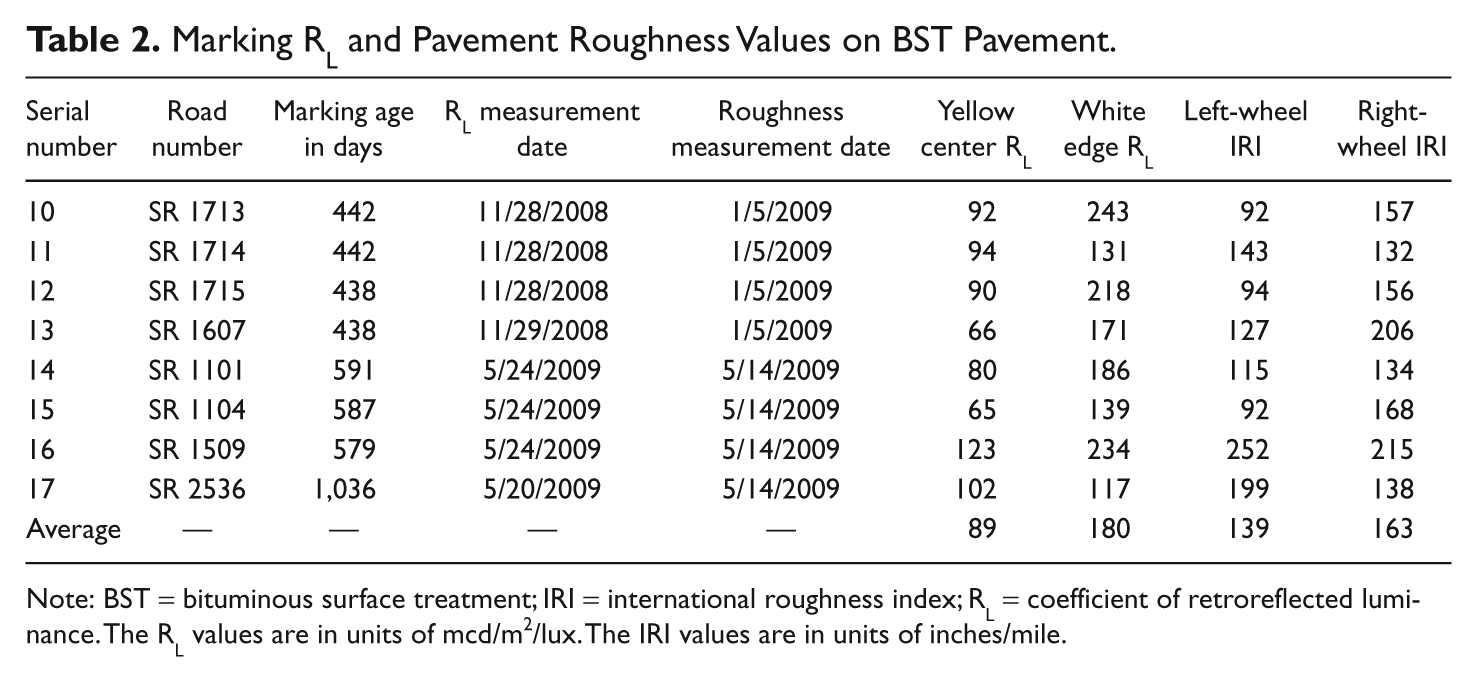
Note: BST = bituminous surface treatment; IRI = international roughness index; RL = coefficient of retroreflected luminance. The RL values are in units of mcd/m2/lux. The IRI values are in units of inches/mile.
Pavement roughness data collection
The IRI was developed by the World Bank in the 1980s and is widely used in the United States for determining road roughness. FHWA requires state highway agencies to submit roughness measurements in the form of IRI for the Highway Performance Monitoring System (HPMS). IRI is an index that defines the characteristics of the longitudinal profile of a traveled wheel track and constitutes a standardized roughness measurement (Sayers, Gillespie, & Paterson, 1986). The longitudinal profile measurements (or road profile measurements) are a series of elevation values taken at intervals of about 6 inches along a wheel track. IRI values for roadway pavement are generally in the range of 50 to 700 inches/mile. Lower values represent smoother pavement surfaces (Sayers et al., 1986).
IRI is an index computed from a longitudinal profile measurement. Road profile measurements were collected using a high-speed inertial road profiler capable of collecting pavement profile data at highway speeds (NCDOT, 2012). The data were collected in one traveling direction along the road, and the profiles of both wheel tracks were recorded. The data collection road name, start-point road name, vehicle travel direction, and end-point road name were all recorded during the data collection.
The road profile data were collected in two rounds. The first round of data were collected on January 5, 2009, which included profile measurements on eight roads. The retroreflectivity measurements were collected 35 to 38 days before the profile data collection. The second round of data were collected on May 14, 2009, which included profile data on nine more roads. The retroreflectivity measurements were collected 6 to 10 days later. Data were recorded for all of the road segments on which RL measurements were taken. These are presented in Tables 1 and 2.
ProVAL software was used to compute IRI values using the road profile files. ProVAL software was developed by the FHWA and the Transtec Group (2009). This software allows users to view and analyze pavement profiles. IRI values were computed for each fixed interval of 200 feet along the roadway. The 200-foot IRI computing interval was selected to match the approximate length of the retroreflectivity samples. Variations in the IRI values were found to be large. Figure 2 shows the IRI values along a typical 6500-foot-long road. The road surface with IRI values lower than 90 inches/mile was considered to have high smoothness quality. The lowest IRI value was 105 inches/mile, and the highest value was 271 inches/mile. Because of the large IRI variations, it was not appropriate to use the average IRI value of the road as the roughness measurement for the 200-foot-road segment where we have measured the retroreflectivity. Instead, we describe the procedure (in Geometric Correlation section) that was actually used to find the IRI values for the road segments we measured.
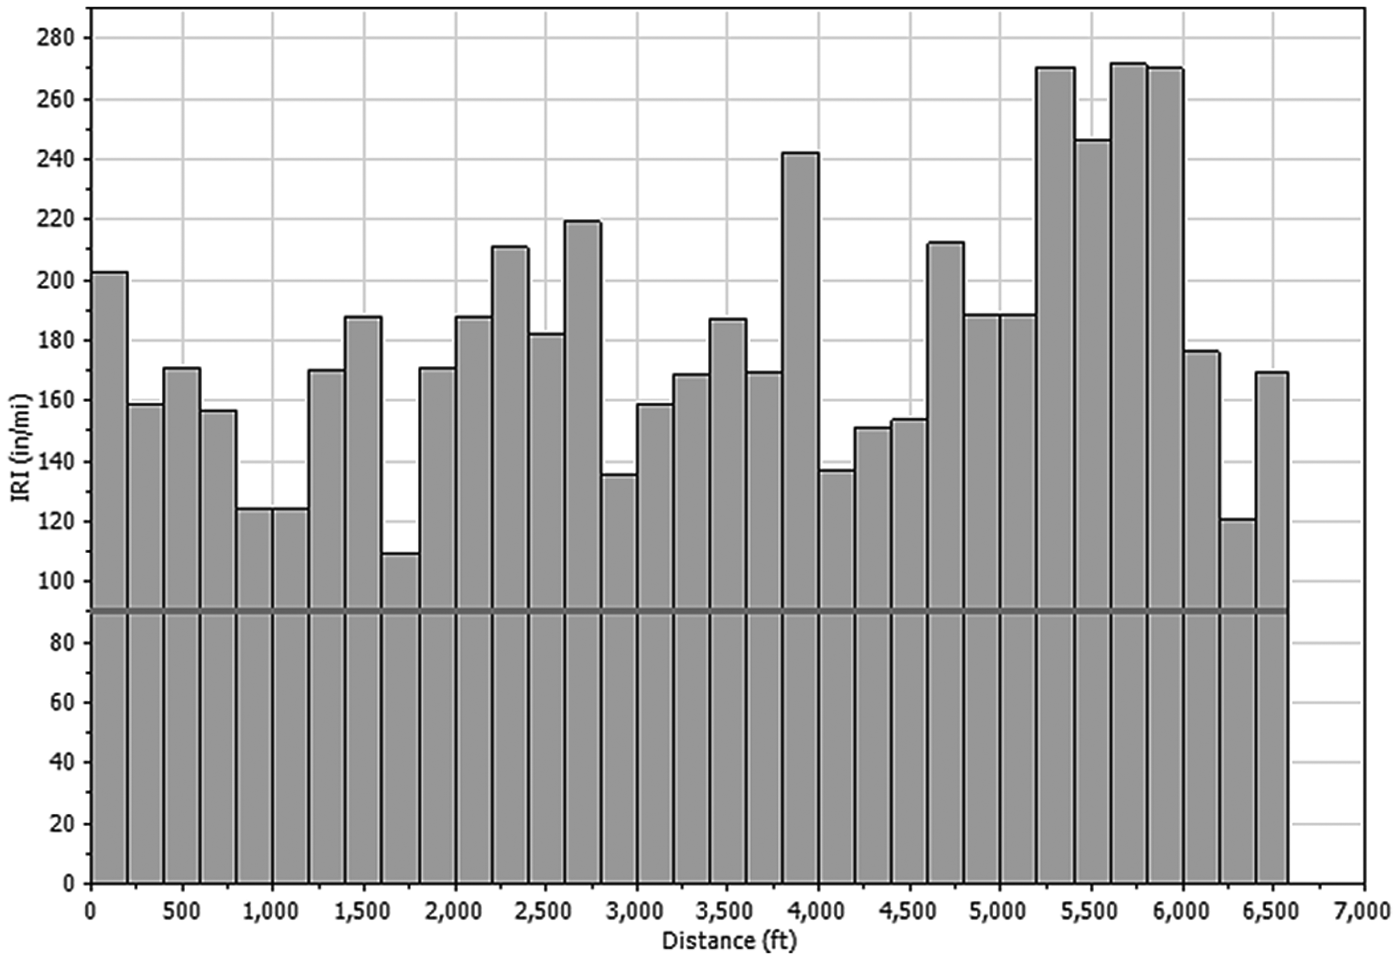
IRI (international roughness index) measurement values along a typical road pavement type.
The NCDOT pavement management system considers three types of asphalt pavements: plant mixed, BST, and slurry. The marking retroreflectivity and pavement roughness data that were collected for this study were collected on the first two types of pavements. Plant mixed pavement materials are mixed in a central plant that offers advantages such as more careful proportioning of the ingredients, more uniform mixtures, and less dependence on favorable weather conditions (Wright & Paquette, 1987). BST, also referred to as chip seal pavement, generally consists of aggregate spread over an asphalt emulsion layer. The road surface texture of BST is rough. Our findings indicate that pavement type directly affects pavement roughness and likely affects marking retroreflectivity as well.
Plant mixed pavements generally have a higher degree of uniformity than BST pavements of the same age and have a smoother surface than BST. IRI measurements on plant mixed pavements are nearly always lower than on BST pavements of the same age.
Readers should be aware that it is straightforward for an engineer to distinguish between BST and plant mixed pavement surfaces either through a field inspection or by examining an image of the pavement surface. For the 17 road segments in this study, we examined the pavement surface images and classified the pavements into BST and plant mixed types. We then verified that the results were the same as the pavement types reported in the 2008 NCDOT pavement condition survey.
Geometric Correlation
To make a valid comparison, the pavement IRI measurement locations need to geometrically match those of the marking retroreflectivity. A GIS map was used to determine the distance from the roughness measurement start point to the retroreflectivity measurement start point. Figure 3 shows an example of matching computed IRI intervals with a retroreflectivity measurement interval. The pavement roughness data and marking retroreflectivity data were both collected on State Route SR 1947. The pavement roughness measurement start point is at SR 1945 and the end point is at NC 96. GPS coordinates were used to locate the retroreflectivity measurement start point and end point on the GIS map. The distance from the profile measurement start point to the retroreflectivity measurement start point was 2515 feet. The distance between the retroreflectivity measurement start point and the end point was measured to be 245 feet (which was actually longer than the more typical measurement length of 200 feet)

Retroreflectivity measurement location in a GIS (geographic information system) map.
The retroreflectivity measurement location did not exactly match the IRI fixed intervals; instead it spanned two of them. We chose to select the mean IRI value of the two involved intervals as the IRI value for the retroreflectivity measurement section. The two roughness intervals completely overlapped the retroreflectivity measurement interval. The computed IRI values for the right-wheel track at the intervals 2400-2600 feet and 2600-2800 feet were 97 and 80 inches per mile, respectively. The mean IRI value of the two intervals was 89 inches a mile, which was used as the right-wheel track IRI value for the retroreflectivity measurement section. The same process was used to select IRI values on the other 16 measured roads as well.
Data Characteristics
Tables 1 and 2 list the marking retroreflectivity and pavement IRI values for the 17 sample road sections. Table 1 includes nine measured road sections on plant mixed pavements, and Table 2 includes eight sections on BST pavements. The marking ages were determined by counting the days between the marking installation date and the RL measurement date, both of which were known. The RL measurement dates were in the range of 6 to 38 days after the roughness measurement dates.
As noted earlier, the RL measurements on the two yellow centerlines were measured in both directions of traffic flow. The values listed in the “Yellow Center RL” column are the mean values of the retroreflectivity values measured in both directions on both yellow centerlines. The values in the “White Edge RL” column are the mean values of the 20 measurements on the white edge marking. The IRI values are the mean values of two fixed intervals as described earlier.
The retroreflectivity values for all yellow centerlines are significantly lower than those for white edge lines, which is consistent with other research findings (Craig et al., 2007). On plant mixed pavements, the average RL value for yellow center markings is 137 mcd/m2/lux, which is significantly lower than the average RL value of 238 mcd/m2/lux for white edge markings. On BST pavements, the average RL value for yellow markings is 89 mcd/m2/lux, which is also much lower than the RL value of 180 mcd/m2/lux for white markings. Thus, the relationship between white and yellow markings is consistent.
The retroreflectivity values for plant mixed pavements were higher than those for BST pavements. This result is also as expected because the plant mixed pavements generally have smoother pavement surfaces than BST pavements. The average RL values for yellow center markings and white edge markings on plant mixed pavements are 48 mcd/m2/lux and 58 mcd/m2/lux higher than those on BST pavements, respectively.
The IRI values show the same pattern as the retroreflectivity values. Note that a higher IRI value represents a rougher road surface. The average left-wheel IRI values are slightly lower than right-wheel values. The IRI values on BST pavements are much higher than the values on plant mixed pavements. The roughness values that were field measured are consistent with the observation that BST pavements are generally rougher than plant mixed pavements.
Data Analysis and Results
A statistical test (t test, which assumes unequal variances for two groups) was used to determine whether the differences between the retroreflectivity and roughness for plant mixed pavements and BST pavements are statistically significant. The null hypothesis (Hypothesis 0) was that
Hypothesis 0: The mean retroreflectivity and roughness on these two types of pavements were equal.
The alternative hypothesis was that
Hypothesis 1: The mean retroreflectivity and roughness values for plant mixed pavements were larger (smaller) than the values for BST pavements. We used a one-tailed hypothesis test for this specific scenario.
The t test was used to test whether the yellow centerline retroreflectivity values, the white edge retroreflectivity values, the left-wheel IRI values, and the right-wheel IRI values for plant mixed pavements are statistically significantly different from the values for BST pavements (comparing 137 and 89 as well as 238 and 180 in Tables 1 and 2 for RL, for example). The t test hypothesized that the mean differences were zero. For each of the four tests, the one-tailed p values were .0157, .0288, .0132, and .0001, respectively. The p values were all less than the specified significant level of .05, which means that the differences were statistically significant.
It should be noted that the above analysis did not evaluate marking-age effects due to the small sample used in this study. Marking from five sites on plant mixed pavement were about 1,000 days old (road numbers 3, 4, 7, 8, and 9). The average yellow center and white edge RL values of those sites were 132 and 247 mcd/m2/lux, which were close to the average values of the 9 sites (137 and 238 mcd/m2/lux) on plant mixed pavement. Only one site on BST pavement had markings that were about 1,000 days old. With only 17 sampling sites, we were not able to evaluate the age effects. However, a future study with large sample might be able to determine the age effects on marking RL values.
Conclusions
The results of this study indicate that paint markings on plant mixed pavements have higher retroreflectivity values than markings on BST pavements. Pavement roughness values for plant mixed pavements are lower than those for BST pavements. These results imply that markings on BST pavements will have shorter lifecycles than markings on plant mixed pavements, assuming that markings degrade at the same rates on both pavement surfaces. It also indicates that markings on BST pavements need to be restriped in a shorter time period than required in the case of markings on plant mixed pavements.
A common practice of many transportation agencies is to restripe paint pavement markings on a regular 2-year schedule (some states have more frequent restriping schedules). Because the results suggest that paint markings on BST pavements generally have lower retroreflectivity measurements than the markings on plant mixed pavements before a scheduled restriping, values on BST pavements are more likely to fall below the minimum. Thus, marking crews should consider applying higher- quality paint markings (thicker markings and more glass beads) on BST pavements to achieve the same service life as the markings on plant mixed pavement. This would also provide drivers with a more consistent and uniform marking retroreflectivity.
Generally, a paint truck speed of 10 to 12 mph will result in a paint thickness of 15 to 18 wet mils without beads if the paint gun pressure is properly set. Paint markings are typically 15 mils (1 mil = 0.001 inch) in thickness when applied. A slower paint truck speed will lead to thicker paint markings and denser glass beads. The results suggest that, on BST pavements, the paint truck crew should consider traveling slower than on plant mixed pavement to counter the naturally lower retroreflectivity values. It is worth noting that many field paint truck crews contacted by the authors in North Carolina intuitively are already aware of this difference and do apply paint markings in this way based on their experience. This study provides evidence supporting the practice. An alternative would be to increase the paint- and bead-flow volume if it is desired to maintain the 10- to 12-mph speed.
It should be noted that these conclusions do not assume that BST markings degrade more quickly. A different degradation rate between plant mixed and BST pavements is not assumed in this study at all. Rather, it is clear that rough pavements have lower retroreflectivity because, in part, reflected light simply scatters more on rougher surfaces. Also, because of its nature, a BST surface has less surface contact area. Thus, less paint and fewer glass beads are directly exposed on the surface, thereby reducing the amount of light reflected back to its source, as compared to a plant mixed surface. This study compares the two different surfaces; it does not establish a BST surface degradation rate. Rather, it is simply known that given an equal degradation rate, a rougher surface has to be painted more frequently for its retroreflectivity to remain above the minimum level.
Future Research
An obvious follow-up to this research would be a project that would collect a larger data sample at more sites and across more times. With a larger sample, more sophisticated statistical tests and modeling methods could be employed to better quantify the effect of roughness on initial marking RL and on RL as the marking ages.
This study used a mobile road profiler to collect pavement roughness data. The IRI values were determined from pavement profile measurements obtained at a sampling interval of about 6 inches. It is important to note that these roughness values do not necessarily provide an indication of the pavement texture (which is more likely related to marking retroreflectivity than is roughness). Future research may consider the use of pavement texture measurement instruments such as a circular texture meter to obtain more accurate roughness data (Prowell & Hanson, 2005).
An additional observation is that a different approach to collect IRI values might be used. In this study, wheel-path IRI values were used because these were measured and provided by the NCDOT. Although wheel-path IRI values do provide a reasonable measure, it might be of value to obtain IRI values closer to the actual pavement markings. Doing so may give a more representative indication of the roughness of the surface that the marking was applied to.
Footnotes
Acknowledgements
The authors would like to acknowledge the sponsorship of this research by the NCDOT. The authors would especially like to thank Mr. Chris Howard, Ms. Meredith McDiarmid, and Mr. Mark Manriquez of the NCDOT for their support during this study. The authors would also like to thank the engineers and technicians of the NCDOT Pavement Management Unit, including Mr. Jimmy Tyner for collecting the roughness data, and NCSU students, Mr. Paul Ku, Mr. Bryan Kearns, and Ms. Juhi Jain for their help with the field data collection.
Declaration of Conflicting Interests
The authors declared no potential conflicts of interest with respect to the research, authorship, and/or publication of this article.
Funding
The authors received the following financial support for the research, authorship, and/or publication of this article: The authors would like to acknowledge the sponsorship of this research by the NCDOT.