
Abstract
Transportation agencies have made significant strides to reduce collisions and increase capacity along strategic highway corridors. Efforts have led to the implementation of many different access management techniques along corridors, such as installing medians versus two-way left-turn lanes and closing median openings. Businesses along these corridors have indicated their concern that these new designs will have a negative economic impact on their business because of the lack of direct access to their properties. The objective of this study was to quantify the business perceptions of median treatments on businesses adjacent to multilane highways. Owners of businesses along treatment corridors viewed median installations with a more positive outlook following implementation of the median than they did prior to the installation. The performance of treatment sites in terms of reported impacts on business revenues indicates that there is no direct evidence of negative economic impacts due to median installations.
Introduction
Highway safety and operational efficiency are key motivating factors in the majority of improvements made in vehicles and the roads on which they travel. Many improvements have been made in the last 20 years on both fronts (Demosthenes, 1999). Vehicles are much safer with improvements in antilock braking systems, passenger and side curtain airbags, and improved structural support and crash absorption. Other vehicular improvements in operational safety have been made by automating vehicles through initiatives such as the Intelligent Vehicle Initiative and IntelliDrive (Federal Highway Administration [FHWA], 1998; Lee et al., 2007; United States Department of Transportation [USDOT], 2010).
In the context of roadway design, access management has evolved over decades and is constantly progressing to encourage sustainable transportation networks (Williams & Levinson, 2008). An array of options exist now that aim to improve the highways people drive on, the majority of which involve some level of access management techniques, defined as “the systematic control of the location, spacing, design and operation of driveways, median openings, interchanges, and street connections (Transportation Research Board [TRB], 2010).” Often, access management projects are the result of a local agency being responsive to its customers, and they exist as stand-alone projects outside the state’s transportation program (Miller, Hoel, & Smith, 2010). At the initial conception of any given road, the future attractiveness of the area to residents and the business community may not have been expected. Therefore, roads are often expanded to accommodate significantly more traffic; however, existing businesses are reluctant to accept any changes in driveway access or left-turn modifications.
A new access management project must fit contextually into its surroundings. To achieve a positive change in corridor performance measures, it is important to have a supportive local jurisdiction which has bought into the idea (Vanka, Handy, & Kockelman, 2005). An awareness of “quality of life” issues can aid an agency which is attempting to achieve an operational or safety improvement without harming the interests of the business and residential community nearby. Incorporating the pedestrian connectivity aspect of a corridor when planning a change to the urban streetscape is useful in garnering the support of stakeholders (Southworth, 2005). Integrating access management policies into the local planning process and long-range transportation plan can help to ensure a project is implemented with minimal disturbance to a community.
In general, median installations provide significant safety and operational benefits compared to traditional full access designs such as two-way left-turn lanes (TWLTL). However, businesses—in particular those affected by a highway rehabilitation project and not new designs—generally argue that median-divided facilities reduce access to their storefronts, which they contend will impact their profits and competitiveness. Median-divided facilities provide many operational and safety benefits; however, the issue is not resolved in terms of the opinions of business owners.
Business owner complaints and the lack of support for median projects were the primary motivations for this research effort. The objective was to quantify the economic effects of median installations on businesses adjacent to multilane highways in an unbiased manner. This North Carolina (NC) specific research effort supplements research already completed in NC on the operational and safety impacts of median installations, all of which should assist transportation agencies and municipalities when engaging with the public on proposed access changes. This project attempted to capture and quantify various aspects of median treatments and business perspectives; however, local context and individual circumstances will vary by location.
Background/Literature
Economic Studies
Three primary methods of analysis have been used to examine the economic effects of median installations: (a) perception based surveys at reconstructed median installation sites, (b) before–after survey based studies, and (c) empirical studies using quantitative data.
The Florida Department of Transportation constructed medians on five corridors and evaluated median impacts using a perception based survey of drivers and businesses following construction (Ivey, Harris, & Walls, Inc., 1995). According to businesses, 57% thought the median changes had affected their volume of business positively or had no effect.
Vu, Shankar, and Chayanan (2002) studied six access-managed corridors in King County, Washington by surveying businesses following construction of the facility. The majority of businesses reported that median projects had a negative impact on their revenue and patronage. Perception models were utilized in this study to examine the relationship between the perception of accessibility and customer impacts due to access. The models confirmed the correlation of a businesses’ perception of accessibility and customer impacts due to access.
A study in Iowa examined nine median installation sites impact on local businesses in the state using a before and after perception based survey method (Center for Transportation Research and Education [CTRE], 1999). The overwhelming majority of surveyed businesses (94%) reported that sales stayed the same, increased, or had no response after the project was completed. Nine businesses reported a sales loss, with five involving raised medians and four involving TWLTL. In addition, the businesses along access-managed corridor projects had a lower rate of failure than other businesses in Iowa, likely due to increased development and revitalization on those corridors.
Eisele and Frawley (2000) studied 10 access-managed corridors in six cities in Texas using perception based surveys conducted before and after construction of the facilities. Overall, businesses reported that regular customer visits were positively affected or had no effect 86% of the time. Surveyed customers reported that the updated roadway median design projects had no effect or positive effect on their choice of sit-down restaurants (83%), gas stations (50%), and fast food restaurants (69%).
An overall look at the economic effects of median installations demonstrates a variety of experiences. Some areas and businesses reported negative effects through survey feedback and analysis of sales and property data, while other areas show either no effect or a positive effect. Overall however, the synopsis of existing research indicates that median projects have either a positive effect or no effect, a reasonably desirable outcome considering safety and operational benefits. The primary gaps of these current studies are: (a) a reliance on perceptions of business owners or customers only after the construction of the median treatment has been employed instead of a before and after or a comparison study, and (b) revenue-based studies have complications because they typically rely on business reported sales which in many, if not most, cases is estimated or impossible to determine (for instance, franchise data in an area cannot be associated with an individual location). For this reason, studies should continue to look into this problem while controlling for as many factors as possible. The following sections elaborate on safety and operational effects of median installations which are also part of the decision making process when deciding to install a median to divide a facility.
Safety Studies
Safety is often one of the driving factors in access management strategies, including median installation. A study in North Carolina examined corridor-level safety impacts by comparing 4-lane median-divided roads to 5-lane roads with a TWLTL lane among 143 roadway segments and found that median-divided segments were generally safer than TWLTL segments (Phillips, Carter, Hummer, & Foyle, 2005). Potts et al. (2004) studied the safety impact of U-Turns at median openings along urban and suburban arterials at 806 unsignalized median openings on 62 corridors in seven states and found that U-Turns at unsignalized median openings were not a serious safety problem. Liu, Lu, Chen, & Sokolow, (2008) examined the safety of right turn plus U-Turn maneuvers at downstream locations at 140 roadway segments and found that U-Turn crashes accounted for only a small percentage of crashes at these sites. Ott, Haley, Hummer, Foyle, and Cunningham (2011) looked at the safety impact of 13 rural unsignalized superstreet intersections and arterials, which restrict side street access to turn left or proceed straight across the mainline, and found that collisions were reduced at 12 of the sites. NCHRP Report 420 summarized the results of 11 studies that examined the safety impacts of replacing TWLTLs with nontraversable medians and showed a clear trend of crash reductions after the median was installed (Gluck, Levinson, & Stover, 1999). Schultz, Braley, and Boschert, (2010) looked at the physical characteristics of an access-managed roadway and the safety of users and found that the absence of typical access management design characteristics, including medians, indicated an increase in crash rate and severity.
Operational Studies
In addition to safety considerations, median treatments are also utilized to improve operations of the roadway, especially travel time and delay for the mainline highways in urban areas. Several studies have examined the operational impact of access management strategies, such as delay at intersections due to increased U-Turns and travel time issues for minor street traffic. Carter, Hummer, Foyle, and Phillips (2005) examined the effects of increased U-Turns at signalized intersections along median-divided roads in North Carolina and found that increased volume of U-Turning traffic added a small operational delay for the left-turn lane. Haley et al. (2011) looked at the operational effects of superstreet intersections (a form of access management median treatment) versus conventional intersections in North Carolina and found a significant reduction in the overall travel time for the intersection for all vehicles and all movements. Liu, Pan, Lu, and Cao (2008) investigated the effects of U-Turns on the capacity of unsignalized intersections on four lane divided roads and found that the capacity of the left-turn lane decreases with an increase in U-Turn percentage. Zhou, Lu, Yang, Dissanayake, and Williams, (2002) studied the operational effects of U-Turns as alternatives to direct left turns from driveways on eight arterials in the Tampa Bay area and described the situations where one maneuver or the other (direct left turn vs. right turn plus U-Turn) would provide the more efficient traffic flow.
Summary
Existing literature indicates an overall positive effect from median installations. Safety on the road corridor is improved with decreased conflict points and greater separation of opposing flows. Roadway operations are improved, typically with the greatest benefit along the mainline. However, even minor road traffic has been shown to have improvements in travel time and a minor positive effect on delay at these movements. Economic experiences of businesses on access-managed corridors have been shown to be generally positive or having little to no effect.
To address the concerns of businesses on a corridor scheduled for access management, the Federal Highway Administration (2006) has produced a primer on the needs for, and effects of, access management. The primer is directed to the business owner, with a discussion of key points typically considered at a public meeting related to access management. The primer notes that access management does not affect the demand customers have for a business’s goods and services, and that access, when evaluated in the mind of a customer, is a less important factor than price, service, produce, and store amenities that characterize the business. For the business owner, the primer summarizes the expected effects on property values, business activity, customers, and deliveries.
Concerning methodology, most previous research on economic effects used a type of survey method to gather data from businesses, with no true before and after studies completed to date, and very limited studies using empirical data. This particular study is different from previous research because of the comparison group used to create a before–after methodology, which enabled the research team to compare results under the same general macroeconomic conditions, similar traffic patterns, and roadway geometry.
Study Methodology
Based on the literature, three primary study methods exist: empirical, survey based before–after, and perception based surveys at access-managed facilities. Empirical based studies represent the most quantitative and unbiased studies; however, they are difficult to conduct because of the limited availability of accurate data. The two most prevalent study types were before–after and perception based surveys at median facilities. Before–after survey based studies are the preferred technique because they provide a process for determining more accurate perception changes; however, they are less common because they require data collection prior to the median treatment installation. Studies of access management impacts are typically desired in a short time frame and after construction, thus perception based surveys following the treatment installation represent the majority of those conducted to date. Our research team sought to improve on the previous methods to expand upon the mixed findings in previous research.
To generate the most accurate results, the research team initially attempted to conduct an empirical study using revenue-based data located within the Department of Commerce, similar to that conducted under NCHRP 25-4. A pilot test was conducted to determine if the data were usable or if other study methods needed to be explored. Similar to findings from previous research efforts, the revenue data were obtained but found to be unreliable due to missing data or the use of estimates for many of the businesses. Of the 31 businesses evaluated along a nearby pilot corridor, 28 used estimates of revenue based on models, while the other 3 were based on actual sales data (the authors would like to note that the findings in NCHRP 25-4 were later considered “seriously flawed” by the research panel and were not recommended for formal publication). Because the data provided insufficient accuracy using modeled estimates, another methodology was required—a before–after study using survey methods. The sites analyzed by the team were previous access managed facilities, so a true before–after survey method was not plausible, which was the case for all other previous literature. Therefore, a nearby site was used (many times along the same roadway at a location nearby the treatment location) that represented the basic characteristics of the treatment site prior to construction. This site is referred to as the “comparison site” and was used to represent the before condition. This was a significant improvement over previous perception-based studies conducted to date which only focused on the treatment site after the installation of the median.
Comparison sites serve two primary purposes for the analysis. First, trends at comparison sites will help account for general economic conditions, traffic growth, policy changes, and so forth. that have taken place since the economic downturn. A true before–after study during this time period would likely have included significant bias because revenues were likely already decreasing based on the general economy following treatment installation. Those same economic conditions would be inherent in the comparison group because questions would be asked at the treatment and comparison site within days of each other, allowing the team to make a reasonable assumption that economic issues during this time were not biasing the results. Second, comparison site respondents were asked the same questions as the treatment-site respondents. The only difference was the wording of the question for comparison sites. For example, treatment-site participants were asked if their revenues had changed since the median was installed. In contrast, comparison group participants were asked if they believed their revenues would change if a median was installed. In this way, the team looked at perception changes from the before period (represented at comparison sites) to the actual perceptions following median installation to determine if perceptions changed following installation. The perceptions from both the treatment and comparison sites, therefore, look to gauge the opinions of respondents in a before–after type scenario.
A true before–after survey based survey is desirable; however, that was not an option for the research team (and others who have tried before). The analysis methods used in this article rely on the assumption that the comparison sites accurately reflect what answers to the survey questions would have likely been prior to median installation. The research team believes the assumption is reasonable, and is likely stronger than previous studies at multiple treatment sites with no direct comparison.
Survey Development
The team identified seven treatment and seven comparison sites that contained dense business development to survey under this study. Based on estimates of the sample size at each corridor, the research team predicted a total of approximately 700 businesses available to survey. Based on this sample, the team decided to conduct door-to-door surveys in lieu of a mail-out method to obtain more robust conclusions. This led to much higher response rates than expected with other methods and reduced concerns about respondent confusion when completing the survey.
The survey had three focus areas: questions based on general information about the business, economic effects, as well as surrogate effects such as operations and safety. The first section of the survey was geared to more general business related questions with no mention of the median installation to eliminate any potential bias in answers (Questions 1, 2, and 3, below). The second section of the survey asked questions specifically about the perceived effects of the median on various measures (Questions 4 and 5, below). The third section of the survey asked surrogate questions on topics such as safety, operations, delivery, and so forth. Although these were not specifically tied to this particular research effort, the findings from the surveys could be compared to findings from previous research using more quantitative methods. Key questions from the first two sections of the survey used in our analysis include:
Survey Question 1 (SQ1): When did this business begin operations at this location, if known?
Survey Question 2 (SQ2): Please rank the following considerations in ascending order from 1 to 6 (with 1 as the most important) that you think customers use when selecting a business of your type, please assign each number only once: Accessibility to Store, Customer Service, Distance to Travel, Hours of Operation, Product Price, and Product Quality.
Survey Question 3 (SQ3): Has your expected monthly revenue pattern changed since [year of median installation]? If you answered YES, please describe why you think the fluctuation occurred (List all applicable reasons).
Survey Question 4A (SQ4A)—For Businesses at
Survey Question 4B (SQ4B)—For Businesses at
Survey Question 5A (SQ5A)—For Businesses at
Survey Question 5B (SQ5B)—For Businesses at
Site Selection
Through input from state and local agencies, as well as personal knowledge, the research team identified an initial set of 47 sites across North Carolina where median projects had been installed within the past 15 years. The projects included median installations, median break closings or modifications, and intersection restrictions. From this initial set, the researchers selected seven treatment sites for the study based on the following characteristics:
4-lane or Larger Segments were preferred over smaller cross sections.
Longer Segment Lengths were preferred for larger sample sizes.
More Recent Installation of the Median was preferred for accuracy of business owners’ memories.
High Business Density is preferred for greater sample size and less ambiguity with other businesses that might develop on the corridor after construction.
Geographic dispersion throughout the state was important to relate the results to businesses across the entire State.
One comparison site was selected for each treatment site to provide some control for possible biases such as general economic conditions, specific local economic issues, and driver demographics. Multiple comparison sites were identified for each treatment location, and a ranking was applied to select the best possible corridor for comparison. This selection was based on similarities in factors at treatment sites such as proximity, business density, driver population and demographics, and traffic volumes. In some cases, the researchers were simply able to use another section of the same road that was adjacent to the treatment section that did not receive the median treatment. In other cases, the comparison site was a nearby road section that closely matched the treatment site, many times a cross street of the treatment site. Table 1 shows the treatment and comparison sites, displayed in their matched pairs.
Descriptive Data on Selected Treatment and Comparison Sites.
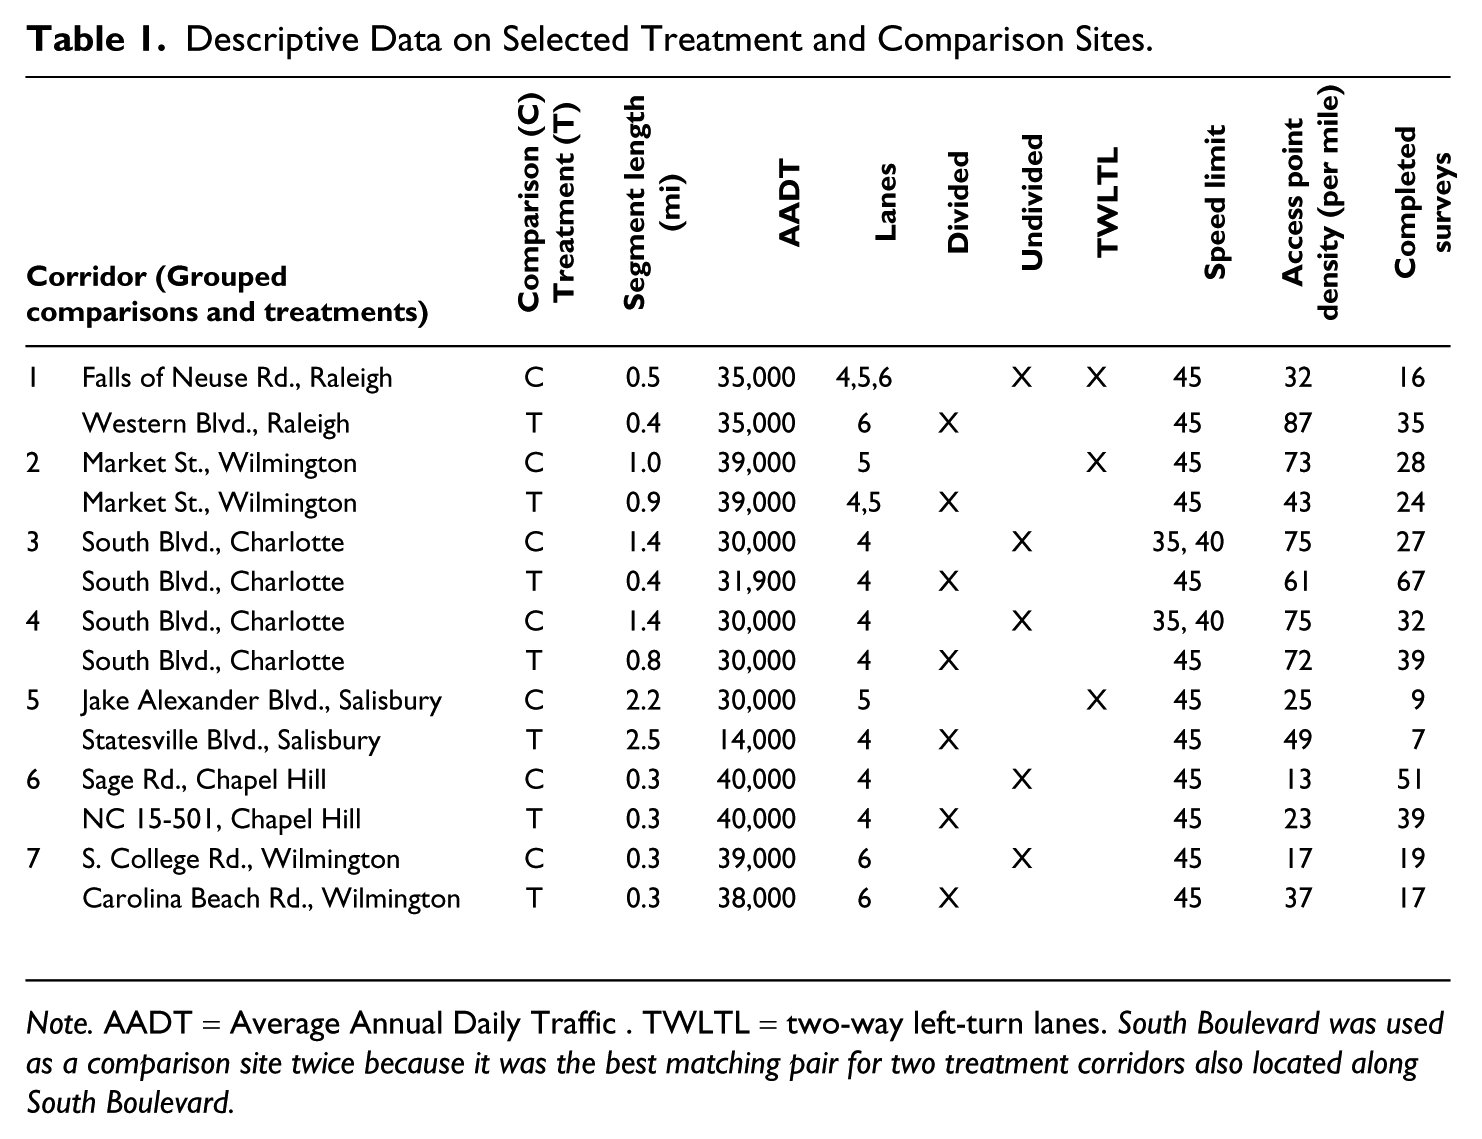
Note. AADT = Average Annual Daily Traffic . TWLTL = two-way left-turn lanes. South Boulevard was used as a comparison site twice because it was the best matching pair for two treatment corridors also located along South Boulevard.
Five of the treatment sites were median installations, and two were conversions of signalized intersections to signalized superstreets (also median-divided facilities). Superstreets, discussed earlier in the literature, are an unconventional intersection design being utilized more frequently for operational and safety improvements through the use of a median and restricted side street movements, particularly in North Carolina. This treatment has also been shown to have positive operational and safety benefits based on recent research, similar to more typical median treatments.
All sites studied were located on major arterials leading into and out of the respective city. Businesses along the sites were predominantly retail and services (food, personal services, and automotive-related businesses) along with a mixture of various financial, technical, and health business types as well. Data collection was conducted through field visits and in-person surveys, administered to the owner or manager of the business. In all, a total of 416 surveys were successfully completed, comprised of 212 surveys from treatment sites and 204 from comparison sites.
Analysis and Results
Introduction
Ultimately, the survey attempted to capture the perceptions and attitudes of business owners, managers, and employees related to the economic effects that median installation may have had on their business. The survey coincided with a recent economic recessionary period, and it was understood that it may not be possible for survey respondents to completely extricate the effects of the median installation and the recession. The comparison sites worked well in accounting for the potential effects of the economy on respondent answers, noted earlier in the study methodology. In summary, there were 484 unique nonvacant records in the final business database along with 121 unique recorded vacancies, or a total of 605 business records. Of the 484 nonvacant business locations in the database, 272 (56%) were from comparison sites and 212 (44%) were from treatment sites.
Survey results are presented through the use of descriptive statistics. In many cases, survey questions asked respondents to classify parameters, or rank several parameters, in order of importance. These results are usually presented as tables of proportions. When appropriate, tests of significance for these proportions were performed to determine if the results represent a statistically significant change at a confidence interval of 95% (p < .05) in perception between the comparison and treatment sites. Where findings are not significant but warrant the display of p-values, the actual p-value will be given for the reader to make inferences.
Economic Impact
Treatment and comparison site owners were asked if their monthly revenue patterns changed since the year of the median installation. For comparison sites, the year of installation for the corresponding treatment site was used. At the point in time when these questions were delivered to respondents, they were not aware of the primary reason for the survey and thus responses were not biased in any way towards the median installation.
Out of 484 total business responses, 238 (49%) reported a decrease in monthly revenues, 103 (21%) reported an increase, and 143 (30%) reported no change in monthly revenues since the year of median installation. The breakdown of these results by before–after periods, business type, and site number are given in Table 2.
Survey Results: Monthly Revenue Change Before–After, Business Type, and Site.
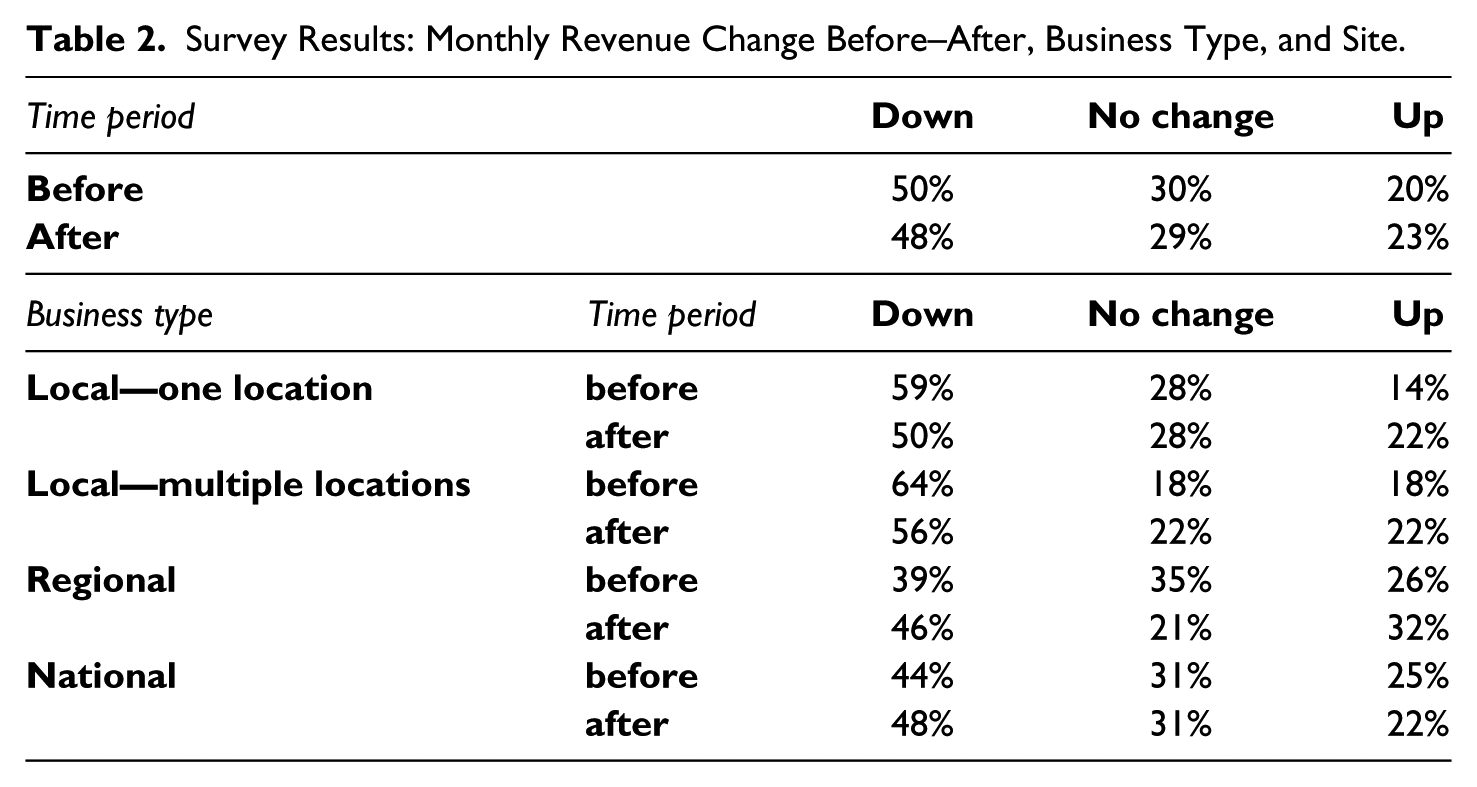
At a 5% level of significance, there is insufficient evidence to conclude that there are differences in revenue proportions when comparing before–after periods and Total businesses type breakdown groups described by Table 2. It is evident when looking at the three columns that there are only very minimal differences.
Significance testing was not appropriate for the business type categories due to low survey sample sizes in most cases. Although the sample sizes were small, suggesting caution when making comparisons, it is not unreasonable to conjecture that, overall, businesses were generally operating at the same revenue that they would have been operating had the median not been installed. Looking at each category by row, before and after periods seem to have (roughly) equal proportions of decrease in revenue versus no change and increase in revenue. Thus, the overall before–after comparisons, along with the basic statistics of business types, suggest that medians do not appear to have affected the overall stability of corridors when looking at revenues.
Another possible indicator of economic impact is business turnover rates following median installation. While the survey results could not provide direct historical data on the number of vacancies over time, the research team used an analysis of businesses that began operations after the median installation (referred to as “new” businesses) as well as current (at the time of survey) vacancy counts to gain some insight into the general economic condition of the sites at the time of the survey. For simplicity, any business location that is vacant or has a new tenant since the date of median installation is termed “new/vacant,” which will be considered as a surrogate measure for actual “business turnover rate.”
Table 3 provides a summary of business turnover rates. Examining vacant businesses only, a total of 101 out of 725 (14%) visited business locations in the entire database were actually vacant (not new and vacant) at the time of the survey; which account for 6.8% and 7.2% of all sites before and after installation of a median, respectively. This was not shown to be significantly different at the 95% confidence interval.
Percentage of New/Vacant Business Locations by Before–After Site.

When evaluating new business sites being surveyed, turnover during the after period was significantly higher (p < .01) than the before period. While the economic comparison of before and after periods showed no difference in vacancy rates, there is evidence that some treatment-site businesses may have left the location prior to the survey date when looking at the survey responses on a site-by-site basis and considering new business openings since the opening date of the median installation. Conversely, a high occurrence of new businesses following treatment installation likely indicates some positive economic activities during the after period such as regrowth of the corridor.
Supplemental Findings
Aside from the central question of economic effect, other survey results yield insight into differences in perception from before and after the treatment installation, as well as to potentially validate empirical results from previous research on safety and operations in North Carolina. Regarding the median installation, survey respondents were asked if they were in favor of the roadway modification to increase safety following median installation. Comparison site business owners were asked if they would be in favor of roadway modifications to increase safety, representing the before period. Table 4 shows the results by before–after, business type, and by site.
Survey Results: In Favor of Raised Median to Increase Safety by Before–After Period, Business Type, and Site.
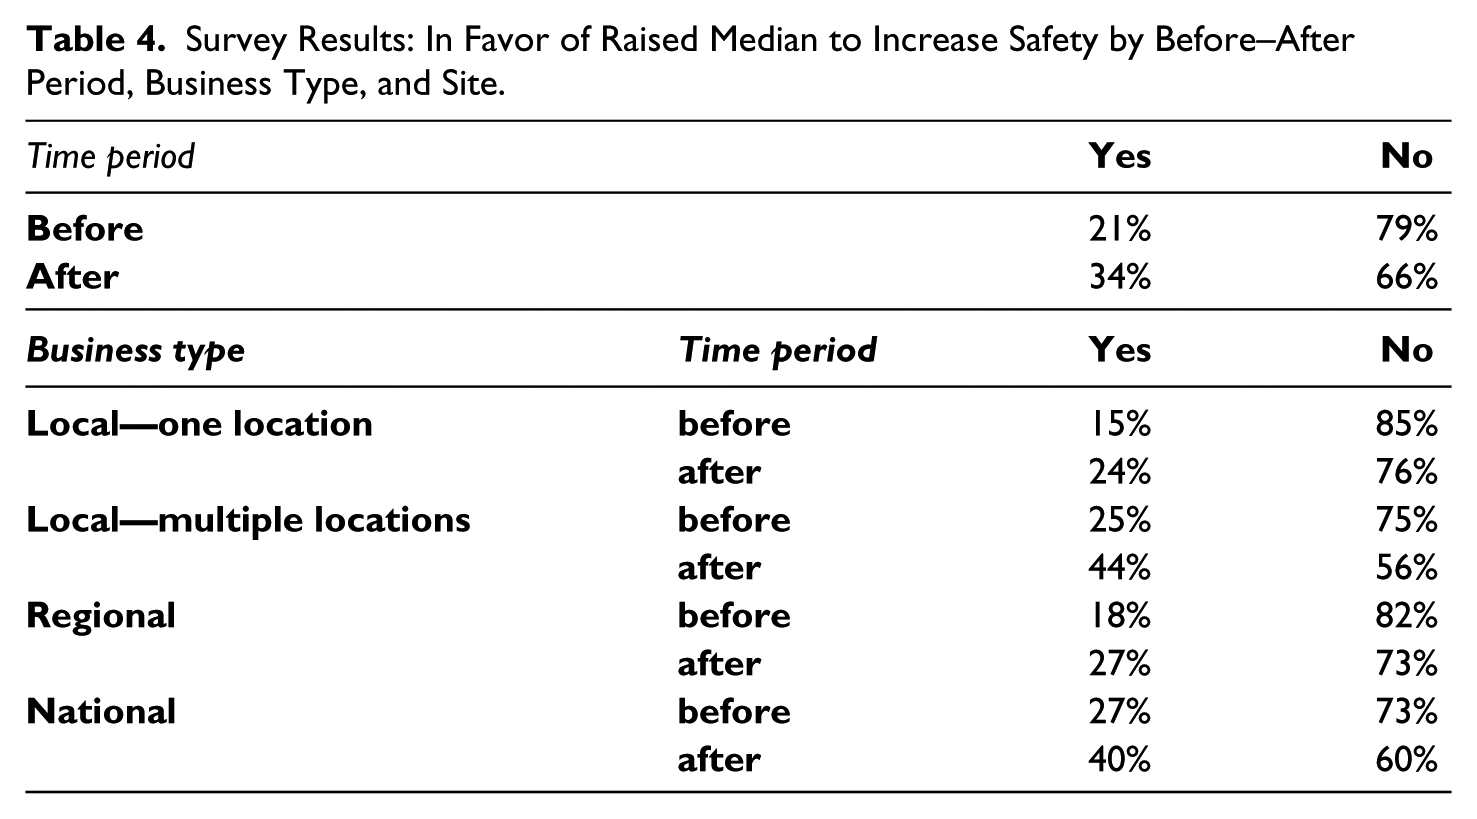
The table shows a clear tendency toward more negative perceptions of medians to increase safety in both time periods. However, perceptions seemed to have significantly improved following installation of the median (p < .05). Testing on the business type breakdown revealed that there is not sufficient evidence (at a 5% level of significance) to conclude that there are differences between before and after period responses when considered as local (both types), regional, or national. However, each individual group showed that perceptions of safety increased or stayed the same following installation of a median, which aligns well with empirical findings noted earlier in the literature review.
While Table 4 would seem to indicate a general negative perception on the behalf of business owners towards the installation of a median, other related survey data provide additional insight into business owner’s perceptions. One particular survey question asked participants to rank the attributes in order of importance as considered by their customers: accessibility to store, customer service, distance to travel, hours of operation, product price, and product quality. Only 18% and 15% of businesses in the before and after periods, respectively, ranked accessibility to store as their customers’ highest priority. In fact, 59% and 62% of businesses in the before and after periods, respectively, ranked accessibility as fourth, fifth, or sixth. Thus, while business owners may have generally negative opinions on the impact of medians, they do not seem to feel accessibility is a high-ranking consideration among their customers.
Last, survey respondents were asked if the installation of the raised median made the following better, worse, or stay the same: safety, congestion, number of customers per day, sales transactions, property value, accessibility to store, and delivery convenience. The results are provided in Table 5.
Survey Results: Impact of Raised Median on Business-Related Attributes by Comparison/Treatment Sites.
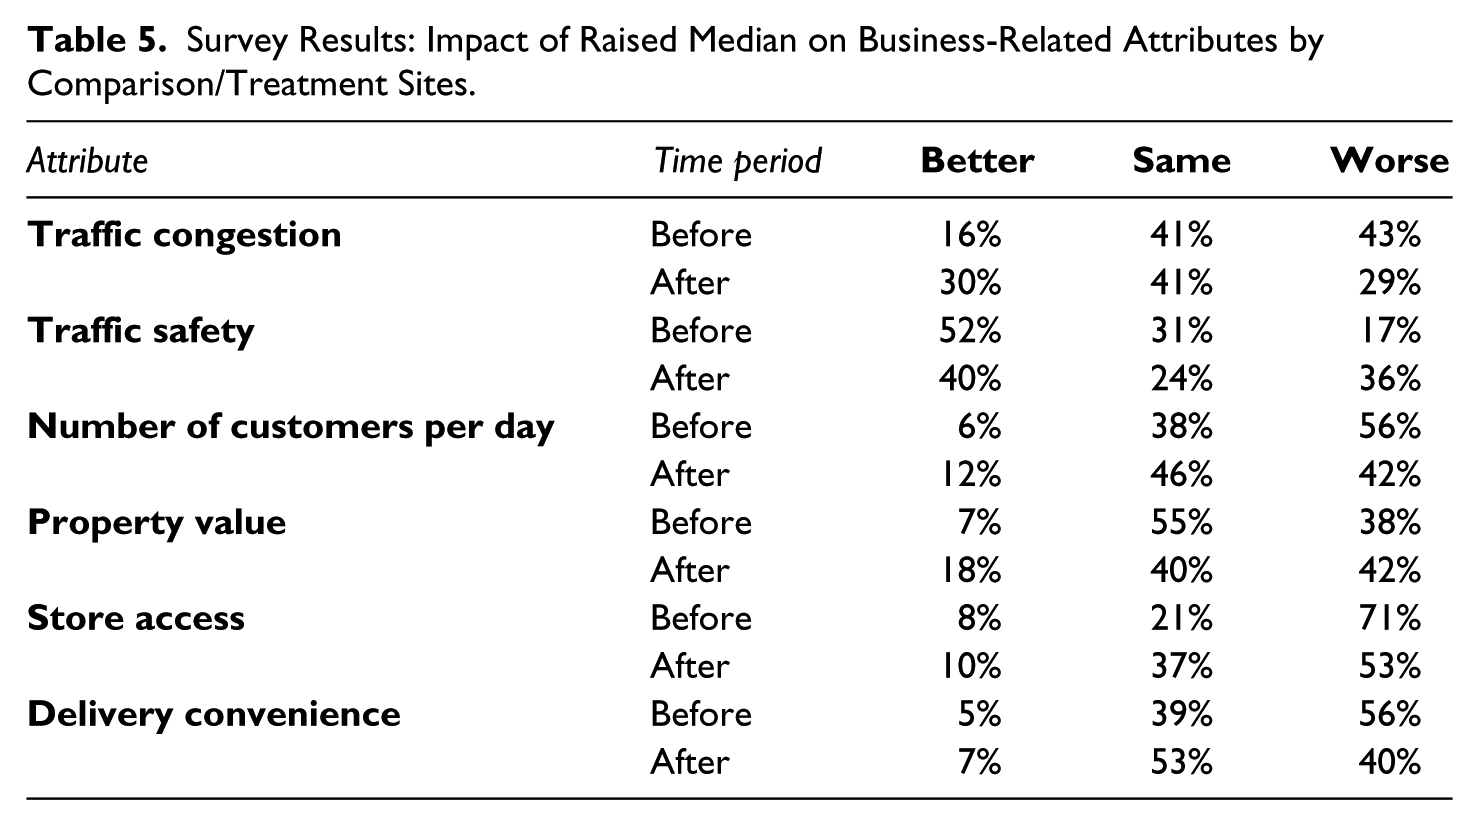
When examining before and after period responses for worse (or better and same combined), the differences between proportions in each set of pairs is significant (p < .05). Therefore, business owners have significantly different perceptions of each of these attributes before and after construction of the median.
For instance, 43% of respondents felt that a median would worsen traffic congestion in the before period, while only 29% of respondents believed that the median actually did worsen congestion after construction. This indicates that perceptions of the median on congestion likely improved after installation. This finding supports previous research on operational impacts of medians provided in the literature.
Even more pronounced is the perceived impact on safety. The vast majority (83%) of businesses in the before period believed that safety would improve or stay the same, compared to businesses in the after period where 64% of business owners believed the same. Although the perception of safety decreased following installation of the median, the majority of respondents did believe there were significant safety improvements. Similar to the operational effects, this corresponds very well with research summarized in the literature review.
Similar to the safety results, 44% of respondents in the before period felt that a median installation would increase or have no change in the number of customers per day, compared to 58% of respondents in the after period who indicated that the number of customers actually increased or stayed the same. These results suggest a shift in perception from the before to after period and may indicate that some negative preconceptions of median impact on sales did not come to fruition.
Customer satisfaction with access to the store was also surveyed. Seventy one percent (71%) of businesses during the before period thought that access to the store would get worse, while businesses during the after period said 53% of customers indicated access was actually worse in their opinion. This is an important question because the perception of business owners in the before period represent a population subset similar to that of business owners going to public meetings. Although findings were generally negative regarding access in both periods, it appears that business perception of customer accessibility improved. Also, for treatment sites only, an equal split of better and no change versus worse access is shown (47% vs. 53%).
The last surrogate measure was delivery convenience. The perception of delivery convenience improved after installation of the median. Fifty-six percent of respondents indicated that the median would make deliveries worse prior to the median installation, while only 40% indicated that they perceived the actual median installation to actually make deliveries worse following construction of the median.
Conclusions
This study focuses on the perceptions and attitudes of business owners and managers towards median installations. The team conducted a before–after study using businesses at comparison sites as a surrogate for the before period. The team acknowledges that conclusions based on surveys of completely different business cohorts at comparison sites should be considered with caution; however, the use of these sites does provide a good indication of what would be the true outcome in the before period had an agency actually conducted those surveys. In addition, research findings in previous efforts have no basis for comparison, so the findings from these similar comparison sites should provide more comprehensive findings than only surveys of business owners after median installation.
A large sample of data was collected to determine the overall perceived effect of median installations, and in most cases sample sizes were large enough to conduct significance testing by individual site pairs. The major findings in this study are provided below.
Economic Effects
1. There were no significant differences in revenue changes when comparing before and after survey responses from all sites. Even when looking at individual site pairs, it is reasonable to assume that businesses were generally operating at the same revenue they would have been operating had the median not been installed (Table 2).
2. Overall, differences in turnover before and after median installation were not statistically significant. When investigating further, vacancy rates were similar at each of the sites. However, there did appear to be more new business filling vacancies at the site left over from before median installation, bringing new attractions where older ones once existed.
Surrogate Effects
3. Generally, both before and after period business responses were negative when asked if they were in favor of median modifications that would improve safety; however, there was a significant change in attitude from the before to the after period which seems to indicate that perceptions improved following actual median installation. When looking at individual site pairs, every pair showed that perceptions of safety improved or stayed the same after the median installation.
4. Only 15% of businesses in the after period ranked accessibility as the number one consideration of customers for their business. In addition, 62% of respondents in the after period ranked accessibility as fourth, fifth, or sixth.
5. When asked if the median installation would make various parameters better, worse, or stay the same, a high percentage of respondents agreed that traffic congestion and safety would improve or stay the same if the median were installed.
6. It appears that the perceived effect on the number of customers per day was much worse in the before period in comparison to the after period, indicating that the median did not affect customers as significantly as was originally estimated by businesses. In addition, accessibility to store was perceived to be much worse before construction of the median indicating again that the median did not negatively affect customers as much as originally thought.
In general, the survey data indicates a significant and positive change in respondent’s perceptions between before and after periods. In spite of the overall negative reactions to proposed median installations, survey data from the business owners presented in this article appear to support a more favorable perception after installation occurs. The before period data shows that business owners perceive a more harmful effect of median projects than indicated by the data in the after period. These findings also give some validity to the comparison sites chosen in this study since the findings are consistent with findings from previous empirical studies of traffic operations and safety.
Recommendations
The impetus for a median treatment on a corridor is typically in response to safety or congestion concerns. However, economic effects are a legitimate concern for business owners located along the treatment site. Previous studies have shown that medians improve safety and operations through a reduction in the number of conflict points and separation of opposing traffic flows. Figure 1 displays the results from this study and other related studies across the United States about access, customer, economic, traffic, and overall effects of median installations. In general, across all attributes, the studies found that medians have no impact or a positive impact.
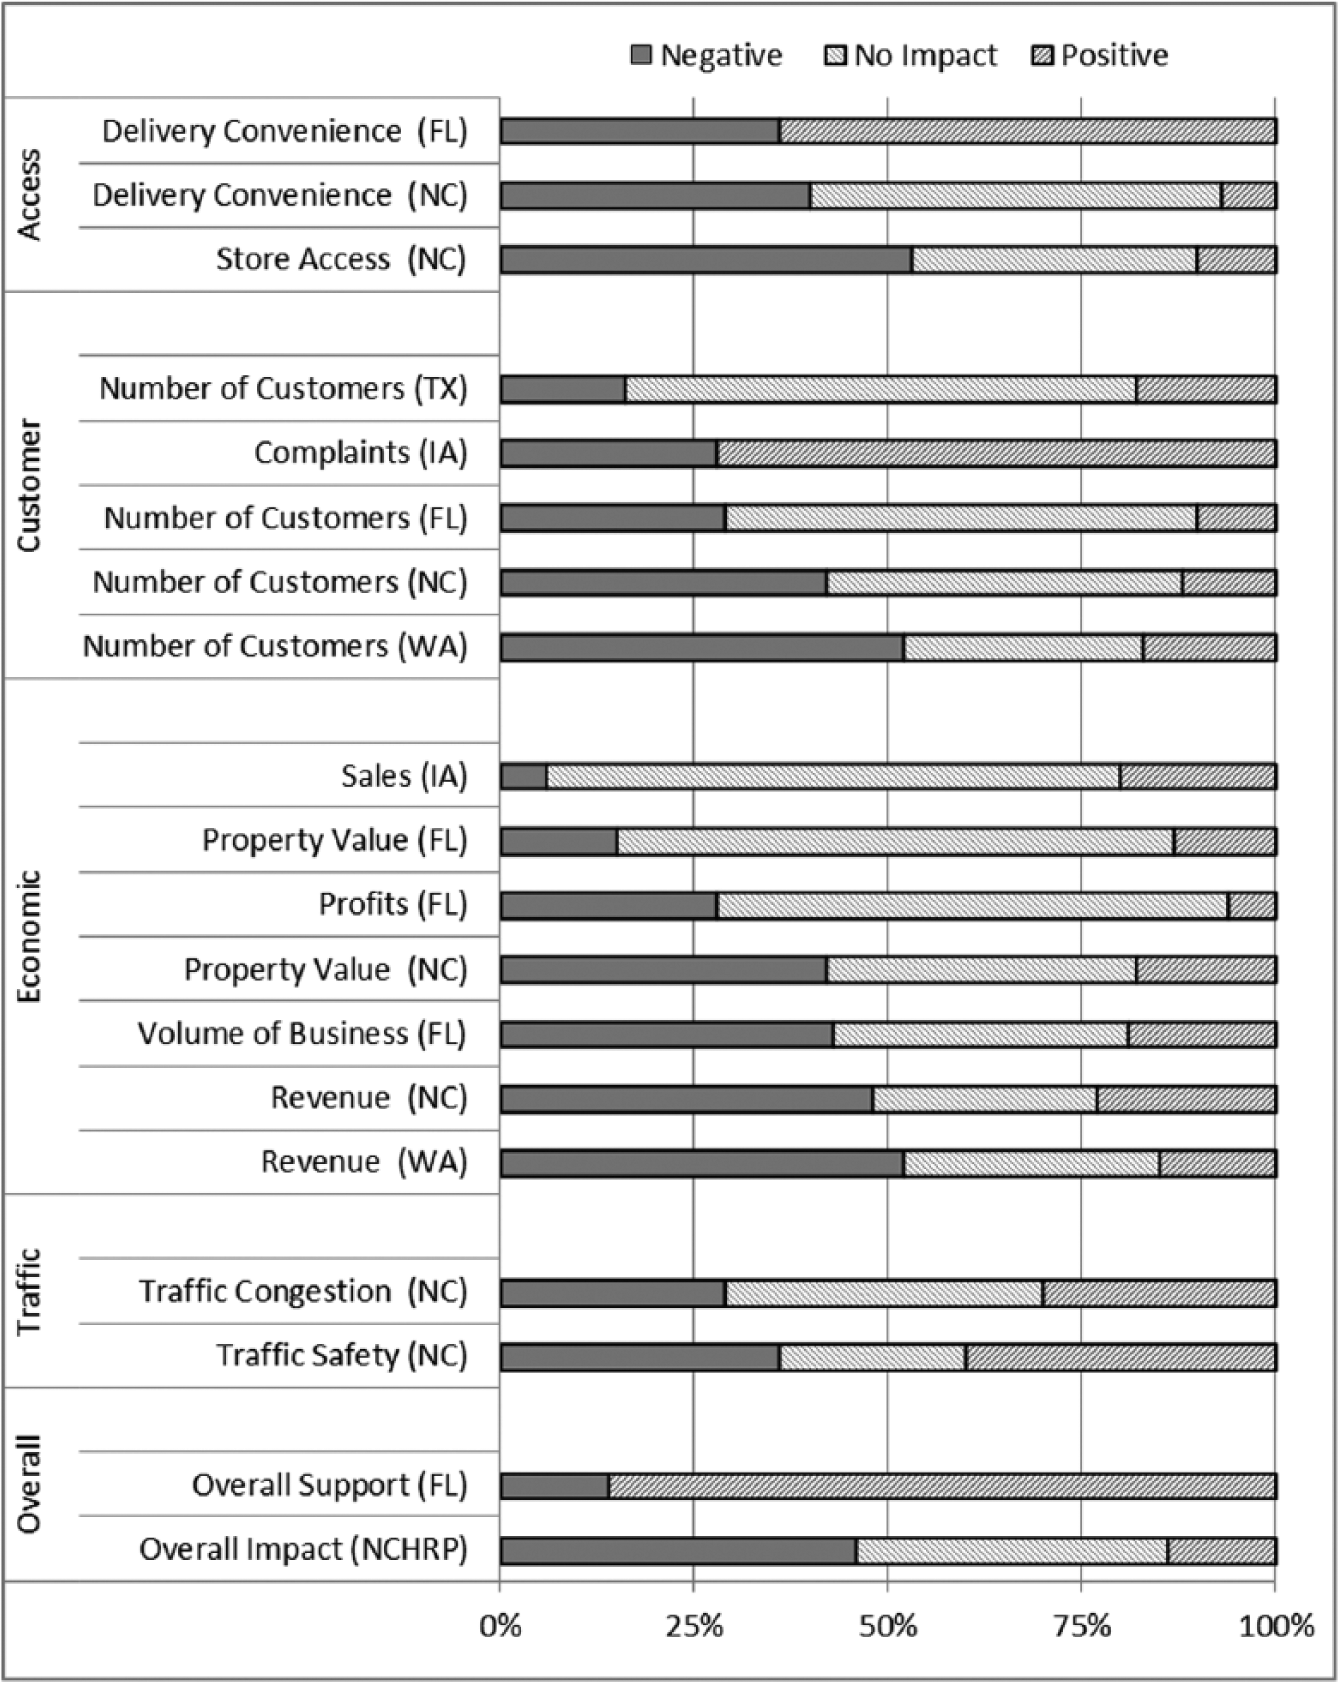
Median installations—survey results and comparison to other studies.
Based on the findings from this research effort on economic effects of median installations, along with previous studies on operations and safety, medians do not appear to have an adverse effect on business activity. Although businesses have raised concerns about the effect of median installations on their business, there does not appear to be a sustained negative affect after installation. In fact, the team surmises that the majority of the negative affect is during the construction period based on the fact that vacancies during construction were quickly filled following construction. To eliminate the effect of a retrofit median installation, the team further recommends that median treatments be considered for new construction so that retrofits are not necessary many years later.
Last, the team should note that during the site selection process, one site appeared to have a median installation that was a-typical and did not have nearby U-Turn openings, instead requiring a U-Turn at an adjacent interchange a couple miles downstream. When asked, NCDOT (North Carolina Department of Transportation) acknowledged this issue and provided justification based on right-of-way constraints. The research team collected supplemental (unused) data at this site using the same surveys as other sites actually studied under this project. Based on feedback from local businesses, the lack of accessible U-Turn openings was perceived as detrimental to the local businesses as several vacancies have not been filled and tenant lease rates were reduced in some cases. Based on this feedback, we recommend that such installations where nearby U-Turns cannot be provided, transportation agencies consider other alternative designs.
Footnotes
Declaration of Conflicting Interests
The author(s) declared no potential conflicts of interest with respect to the research, authorship, and/or publication of this article.
Funding
The author(s) disclosed receipt of the following financial support for the research, authorship, and/or publication of this article: The authors received financial support for the research of this article from the North Carolina Department of Transportation