
Abstract
Linear assets including roads, pipelines, and railroad tracks are defined assets whose lengths play a critical role in their maintenance. Linear assets, along with their features, which include traffic lights, number of lanes, speed limits, guardrails, and highway billboards, are hard to physically access and, therefore, update inventory information files that were previously captured. To address this problem, some transportation agencies are investigating technologies that will assist in solving this asset inventory problem. The primary focus of this paper is to evaluate the feasibility of using radio-frequency identification (RFID) technology as a means of gathering, verifying, and storing information for linear assets. The study investigates confluence factors that affect the performance of RFID. The factors investigated include driving speed and tag location on signposts, delineators, and guardrails. The results indicate that for the three vehicle speeds tested (10 mph, 20 mph, 30 mph), tag readability decreased with an increase in speed.
Background
A linear asset is an asset whose length plays a critical role in its maintenance; examples include roads, pipelines, or railroad tracks. This study considers only roadways. The major characteristics of a linear asset are that it has a start and end point, features that change over its span, and it can be maintained in segments for specific work and track progress. Features of a linear asset, specifically roadways, consist of traffic lights, number of lanes, speed limits, guardrails, and highway billboards. For example, speed limit is an attribute of a highway (a linear asset) with multiple possible values (40 mph, 50 mph, and so on). A roadway beginning at mile 0 and ending at mile 60 may have variable speed limits: A speed limit of 55 mph may be in effect for the miles 0 through 20, and a speed limit of 65 mph may be in effect for the miles 20 through 60. At the same time, the number of lanes might be three lanes from miles 0 to 40, and four lanes from miles 40 to 60. Similarly, there are different types of guardrails that may be available along the roadway. Therefore, one can specify that “type” is an attribute of a guardrail and then designate a value for each type of guardrail.
RFID is a technology that uses communication via radio waves to exchange data between a reader and an electronic tag attached to an object. RFID technology is used for identification and tracking. RFID technology has been used for many years; for example, during World War II (WWII), it was used to distinguish between enemy planes and a country’s own planes returning from a mission (Roberti, 2005). Since WWII, RFID technology has been applied in many disciplines such as asset tracking, highway toll collection, opening car doors with key chain devices, tracking a population of wild animals, and hospital operating rooms for tracking operating equipment. In the transportation industry, RFID technology has been used since the mid-1980s with tags attached to chassis carriers to serve as “license plates” (The basics of RFID, 2011). In recent years, RFID technology has been investigated for its applicability in the construction industry (Ross, Burns, Wu, & Jared, 2009), managing the right-of-way (ROW) utilities (Lodgher, Perkins, Yang, Jones, & Hawkins, 2010) and roadway assets (Fedrowitz, 2007; Liu & Cai, 2007; Wang, 2006; Yates, 2009). Regardless of current efforts to use the technology to manage roadway assets, the literature related to factors affecting its performance is still lacking. Therefore, in this paper we evaluate the feasibility of using RFID as a means of gathering, verifying, and storing information and document factors affecting its performance.
Following this introduction is a review of literature on RFID technology for managing linear assets. The study methodology used to achieve the study objectives is presented next followed by a discussion on the data-collection process. The data analysis and discussion are presented thereafter followed by conclusions drawn in this study and, finally, recommendations for future research.
RFID for Managing Roadway Assets
Liu and Cai (2007) investigated the performance of passive long-range RFID tags to locate highway reference markers along Loop 1 in Austin, Texas. The RFID tag with marker information including the sign’s location, type, size, height, and condition was attached to mile-markers at 2.65 ft. above ground. Readers were mounted on official vehicles to query information encoded in the tag. The study found that the system was able to query tag data at high vehicle speeds (more than 55mph) with a read range of up to 40 ft.
At Virginia Tech, researchers (Fedrowitz, 2007; Yates, 2009) are investigating the use of RFID technology to manage highway assets located in the ROW for the Virginia Department of Transportation. Yates (2009) and Fedrowitz (2007) research was performed to examine, test, and present how RFID technology could be implemented to enhance data storage and retrieval applications. These studies tested two systems (short-range and long-range) under two settings (static and dynamic) on the Virginia Tech Transportation Institute (VTTI) Smart Road in Blacksburg, Virginia. For both systems, the RFID tags were mounted to metal at 1/10th mile marker signs.
For static testing (vehicle not moving), researchers tested the effect of the horizontal distance between the tag mounted on a metal mile marker and a hand held reader. For dynamic testing (vehicle moving), the studies investigated the effect of vehicle speed and horizontal distance between the tag mounted on a metal mile marker and a reader mounted on a vehicle. The horizontal distances tested were 5, 10, 25, 50, and 100 ft. from the tag, and the maximum distance that the reader could detect a tag was also recorded. The four vehicle speeds tested were 10, 20, 30, and 60 mph. The studies found that under static settings, the long-range system could read a tag mounted to a mile marker sign from up to 115 ft. away and 115 ft. away at 10mph under dynamic settings. At a highway speed of 60 to 65 mph, the long-range system was not very consistent and was capable of reading a tag at a maximum distance of only 25 ft. Furthermore, the studies found that the short-range system could read only two inches when an RFID tag was mounted one centimeter from a metal mile-marker.
The research team at the Texas Transportation Institute (TTI) and Prairie View A&M University (PVAMU) investigated the feasibility of using RFID technology to manage assets in the Texas Department of Transportation (TxDOT) ROW. The project focused on using RFID to support managing utilities, outdoor advertising, ROW marker/survey control, and other highway infrastructure features and attributes. The research team conducted laboratory evaluations on the performance of RFID tags in selected buried applications, developed an integration schema for RFID application, assessed the feasibility of TxDOT using or requiring RFID to manage assets in the ROW, and identified implementation opportunities for RFID in ROW applications. The research team found that RFID technology, though widely used for inventory control, has limited application in the highway ROW. In addition, the research team found that RFID technology might have benefits in limited applications, such as utility relocation projects and survey monumentation (Lodgher et al., 2010).
Limitations of Current Investigations
Recent investigations in managing roadway assets using RFID has shed light on the developments and applications of RFID technology in transportation. Based on the reviewed studies, the following limitations were identified:
Passive RFID tags were used for studies that used mile markers and signposts to investigate the feasibility of using RFID for managing roadway assets. Thus, there is a need for similar studies using active RFID tags to compare further the performance of the two types of tags.
With the exception of underground utilities, most studies have investigated RFID performance on managing metal assets located on the roadways. Therefore, there is a need for investigating RFID performance with tags attached to other materials commonly used for fabricating roadway assets.
Studies investigated the performance of RFID technology under varying horizontal distance but not vertical distance, which is essential in determining the appropriate tag mounting height on roadway assets.
Type of Tag and Reader
The study used RF Code, an active RFID-enabled infrastructure, for real-time asset management. The 433 MHz M171 Durable Tag is a battery-powered RF transmitter designed with a sealed, water-resistant, crush-proof enclosure for general-purpose asset tracking. Every tag broadcasts its unique ID and a status message at a periodic rate, which is programmed at the factory. The M171 operating temperature is −20° C to +70° C, operating humidity is less than 95%, and Relative Humidity (RH) noncondensing.
The study used a RF Code M220 reader, which is a battery-powered, portable reader that processes active RFID tag data and links directly to a computing device. It is equally valuable for the performance of on-demand audits and field inventories. It can be worn on a belt clip, mounted in a vehicle, stowed in a pocket, or used in a variety of ad hoc applications. The M220 operating temperature is −20° C to +45° C, and operating humidity is 10% to 90% noncondensing.
Site Characteristics
The factors used for selecting a suitable site for testing to achieve the study objectives were geometric characteristics, posted speed limit, traffic volume, and presence of traffic signs. In this study, a roadway with a speed limit of 55 mph, low traffic volume, and traffic signs was selected. This roadway was selected because it has low traffic volume and favorable roadway geometric characteristics that allows low-speed and high-speed testing. Furthermore, the site has driveways in its vicinity to facilitate turning of the test vehicle once it has passed the interrogation zone. The site is located along Farm to Market 1098 (FM 1098) that runs in a north-south direction and is very close to PVAMU main campus in Prairie View, Texas. Although freeways offer high speed, they were excluded from consideration because of their limited access and high traffic volume.
Study Design
The study considered most factors known and believed to influence RFID performance. Factors considered included vehicle speed, horizontal distance, tag height (vertical distance), and asset material type. The study tested three vehicle speeds: 10 mph, 20 mph, and 30 mph. These speeds are below the posted speed limit, and this was done after trial runs resulted in low tag detection at high speeds. The horizontal distance was measured from the driving lane to the tag location on the roadway asset. Thus, driving on a lane close to the tag reflected the closest horizontal distance, and, similarly, the outer lane reflected the farthest distance. Furthermore, the study investigated two tag heights, namely, 4 ft. and 7 ft., on delineators and signposts. With respect to the material type on which the tag was attached, the study investigated metal represented by signposts and guardrails and plastic represented by delineators. The site did not have concrete assets; therefore, this material type was not considered in this study. The effect of metal obstruction on tag detection was investigated by attaching the tag at three positions: low point, medium point, and high point on the back of signposts. Furthermore, it is worth noting that in all scenarios, the reader was positioned at a fixed position and the passenger car window at 4.25 ft. above ground. The data collection procedure for each of the aforementioned scenarios is presented in the following sections.
Tags at 4 ft. on Sign Posts and Delineators
In linear asset management, RFID technology can be used to identify and track roadway features that could be missing or knocked down and to provide updates on the status of their condition. In this study, eight RFID tags were attached to different roadway signs along highway FM 1098. Signposts made of metal included a crosswalk, speed limit, Adopt-a-Highway, and caution. Delineators were equally represented by plastic material. Eight RF code tags were attached to features at 4 ft.: four to the signposts and four to the delineators. First, the study was done with all the tags located on one side of the roadway and then subsequently with the tags spread over both sides of the roadway.
Tags at 7 ft. on Sign Posts
Under this scenario, eight tags were attached on signposts at 7 ft. on one side of the roadway, FM1098, and then again on both sides of the roadway. This scenario served to explore the effect of higher heights on RFID performance because the tag height was relatively high compared with the reader height. Delineators were not more than 5 ft. high and, therefore, were not tested at this height.
Tags on the Back of Sign Posts
In this setting, the tags were attached at the low, center, and top points on the back of the signs. For each of the points, the research team measured and recorded the height of each of the tags. Then, the vehicle with the reader mounted on the passenger window drove past the signs at 10, 20, and 30 mph to test the detection of the tags. This was done for all tags located on one side highway FM 1098 and for those located on both sides of the roadway.
Tags on Guardrails
The test site had only metal guardrails, so the study results are only applicable to metal guardrails. Further research is needed for concrete guardrails. Tags were placed at varying height on guardrails ranging from 2ft to 2.58ft. In total, the study used five tags for testing one side of the roadway and all the eight tags for testing both sides of the roadway. Tag detection and signal strength were recorded as the vehicle passed through tags at 10, 20, and 30 mph.
Data Analysis and Results
The research team computed the tag readability rate as shown below and summarized an average Receiver Signal Strength Indicator (RSSI), a measurement of the power present in a received radio signal for each study scenario. The readability rate and RSSI values were used as performance measures in this study. It is worth noting that weather data including wind speed, temperature, and humidity from a nearby weather station (around five miles from the data collection site) were collected and matched with readability data using recorded time. However, results pertaining to weather effect are not reported due to unreliability and lack of conclusive patterns.

The following subsections present the detailed analysis for each scenario.
Tags on Guardrails
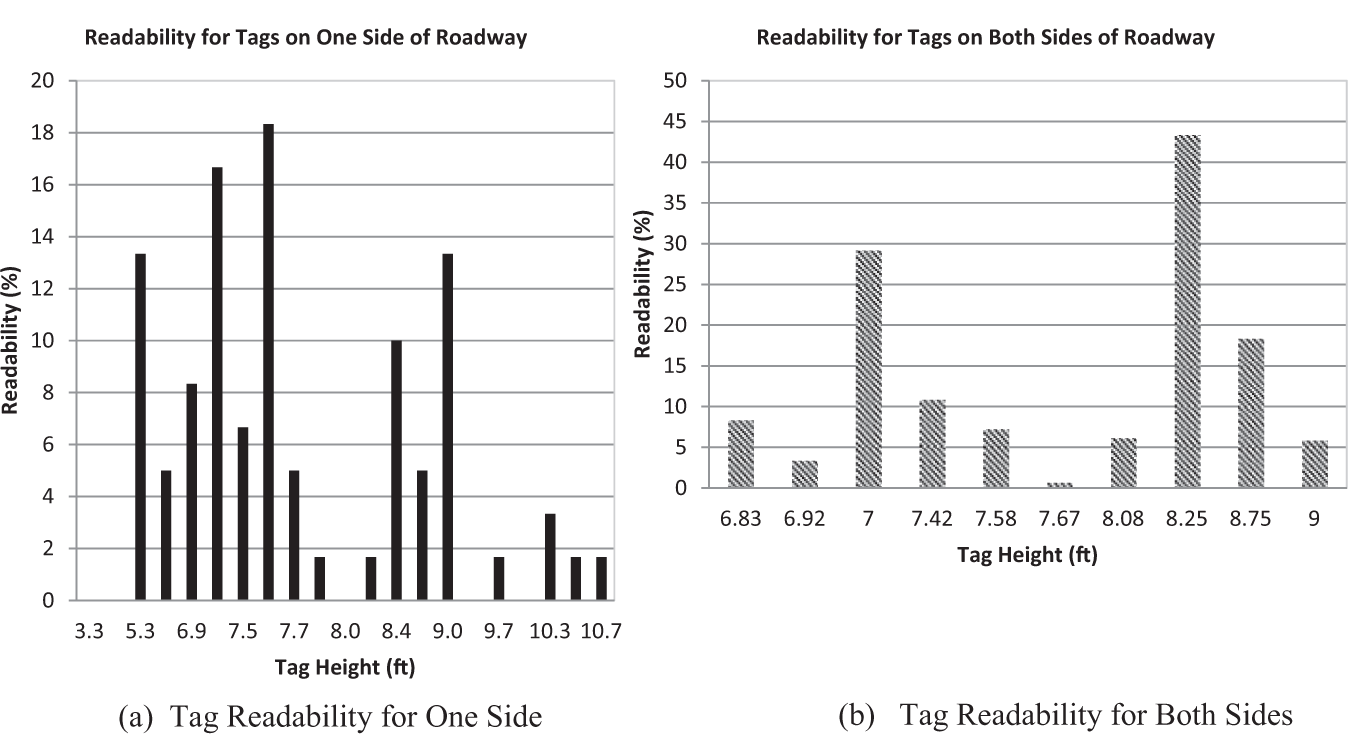
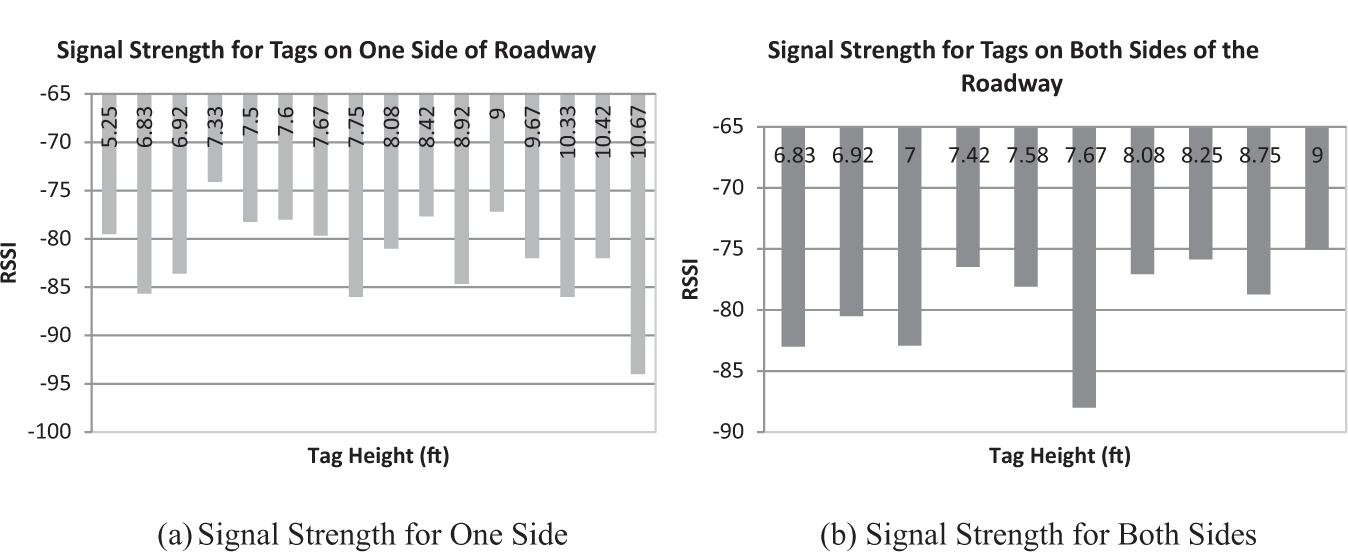
Tag Height: Figure 1 presents the RSSI values and readability rates for different tag heights when attached to a guardrail. As observed, the readability rate varied with tag height; however, there was no clear pattern from which to draw reasonable conclusions. Marginally, the RSSI values for tags on both sides of the roadway were higher compared with those with tags on one side of the roadway.
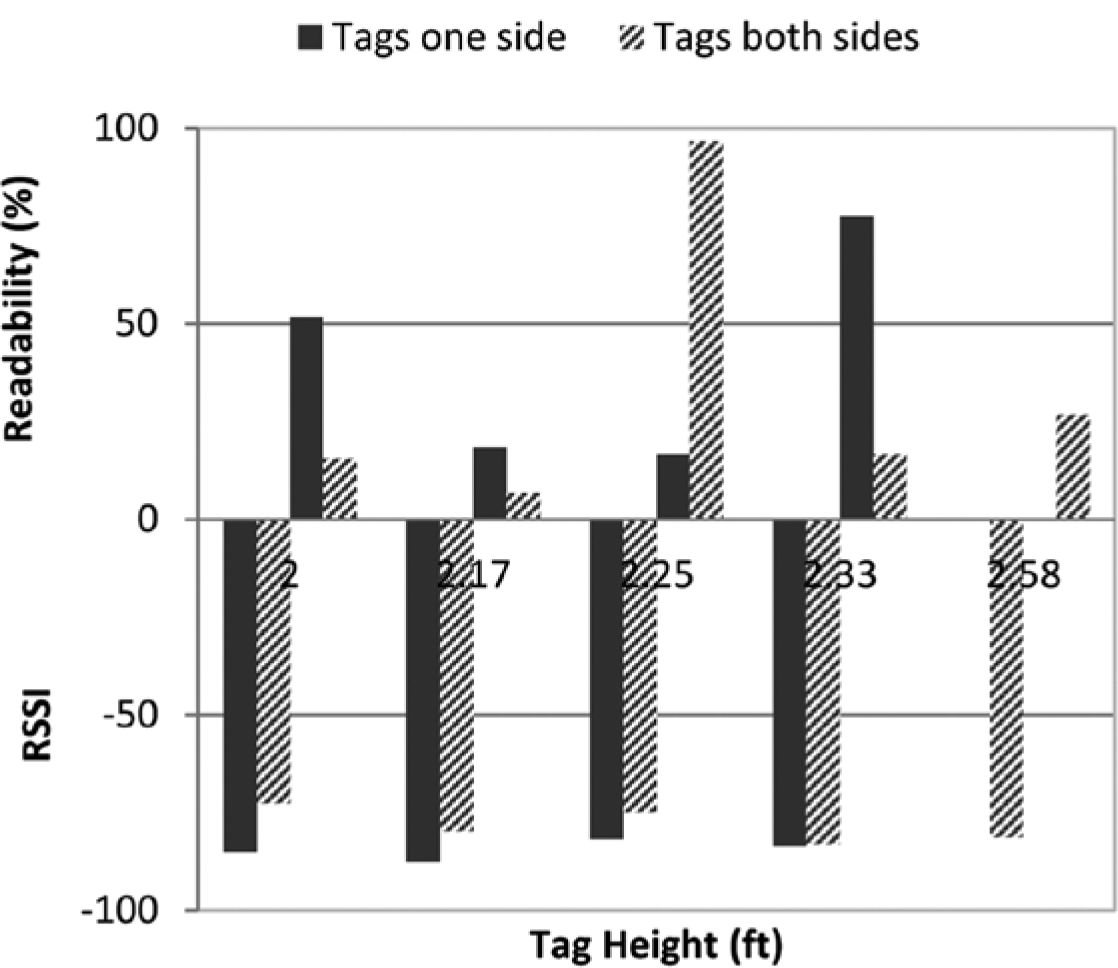
Tags’ performance with varied tag heights when attached to a guardrail.
Driving Direction: Figure 2 presents the readability rate and signal strength for north and south driving directions. The driving direction defines the increase and decrease in horizontal distance between the tag and a reader. For example, if the tags are located in the southbound lane, a higher readability rate is expected when the reader is traveling in this direction because it is close to the tag. As expected, it was observed that when tags were located on one side of the road (south bound), the south readability rate was 6% better than when driving north. The driving direction showed only marginal differences in signal strength; however, the signal strength was slightly higher when driving south bound for tags located both on one side and on two sides of the roadway.
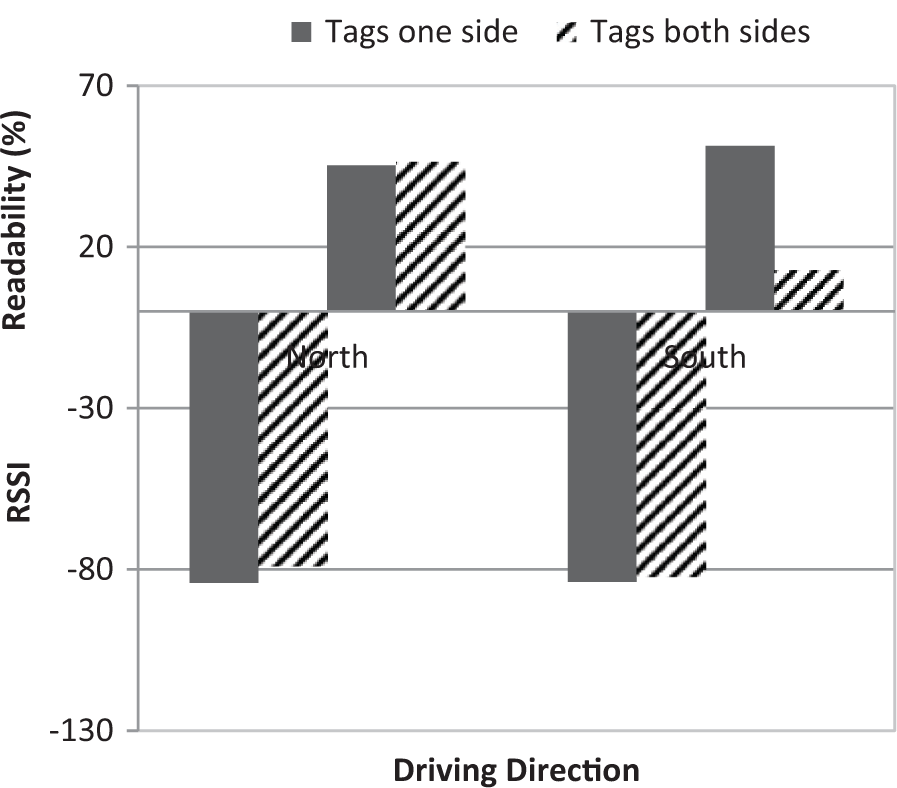
Effect of driving direction on tags’ performance when attached to a guardrail.
Vehicle Speed: The study tested three vehicle speeds, all of which were below the roadway speed limit. It was expected that the readability rate would decrease as the speed increased due to a decrease in tag presence time in the detection zone. As expected, regardless of the tags’ location, the readability rates were higher for 10 mph and lower for 30 mph. The most significant difference in readability rates was for those tags located on both sides of the roadway. With respect to signal strength, for speeds of 20 and 30 mph, the tags located on both sides yielded higher values when compared with those located on one side. However, for the 10 mph speed, the average signal strength was the same for both tag locations. The results of this analysis are presented in Figure 3.
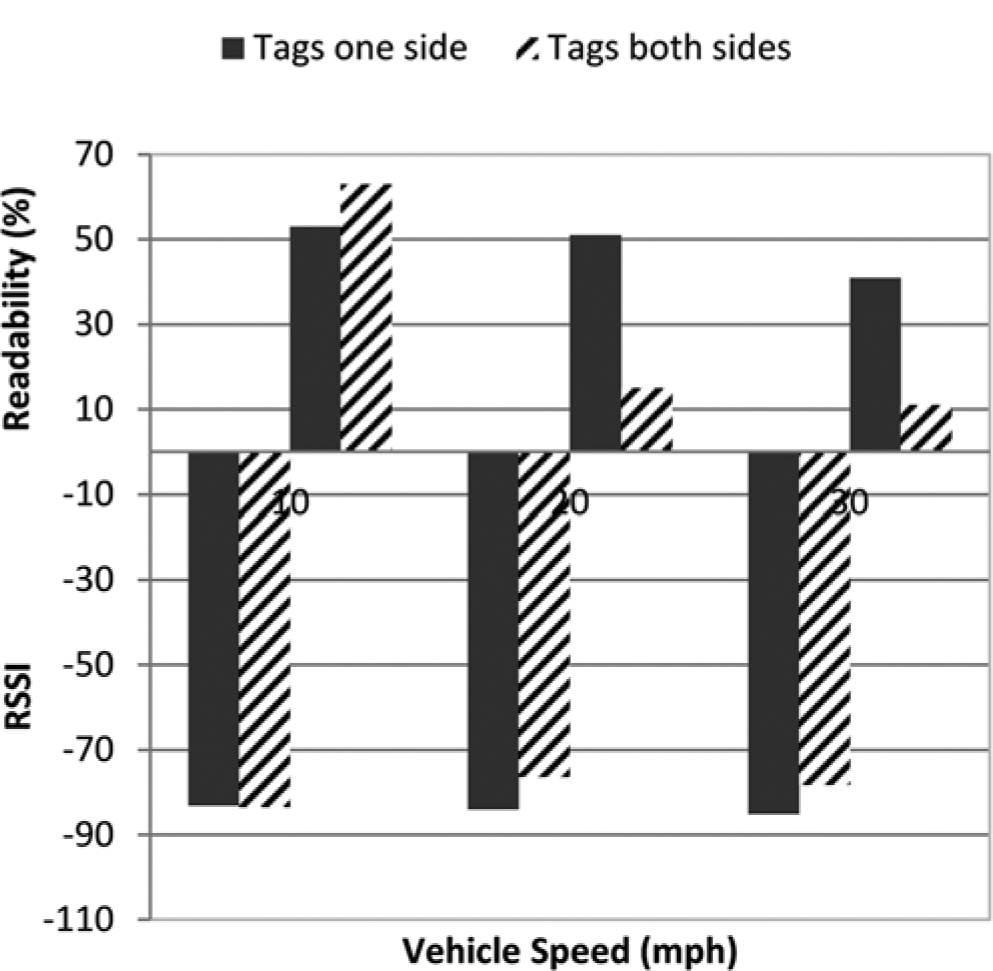
Effect of driving speed on tags’ performance when attached to a guardrail.
Tags at 4 ft. on Sign Posts and Delineators
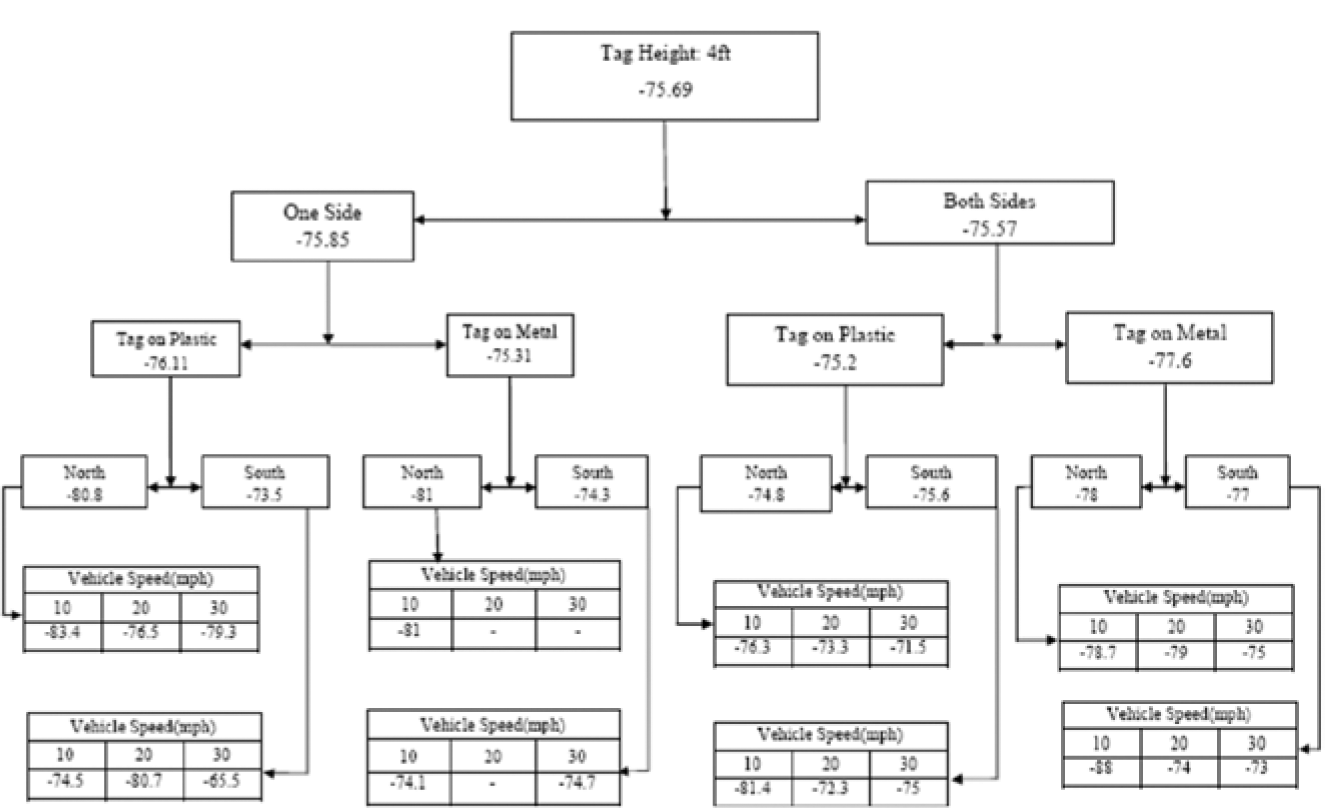
Readability: Figure 4 presents the results of a scenario where RF tags are attached on signposts and delineators at 4 ft. above ground. The tag readability rate for tags attached to delineators and signposts at 4 ft. is nearly 10%. Regardless of the tag location in terms of roadway side, tags attached to plastic showed a higher readability rate compared with those attached to metal. For tags on one side of the roadway, regardless of material type, driving close to the tags yielded higher readability rates compared with its counterpart. On average, lower vehicle speeds yielded higher readability rates when compared with higher vehicle speeds.
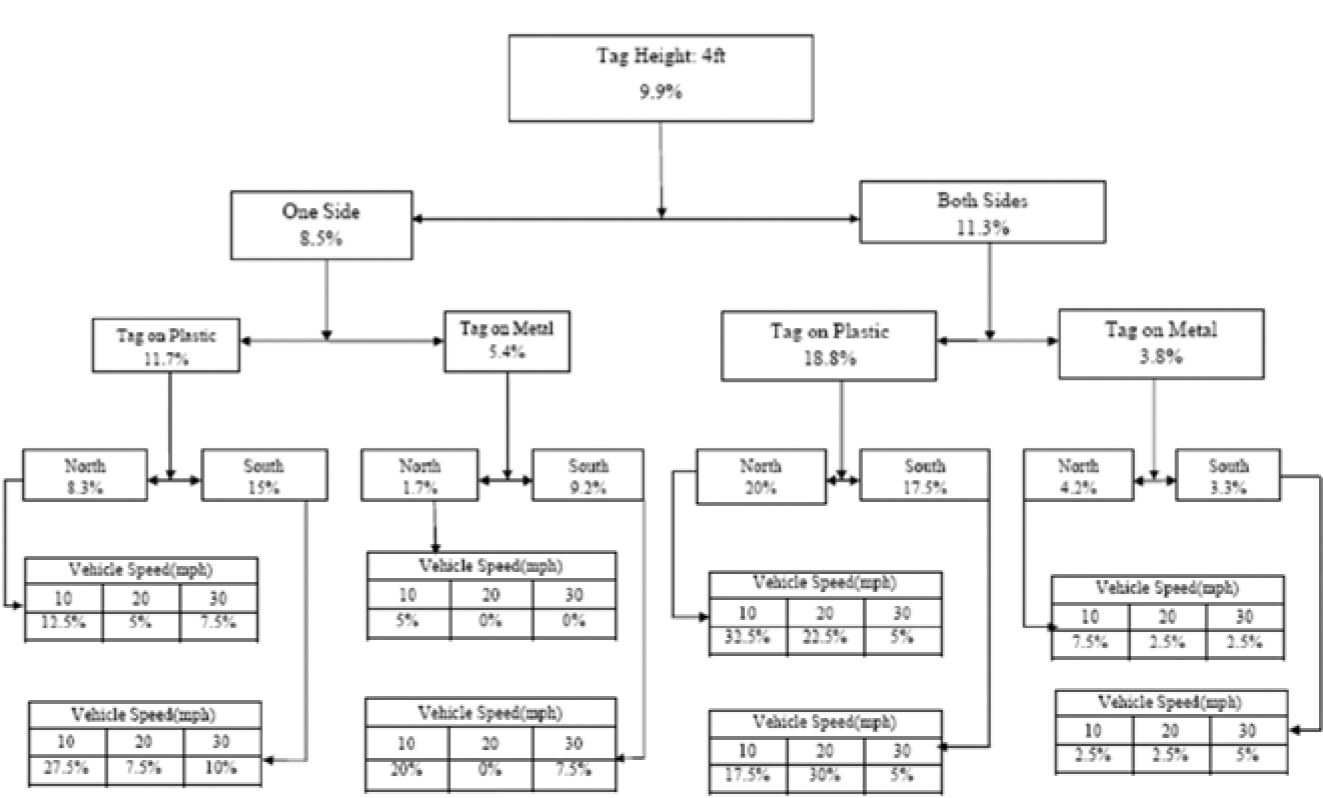
Readability of tags at 4 ft. on delineators and signposts.
For tags on both sides of the roadway, regardless of the material type, driving in the northbound lane yielded relatively higher readability rates compared with driving southbound. This phenomenon needs further investigation on whether other factors such as wind speed and direction have an influence on the outcome. On average, higher speeds showed a negative correlation with tag readability as shown in Figure 4.
Signal Strength: Figure 5 presents the results of signal strength analysis of a scenario where RF tags are attached on signposts and delineators at 4 ft. above ground. Signal strength was higher for tags located on both sides of the roadway than for those located on one side. When comparing metal and plastic, the latter yielded higher signal strength for tags on both sides and the former yielded higher signal strength for tags on one side, albeit marginally. With respect to driving direction and vehicle speed, the results showed no clear pattern when comparing tags attached to plastic with those attached to metal.
Signal strength for tags at 4 ft. on delineators and signposts for dynamic testing.
Tags at 7 ft. on Sign Posts
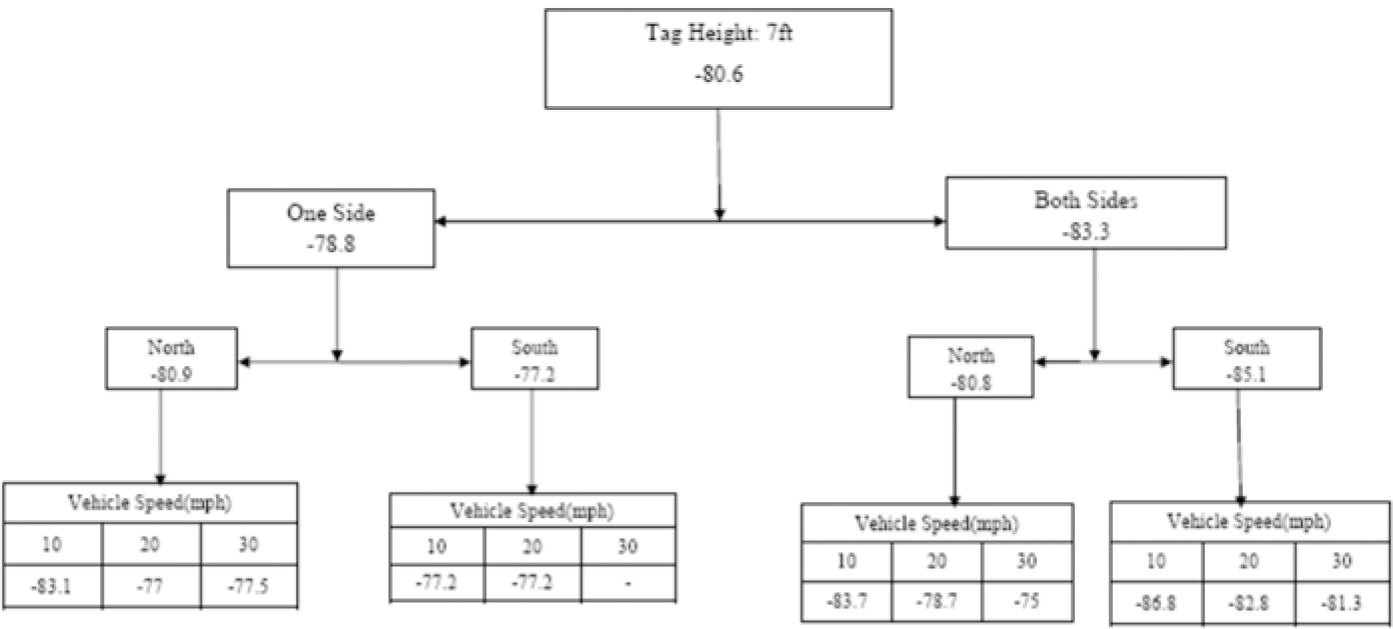
Readability: Figure 6 presents the readability analysis for tags located on signposts at 7 ft. Compared with 4 ft., on average, the readability rate at 7 ft. was higher by more than 6%. Contrary to the 4 ft. readability performance, tags at 7 ft. yielded higher readability rates for those on one side of the roadway when compared with those on both sides. Regardless of the driving direction and tag location, readability rates decreased with an increase in vehicle (reader) speed.

Readability for tags at 7 ft. on signposts.
Signal Strength: Figure 7 presents the signal strength analysis for tags mounted at 7 ft. on signposts. When compared with those readings with tags on both sides of the roadway, tags located on just one side yielded readings with higher signal strength. On average, signal strength increased with a decrease in vehicle (reader) speed, as shown in Figure 7. This is explained by the fact that RSSI is inversely proportional to distance (Parameswaran, Husain, & Upadhyaya, 2009) and, therefore, also to speed.
Signal strength for tags at 7 ft. on signposts.
Tags on the Back of Sign Posts
Tag Height: Figures 8 and 9 present the results for the performance analysis for a scenario where RF tags are attached to the back of metal signs. The effect of tag height on readability when tags were attached to the back of the sign showed no clear pattern for both scenarios when tags were located on one side and two sides of the roadway. However, as observed in Figure 8, the scenario with tags on both the sides yielded higher readability rates when compared with the scenario with tags on one side only. Likewise, the effect of tag height on signal strength, when tags were located at the back of the sign, showed no clear pattern for both scenarios when tags are located on one side and two sides (Figure 9).
Readability for tags on the back of signposts.
Signal strength for tags on the back of signposts.
Driving Direction: Figure 10 presents the readability rates for tags located at the back of signposts. Driving direction may affect RFID performance by increasing or decreasing the horizontal distance between the tag and the reader. As shown, the readability rates were different for the two driving directions. The northbound direction showed higher rates for tags on both sides of the roadway, whereas the southbound direction yielded higher rates for tags on one side of the roadway. However, driving direction caused only a marginal impact on signal strength.

Readability for tags on the back of signposts.
Vehicle Speed: As discussed in earlier sections, vehicle speed showed a negative correlation with tag readability. Similarly, for tags on the back of the sign, the readability rate decreased with an increase in vehicle speed for both scenarios when tags were located on one side and both sides of the roadway as shown in Figure 11. For tags located on both sides, signal strength showed a marginal increase with an increase in vehicle speed.

Signal strength for tags on the back of signposts.
Findings
The study investigated the feasibility of RFID in managing linear assets, specifically roadways. The study analyzed confluence factors that affect the performance of RFID. The factors considered in this study were driving speed, asset material type, tag location on signposts, delineators, guardrails, and horizontal distance. The study tested the active RF code type of RFID technology and the following conclusions were drawn:
The study tested three vehicle speeds, 10 mph, 20 mph, and 30 mph, and the reader was mounted on the passenger window at 4 ft. 3 in. On average, tag readability decreased with an increase in vehicle speed, and thus reader speed, for most scenarios that were evaluated. This is in accordance with what previous studies (Fedrowitz, 2007; Lodgher et al., 2010; Yates, 2009) found. On the contrary, signal strength, which corresponded with how many times the tag could be read per second or nanosecond, was found to positively correlate with driving speed. This is in line with the theory, because RSSI is inversely proportional to distance between the reader and the tag, and therefore speed.
Horizontal distance between the reader and the tag was found to have an influence on RFID performance. The closer the reader was to the tag, the higher the readability rate. For implementation purposes, this result implies that vehicles mounted with readers should drive on the right lane (close to roadway signs) to increase tag readability and therefore query asset information stored in tags.
With respect to material type on which the tag was attached to, the study found that RFID technology yielded superior performance for plastic (delineators) as compared with metal (signposts).
The study tested the RFID technology performance with metal obstructions. Compared with nonobstructed scenarios, the technology yielded poor performance with metal obstructions.
Comparing tag readability at 4 ft. and 7 ft., the RFID technology yielded a readability rate that was 6% higher at 7 ft. At 7 ft., the tag was located higher relative to the reader.
Recommendations
The study is not without limitations; therefore, the following recommendations for future research and practical implementations of RFID technology are made:
The tested vehicle speeds were below the roadway posted speed limit and the RF code yielded low readability rates at 30 mph. Therefore, before transportation agencies decide to implement the technology, it is recommended that other types of RFID technology be tested at higher speeds that are more applicable to transportation agencies.
The test was performed on a two-lane undivided highway; therefore, the maximum horizontal distance between the reader and the tag would be a sum of the sign distance from the shoulder, shoulder width, and one-lane width. The study recommends further investigation on multilane highways for more extensive data on horizontal distances.
With respect to material type, this study only tested metal guardrails, not concrete. Hence, further study of RFID performance on concrete barriers and guardrails would prove valuable to transportation agencies.
For the results presented herein, the reader was mounted on a passenger car window at 4 ft. 3 in. In addition, reader height has been known to influence RFID performance; therefore, testing locations other than the passenger window would help determine whether there is a more appropriate reader location. Furthermore, the reader had stub antennas that are usually used for short-range inventory applications. Testing the ¼ wave helical antennas intended for longer range searching applications would be beneficial.
Footnotes
Acknowledgements
The authors would like to acknowledge the effort put forth by the undergraduate students at PVAMU who participated in this research, including Don Nash II, Kristian Smith, and Sanjay Tillmutt.
Authors’ Note
The testing was conducted at PVAMU in the Civil Engineering Department.
Declaration of Conflicting Interests
The author(s) declared no potential conflicts of interest with respect to the research, authorship, and/or publication of this article.
Funding
The author(s) disclosed receipt of the following financial support for the research, authorship, and/or publication of this article: The Mid-America Transportation Center (MATC) located in Lincoln, Nebraska, provided funding for this project.