
Abstract
Solid waste, being a basic urban service, is invariably related to urbanization and economic development. In this article, we make an attempt to understand what explains solid waste management (SWM) coverage, a local public service problem, using cross-national data. Using regressions, we find that higher levels of income bring along with them the public awareness, institutional structure, and fiscal capacity to deliver better levels of public services not only in the city but also in the informal settlements. Hence, the objective should be to build awareness of the environmental and health consequences of poor SWM. Furthermore, we find that large cities and decentralized countries are in a better position to deliver SWM in the informal settlements because of the local nature of the service. We find that a major challenge foreseen in meeting the public service demands over the next decade, as it relates to SWM, is financing.
Introduction and Importance of the Problem
Solid waste is invariably related to urbanization and economic development. As countries urbanize, their economic wealth increases. As standards of living and disposable incomes increase, consumption of goods and services increases, which results in a corresponding increase in the amount of waste generated. Because of these reasons, solid waste management (SWM) is a critical part of urban infrastructure. It affects the image of a city as a clean or dirty one, and its attractiveness for potential residents or businesses to move. As Hoornweg and Bhada (2012) point out, “solid waste is usually the one service that falls completely within the local government’s purview. A city that cannot effectively manage its waste is rarely able to manage more complex services such as health, education, or transportation (p. 9).” Solid waste generation in the cities of Asia varies from nearly 6,000 tons per day in Jakarta, Indonesia to 3,800 in Kuala Lumpur, Malaysia, to a low of 80 in Yala, Thailand (Dhokikah & Trihadiningrum, 2012). The per capita waste generation varies from a high of 2.17 kg/day in Phuket, Thailand, 1.62 kg/day in Kuala Lumpur, Malaysia, to a low of 0.4 in Allahabad, and 0.49 in Dhaka, Bangladesh (Dhokikah & Trihadiningrum, 2012).
The importance of SWM for business may be observed in the fact that the Federation of Indian Chambers of Commerce and Industry (FICCI) did a review of municipal solid waste (MSW) management in Indian cities in 2009 (see also Sridhar, 2005, for the importance of urban services in business location decisions). 1 SWM also has implications for the environment, with solid waste being a major source of environmental pollution. In a recent background paper for the Asian Development Bank (ADB), it was found that SWM in Indian cities is one of the biggest environmental concerns for the present and future of urbanization (see Sridhar & Kumar, 2013). Sacratees and Govindaraj (2014) estimate welfare losses due to improper MSW management and its impact on health in Tirunelveli, a south Indian city.
The proportion of solid waste that is collected varies by national income and by region of the world. For the countries in south Asia, the average waste generation is 0.45 kg per capita daily, based on Hoornweg and Bhada (2012). Despite their higher waste generation rates (which was 2.15 kg per capita daily for the Organisation for Economic Cooperation and Development [OECD] countries), higher income countries tend to have higher collection efficiency, although less of the SWM budget goes toward collection. In low-income countries, collection services make up the bulk of a municipality’s solid waste budget (as high as 80%-90% in many cases), yet collection rates tend to be much lower, leading to lower collection frequency and efficiency. According to the World Bank, the waste collection rates in the South Asia region are some of the lowest, being 65%, the only other region having lower collection rates is Africa at 45%.
In this article, we make an attempt to understand what explains SWM coverage, a local public service problem, using unique and sparsely collected, cross-national data. This article is organized as follows. First, we evaluate the delivery of SWM in countries of the Asia Pacific. We make an attempt to describe whether local governments in Asia Pacific countries are succeeding in delivering SWM. We make an attempt here to classify the countries into those that adequately deliver SWM and those that do not. Then, we make an attempt to understand what general factors are responsible for adequacy or inadequacy of SWM. We cite what appear to be key factors—primarily size of the city, level of economic development, and extent of decentralization in the country 2 —that influence SWM’s adequacy or inadequacy across countries, followed by an explanation of SWM coverage in informal settlements.
The sections focusing on explanation of factors responsible for adequate or inadequate service provision present results from regressions and correlations (based on data from 90 cities in 15 countries of the Asia Pacific in the mayors’ surveys), which was performed to understand the impact of population size, economic development, and extent of decentralization on service delivery. Then, we make an attempt to describe how successful local public service efforts are financed in the context of centralized and decentralized countries. It should be mentioned that the information is necessarily qualitative here, as we do not have much centralized or quantitative information with respect to financing. All sections of this article, except the one on the financing of SWM, depend on data from a mayors’ survey, which was conducted by the United Cities and Local Governments (UCLG) in 15 countries of the Asia Pacific region.
The financing section relies on the relevant country reports which were background papers for the UCLG. In this and all other sections, where other sources were used, they have been indicated. The article concludes with a summary of findings and implications.
Evaluation of the Delivery of SWM
The mayors’ survey of cities by UCLG in the Asia Pacific region contained information on the quality and extent of basic service provision, governance aspects of public service delivery, and the extent of autonomy for the local government in the 15 countries of study. Some limitations of these data are that they could be a non-statistically representative survey. Chances could also be that the mayors’ responses are subjective and there is no corroboration with in-city measurements or even secondary, supporting data. However, the encouraging aspects are that they convey perceptions from the horse’s mouth and reflect citizen voices, given that the mayor is a democratically elected entity, and there is no incentive for them to lie about the status of service delivery. If anything, they would like to promote their city as a good place to live and do business, and we assume all mayors’ responses to be biased to the same extent, and hence are comparable. Furthermore, despite its importance, reliable global SWM information is not typically available. Given the sparse nature of the data, and the uniqueness of the availability of responses from mayors across countries, we draw upon the mayors’ survey to examine SWM coverage across countries.
Overall, nearly 40% of mayors rated the quality and extent of SWM in their city as only average. An additional one fifth of mayors rated the service as being excellent, out of which nearly 50% were from the high-income countries, but nearly one fourth of mayors in the middle-income countries rated the quality of SWM in their cities as excellent. 3 Overall, 70% of countries stated that greater than 40% of their population had access to SWM services. Understandably, all the high-income countries had greater than 40% access. 4 At the other end of the extreme, in two of the four low-income countries, less than 10% of the population had access to SWM services. Thus, the solid waste collection rates are among the lowest in south Asian countries, being only 65%, whereas the developed countries in the Asia Pacific have 100% collection rates besides almost a 100% treatment and disposal rates. Service-level benchmarks (SLBs) in countries are independent of their actual performance; hence such benchmarks are presumably the same across countries. For instance, while the actual solid waste collection rates in Indian cities are only around 65%, the SLBs set by the Ministry of Urban Development (MoUD), Government of India (2010), specify 100% waste collection and disposal. Hence, given common statutory benchmarks, mayors’ responses rating their city’s performance on waste management are comparable.
We make an attempt here to classify the countries into those that adequately deliver SWM and those that do not. Table 1 summarizes the SWM service by level of economic development of the countries (not of the cities), based on the mayors’ survey classifications done by the UCLG. The relatively well performing countries which adequately deliver this basic service are the high-income countries—Australia, Japan, Korea, and New Zealand, as all (100%) these countries reported that greater than 40% of their population is covered with regular SWM services.
Coverage of Population With SWM by Level of Economic Development.
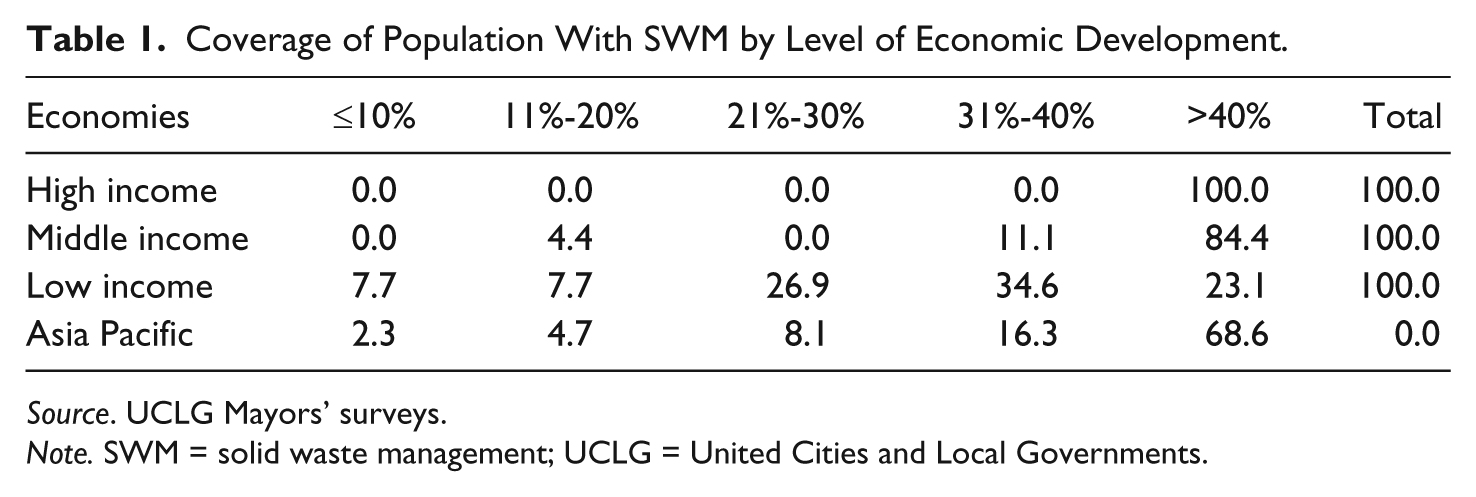
Source. UCLG Mayors’ surveys.
Note. SWM = solid waste management; UCLG = United Cities and Local Governments.
The countries that do not adequately deliver this service are the middle-income countries (China, India, Sri Lanka, Indonesia, Philippines, Thailand, and Vietnam), given 84% of them reported coverage of >40% of their population. In the case of the low-income countries such as Bangladesh, Nepal, Pakistan, and Cambodia, 61% of these countries reported coverage of their population with SWM to be only between 21% and 40%. When we examine the coverage of the informal settlements with SWM (Table 2), we find that middle-income countries such as China, India, Sri Lanka, Indonesia, Philippines, Thailand, and Vietnam are relatively better performers, as 62% of these countries reported that more than 40% of their informal settlements are covered with SWM. In contrast, less than half (46%) of the high-income countries reported having covered more than 40% of their informal settlements with SWM services.
Coverage of Informal Settlements With SWM by Level of Economic Development.
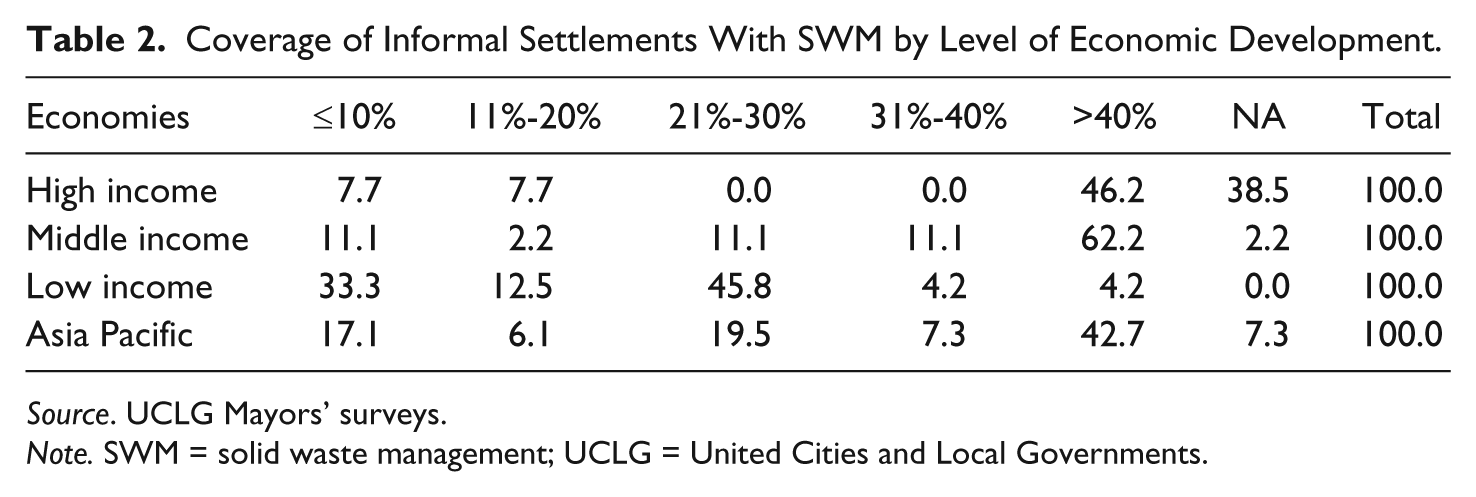
Source. UCLG Mayors’ surveys.
Note. SWM = solid waste management; UCLG = United Cities and Local Governments.
Overall, all cities in the high-income countries either judged that the level of the SWM service was either above average (53%) or excellent (47%). Compared with this, only 24% of middle-income countries and none in the low-income countries rated SWM as being excellent. More than two thirds of low-income countries rated the level of service of SWM to be only average. This provides further evidence that the mayoral responses correspond more or less to actual data one would have observed in these countries.
Explanation of Factors Responsible for Adequate or Inadequate SWM
In this section, we make an attempt to examine what appear to be key factors that influence adequacy or inadequacy of the provision of SWM. As in the previous section, we consider the coverage of population with regular SWM service and the coverage of informal settlements with SWM, to be indicators of adequate or inadequate SWM provision. The factors that we consider to be the key in influencing the level of SWM are as follows:
Size of the population of local government unit.
Level of economic development of the country.
Type of legal-institutional framework (extent of centralization or decentralization) in the country with respect to SWM.
The above were the only factors on which we had some information from the mayor surveys; hence, we are unable to reflect on other factors that could be important.
With respect to size, we wanted to understand if smaller or larger local units were more likely to adequately deliver SWM. The mayors’ surveys find that small and very small cities 5 in the Asia Pacific region (populations less than 100,000) rate SWM in their city as average (42.1% and 46.4%) or satisfactory (36.8% and 32.1%). While a majority of intermediate size cities rate SWM in their cities from poor to average (76.9%), all very large cities (with population greater than 10 million) rated SWM in their cities as average or excellent. It is possible that in large cities, scale economies in the provision of SWM makes it easier to provide a better level of the service. Hence, the expected impact of city size on the level of SWM coverage is positive.
When we examine the country’s level of economic development, there is no question that those with higher levels of per capita income do a much better job of managing their solid waste; hence, the expected impact here would be positive (subject to how the variable is actually operationalized and measured).
We expect a decentralized governmental system to be more effective in the case of a local service such as solid waste because it is more likely to be tailored to the priorities and preferences of the residents, and responsiveness is much better than in a centralized system. An example of a decentralized system is the case study of Surat’s experience and management of solid waste, transforming it from the plague to one of the cleanest cities of the country (summarized by Swamy, Vyas, & Narang, 2000). Soon after the outbreak of the plague in 1994, a massive clean-up operation was launched by the Surat Municipal Corporation in early 1995, followed by administrative reforms. These reforms consisted of sub-dividing the pre-existing 6 zones in the city into 52 sub-zones making sanitary inspectors responsible for each of them, in addition to mandatory segregation of waste at source. Furthermore, a system of strict enforcement and monitoring ensured that the checks were in place. For instance, a system of fines for littering public places was instituted. Finally, contracting was introduced to improve the waste collection efficiency and street cleaning.
We examined the coverage of population with SWM by the degree of decentralization. Interestingly, the greater the degree of decentralization, greater is the extent of coverage with SWM. While in 95% of the decentralized countries, the coverage of population with SWM is greater than 40%, only 71% of the somewhat decentralized countries and 50% of the centralized countries had more than 40% coverage.
The mayors’ survey questioned the cities about the extent and quality of the service in informal settlements. As we see in Table 2 which summarizes the extent of coverage of informal settlements with SWM by the level of economic development, a surprising finding is that whereas 62% of middle-income countries had more than 40% of their population in informal settlements covered by SWM, only 46% of high-income countries had greater than 40% coverage of their informal settlements. This finding, while being counterintuitive, could be a reflection of the fact that cities in middle-income countries are much better equipped to deal with informal settlements and services to those residents than their counterparts in high-income countries, who treat the inhabitants of informal settlements in an exclusionary way. This is because in terms of the absolute numbers of population, the developed countries have a smaller population which is left uncovered by SWM services even though the percentage may seem higher. Furthermore, SLBs in an advanced country may prevent them from describing the SWM service in informal settlements as complete, whereas the SLBs in developing countries may describe them as complete; hence, the percentage of coverage may seem higher. In 46% of the low-income countries, 21% to 30% of the population in informal settlements was covered with SWM. In the low-income countries, only 4% of the population in informal settlements had more than 40% coverage with SWM.
When we examined the coverage of informal settlements by the extent of decentralization, we found that the somewhat decentralized countries are the best. This may be observed in the fact that 55% of the somewhat decentralized countries had been successful in covering more than 40% of their informal settlements with SWM. Only 31% of the centralized countries had been successful in covering more than 40% of their informal settlements and 42% of the decentralized countries covered more than 40% of their informal settlements. It does appear that there are certain characteristics of decentralization, which preempt full access to SWM by the informal settlements. This is indeed borne out by Ravallion (2007) in the case of China, where it was found that poorer municipalities might adopt systematically lower eligibility thresholds, reducing the program’s ability to reach poor areas.
We found a significant −0.55 correlation between access of the general population to SWM and the level of development, to be expected, as a higher level of development (measured as 1 and low income being measured as 3) is associated with better provision of SWM (5 being the best). The correlation between the level of development and the coverage of informal settlements with SWM is significant and as expected, but a little lower at −0.47. This is most likely due to the finding we pointed out earlier, which is that the high-income countries were able to cover less of their informal settlements with SWM, when compared with the middle-income countries.
Table 3 presents the summary statistics for the variables used in the regressions. On average, the percentage of population with access to SWM in the cities is a little above 4, which implies a 31% to 40% coverage, reasonable to expect. These are not numbers that are overinflated, just because they are being reported by the mayors. Understandably, the coverage of population in informal settlements at an average of 3.6 (implying coverage of slightly above 30%) is lower than that of the general population. The standard deviation of the coverage of population in informal settlements is also higher than that with general population, indicating a greater variation in the extent of coverage of population in informal settlements with SWM.
Descriptive Statistics.
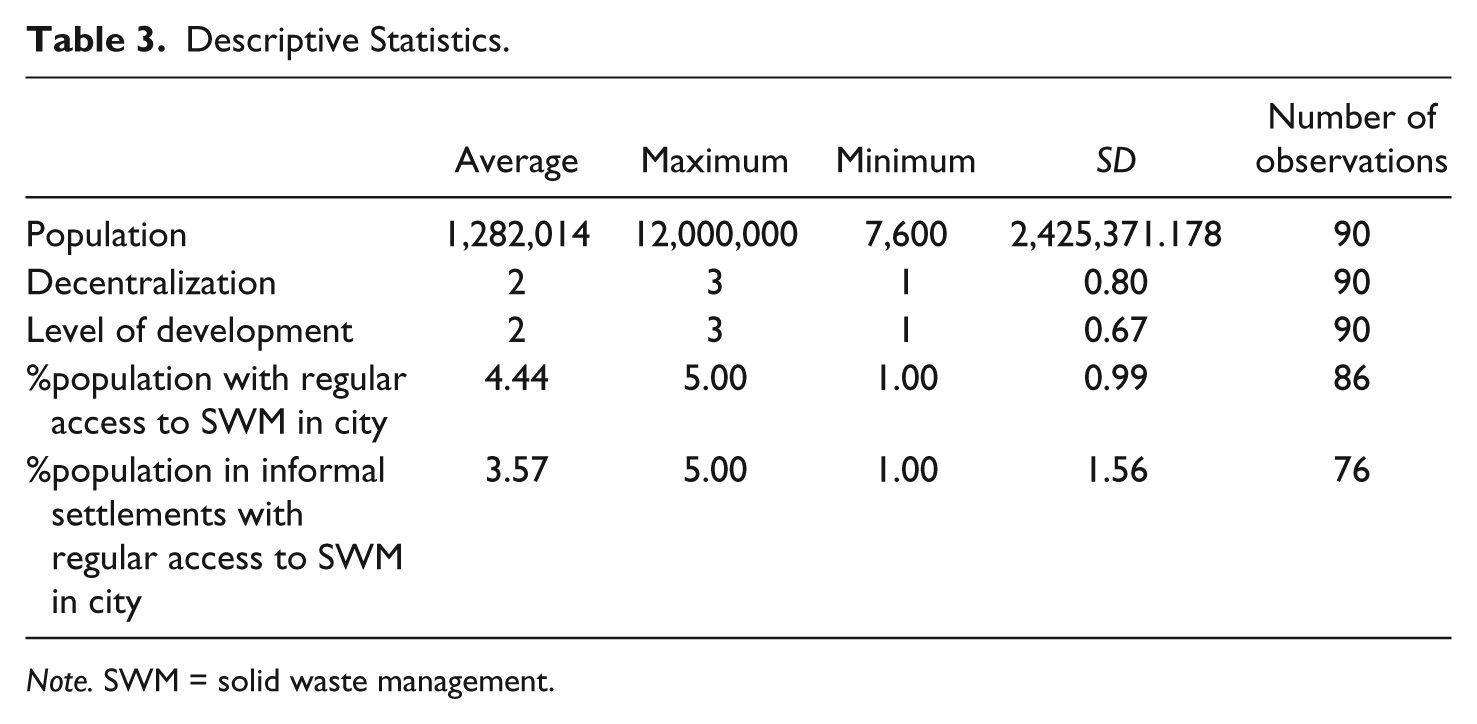
Note. SWM = solid waste management.
Results From Regressions
We performed ordinary least squares (OLS) regressions to examine the impact of population size of the city, extent of decentralization, and level of economic development on the extent of coverage of the general population with regular SWM and of the informal settlements with SWM. The hypotheses we proposed were that larger cities are more likely to offer a better level of SWM, and local governments in high-income countries are more successful in delivering SWM to their residents and the urban poor, when compared with their counterparts in low-income countries. We also hypothesized that more decentralized countries are in a better position to deliver services such as SWM than their centralized counterparts, as they are closer to the population and are able to reflect their preferences and priorities in a much better manner than a remote centralized government. The case study of Surat, India, has been discussed earlier, which corroborates the benefits of decentralization for better service delivery.
Tables 4 and 5 summarize the results of the regressions of two performance indicators: coverage of population and of informal settlements (where the urban poor reside) with SWM. 6 Our independent variables were population of the city (which was the only city-specific indicator we had), level of economic development (of the country, such that 1 was high income, 2 middle income, and 3 low income), and the extent of decentralization in the country (where 1 indicated a decentralized country, 2 indicated a somewhat decentralized country, and 3 indicated a centralized country). Given that OLS regression is a basic, yet simple way to understand the coverage of population or of the informal settlements with SWM; we used that, as the more appropriate multinomial regressions (not reported here) revealed similar findings.
Regression of Coverage of Population With SWM.
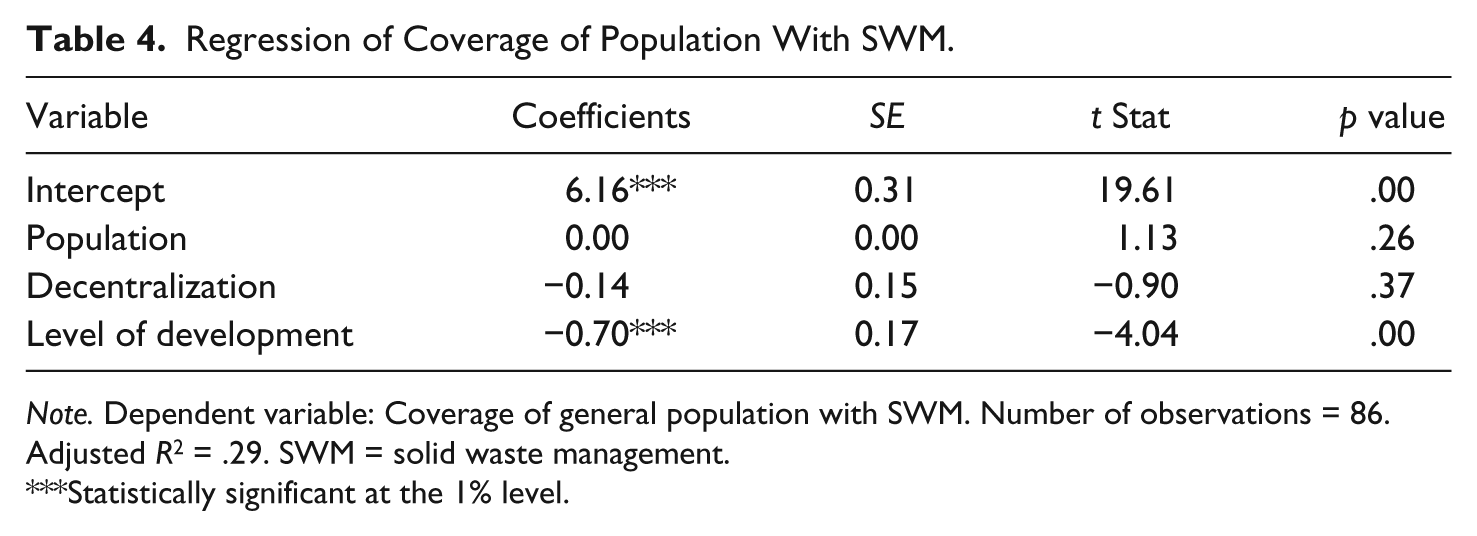
Note. Dependent variable: Coverage of general population with SWM. Number of observations = 86. Adjusted R2 = .29. SWM = solid waste management.
Statistically significant at the 1% level.
Regression of Coverage of Informal Settlements With SWM.
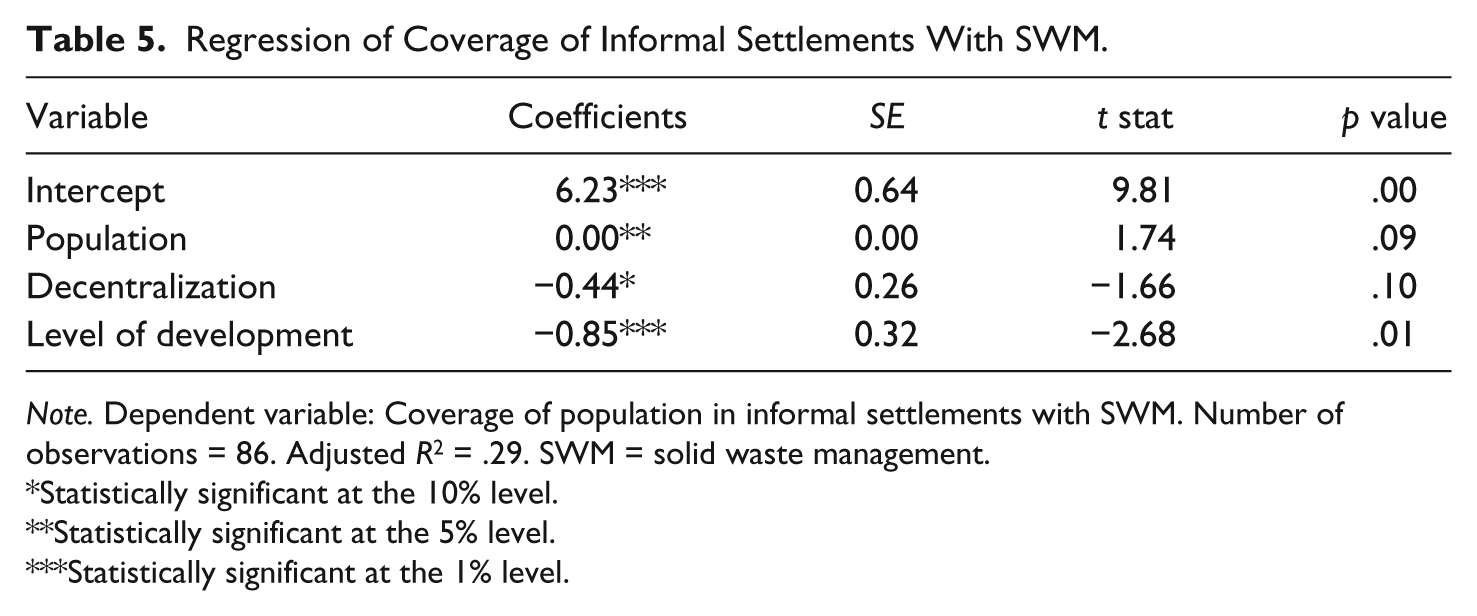
Note. Dependent variable: Coverage of population in informal settlements with SWM. Number of observations = 86. Adjusted R2 = .29. SWM = solid waste management.
Statistically significant at the 10% level.
Statistically significant at the 5% level.
Statistically significant at the 1% level.
Table 4 summarizes the parameter estimates from the OLS regression, to explain coverage of general population with regular SWM services in various cities of the Asia Pacific region, the data for which were obtained from the mayors’ surveys conducted by the UCLG. The dependent variable is the mayors’ response to the following question: What percentage of the population has regular access to SWM in your city or municipality? The response is viewed as being an objective answer because, as the descriptive statistics reveal, there was enough realistic variation with respect to SWM coverage, both of the general population and of informal settlements. If we were to assume that mayors in general have an incentive to boost their SWM coverage numbers upward, and if all mayors have this tendency, then the real picture would not change, as the cities would be the same relative to each other.
In this regression, the dependent variable is the percentage of population with access to regular SWM services, with 5 (which indicates coverage of greater than 40% of population) being the benchmark. 7
The level of economic development has a significant negative impact on SWM coverage of the general population. Given the way the level of development is defined (with the maximum being low income), this implies that increases in per capita income and development lead a country and its cities thereof to improve SWM coverage, consistent with one’s expectations.
Decentralization or population does not have the expected impact on coverage of the general population with regular SWM services. This is to be expected because when we checked the correlations, we found that development and the extent of decentralization are positively correlated (with a coefficient of 0.56, significant at the 1% level); that is, the high-income countries are also the most decentralized and that the low-income countries are centralized.
Table 5 summarizes parameter estimates of the urban poor’s (or those living in the informal settlements) access to SWM in the Asia Pacific region. The following are findings from the regression for the coverage of informal settlements with SWM:
Increases in per capita income and development lead a country and its cities thereof to improve SWM coverage in the informal settlements.
Larger cities do a good job of increasing SWM coverage in the informal settlements than smaller cities. Possible reasons for this could be that large cities have the wherewithal to be financially independent without being donor-driven or government-controlled. This also points to the fact that SWM requires investment not just for collection and transportation but also for treatment and disposal, which large cities are able to mobilize through their own or private sources. Presumably, the cost of operation and maintenance is more easily recovered through taxes and cesses in the case of large cities, which have likely greater political devolution of power to enforce such measures. Finally, large cities also likely have the freedom to choose new technologies and innovations.
Decentralized countries are able to cover a larger percentage of their informal settlements with SWM more successfully than their centralized counterparts, as per the discussion above.
Summarizing the findings for the informal settlements, high-income countries and large cities do a good job of covering their informal settlements with SWM. Some reasons why this is possible are that more high-income countries are enlightened to understand the environmental impact of poor SWM and have the ability to spend more on the service, with the result that service coverage is better. Larger cities are able to cover informal settlements much better than the smaller cities due to the existence of scale economies in the provision of public services including SWM, and possibly because they are financially more independent than smaller cities. Greater decentralization also furthers better SWM in the informal settlements. This is intuitive because, as discussed earlier, greater decentralization empowers local governments, which are much closer to the public, than remote centralized governments based elsewhere.
Financing of SWM
As stated earlier, the information in this section is necessarily qualitative, as the mayors’ surveys did not throw much light on the comparative aspects of financing in the countries, and the information contained therein is not uniform. Nonetheless, based on the country reports, an attempt has been made to summarize the financing mechanisms used by various countries for the provision of SWM. Typically, financing mechanisms are dependent on the degree of decentralization; hence, we discuss this separately in the context of centralized, the somewhat decentralized, and decentralized countries below.
Financing in centralized countries
In centralized countries, funding typically comes from the national government or international donor agencies. Given that local governments in centralized countries do not have much fiscal capacity, service delivery suffers. For instance, in Fiji, local municipalities do not have the financial capacity to administer waste management effectively. The Municipal Councils are under resourced to carry out sufficient enforcement of the Litter Decree of 1991, which covers litter prevention, offenses, and procedures for prosecuting alleged offenders, and enables public authorities to appoint litter prevention offices. Due to the lack of cost recovery by municipalities on waste collection, there are high costs for services and inadequate revenues, waste collection is economically inefficient.
The government of Cambodia seeks fund from international donors, including the government of Japan and United Nations Environment Program of technical and training assistance in waste management and disposal. In addition, the other sources of finance are from private companies who charge the local population for their waste collection and disposal.
In Vietnam, another centralized country, given that urban solid waste is managed by Urban Environment Company (URENCO), a public non-profit utility, it collects, transports, and disposes waste generated in urban areas. Cost recovery and limited enforcement capacity are the main constraints for efficient implementation and/or expansion of waste management services. City revenues from solid waste collection, usually quite low, similar to that in Fiji, only partially offset the cost of collection and transportation, and are used to partly finance composting plants. The revenue from composting is little or nothing in most cases; sometimes the compost is not even sold, it is used for organic farming. In some cases, there is some revenue. Funding for the SWM collection, transportation, and treatment is mainly based on the state budget. Solid waste treatment is mainly based on official development assistance (ODA) loans.
In centralized Nepal, to collect and dispose of solid waste, funds from national treasury and support from development partners are utilized (Lamichhane, 2012). Although in some cases, the private sector is involved in the SWM, the involvement of private sector in waste management is not very encouraging. However, Kathmandu Metropolitan City has made agreements with various private companies to provide street sweeping, waste collection, and transportation of solid waste produced in Kathmandu Valley. As in other countries, the amount of financial and human resources dedicated to waste management varies significantly according to municipalities. Some municipalities (Birgunj, Bhaktapur, Nepalgunj, Kathmandu, Banepa, Pokhara, Nepalgunj) are resourceful and have invested much money in waste management as compared with other least resource intensive municipalities. Similarly in Kathmandu, SWM expenditure accounts for 35% of the total municipality’s expenses. For other smaller municipalities, this proportion is less.
Summarizing financing of SWM in the case of centralized countries, given the limited or lack of fiscal capacity in the local governments, the effectiveness of SWM in these countries is dependent on the national government (which are unaware of local preferences) or international donor agencies (which usually have strings attached that may or may not be relevant to local conditions). This is one reason that explains the lesser coverage of SWM in these countries when compared with their decentralized counterparts.
Financing in the somewhat decentralized countries
In the somewhat decentralized countries such as Bangladesh, Indonesia, Japan, Korea, Thailand, and Sri Lanka, while multilateral donor agencies continue to play a role, there is some autonomy for local governments to raise funds for meeting expenses relating to SWM.
In Sri Lanka, there are three sources of capital investment for SWM projects at the national level—funds from the Ministry for Local Government and Provincial Councils (MLGPC), Pilisaru project fund, a project initiated by the national Ministry of Environment, and Japanese assistance to MLGPC.
In Thailand, the rate of SWM fee is within the designation of the local government authorities. Expenditure on SWM involves the following:
the capital investment cost of constructing SWM facilities and purchasing essential operating equipment;
operational and maintenance cost of SWM.
Cost recovery is via revenues generated through waste collection fees and taxes as a percentage of total costs of waste management. Results of surveys illustrate that local government authorities can collect SWM fee within the range of 60% to 90%, resulting in inadequate income to cover the expense of SWM. Due to problems in fee collection, the SWM fee cannot be completely collected from the public resulting from the lack of public participation and awareness in SWM (77.9%), and a huge amount of non-registered population, who do not have permanent address (55.3%). Therefore, the local government authorities advised that the central government should provide budget to support SWM in the communities comparable with 86.5%. The local government authorities recommended methods that should be applied to raise income from fee collection—public relation promotion concerning SWM campaign (82.8%) and public hearing before launching regulation that designated fee for SWM (66.2%). 8 Understandably, local revenues are not adequate for meeting the SWM expenses of the local government authorities, which are guided by public health law and regulation.
In Bangladesh, the situation is primarily one that is donor-driven. External support agencies such as the Asian Development Bank (ADB), Gesellschaft für Internationale Zusammenarbeit (GIZ), World Bank, and Kreditanstalt Für Wiederaufbau (KfW) (German Development Bank) provide financial support to municipalities on SWM as part of urban development projects. Recently, the Japan International Cooperation Agency (JICA) provided technical assistance to the Dhaka City Corporation to develop a 20-year master plan for solid waste. Moreover, JICA has also provided grants to improve the crude dumping site in Dhaka into a controlled landfill site and provided 100 reconditioned compactor trucks for waste collection.
In Indonesia, the central government and local government are responsible to finance the implementation of waste management. This funding comes from state or local revenues and expenditures budget. In general, the allocation of funding for the waste sector on local revenues and expenditures budget is still less than 5% of the total budget, much lower than in other countries. The low cost for waste management generally is still not a priority, and the pattern of waste management is perfunctory without calculating environmental factors and public health safety. In many cities in Indonesia, the budget allocation for implementation (only for operation and maintenance) is still low, with less than 2% of the total local budget. Also, the collection rate of the retribution accounts is only 40% to 50 % of the revenue. An improved tariff system based on cost recovery principles is necessary to guarantee the improvements and sustainability of the current SWM systems.
Apart from the state budget, funding for waste management in Indonesia is also derived from the community (waste retribution), assistance from non-government organizations (NGOs), and private sector. Public–private partnership (PPP) is an alternative financing SWM. Financing from the state budget has been supported by international institutions, such as GTZ (GIZ), JICA, the World Bank, and United Nations Educational, Scientific and Cultural Organization (UNESCO). During 1988-2004, most of the towns/cities have received solid waste programs, financed by the state budget and some financial assistance from ADB loan, International Bank for Reconstruction and Development (IBRD) loan, JICA, and Japan Bank for International Cooperation (JBIC). The investments were primarily used to finance the construction of the final disposal site.
Thus, while the levels of government involved in the provision of SWM in the somewhat decentralized countries appear to have a good relationship with the other levels of government (based on the mayors’ surveys conducted by the UCLG), service provision of SWM is much better in the fully decentralized countries.
Financing in the decentralized countries
In the fully decentralized and high-income countries, the local governments have the fiscal autonomy to levy fees and capacity to finance expenditures on SWM.
In Australia, local government waste services are generally provided on a cost recovery basis either through separate waste charges or covered by general revenue (property rates) (NSW Government, 2011). Some domestic waste fees are not optional for ratepayers. In some cases, certain domestic waste fees, such as domestic green waste fees, are optional.
Solid waste collection in New Zealand is generally operated on a user pays basis. Landfill fees are determined by the cost of operation and vary considerably between councils. Councils also use a range of technologies, from bins to rubbish bags. A number of councils have adopted zero waste policies; however, they have limited authority over the private sector waste companies. The sector has a high level of private sector involvement. The Kate Valley Landfill in Canterbury is an example of a PPP with 50% of the shares held by 10 councils and 50% held by 2 companies.
Summarizing the findings here, financing of SWM in the decentralized and middle-income countries is straightforward, but less effective than in the decentralized high-income countries. Municipalities in India are responsible for collection, sweeping, storage, transfer, treatment, and final disposal of waste. Most of the municipal authorities allocate general municipal funds to cover the costs of SWM services. However, they most often do not levy any sanitation or city cleaning tax, nor do they impose user fees for waste collection service. Very few cities levy user fees for door-to-door collection. SWM constitutes from 10% to 50% of municipal budget expenditure. The main expenditure categories are salaries and allowances, consumables, vehicle repair and maintenance, contingencies, and others. As much as 30% to 50% of municipal personnel in a local body are engaged in solid waste activities. Most of this staff is engaged in street sweeping (Zhu et al., 2008). But cities recover less than 50% of the operation and maintenance (O&M) cost, according to a study by the MoUD (2010). The distribution of expenditure is heavily loaded in favor of collection and transportation, and little attention is paid to processing and scientific disposal of the waste.
Figure 1 demonstrates the relationship between per capita expenditure for MSW management and per capita income in selected Asian countries. It suggests that the increase in per capita income generally increases the demand for both public and private services for MSW management. Hence, we surmise that much higher levels of expenditure will be necessary for collection services and for the construction, operation of treatment and disposal facilities, especially so in south Asian countries such as Pakistan, Bangladesh, and India. Methods of financing the improvement of MSW management have also become necessary for cities that have achieved a certain level of economic development.
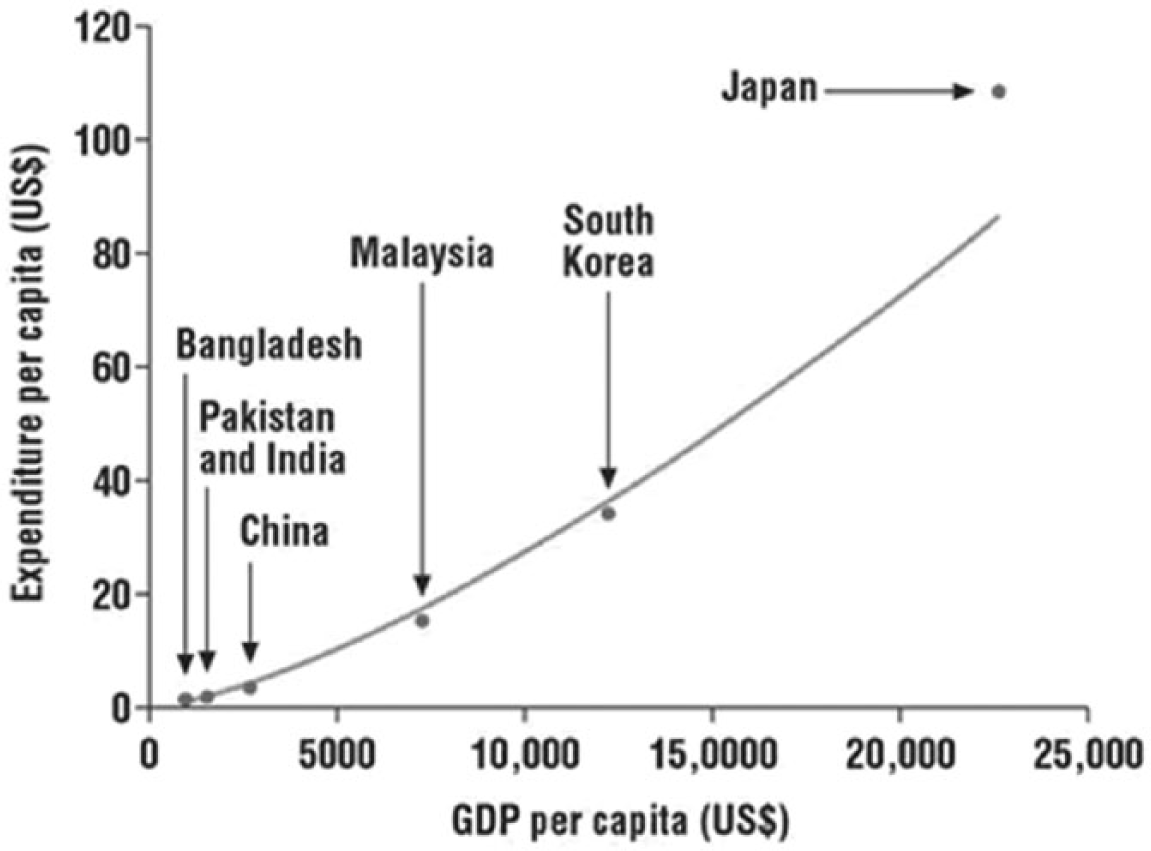
Per capita expenditure for MSW management and per capita income in Asia.
As discussed at the beginning, most of the municipalities in low- and middle-income countries in Asia allocate the majority of their SWM budget to collection and transportation services. They do not spend much on final disposal because they usually dump the waste in the open.
Summary and Concluding Remarks
We have learned that municipal governments are usually the responsible agency for solid waste collection and disposal, but the magnitude of the problem is well beyond the ability of any municipal government. They need help. In addition to other levels of government, businesses and the general community need to be more involved in SWM initiatives. We find that higher levels of income bring along with them the public awareness, institutional structure, and fiscal capacity to deliver better levels of public services; hence, the objective should be to build awareness of the environmental and health consequences of poor SWM. Furthermore, we find that decentralized countries are in a better position to deliver SWM because of the local nature of the service. Resident welfare associations (RWAs) can be made the fulcrum of activity with regard to local public services, most importantly SWM (see Sridhar, 2008). We find that a major challenge foreseen in meeting the public service demands over the next decade, as it relates to SWM, is financing. Ravi (2014) focuses on the role of ragpickers in reducing SWM costs in Delhi.
Furthermore, Sridhar and Venugopala Reddy (2010) present the use of land leasing and sales as a potential tool for municipalities in India to finance the provision of basic urban services such as SWM. Hence, the use of public land as a financing tool should be actively explored by cities in other countries of the Asia Pacific region.
While SWM costs money everywhere, the likely prospects for improvements in SWM are positive because there are opportunities for reducing the costs of collection, composting, or recycling waste. According to a study by Da Zhu et al. (2008) of the World Bank, the composition of Indian waste is such that close to 55% is organic and can be converted into compost and another 15% is recyclable. Modern waste-to-energy plants in the western countries have been providing sustainable means of waste management, with minimum side effects on the environment. The relevant example is Southeastern Massachusetts Resource Recovery Facility (SEMASS RRF), a waste-to-energy facility in Massachusetts, in the United States, which uses 1 million tonne of MSW to generate 600 million kilowatt-hours of electricity every year and recycles 40,000 tonnes of metals. The annual toxic emission is less than half a gram annually. This seems like a win–win situation for everyone, which Asian cities should more proactively adopt.
Last, but not the least, Paulet al. (2012) find that in the case of Indian cities, the data on solid waste collected are the same as what is generated, which calls for better data generation and maintenance capabilities on the part of Indian local authorities. This is a more general issue as the lack of reliable and adequate data on basic urban services has severely undermined our ability to conduct research and formulate sustainable policies for urban planning. Low-income and middle-income countries in the Asia Pacific region need to upgrade their data systems to address this challenge.
A note regarding the limitations of the research reported in this article and possible avenues for future research. It is quite commonplace knowledge that very large cities with large economies in developing countries tend to behave quite differently from smaller cities in the same country whose municipalities struggle to find the finances to deliver services. As an area for future research, it will be better to look at the 90 cities separately rather than their countries, and attribute the reasons for the differences in their service delivery by the status of development or governance in these countries. For instance, in India, besides regional differences in development within the country, which is dependent on the level of awareness and education among their citizens, the level of devolution of power and autonomy of the cities differ in different states, although the national Act (read the 74th Constitutional Amendment Act) recommended autonomy for all cities more than 20 years ago. Some of the small north eastern hill cities with higher levels of education and political awareness are seen to be more autonomous or decentralized than some of the bigger cities in states such as Uttar Pradesh, Madhya Pradesh, and Chhattisgarh.
While this article does not highlight anything new to make SWM more effective or attempt to find ways and means to help developing and less developed countries achieve adequate coverage by using innovative policies or technologies, its contribution has been to raise awareness about SWM globally and in low-income countries, by attempting to understand such a local problem at the cross-national level, and to once again reiterate the importance of economic development, city size, and the extent of decentralization in the delivery of SWM.
Footnotes
Acknowledgements
I am grateful to United Cities and Local Governments Asia Pacific (UCLG ASPAC) for funding the study. Thanks are due to Aprodicio Laquian of the University of British Columbia for giving me the opportunity to contribute to Global Report on Local Democracy and Decentralization (GOLD III), for answering many of my questions regarding the country reports based on which this article is written, and his comments regarding the chapter. Research assistance from Nivedita Kashyap is appreciated. She consolidated the solid waste portions of all the country reports. Her assistance for this project is gratefully acknowledged. Comments from the reviewers and editor of the journal are appreciated and acknowledged.
Author’s Note
This article is excerpted from the Sectoral Report on Solid Waste Management, which was written by the author when she was with Public Affairs Centre, for the Third Global Report on Local Democracy and Decentralization (GOLD III) for the Asia Pacific Region and was funded by United Cities and Local Governments Asia Pacific.
Declaration of Conflicting Interests
The author(s) declared no potential conflicts of interest with respect to the research, authorship, and/or publication of this article.
Funding
The author(s) disclosed receipt of the following financial support for the research, authorship, and/or publication of this article: This article was written as a background paper for the Third Global Report on Decentralization and Local Democracy (GOLD III) for Asia and Pacific region, funded by the United Cities and Local Governments (UCLG) Asia Pacific.