




Abstract
Light rail transit systems (LRTs) are attractive options for modern communities as they offer high quality, sustainable public transportation services. However, investment costs often may make their application for medium-sized cities prohibitive, particularly if no significant social benefits are achieved. Guided light transit (GLT) has been introduced in the recent years, as a lower cost alternative to LRT, with the additional advantage of being suitable for urban environments with space limitations. In this study, a systematic comparison of LRT and GLT is offered, in the context of a mid-size city in Greece. Results indicate that high investment costs, coupled with low ridership can have a negative impact to the introduction of LRT in a medium-sized city. However, under certain conditions, GLT may be a viable alternative, while its nature and characteristics are not that different to those of LRT.
Introduction
Light rail transit (LRT) has been gaining attention among modern communities, as an attractive alternative for public transportation service provision. Indeed, LRT systems (LRTs) offer high quality, sustainable services while their smooth integration to the urban environment is considered an additional asset (Scherer, 2010). The term “Light Rail Transit” is often attributed to urban rail transit systems of various sizes and technologies, whose operation is fully or partially separated from traffic (American Public Transportation Association [APTA], 2015). Vuchic (2003) offers a systematic categorization of different LRT types, ranging from streetcars to light metro and automated guideway systems. Currently, LRTs are successfully operating in over a hundred cities worldwide (Light Rail Transit Association [LRTA], 2015), while introduction of such systems is planned for several urban areas in the developed and developing world.
In recent years, aspects related to development, operations, and performance evaluation of LRT has been widely investigated in the literature. In this context, several studies stated experiences on the performance and impacts of LRT operations in the United States (Arrington, 2003; Ewing, Hamidi, Goates, & Nelson, 2014; Farrqn, 2008; Poindexter & O’Connell, 2007; Thompson & Brown, 2012), Australia (Currie, Burke, & Delbosc, 2014), Japan (Ito, 2004), France (Dunant & Currie, 2013), Canada (Hubbell & Colquhoun, 2007; Jones, 2013), and Algeria (Godard, 2007). Other studies investigated characteristics of future LRT developments. For example, Henry (2004) discussed rescaling in design and cost of streetcars for achieving affordable LRTs and Shalaby, Ling, and Sinikas (2007) evaluated the potential of introducing LRT in Toronto, Canada. LRT as a transportation alternative for medium cities was explored by Karttunen, Hilmola, and Saranen (2010), using an investment appraisal method. Lahon (2012) modeled and evaluated future LRT lines for Houston and Lavery and Kanaroglou (2012) presented an integrated urban model for analyzing impacts of LRT lines. A review and critical assessment of an LRT project in Hamilton, Ontario, was offered by Higgins, Ferguson, and Kanaroglou (2013) and Baumgarten, Bernard, Robin, and Rotarescu (2014) investigated the options of reducing costs for deploying tram systems in small cities. Findings on economies of scale in LRT operating costs were recently presented by Allen (2014) and Walter and Fellendorf (2015) proposed a method for LRT long-term update strategies.
Although popularity and advantages of LRT are evident, deployment of such systems in medium-sized cities is often avoided for economic and technical reasons (Henry, 2004; Karttunen et al, 2010). Relevant barriers against developing LRTs include high investment and maintenance costs, lack of funding, and limited urban public space. Nevertheless, LRT is particularly attractive to the public and decision makers for several reasons: First, construction of LRTs is usually combined with an aesthetic upgrade of its corridor and the surrounding urban landscape. Second, the environmental and noise footprint of LRTs is low, even compared with bus systems of similar capacity (Chen, Yu, Song, & Xian, 2012; Puchalsky, 2005; Stutsman, 2002). Third, longer service life and clearly established corridors of LRTs impose a stronger bond and commitment of the community toward transit services. Fourth, a positive impact is usually observed to land values and the economy along an LRT corridor.
In this context, the industry has introduced in the recent years Guided light transit (GLT), as a similar, lower cost alternative to LRT (Wikipedia, 2015a, 2015b). GLT systems (GLTs) run on tires; they are guided by a central rail (guide rail; Figure 1) and powered by overhead wires. Depending on the model, vehicles can operate independently of the guide rail if necessary. Advantages claimed by manufacturers of these systems include reduced investment costs, lower road space requirements, and better hill-climbing capabilities (Alstom, 2014; Björklund, Christoffer, Rosenqvist, & Ydstedt, 2000; Suyuti, 1997). These characteristics make GLTs candidates for cities willing to introduce low cost, LRT-like systems (Björklund et al, 2000; Suyuti, 1997).
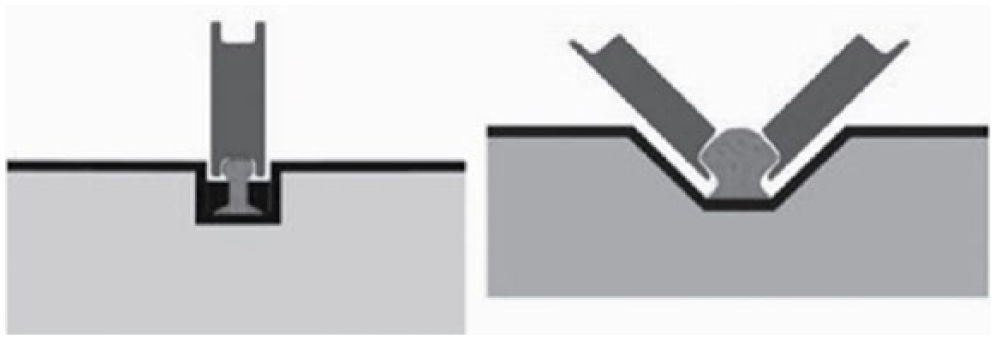
Guide rail (Bombardier and Alstom).
Both LRTs and GLTs are fixed-route systems. The former are largely based on rail technology and operate on a track, while the latter resemble electric buses (trolleys) and use a rail only for guidance along a corridor. As such, guideway construction works for GLTs are estimated to be considerably lower, while GLTs keep some advantages of fixed-route modes (such as a constant distance from the sidewalk and a railway-like steady course) (Alstom, 2014; Björklund et al, 2000; Suyuti, 1997). Both systems are powered from overhead wires; GLTs (and a few LRTs) can also operate independently using auxiliary diesel engines (National Trolleybus Association, 2000; Sintropher, 2015).
This article offers an ex-ante comparison of the potential introduction of LRT or GLT technologies, using the mid-size city of Ioannina, Greece, as an application setting. In 2011, local authorities decided to follow the example of other European cities of similar size, and investigate the feasibility and funding options for developing a fixed-route mode in the city. The project involved the combined selection of the most prominent corridor and appropriate technologies (LRT and GLT) for that purpose. The system was envisaged to be developed in two phases (Phases A and B); reasons included fund availability and the need for the local community to get acquired with the introduction of the new system in the city.
The remainder of the article is structured as follows: Next, the problem is stated and the comparison methodology is presented. In the subsequent sections, the application setting and analysis parameters are described in detail and are followed by a thorough discussion of results. The article concludes with the study’s major findings.
Method
Problem Statement and Pre-Requisite Actions
The problem at hand is that of the combined evaluation of alternative fixed route, public transportation routes and technologies in a medium-sized city. Evaluation involves technical, financial, and economic aspects of each candidate case. Major pre-requisite steps involve the establishment of candidate routes and the estimation of ridership for each route. For the present case, alternative routes, connecting major generators and attractors, are identified. It is noted that depending on the route structure and characteristics, introduction of LRTs or GLTs may be (more or less) desirable and/or feasible.
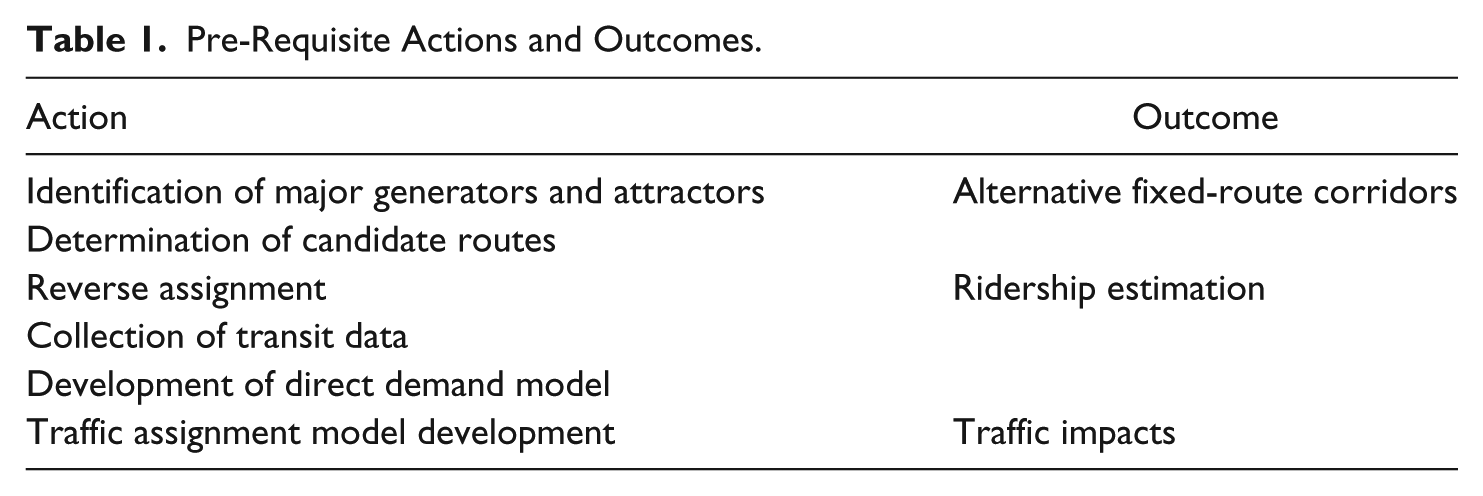
Ridership for each route is estimated using a direct demand model developed from available traffic and transit data. A reverse assignment method (Nielsen, 1998) is adopted for obtaining origin–destination information from available traffic counts, while boardings from bus services are exploited for estimating existing transit ridership. The direct demand model is then applied and transit ridership for each alternative route is estimated. A traffic assignment model is used for assessing traffic impacts resulting from the establishment of each candidate corridor, assuming that parts of the road network are used exclusively by a fixed-route mode. Pre-requisite actions and expected outcomes are summarized in Table 1.
Pre-Requisite Actions and Outcomes.
Evaluation Method
A two-step process is adopted for evaluation (Figure 2). First, multi-criteria decision making is exploited for route pre-screening and identifying the most prominent among candidate corridors. The analysis considers the level of applicability of LRT and GLT technologies for each corridor. For the prevailing corridor, a financial and cost–benefit evaluation of implementing any of the two technologies is next undertaken. This way, the evaluation process incorporates corridor, financial, economic, and technology-specific aspects.
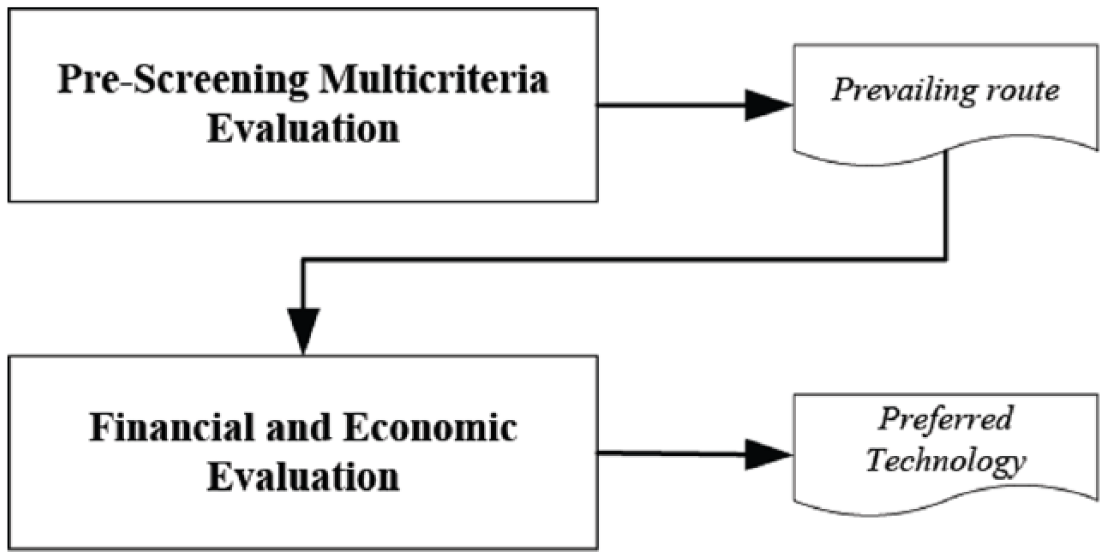
Evaluation approach.
In detail, multi-criteria evaluation is used for pre-screening candidate corridors, while considering specific characteristics of LRT and GLT technologies. Different criteria and sub-criteria are adopted for that purpose; these are summarized in Table 2. While some criteria are technology independent, geometry constraints (such as turning radius, vertical slopes, and guideway width), as well as the extent of track construction works, affect the implementation of LRT or GLT (or both) along a particular corridor. Similarly, higher ridership estimates along a corridor dictate the introduction of a technology that will offer larger capacity. As such, candidate corridors cannot be evaluated independently of the technology adopted.
Evaluation Criteria.
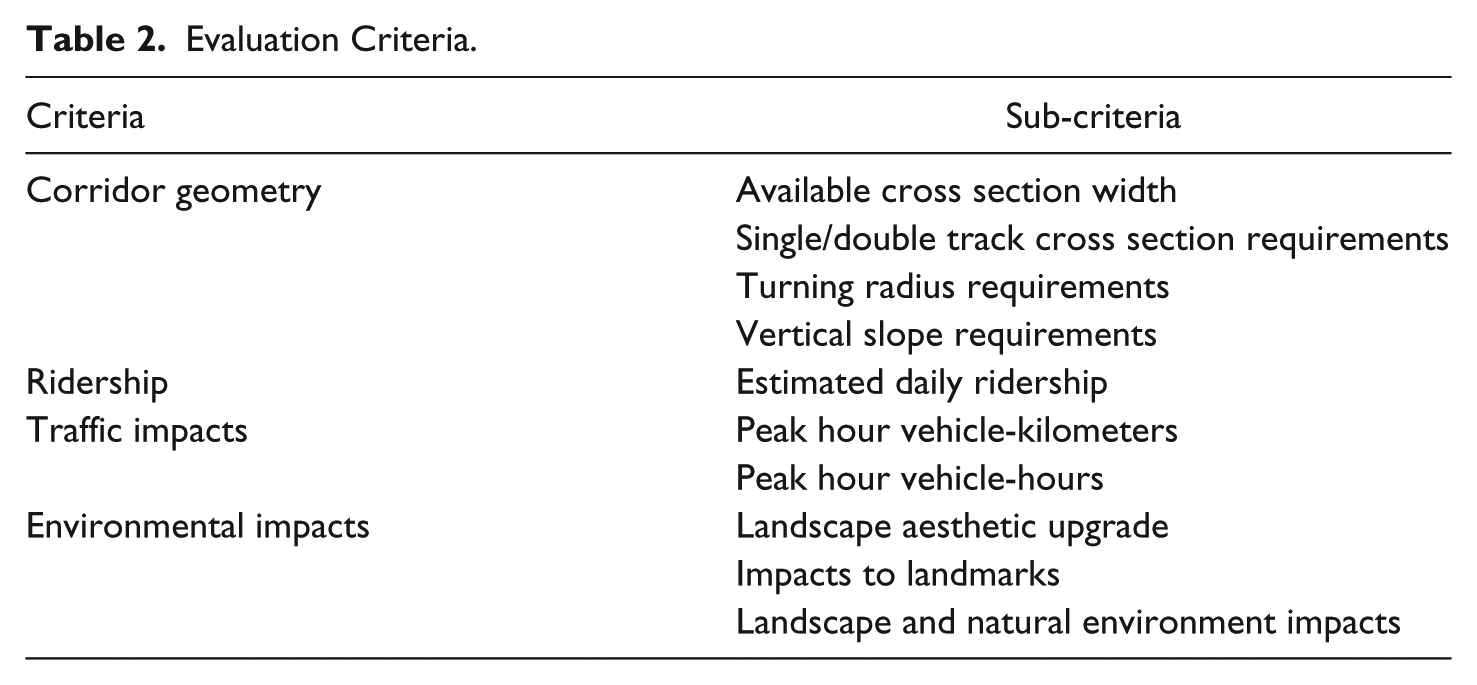
Four major evaluation criteria are established: (a) corridor geometry, (b) ridership, (c) traffic impacts, and (d) environmental impacts. Related sub-criteria for corridor geometry include available width, whether a double track or two independent single tracks (different corridors per direction in some segments) are needed, turning radius, and vertical slope requirements. It is noted that evaluation for geometry-related sub-criteria is not solely based upon compliance with minimum design values but is rather comparative between the two technologies. For example, a relatively sharp LRT curve may be feasible but it will produce noise and therefore is less desirable. However, GLTs require very low turning radii (Alstom, 2014); this fact favors their use in the road network of Ioannina.
Corridor ridership, apart from being an important factor for selecting a corridor, may eventually require the introduction of a higher capacity system. Traffic impacts are technology independent and are related to traffic conditions following the introduction of exclusive fixed-route mode corridors in the city’s road network. Investigated technologies do have different environmental impacts, particularly in the case of a historical city such as Ioannina. For instance, LRT vibrations can affect neighboring buildings and landmarks. Also, noise produced in sharp curves is always an issue in urban areas. Extensive track construction works (mostly required for LRT) can be cumbersome and time-consuming to complete, as this would mean utility relocation, archaeological surveys, and so forth. On the contrary, establishment of an LRT corridor is often coupled with extensive aesthetic improvements of the guideway and the surrounding environment, as well as upgrades in land uses, which is not necessarily a fact for GLTs. Indeed, as the visual impact and size of a GLT guideway is minimal, it may be the case that this technology will not be that different from buses, and yield less interest for development along the transit corridor.
Based on the outcomes of the multi-criteria evaluation, a detailed financial and cost–benefit assessment is undertaken for each technology and the prevailing corridor, following European Commission guidelines (European Commission, 2006, 2008). The financial part of the analysis involves estimation of investment and operating costs and revenues, calculation of financial return of investment indicators, and a financial sustainability analysis (the latter investigates whether revenues cover operating costs throughout the life of the project). A subsequent cost–benefit analysis assesses social inflows and outflows, properly adjusted to reflect accounting prices and monetary costs. Social inflows include environmental, fuel, accident gains, and travel time savings, along with service revenues, while social outflows consider investment and operations costs; taxation is excluded from cost values.
Application Setting and Preliminary Tasks
The city of Ioannina is located to the north-west part of mainland Greece, next to the lake Ioanninon (or Pamvotis). It has a population of 120,000 inhabitants and covers an area of approximately 50 km2. Founded in the 7th century, Ioannina has historically been the administrative, commercial, and economic center of the prefecture of Epirus (Figure 3). The city has a university (with 20,000 students), a technological (community) college, two hospitals, an airport, and a large industrial zone in its outskirts.
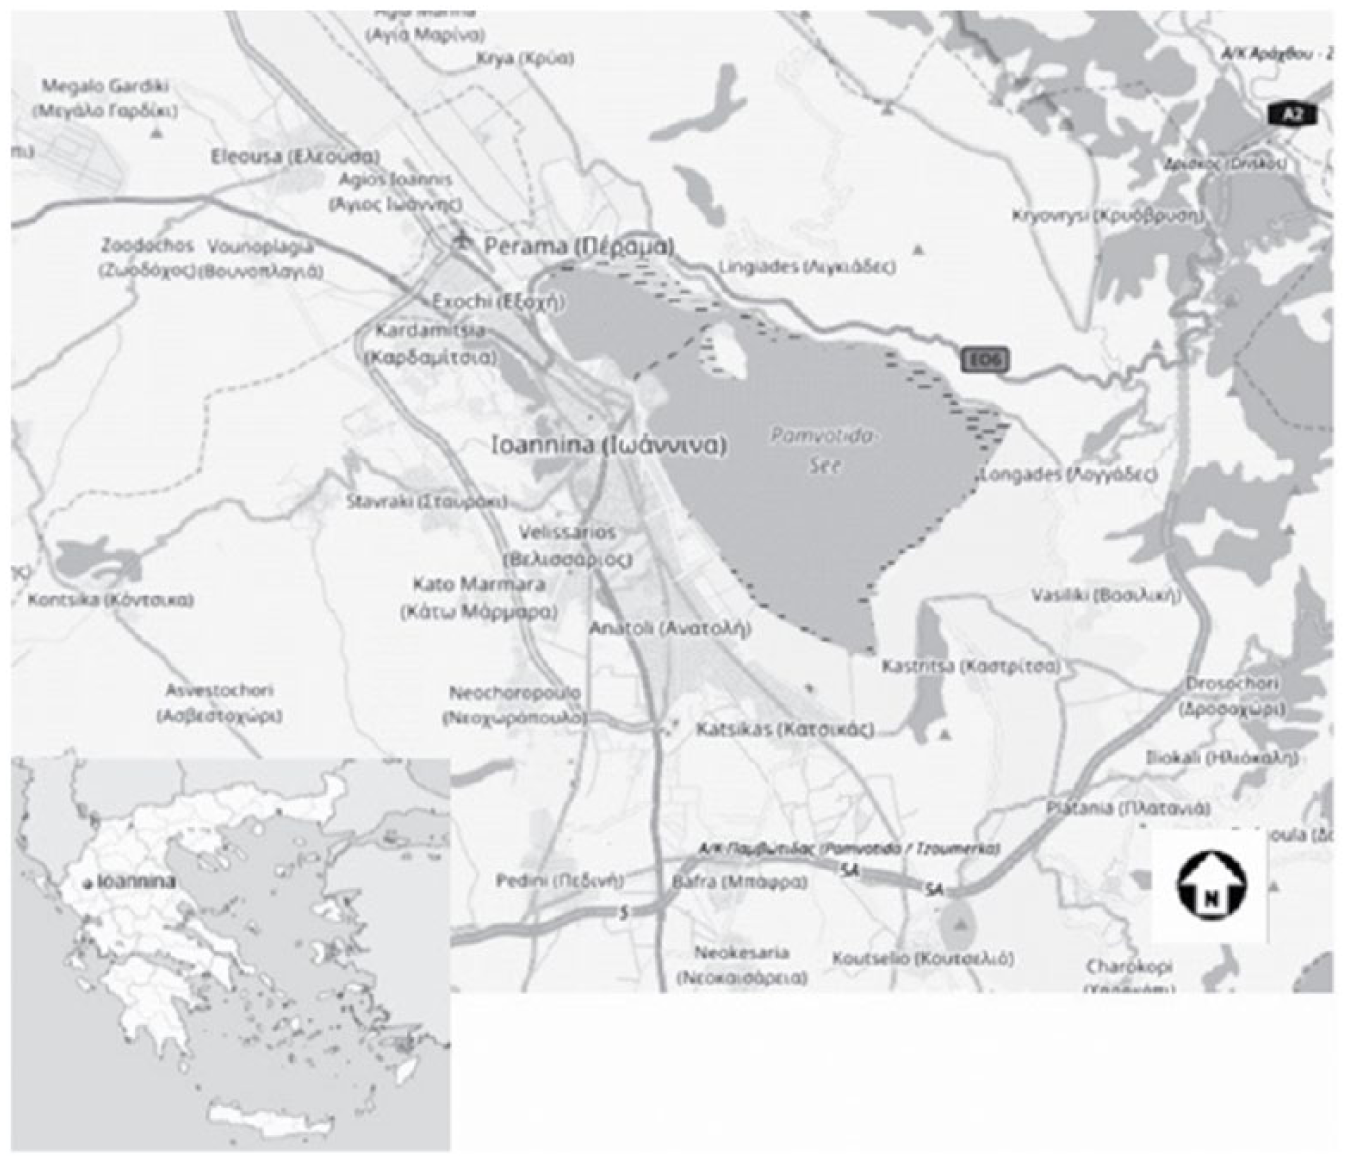
The city of Ioannina, Greece.
The urban structure of the city of Ioannina is characterized by small blocks and narrow streets (as most historical European cities of that size and age), while part of the city is walled. As the city gradually grew over the past centuries, its street pattern evolved in an irregular grid. Economic growth of the past decades led to the rapid increase of private vehicles usage in the city, while its road infrastructure and parking space availability were marginally improved. As such, the city’s major road network often exhibits congestion during rush hours, both from local and incoming traffic originating from neighboring communities. The public transportation network, however, is solely based on bus lines, operating in relatively low frequencies of 15 to 20 min.
As mentioned earlier, in early 2011, the city decided to investigate the potential of introducing a fixed-route mode in the city, following the example of other European cities of similar size and urban structure. Anticipated benefits included the reduction of car usage, air and noise pollution, the enhancement of the urban environment along the corridor, and the introduction of a sustainable public transportation system in the city. As the city is relatively compact in size and allows for pedestrian, motorbike, and motorcycle trips, urban planners indicated that a fixed-route mode will primarily accommodate access to major traffic generators and attractors. These are shown in Figure 4 and include the city’s university and technological college, two hospitals, the airport and interurban bus station, the city center, the industrial zone, and a major commercial area (“Anatoli”) in the south of the city.
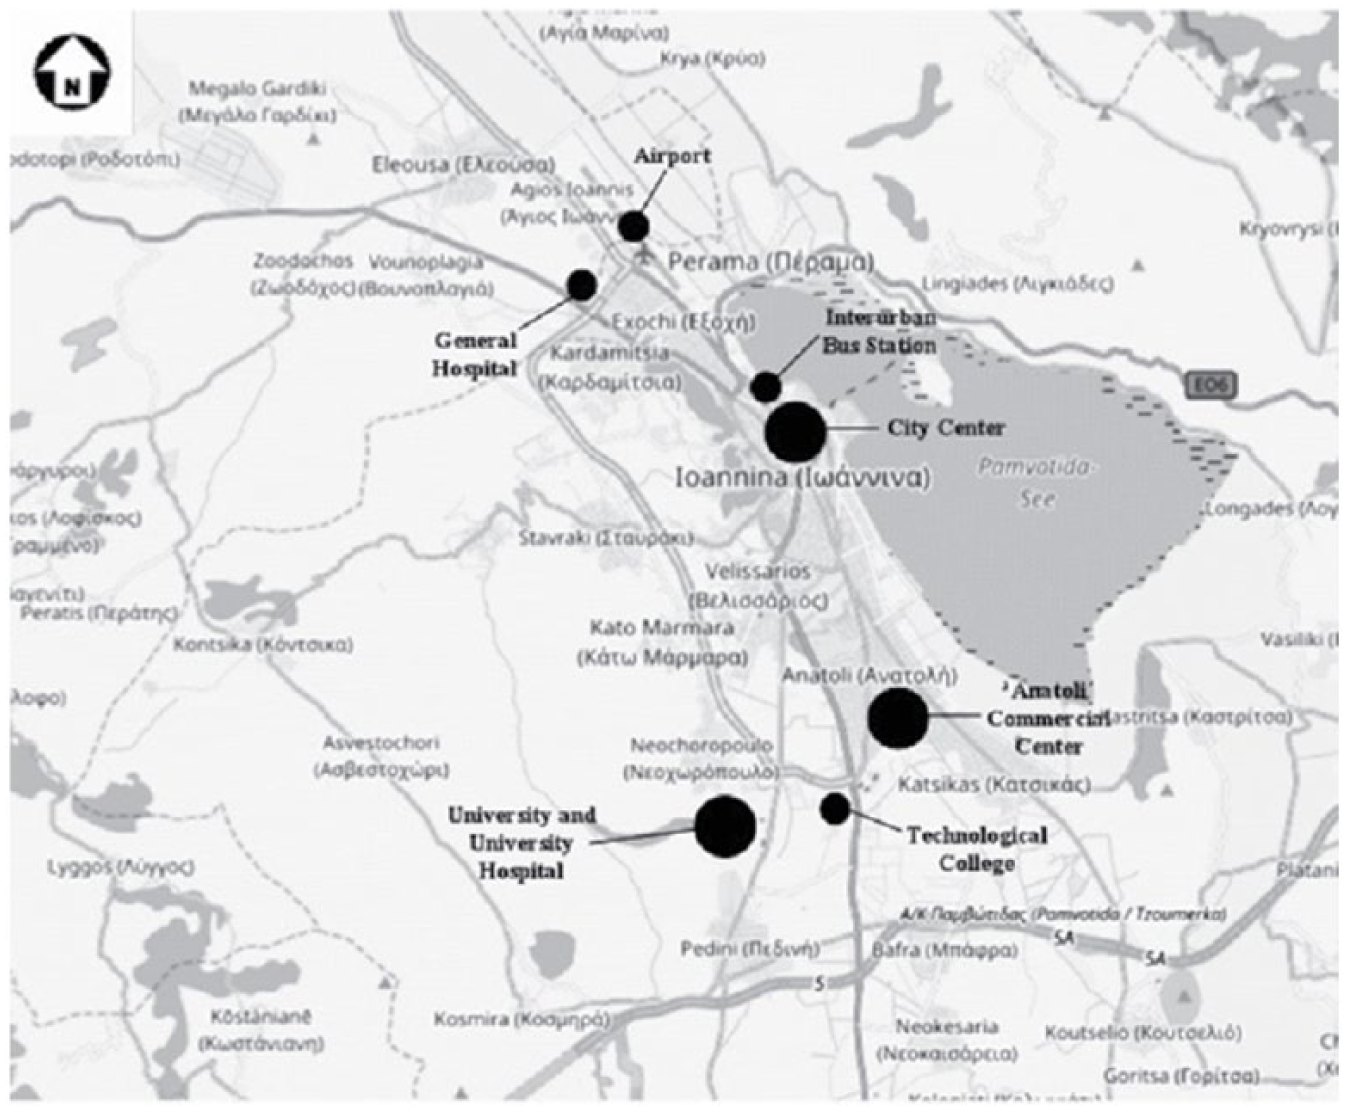
Major traffic generators and attractors in the city of Ioannina.
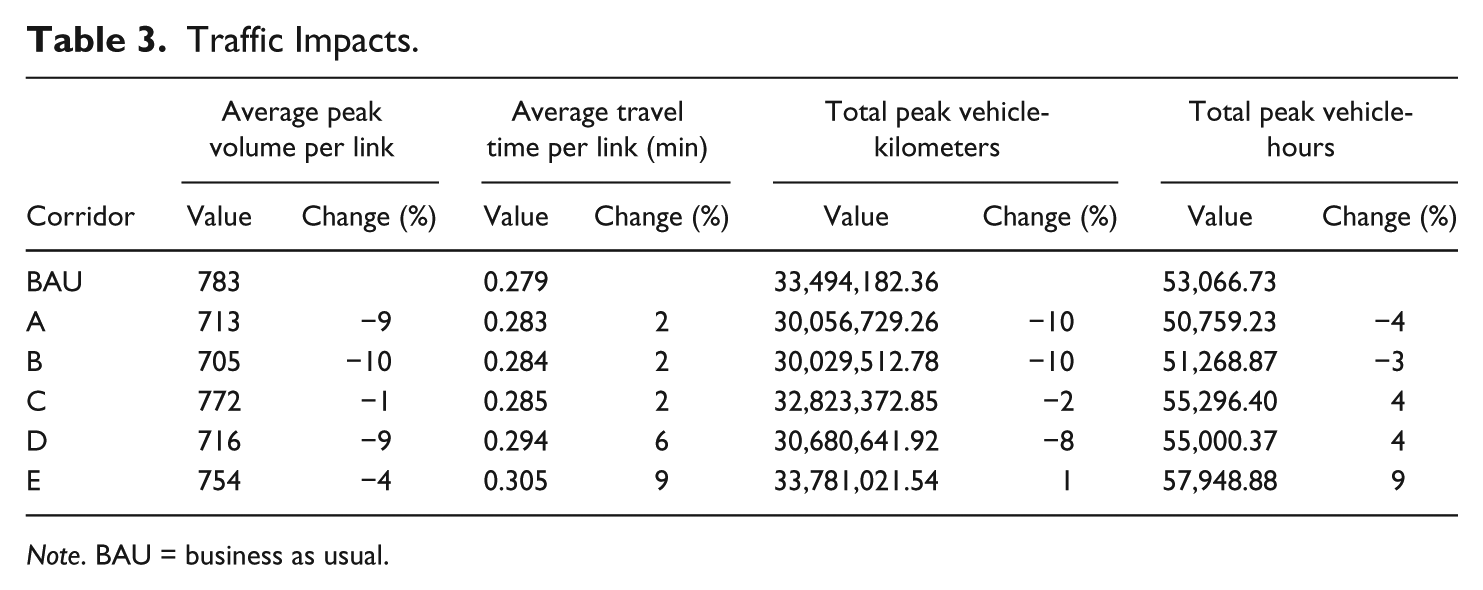
Established candidate corridors for the fixed-route mode are depicted in Figure 5. For each corridor, traffic impacts and fixed-route mode ridership are estimated using the traffic and direct demand models reported earlier (Aronis-Drettas-Karlaftis [ADK] Consulting Engineers S.A., 2011). Results are presented in Tables 3 and 4.
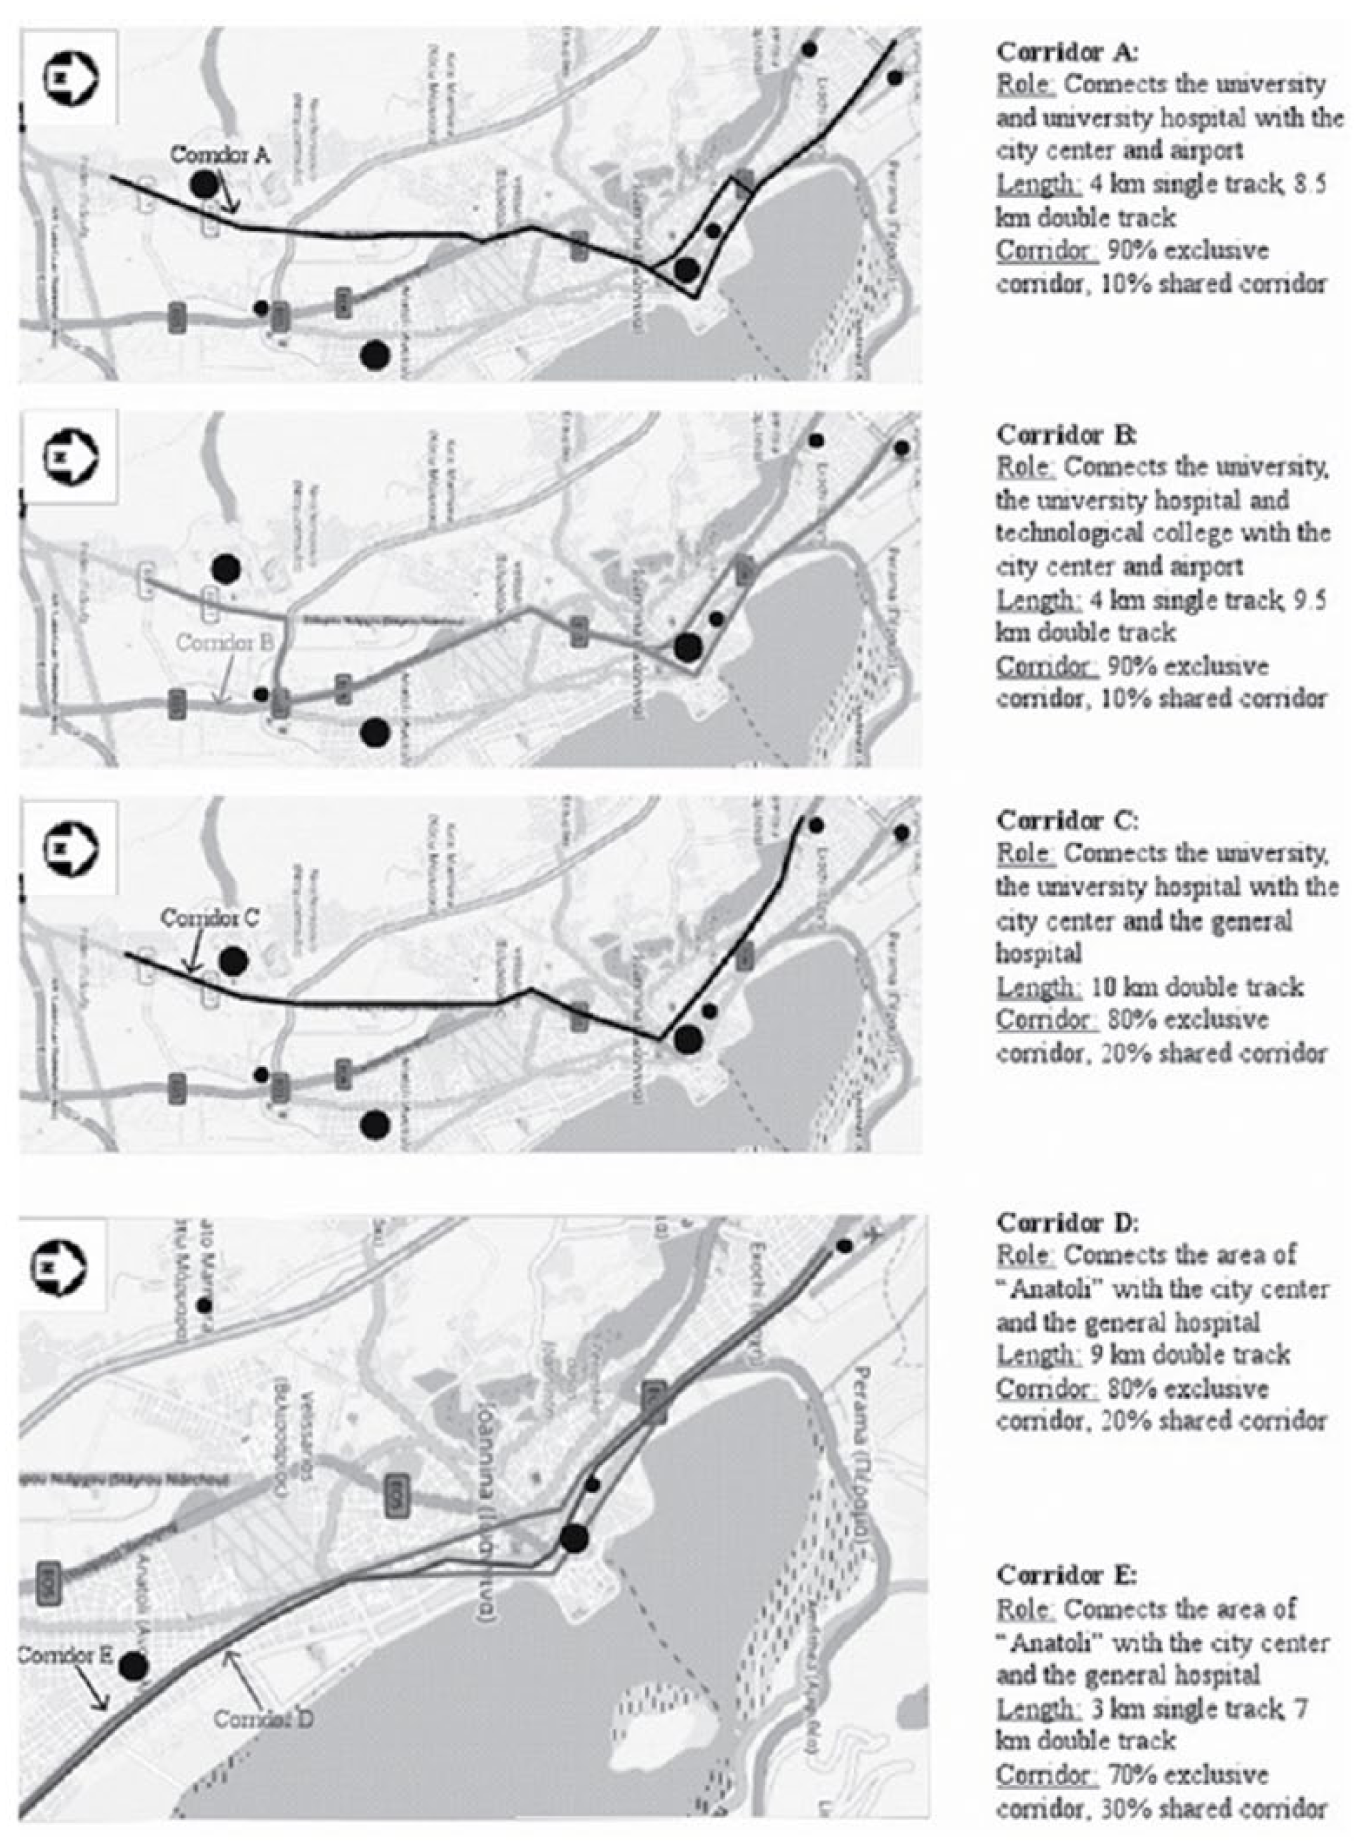
Alternative fixed-route mode corridors for Ioannina.
Traffic Impacts.
Note. BAU = business as usual.
Estimated Daily Ridership Per Corridor.
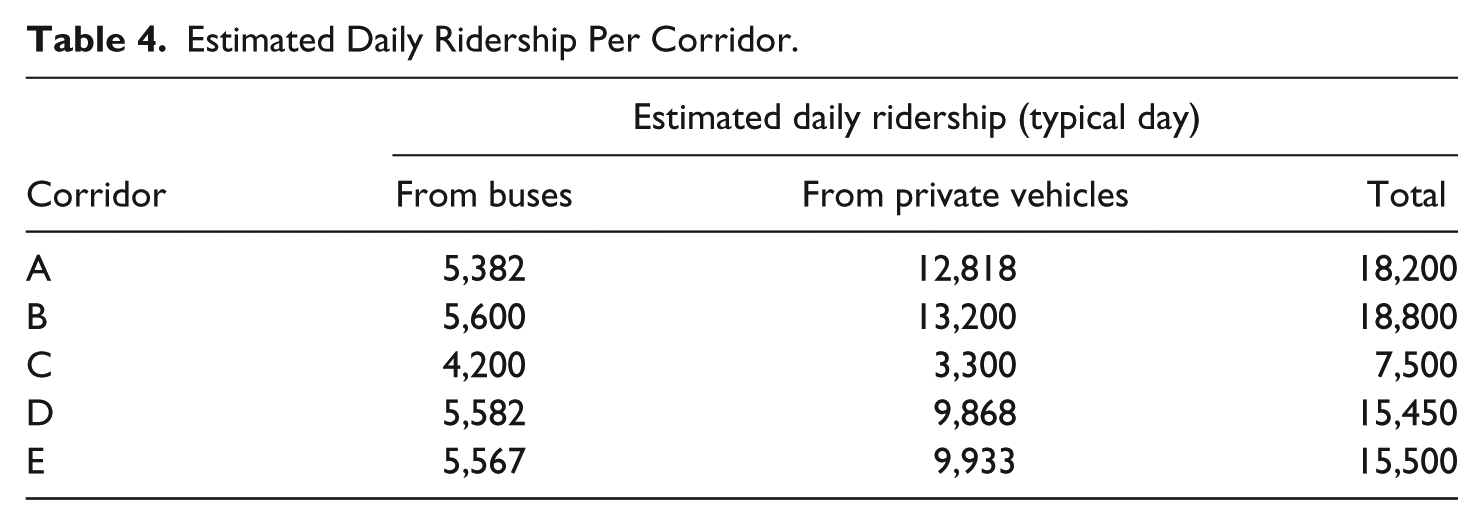
According to Table 3, estimated traffic volumes are reduced compared with existing conditions (business as usual scenario). This is expected as some travelers will shift from private vehicles to the fixed-route mode. However, as traffic lanes are planned to be used as guideways, this is expected to have some negative impact on traffic conditions. Given international experience (see, for example, Kepaptsoglou, Karlaftis, Gkotsis, Vlahogianni, & Stathopoulos, 2015), similar interventions to cities are bound to cause traffic evaporation and eventually lead to improved traffic conditions. Therefore, worsening traffic conditions may be tolerable by city authorities, at least for the first years of introducing the new service.
Table 4 summarizes daily ridership estimates for alternative corridors. Ridership includes travelers shifting from private vehicles and buses to the fixed route mode (bus lines along each corridor are assumed to be replaced by the fixed-route mode).
Multi-Criteria Evaluation Results
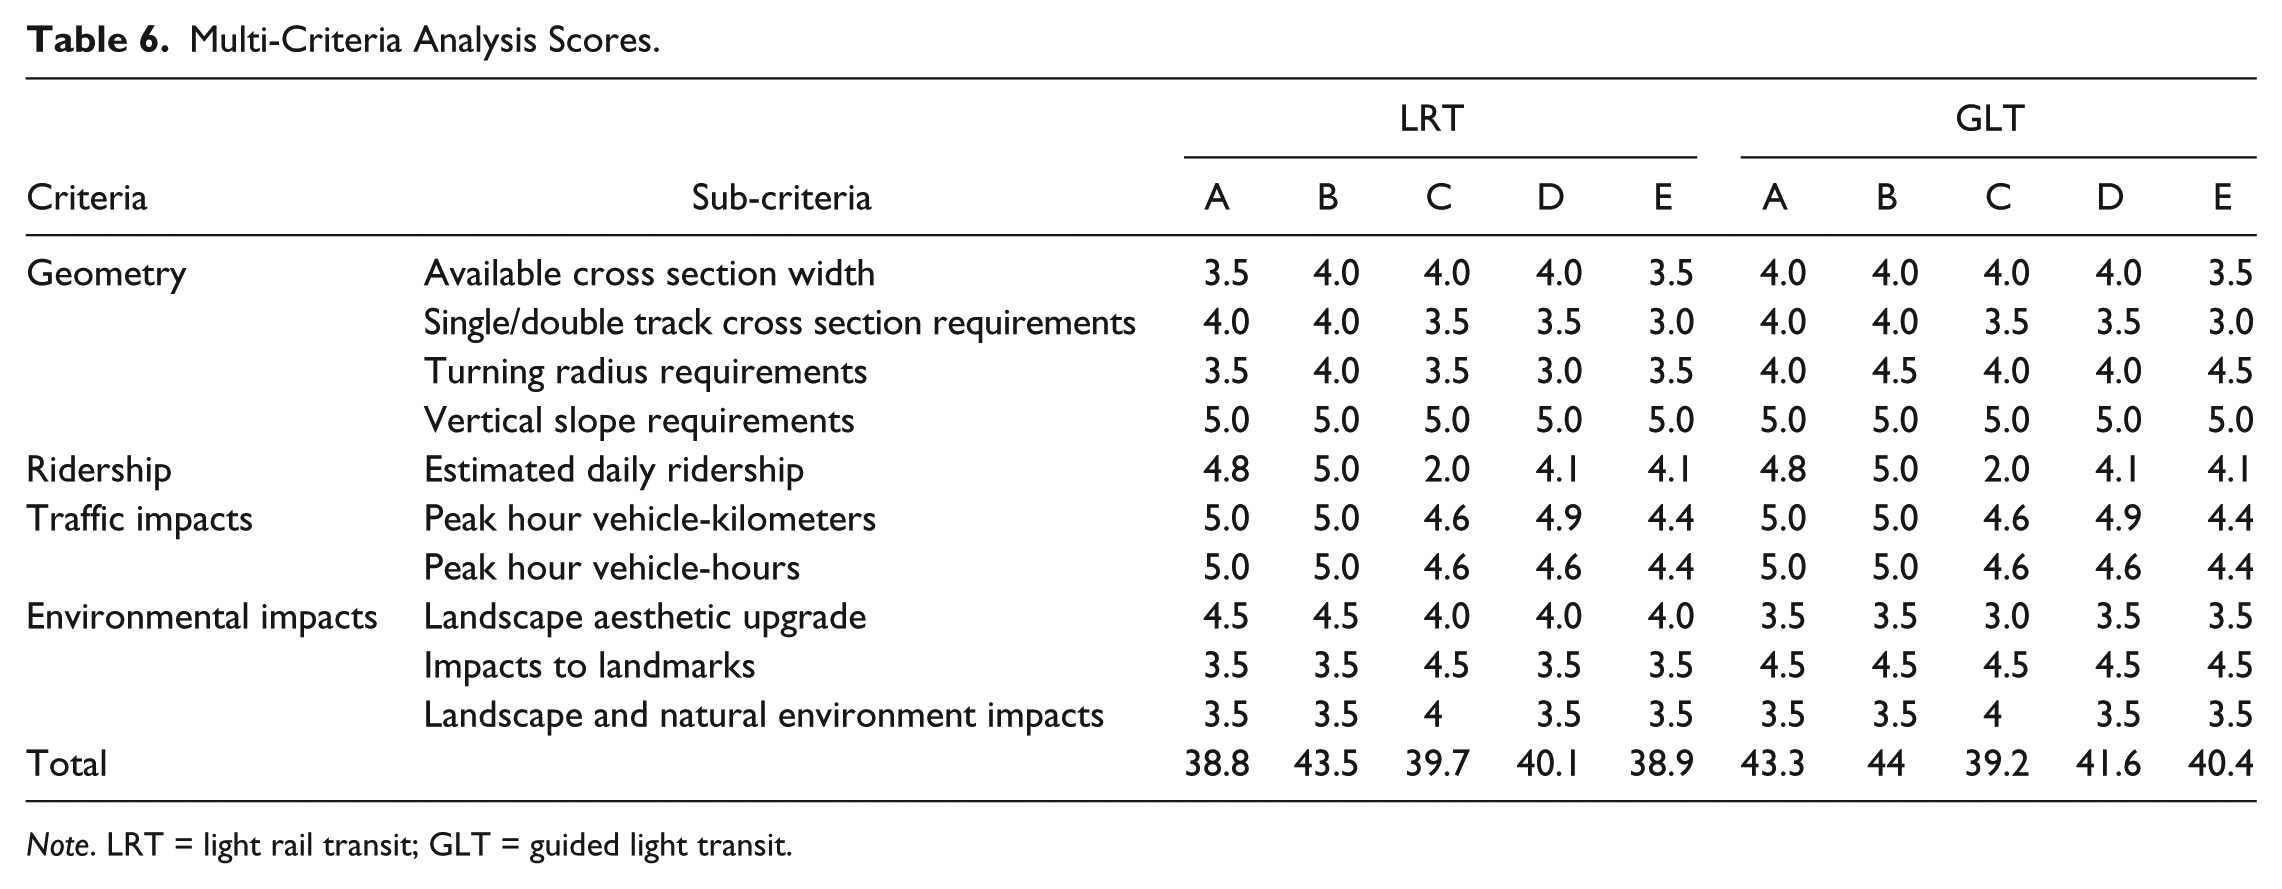
The multi-criteria evaluation aims at screening candidate corridors with respect to LRT and GLT technologies. Scores are assigned to alternative corridors for criteria mentioned in Table 2; a scale of 1 (worst) to 5 (best) is used for that purpose. For criteria with available quantitative information (ridership, traffic impacts), corresponding values presented in Tables 3 and 4 are straightforwardly transformed into the 1 to 5 scale using normalization. Scores for geometry-related criteria are assigned qualitatively on a case to case basis, after on-site inspection of candidate corridors and desk work; minimum design requirements used for that purpose are presented in Table 5. It is again stressed that in cases of implementing design values over minimum requirements, higher scores are assigned.
Minimum Design Requirements.

Note. LRT = light rail transit; GLT = guided light transit.
Based on Translohr characteristics (Alstom, 2014).
For example, at one road intersection, limited space cannot accommodate a sharp left, double track, curve of 25 m (required by LRT), without affecting neighboring structures. As such, the score for introducing LRT in this corridor is lower compared with GLT. Similarly, at one of the city’s available city center corridors, which is used by single track segments, space limitations may require the smallest possible guideway width of GLTs. A final example applies to all corridors except for Corridor C, where the fixed-route mode corridor is located next to the old city wall and, as such, vibration impacts must be considered in scoring.
Final scores are summarized in Table 6. GLTs obtain relatively higher geometry scores, mainly because of their improved adaptability in a constrained urban setting. On the contrary, LRTs obtain better scores with respect to their impact in the aesthetics of the surrounding landscape, land uses, and so on. Overall, Corridor B obtains the higher score for both technologies.
Multi-Criteria Analysis Scores.
Note. LRT = light rail transit; GLT = guided light transit.
Financial and Economic Assessment Results
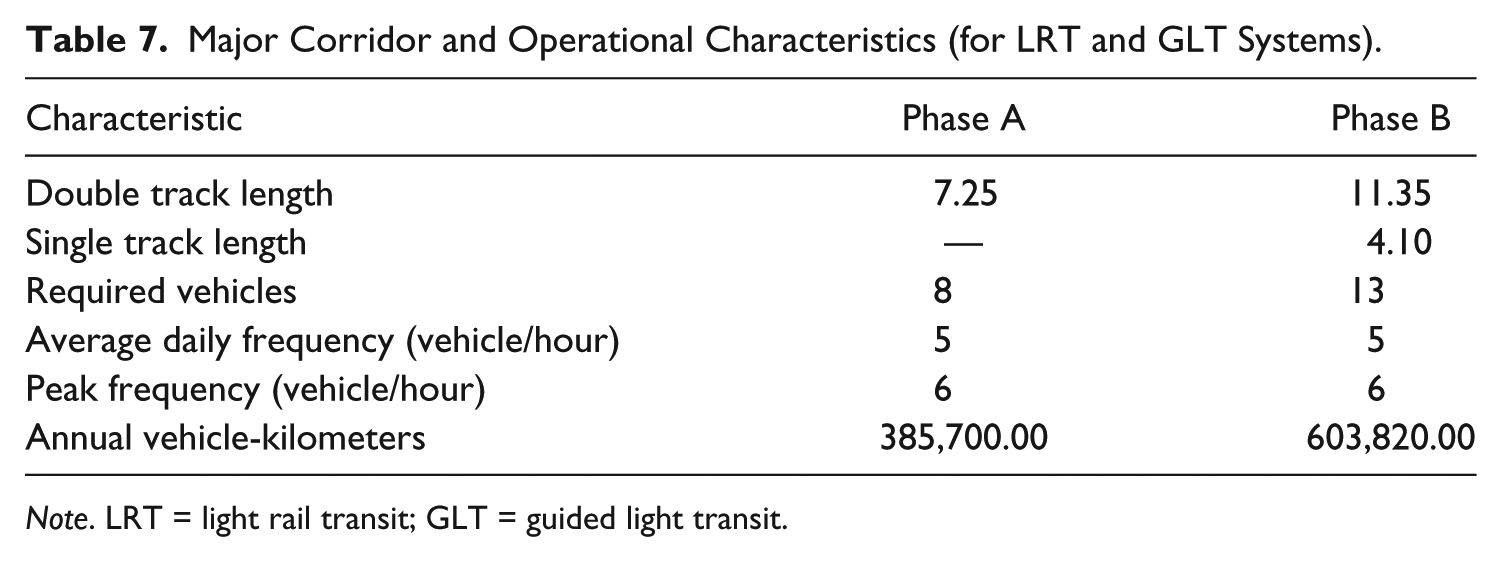
Corridor B is considered for further evaluation, from both a financial and a cost–benefit (economic) perspective. As reported in the introduction, a two-phase construction was deemed necessary (Figure 6) by local authorities for several reasons, including funding availability, the potential of upgrading the city’s airport in the future (currently offering only a flight daily), and the need for the public to get acquainted with the new mode. The first phase (Phase A) is assumed to last 2 years, while the second phase (Phase B) starts 6 years after the completion of Phase A and again requires another 2 years for completion. The part of the line constructed in Phase A connects the city center with the university, the university hospital, and the technological (community) college (a double track line with a total length of 7.25 km), while in Phase B, the line is extended to the airport and the city’s industrial area (a double track line with a total length of 2 km and a single track line with a total length of 4.1 km—approximately 2 km per direction). It is noted that single track segments operate in a single direction as well. Table 7 summarizes major corridor characteristics:
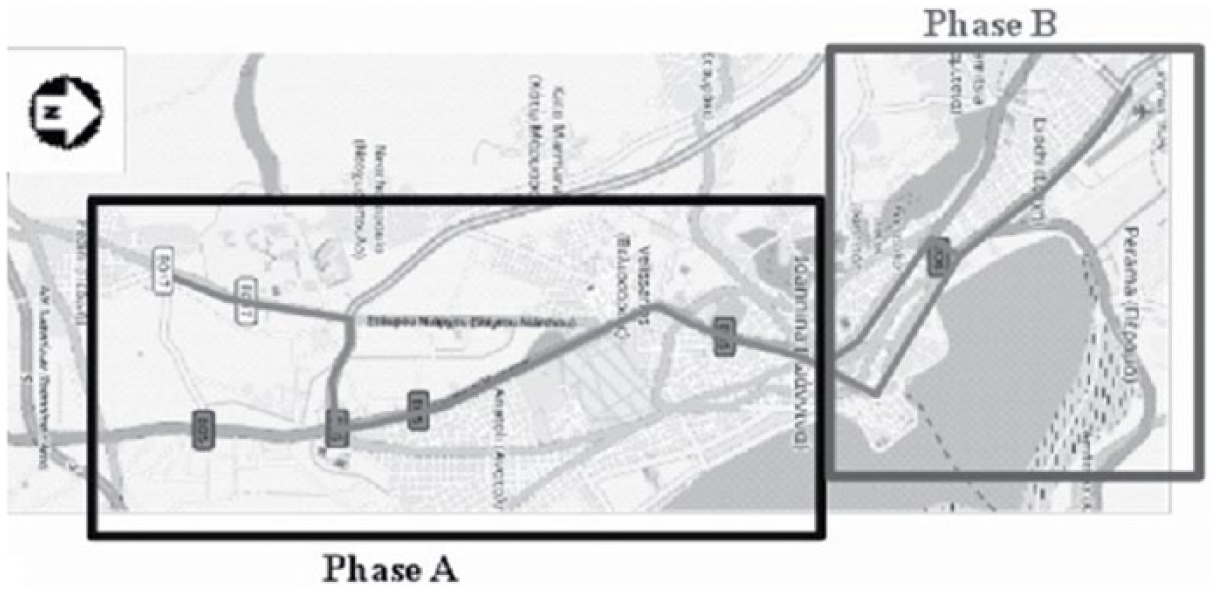
Fixed-route mode development phases.
Major Corridor and Operational Characteristics (for LRT and GLT Systems).
Note. LRT = light rail transit; GLT = guided light transit.
Ridership Evolution and Assumptions
A time horizon of 30 years since the initiation of the project is considered (European Commission, 2006, 2008), while base discount rates considered for the financial and economic analysis are equal to 5.5% and 6%, respectively (again as mandated by EU guidelines). For both technologies, vehicle capacity is assumed to be the same, a fact confirmed by typical GLT specifications (Alstom, 2014). Annual ridership evolution estimates are given in Figure 7 (ADK Consulting Engineers S.A., 2011).

Ridership evolution estimates for Corridor B.
Revenues and Costs
A flat fare of 1.3 € per ride is used for the analysis; this fare level is the same with existing bus services in the city of Ioannina. Annual fares increase by 10% every 3 years, following common practice by the city’s bus operator. Costs include construction, rolling stock purchase and replacement, heavy and routine maintenance, and operations. With respect to construction, unit costs for LRTs typically vary between 10M € and 14M € per km (depending on whether a single or double track line is constructed). Athens LRT construction costs are used as reference values (Pyrgidis & Stathopoulos, 2004). For GLTs, costs are estimated to be significantly lower for the following reasons (ADK Consulting Engineers S.A., 2011): (a) Smaller guideways with fewer construction works are necessary as only a guide rail needs to be installed, (b) limited aesthetic changes along the guideway and the urban landscape are implemented, and (c) traction, signaling, and particularly utility relocation works require less effort (ADK Consulting Engineers S.A., 2011; Alstom, 2014). In this context, GLT construction unit cost is estimated between 3.5M and 4.5M € per km, for single and double track lines, respectively. Similarly, unit costs per vehicle are estimated to be 2,500,000 € for LRT and 2,200,000 € for GLT, respectively, while a fleet of 13 vehicles is required for peak operations with 10 min headways (including two reserve vehicles). Finally, based on experience from the Athens LRT system construction, the depot cost is assumed to be an additional 20% to the total fixed-route mode construction cost (Pyrgidis & Stathopoulos, 2004). It is noted that derived depot construction cost for GLTs was expected to be considerably lower for several reasons (and as such, the same 20% cost assumption was kept). First, access to LRT depots requires track and overhead wire construction. Alternatively, the depot must be located close to the LRT corridor, where land availability is scarce and land values are very high. On the contrary, as GLT vehicles can run without their guide rail and overhead wires (at least for deadheading distances), depots can be located in areas with lower land values, without the need for constructing an access corridor. Second, maintenance and parking space requirements for GLT vehicles are smaller, a fact confirmed by Alstom (2014).
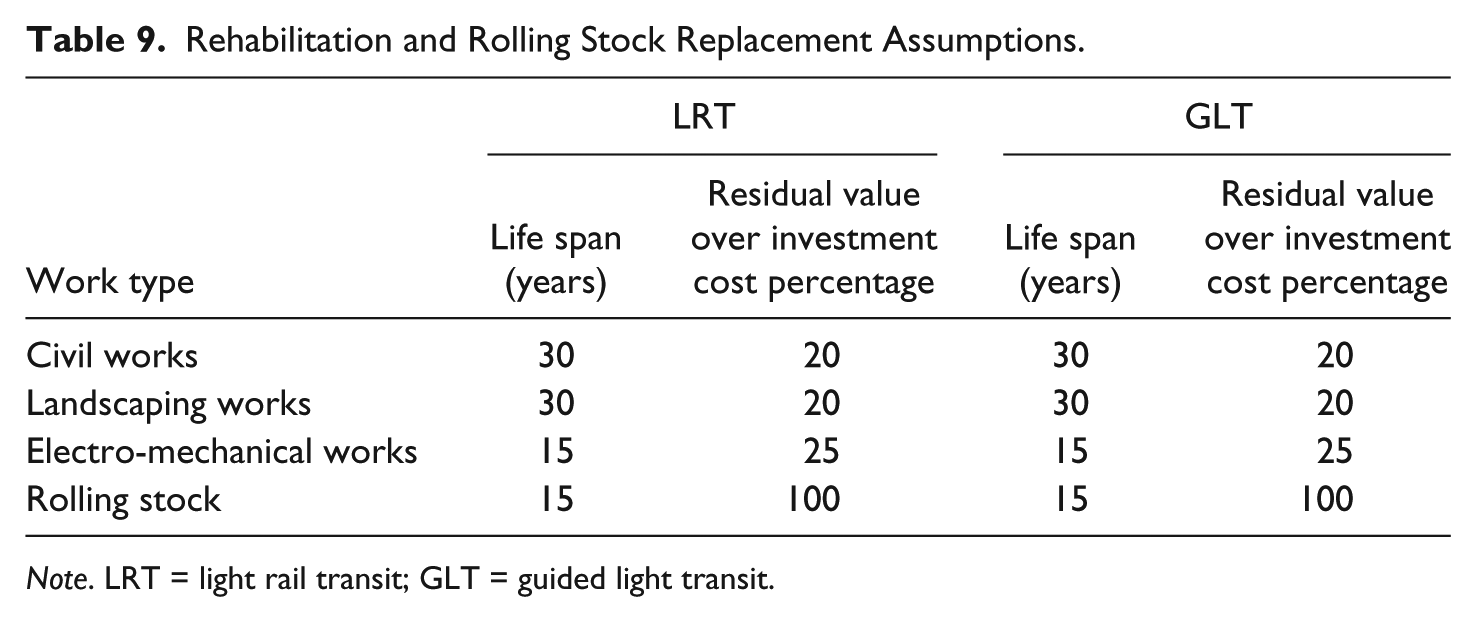
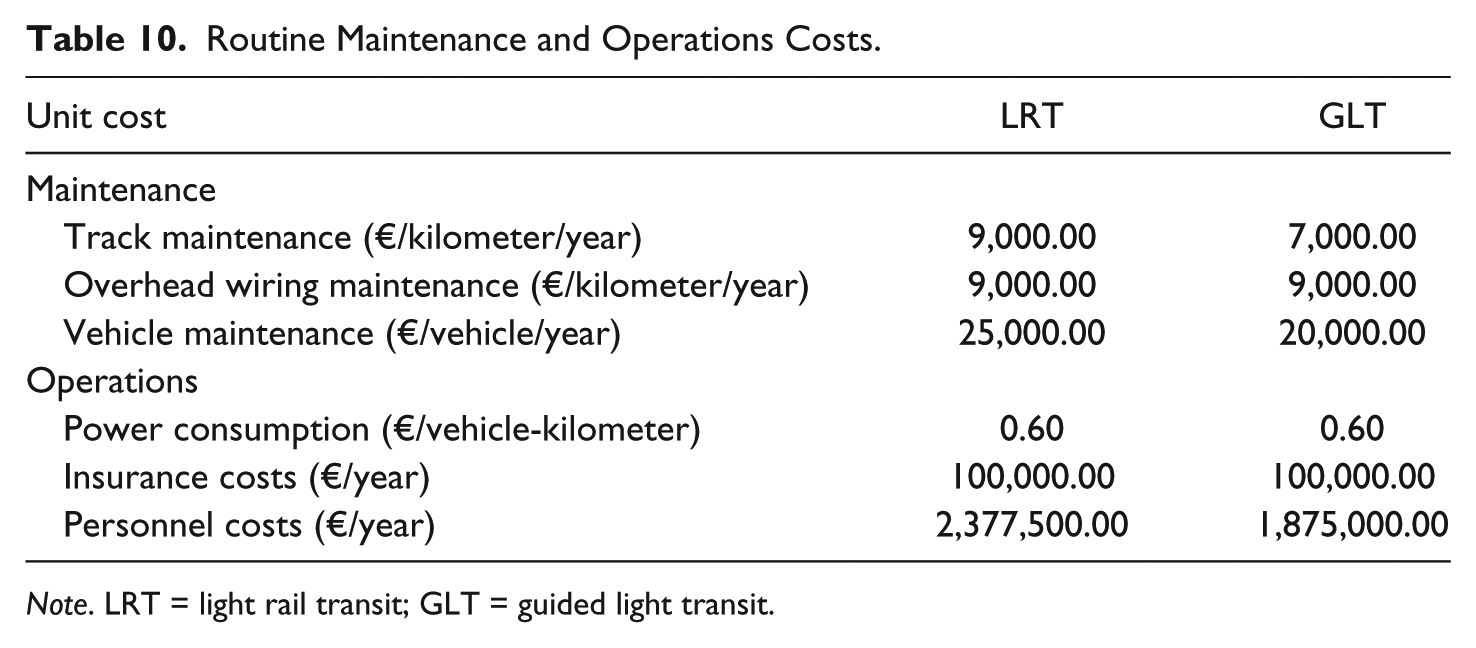
Table 8 summarizes unit costs for the two technologies, while Table 9 presents assumptions on remaining service life and vehicle replacement for a time horizon of 30 years. Per Table 9, civil works and landscaping are not expected to require any major rehabilitation within the 30-year time horizon (European Commission, 2006, 2008). However, power and signaling systems need to be rehabilitated once within that time span. Also, vehicle replacement will be made every 15 years (European Commission, 2006, 2008). Finally, unit costs for routine maintenance and operations are presented in Table 10—An annual increase of 1% is assumed for all maintenance and operations costs.
Unit Costs for LRT and GLT.

Note. LRT = light rail transit; GLT = guided light transit.
Rehabilitation and Rolling Stock Replacement Assumptions.
Note. LRT = light rail transit; GLT = guided light transit.
Routine Maintenance and Operations Costs.
Note. LRT = light rail transit; GLT = guided light transit.
With respect to Table 9 values, guideway, track, overhead wiring, and vehicle maintenance costs for LRT are drawn from actual data obtained from the Athens (Greece) LRT system. Track and vehicle maintenance costs for GLT are assumed to be lower compared with those of LRTs, based on the literature (Alstom, 2014). In the absence of reliable data on GLT power consumption, the same unit costs are used for LRTs and GLTs. Also, based on a preliminary analysis of personnel requirements for the two technologies, related costs are found to be slightly reduced for GLTs, mainly because of lower maintenance needs.
Using construction cost data drawn from Tables 7 to 9, the residual value of infrastructures and rolling stock for LRT and GLT is estimated to be 32,322,920 € and 16,676,233 €, respectively, at the end of the analysis time horizon.
Financial Analysis
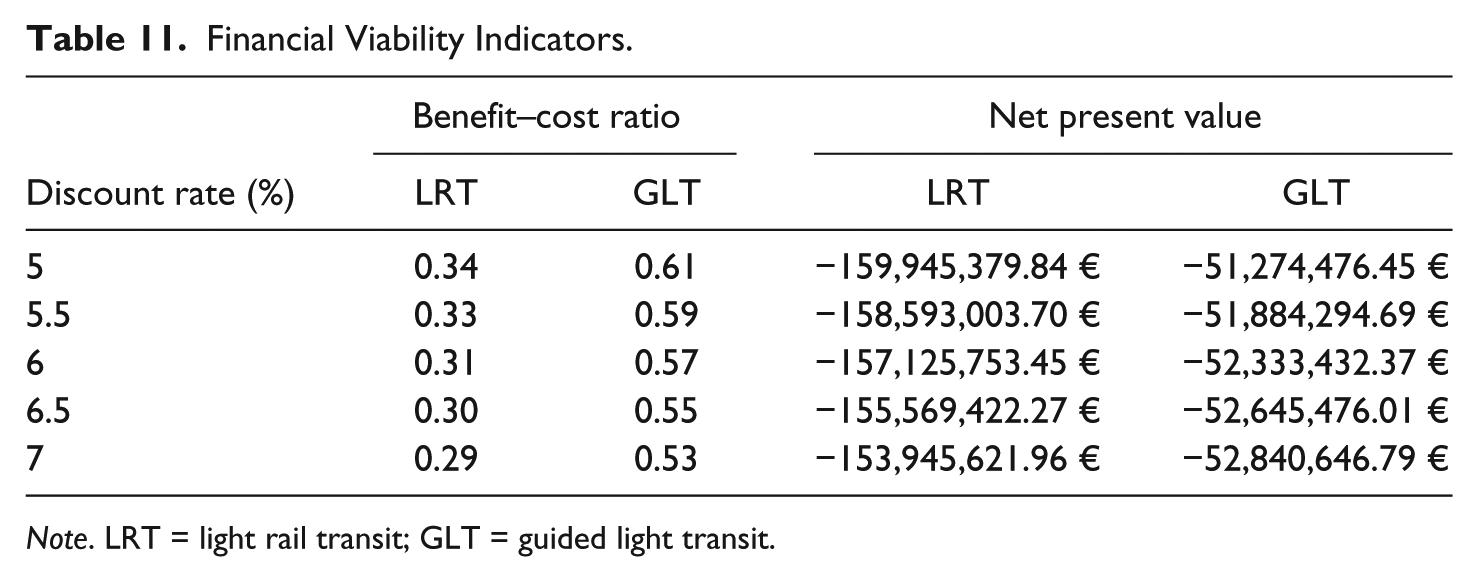
Cash flows for the two technologies are presented in Figure 8, while Table 11 summarizes financial return of investment indicators drawn (Net Present Value and Benefit–Cost Ratio) for the base (5.5%) and alternative discount rates. Benefit–cost ratio values under 1 and negative net present values indicate that a project is not financially viable, as system revenues cannot cover investment and operational expenses within the time horizon of the analysis.
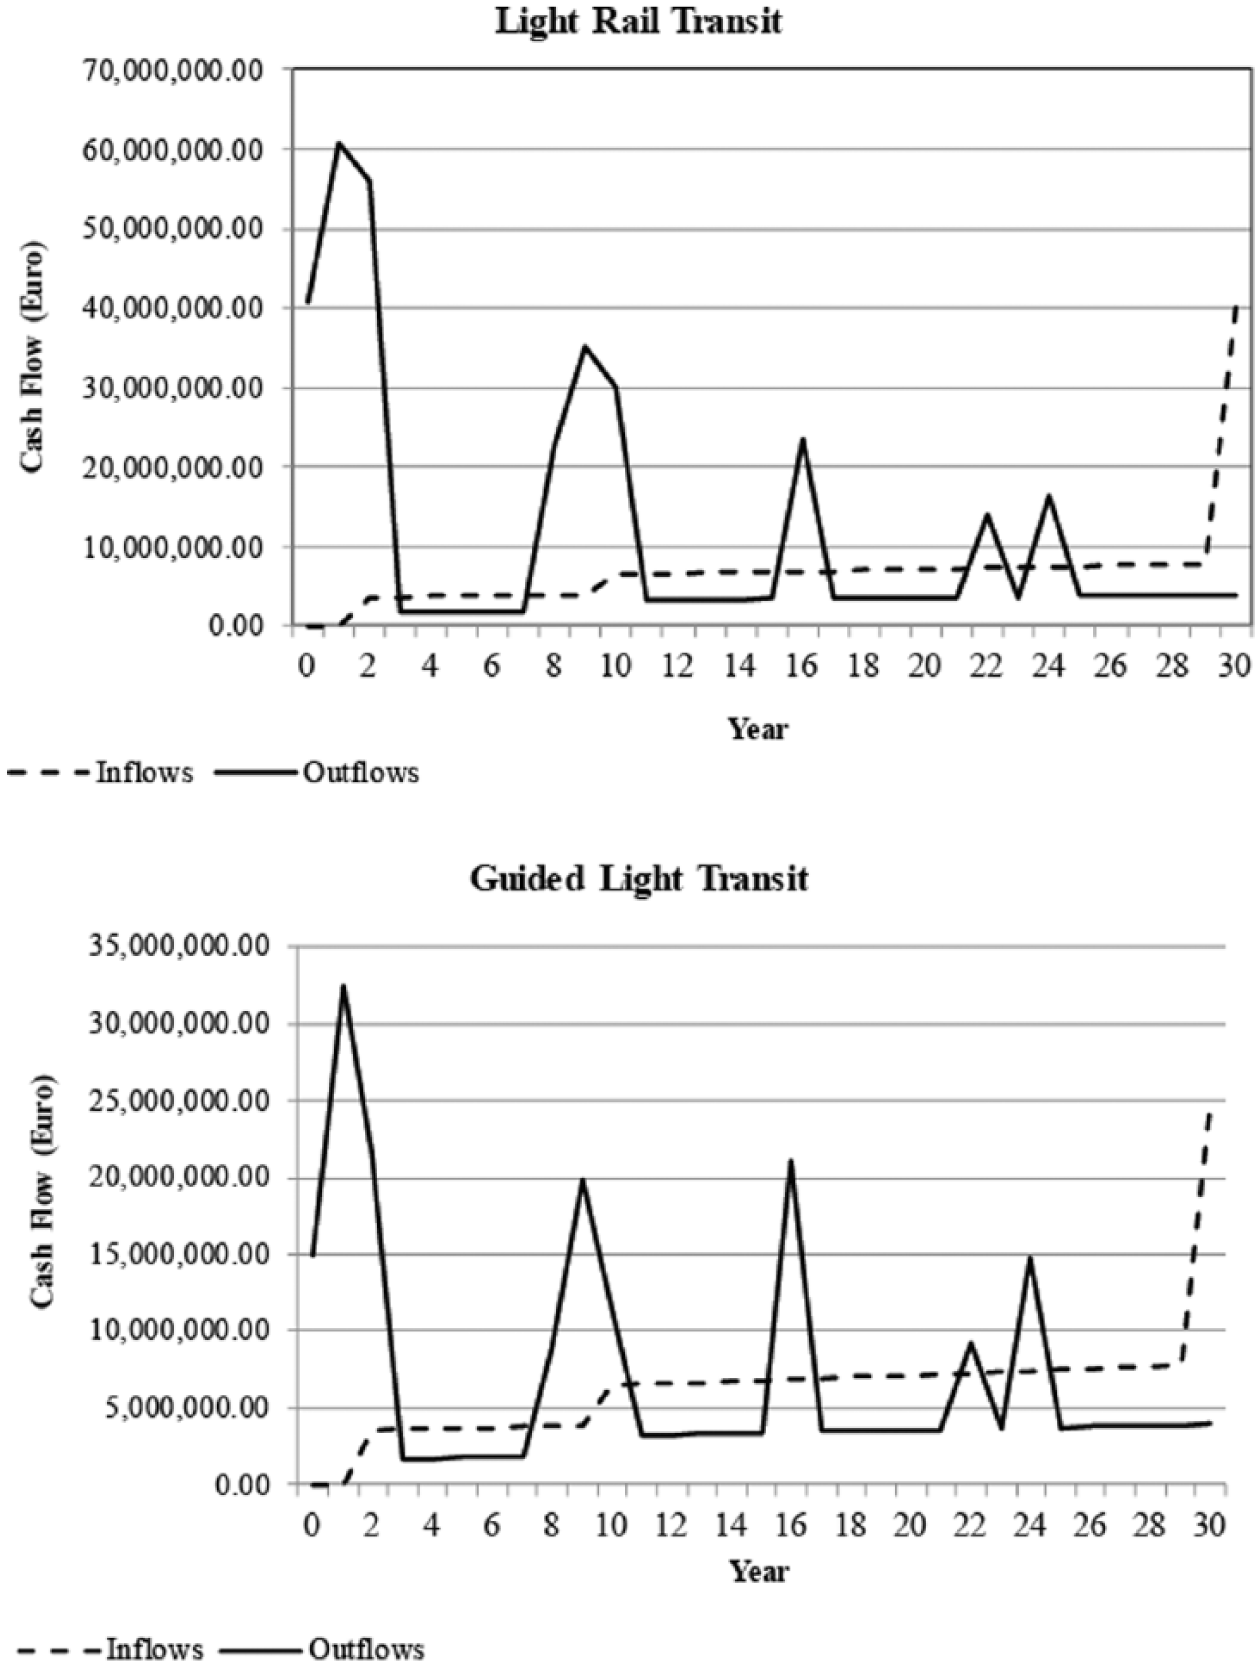
Cash flows for the LRT and GLT alternatives.
Financial Viability Indicators.
Note. LRT = light rail transit; GLT = guided light transit.
In detail, Table 11 results show that the financial performance of both technologies is poor; for LRT, the funding gap (net present value) is over 150M €, while for GLT, the gap is lower but still over 50M €. This is true even if higher discount rates are considered. These results imply that, per EU rules, funding by the European Union may be justified, if socio-economic benefits are derived by the project (i.e., “the project is worth funding”; European Commission, 2006). A sensitivity analysis of financial parameters reveals that financial results are heavily affected by construction costs and ridership estimates. Indeed, a 10% decrease in construction costs improves financial indicators by 13%, while if ridership increased by 10%, this would have a 5% positive impact in financial performance. On the contrary, operational and maintenance costs have a negligible impact to the financial performance for both technologies; a 10% change would only affect financial indicators by 0.5% to 1%.
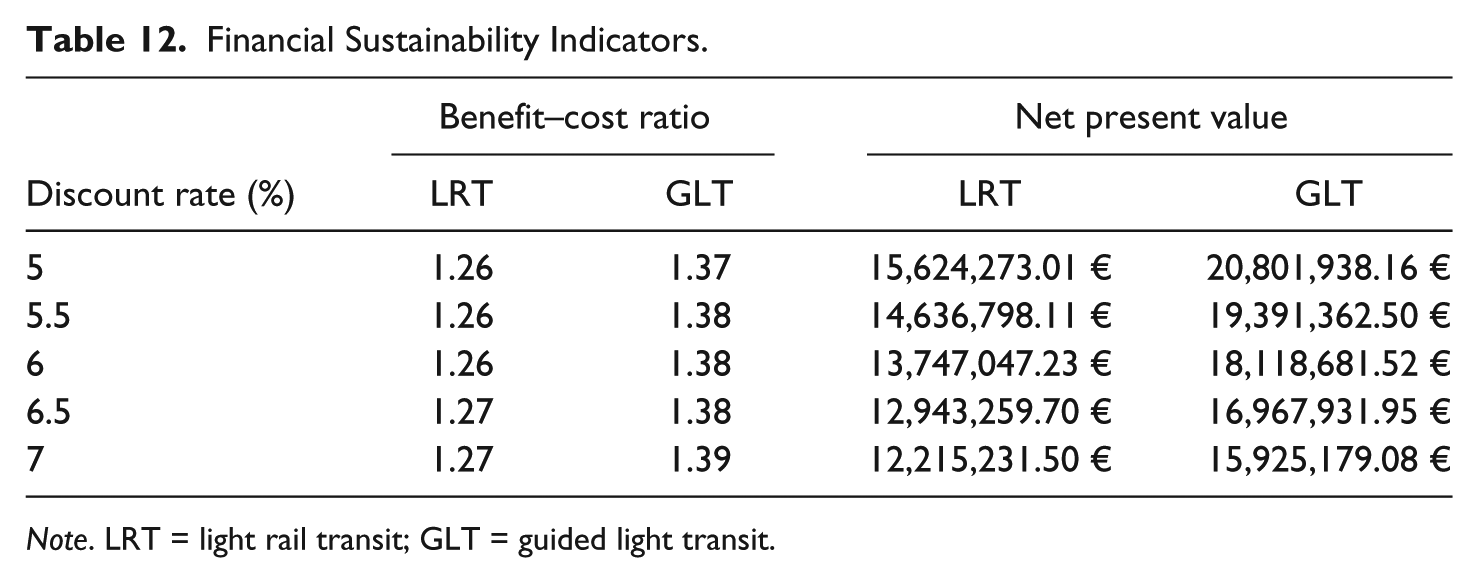
In addition to investigating the financial performance of the investment, it will be of interest to examine whether any of the two technologies is financially sustainable. Financial indicators in this case are presented in Table 12. As can be seen, both systems are financially sustainable, even when considering fleet replacement every 15 years as net present values are positive for the base and alternative discount rates considered.
Financial Sustainability Indicators.
Note. LRT = light rail transit; GLT = guided light transit.
Economic Analysis
The economic analysis focuses on examining whether any of the two technologies would yield benefits to the local community for the proposed corridor. As such, externalities in terms of social inflows (benefits) and costs (outflows) are introduced as part of a cost–benefit analysis. Differential social costs and benefits of LRT and GLT deployment over existing conditions (business as usual—no fixed-route mode deployment) are estimated.
In this context, social costs include those related to the construction, maintenance, and operations of the project. Per European Commission guidelines (European Commission, 2008, p. 59), accounting (shadow) prices are used for a project’s economic analysis “as they reflect opportunity costs and consumers’ willingness to pay for outputs.” Appropriate conversion factors are applied to market values, which are already derived as part of the financial analysis. These include unemployment, taxation, and insurance rates and refer to labor, material, and energy consumption. For a detailed estimation of these factors, the reader is referred to the related literature (European Commission, 2006). Social benefits include
The consumer surplus, which refers to gains by improving network travel time because of fixed-route mode operations.
The producer (government—operator) surplus, which is twofold: First, revenues expected by system operations, and second, government benefits from reduced (imported) fossil fuel consumption (attributed to lower traffic volumes) are considered.
Environmental and accident-related benefits again due to the reduction of traffic volumes; a fixed value of 0.192 €/vehicle-kilometer is used for that purpose (Baum, Geißler, Schneider, & Bühne, 2008).
For the problem at hand, these benefits are technology independent as the same service is expected to be provided. Indeed, lower passenger-hours and passenger-kilometers for Corridor B indicated in Table 3 yield gains in travel time, fuel consumption, and environmental and accident-related impacts. However, social costs for LRT are considerably higher compared with GLT, mainly because of the associated investment costs. This implies that social costs and associated economic performance in a medium-sized city is bound to be affected by the high investment cost.
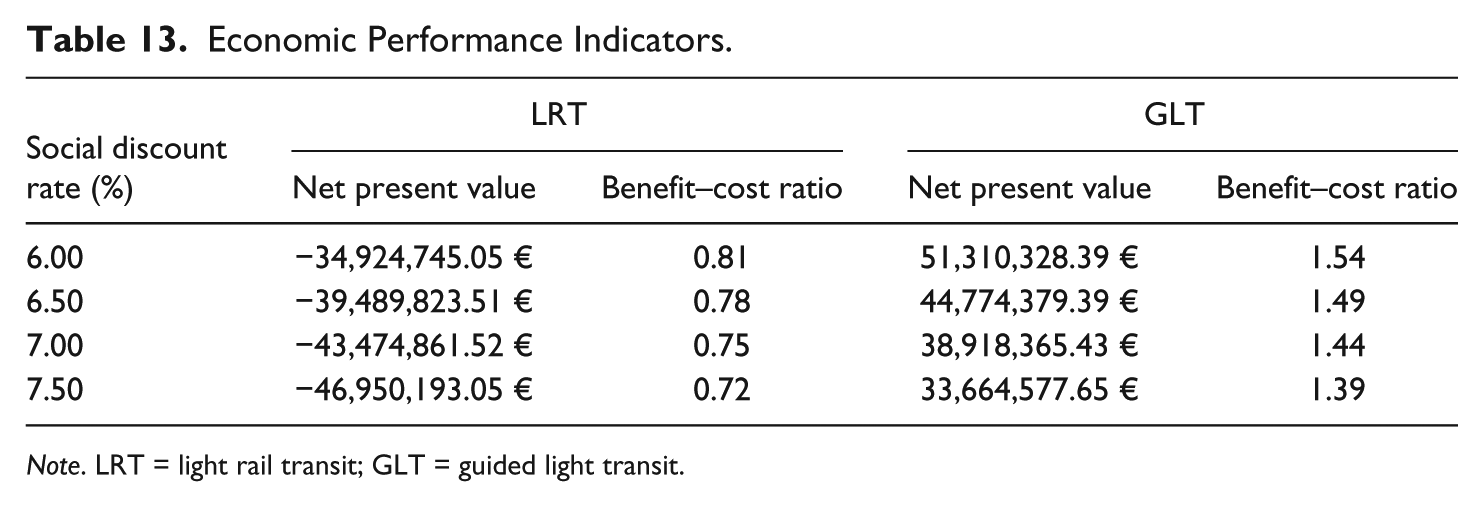
Table 13 summarizes economic performance indicators for the two technologies (net present value and benefit–cost ratio), for the base and alternative discount rates (again for illustrative purposes). Results show that only GLT may yield social benefits, a fact indeed attributed to its assumed lower implementation cost. The fact that LRT remains an expensive choice, even if claims on social benefits are put upfront, is also verified.
Economic Performance Indicators.
Note. LRT = light rail transit; GLT = guided light transit.
A sensitivity analysis of related parameters indicates that construction costs and ridership are major factors affecting socio-economic performance of the two technologies. Indeed, a 10% decrease in construction costs yields a 44.5% improvement in socio-economic performance indicators. Similarly, a 10% increase in ridership raises economic performance by almost 19%. It is again obvious that the high investment cost of introducing an LRT in a medium-sized city has a negative impact on any socio-economic benefits anticipated to be gained; even with a considerable modal shift toward public transportation, social costs would overwhelm benefits.
Discussion and Remarks
The financial and economic assessment of both technologies indicates that, while additional funding is required for projects of that size, high construction costs compromise socio-economic benefits. However, apart from a strict cost–benefit evaluation, some additional factors must be considered in the comparison process. For example, introduction of LRT requires extensive construction works for corridor and track development. These are difficult to abandon at a later stage. Furthermore, LRT corridors are usually followed by aesthetic improvements to the surrounding environment. As such, an LRT system becomes an integral part (and often a landmark) of a city and positively affects land values and uses.
GLTs are mostly proprietary technologies, offered by a few manufacturers worldwide. This implies that once a GLT system is introduced, options of using alternative equipment or rolling stock in the future are limited if non-existent. Furthermore, a handful of such systems has been deployed in cities worldwide and only in the recent years. As such, there is limited experience as for their actual performance and reliability, possible pitfalls, and so on. Finally, the limited extent of guideway infrastructures, and relative resemblance to buses, can make GLTs less attractive to the community. These facts are additional, non-quantifiable parameters expected to be considered in the selection process.
Conclusion
Light rail systems are the backbone of transit networks in many medium-sized cities around the world. However, in an era of limited funds, high investment costs are often prohibitive for their introduction. GLT may offer a lower cost, fixed-route oriented alternative. In this context, this article offered a structured comparison of implementing LRT and GLT technologies in a medium-sized city, by considering corridor, financial, and economic impacts of each alternative technology. Results indicate that LRTs yield inadequate socio-economic performance, mainly because of high investment costs. On the contrary, lower cost options such as GLTs can yield social benefits, a fact attributed to their lower implementation costs. Still, for both technologies external funding is required for supporting system financial viability. Finally, other, non-quantifiable factors such as the profile and flexibility associated with each technology should be considered in the selection process.
Footnotes
Acknowledgements
The authors express their gratitude to two anonymous referees, whose constructive comments helped in improving the manuscript.
Declaration of Conflicting Interests
The author(s) declared no potential conflicts of interest with respect to the research, authorship, and/or publication of this article.
Funding
The author(s) disclosed receipt of the following financial support for the research, authorship, and/or publication of this article: Part of this work was funded by the EU Funds Managing Authority of the Prefecture of Epirus, Greece.