
Abstract
Transportation agencies invest billions of dollars every year in resurfacing roadways, ostensibly to improve the travel experience. When locally funded, one justification for increased expenditure on the pavement surface is that it could increase property values. We evaluated this approach directly, using hedonic regression to estimate the relationship between pavement condition and residential property value in Solano County, California. We hypothesized that improving pavement condition would positively affect property values in two ways: directly as an indicator of neighborhood blight and indirectly through its effect on traffic conditions and noise. We estimated this relationship for the County as a whole and for each city within the County, controlling for spatial autocorrelation. The estimated relationship is small in magnitude and often not statistically significant. Although there are certainly reasons to improve pavement condition, our results suggest that increasing property value may not be one of them.
Introduction
Pavement management agencies spend a significant amount of public money every year to maintain roads and reduce the impacts of nuisances caused by pavement deterioration (Pellecuer, Assaf, & St-Jacques, 2014). Yet, U.S. roads continue to be in a state of disrepair, and there is substantial competition for these public dollars. If better roads are clearly associated with higher property values, this would provide evidence that the funds are materially contributing to community economic well-being. In this work, we investigate whether and how much road pavement condition influences the value of adjacent residential properties in cities and unincorporated areas of Solano County, California.
Many studies aim to estimate the impacts of environmental or nonmarket goods on human welfare. Multiple economic valuation methods have been developed to estimate these impacts, including contingent valuation models, travel cost models, and hedonic price models (Champ, Boyle, & Brown, 2003). In this study, we used the hedonic approach to estimate the influence of adjacent road pavement condition on residential property value. Hedonic price models use regression analysis to decompose the price of a good—such as a residential property—into the value of each of its characteristics. These characteristics include aspects such as home size and age, as well as characteristics of the surrounding area such as the pavement condition on the adjacent road.
We measure pavement quality (of roads, not sidewalks) using the pavement condition index (PCI). The PCI represents the structural and material integrity of a pavement in a numerical value (Gharaibeh, Zou, & Saliminejad, 2009). The PCI is expressed on a scale between 0 and 100, where a value of 100 represents the best possible condition (Shahin, Darter, & Kohn, 1978). Values between 85 and 100 indicate that roads are in very good condition; pavement is smooth and cracks—if there are any—are visible but not opened up. Values between 65 and 85 indicate roads with wider cracks and small holes, but driving on these roads is still a smooth ride. Values between 40 and 65 indicate alligator cracking, depressions, and surface roughness. Values below 40 indicate roads with many potholes, wide cracks, and temporary asphalt patches.
There are two ways that pavement condition might affect property values: directly as an indicator of neighborhood blight and indirectly through its effect on traffic conditions and noise, which in turn affects property values. We expect that both effects are in the same direction; as pavement condition declines, we expect property values to decline as well. Solano County Transportation Authority was interested in whether or not proposed increased investments in road condition improvements would result in increased residential property values. We find, however, that in Solano County there was not a consistent detectable relationship between residential property values and pavement condition.
The article proceeds as follows. First, we reflect on existing work in this area as it informs this study. Then, we describe the study area, data processing, and provide a detailed discussion of the PCI data itself. We then formulate our general regression model and present specific results for the selected models that can represent relationships between residential property values and PCI. We finish with a discussion and conclusions.
Literature Review
In this section, we review existing work that relates to this study. To the best of our knowledge, there is no existing peer-reviewed study that directly estimates the relationship between pavement condition and property values. Our work is the first. Thus, we review the closely related literature, including early hedonic studies that included presence of paved roads, the relationship between pavement condition and traffic noise, the impact of traffic volumes and associated noise on residential property values, and the impact of traffic emissions and noise on health.
Hedonic Price Models
Hedonic regression models estimate the economic value of nonmarket goods by separating the total value of the good (e.g., real estate)—for which a market price is known—into the value of each of its characteristics, including “nonmarket” characteristics. Hedonic regression models typically use property sales prices as the dependent variable. Explanatory variables include characteristics of the properties (e.g., lot size, living area size, number of rooms, number of stories, age of building), the neighborhoods where they are located (e.g., median household income, population density, proximity of neighborhood park, or open space), and the location of that neighborhood within a larger region (e.g., school district, distance to the central business district, proximity of transportation infrastructure).
Variation in the location of real property relative to environmental amenities (“benefits,” that is, local parks, schools, or transportation accessibility) or disamenities (“negative impacts,” that is, noise, crime, pollution, or neighborhood blight) provide the information needed to estimate the impact of those amenities and disamenities on the property’s value. The existing literature generally supports the hypothesis that neighborhood amenities—including high-quality transportation infrastructure—have a positive influence on property values (e.g., Bateman, Day, Lake, & Lovett, 2001; Boyle & Kiel, 2001; Salon, Wu & Shewmake, 2014; Seo, Golub, & Kuby, 2014; Shultz & King, 2001), and that disamenities have a negative impact (e.g., Hite, Chern, Hitzhusen, & Randall, 2001; Li & Saphores, 2012; Nelson, 1982). However, as there are no predetermined characteristics that are suitable for all hedonic models, knowledge of the local property markets and prior empirical studies are essential to define potentially important factors (Champ et al., 2003). Especially important is how the explanatory variables of interest (i.e., PCI in this study) are measured.
Hedonic Studies That Include the Presence of Paved Roads
Using data from the 1970s and 1980s, a number of prominent hedonic price model studies of urban property values included a variable indicating whether the road adjacent to a property was paved. Results based on the earlier data suggested a statistically significant and sizable effect (Edmonds, 1985), whereas studies using the more recent data did not (Rasmussen & Zuehlke, 1990; Zuehlke, 1987). Our study follows this line of thinking directly, focused on how differences in the quality of paved roads adjacent to a property might affect value.
Relationship Between Pavement Condition and Traffic Noise
Many studies have investigated the impact of traffic noise on property values (e.g., Bateman et al., 2001; Nelson, 1978, 1982). Traffic noise closely relates to the pavement condition because one of the two main components of traffic noise is the friction between vehicle tires and the paved road surface (the other is vehicle powertrain operation; Mun, Cho, & Choi, 2007). This friction increases when pavements deteriorate, and there is substantial evidence that traffic noise increases with declining pavement condition (Bendtsen, Lu, & Kohler, 2010; Donovan, Pierce, Lodico, Rochat, & Knauer, 2013; Donovan, Reyff, & Pommerenck, 2012).
The PCI provides information about pavement aging by including measures of distress, levels of severity, and distress density. That said, it is important to note that pavement-related traffic noise is also influenced by factors such as pavement materials (i.e., asphalt concrete, Portland cement concrete, or rubberized asphalt concrete), pavement texture types (i.e., longitudinal or transverse tine), traffic volume, vehicle types (i.e., truck or passenger car), and vehicle speed (Mun et al., 2007).
Impact of Traffic Emissions and Traffic Noise on Health
One mechanism for connecting pavement condition to community impacts and conditions is through health impacts. These impacts could be from traffic noise or vehicle emissions. Traffic noise is connected with negative health outcomes, including increased incidence of hypertension and specific heart ailments (Lercher, Botteldooren, Widmann, Uhrner, & Kammeringer, 2011). This problem increases with age and is inversely related to education and income. “Noise annoyance” (reported annoyance because of noise) occurs at traffic noise levels as low as 40 dBA (Freitas, Mendonça, Santos, Murteira, & Ferreira, 2012) and has been proposed as an indicator for transportation planning (Cik, Fallast, & Fellendorf, 2012). Because of potential health impacts, noise annoyance, and disruption of sleep, certain countries have developed traffic noise level thresholds for use in assessing existing impacts and in planning roadway/highway expansions in open space and residential areas (e.g., 50-55 dBA in Denmark; Bendtsen, 2010; Bendtsen & Michelsen, 2012). It is likely that improved pavement condition could reduce both traffic noise and emissions, reducing the incidence of related health impacts.
Degraded pavement condition may lead to reduced speeds, and/or increased incidence of deceleration and acceleration, both of which could increase vehicle emissions (Zhang, Batterman, & Dion, 2011). Vehicle emissions are a primary source of air pollutants in urban and suburban areas (Transportation Research Board, 2002), and these emissions can contribute to a wide range of health impacts, from cardiovascular problems to adverse birth outcomes and diminished male fertility (World Health Organization, 2005). Indoor, residential air quality is related to distance from roads (Lawson et al., 2011), which means that health impacts from degraded air quality will be greatest near roads with heavy or congested traffic.
Relationship Between Traffic Volumes and Residential Property Value
The hedonic modeling literature includes many studies of the relationship between traffic volumes and property values (e.g., Kawamura & Mahajan, 2005; Larsen & Blair, 2014; Li & Saphores, 2012). The studies we reviewed found statistically significant and negative relationships between traffic volumes and single family residential property values in three distinct geographic contexts. Kawamura and Mahajan (2005) found a small magnitude relationship between property values and total traffic, night traffic, and peak hour traffic. They emphasized the importance of testing and controlling for spatial autocorrelation in hedonic price models, which we did. Li and Saphores (2012) focused on the impacts of truck traffic along highway links in Los Angeles, California, using a multiple distance band approach (i.e., within 100 m, 100-200 m, and 200-400 m) to identify impact zones. In contrast to Kawamura and Mahajan (2005), their results indicated that truck traffic had a substantial impact on property values, whereas total traffic did not. Most recently, Larsen and Blair (2014) estimated the difference in the effect of traffic on single family and multifamily residential housing values, finding that the effect of traffic was much larger—and in the opposite direction in some cases—for single family housing compared with multifamily housing.
Relationship Between Road Noise and Residential Property Value
The hedonic modeling literature also includes many studies of the traffic noise impact on property values (e.g., Bateman et al., 2001; Swoboda, Nega, & Timm, 2015; Vessali, 1996; Wilhelmsson, 2000). In fact, traffic noise near the highway network was the main focus of many of the first transportation-related hedonic studies. Nelson (1982) reviewed nine empirical hedonic studies focusing on the nuisance of traffic noise, finding that highway traffic noise had a negative impact on residential property values. Studies that included the traffic noise from arterial roads came to the same conclusion (e.g., Brandt & Maennig, 2011). One recent study that married locally weighted regression techniques with hedonic models found that while the relationship between traffic noise and property values was generally negative, it varied substantially over space and time (Swoboda et al., 2015).
The existing literature provides estimates of the relationships between property values and presence of paved roads, traffic volumes, and road noise. Our study adds to the hedonic price model literature with a focus on a new and related neighborhood characteristic—pavement quality.
Study Area and Data
Solano County, California, is located in the northeastern part of the San Francisco Bay Area and contains seven incorporated cities: Vallejo, Vacaville, Fairfield, Suisun City, Benicia, Dixon, and Rio Vista (see Figure 1). Solano County had a population of 413,344 in 2010 (U.S. Census Bureau, 2010) and 105,249 single family residential parcels in 2015 (Solano County Assessor, 2015). Interstate highway 80 and an Amtrak rail line traverse the County.
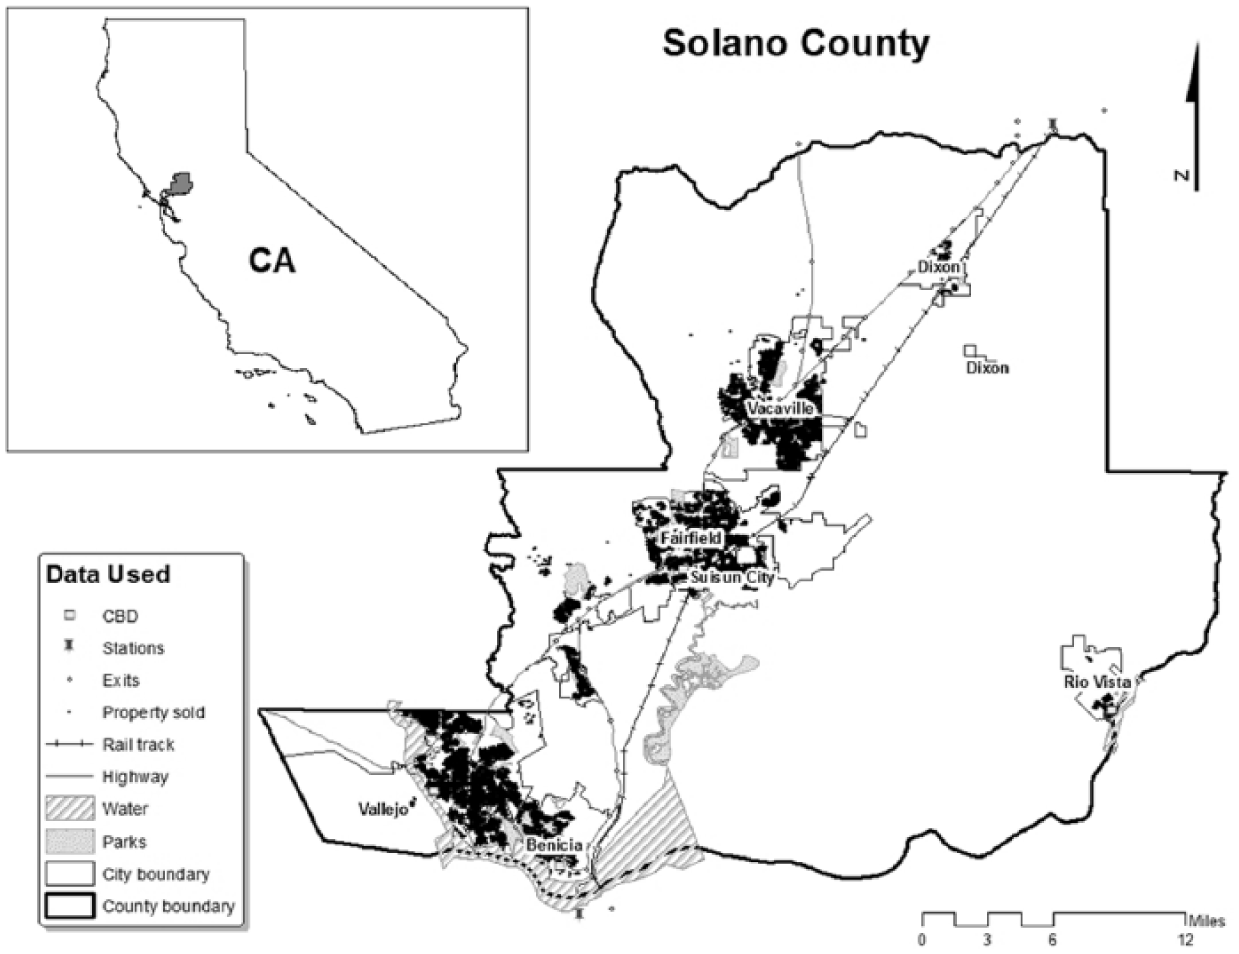
Study area and data used.
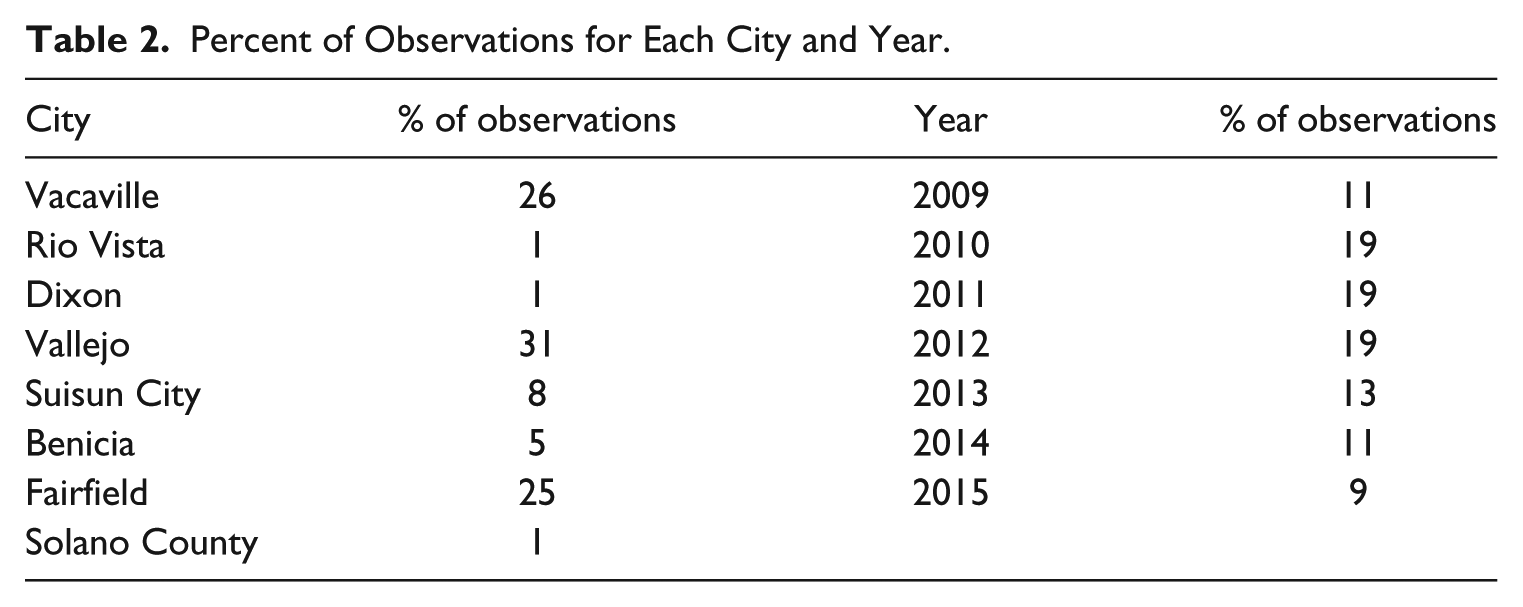
To conduct this analysis, it was necessary to obtain sales price, assessor-based single family parcel and home characteristics, and nearby road PCI values for all included properties. Our data come from multiple sources including the Solano County Assessor’s office (2015 parcel map, recent home sales), the Solano Transportation Authority (PCI from 2009 to 2015, and basic geographic information systems [GIS] layers), and ESRI web maps. Table 1 provides descriptive statistics for the main variables used in the analysis and Table 2 provides the percentage of observations in each city and year.
Descriptive Statistics (N = 19,608).
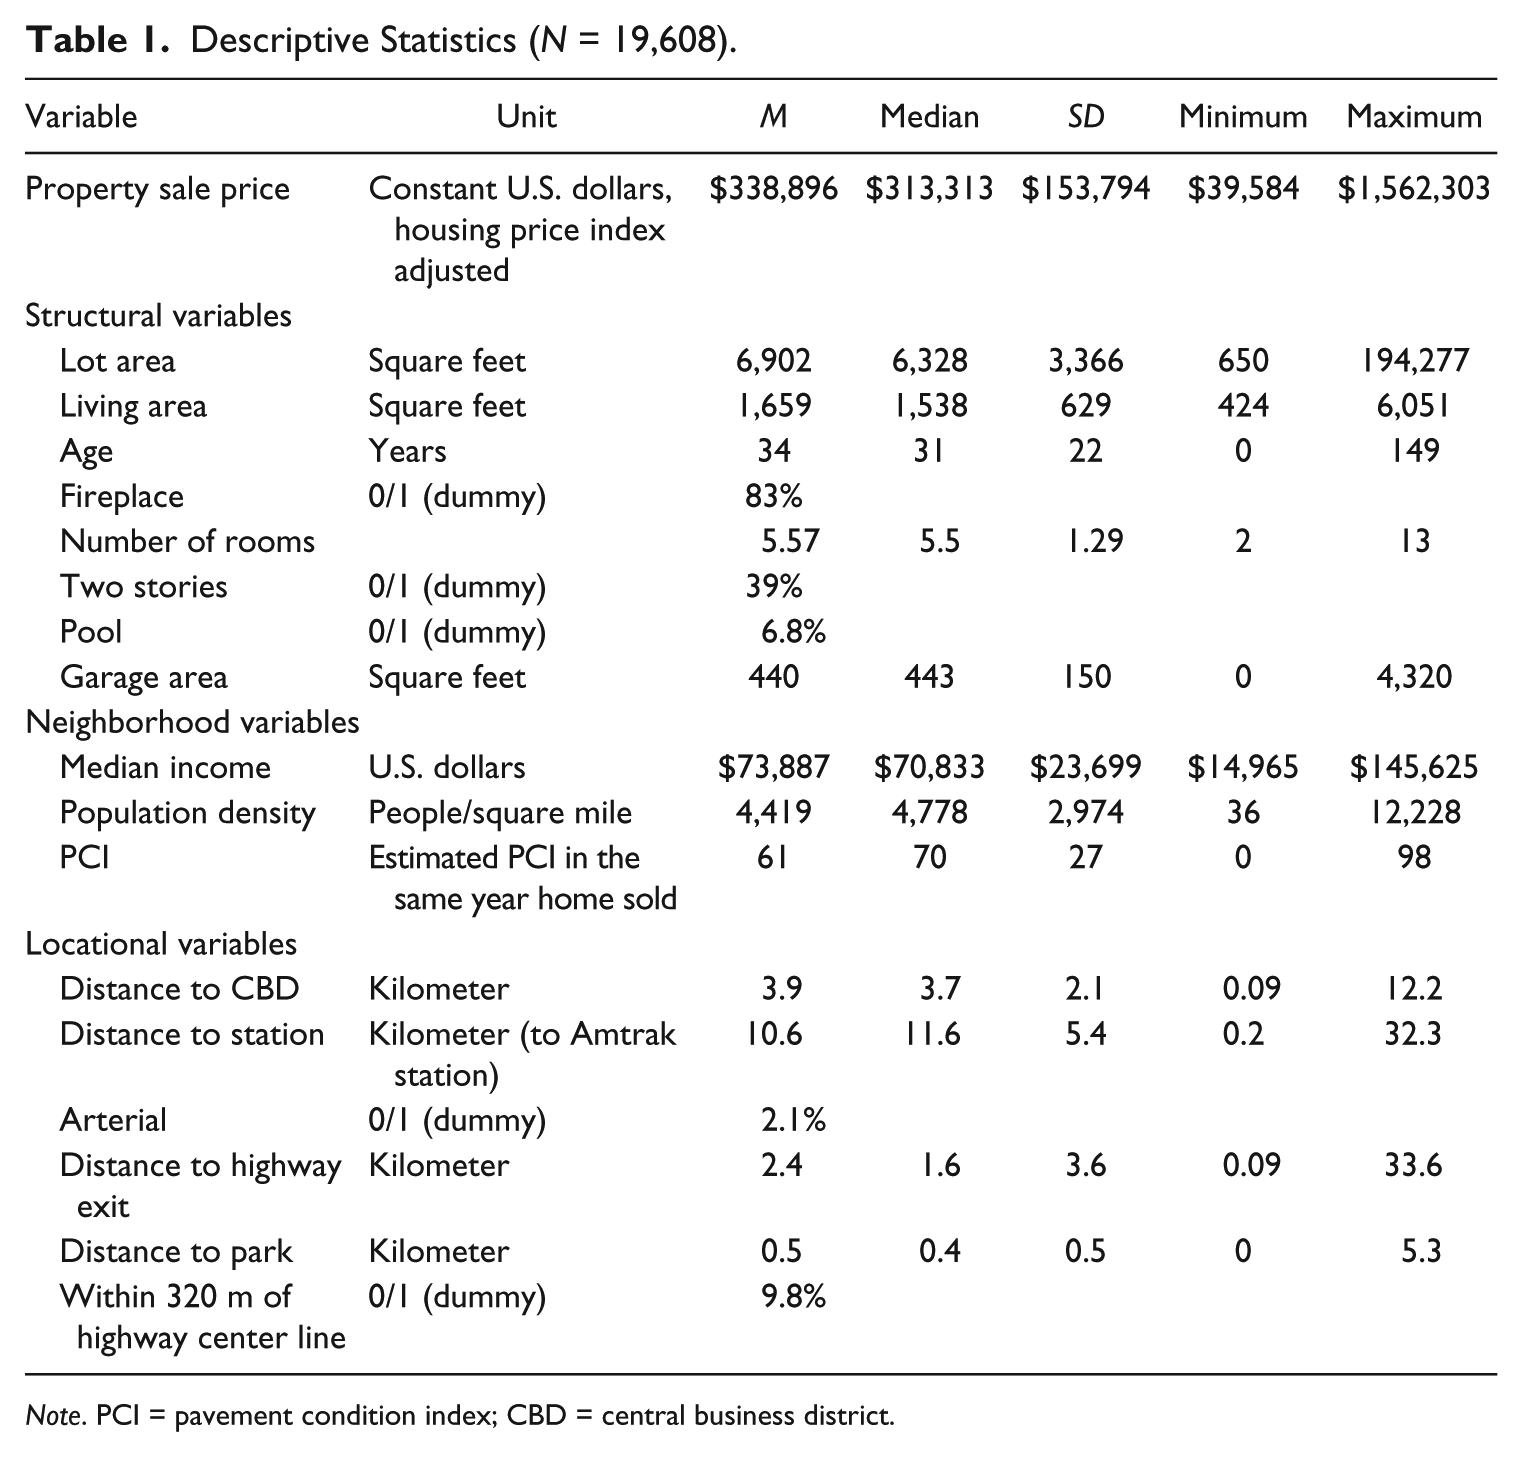
Note. PCI = pavement condition index; CBD = central business district.
Percent of Observations for Each City and Year.
For the dependent variable of residential property value, we used recent single family residential property sales records. The home price index for the San Francisco and San Jose area was then used to adjust the sale price to be in constant 2015 real estate dollars. This controls for the substantial volatility in the real estate market during our study period of 2009 to 2015.
Critical for this research, the County conducts surveys of road pavement condition at regular intervals. Larger roads are surveyed more often than residential streets. Estimated PCI values are available for the years between surveys based on a pavement deterioration model. We assigned PCI to adjacent properties by first creating a buffer around each road, and then performing a spatial join with the property sales point data. Corner lots could have two streets adjoining them. To represent the street conditions most influential on the property, we used the PCI value of the street that was closest to the centroid of the property. The distribution of PCI values in our final data set spanned nearly the full possible range of values with a minimum of 0 and a maximum of 98, but was somewhat skewed toward higher PCI with a mean of 61 and a median of 70.
In addition to these characteristics, tract-level population density and median household income from the U.S. Census Bureau were included as control neighborhood characteristics in the analysis. For the locational characteristics, we used the “near” function in ArcGIS to calculate the Euclidean distance between each property and the closest central business district (CBD), highway exit, highway link, rail station, rail track, airport, water, park, and landfill. Indicator variables for year and city were created using attributes from the property sales data and city boundary polygon feature class, respectively.
It is possible that highway traffic noise was differentially attenuated at fine scales by purpose-built noise walls/barriers, or adjacent buildings. Because we lacked spatial data about these attenuating factors, we considered highway traffic noise to be a function of distance, which was represented by the locational variable “Within 320 m of Highway Center Line.” Properties were presumed to be exposed to local traffic noise, which would be related to PCI.
Not all of the home sales data obtained from Solano County were used in this study. Specifically, some home sales observations were missing structural information about the property. For additional cases, the PCI values for the road segments adjacent to the property were unavailable. These observations were removed, leaving 19,608 observations available for modeling.
PCI Data Examination
Substantial effort was put into thoroughly examining the PCI data to understand the relationship between PCI and the other variables used in the hedonic models, and to diagnose inconsistent PCI coefficients (i.e., sign and statistical significance changes) in the results. The data included an estimated PCI value for road segments located immediately adjacent to the residential properties for each year from 2009 to 2015. These estimates were based on periodic field surveys of pavement condition. A pavement condition deterioration model was used to estimate PCI for each year between field surveys. The data also included the date and surveyed pavement condition value for the most recent PCI survey. In the remainder of this section, we highlight some data quality issues that we encountered when using these data.
First, surveyed PCI values may have measurement errors that could affect the results of hedonic regressions (Champ et al., 2003). An expert in evaluating the pavement condition of each road segment provided the PCI values in years when a road condition survey was done. The problem was that the same expert did not survey all of the roads in the County, leading to the possibility of inconsistency in surveyed PCI values. There has recently been a training program for pavement condition surveyors that aims to address this issue. However, the data we used span the period both before and after the training program.
Second, we found large changes in some PCI values between estimated values in one year and surveyed values in the next. In the case of large PCI increases, it would make sense that road maintenance and/or capital improvement operations substantially improved the pavement condition, and then a new pavement survey confirmed it (e.g., an estimated PCI of 37 in 2013 and a surveyed PCI of 100 in 2014). However, changes in the opposite direction (e.g., an estimated PCI of 65 in 2010 and a surveyed PCI of 27 in 2011) are problematic because there was no reasonable explanation for them, and one or both of those PCI values are likely to be far from correct. If the estimated PCI is incorrect in these cases, it casts doubt on all estimated PCI values in the data set. There are 891 cases in our data where PCI values decline sharply by more than 20 points from one year to the next, not including those cases where we know that the reason is a new PCI survey.
Because of uncertainty in consistency of estimated PCI values, we ran two regression models―one with the full data set including both estimated and surveyed PCI (19,608 cases) and another that was restricted to the PCI data resulting from field surveys—which were marked only for the most recent field survey—or likely field surveys for previous years. To identify likely field surveys, we identified cases where year-to-year increases occurred, and marked them as likely additional survey years. We also marked year-to-year drops of more than 7 PCI points as likely additional survey years. The sample size for homes sold in years when their adjacent roads were surveyed (or likely surveyed) included 5,121 cases.
Hedonic Price Model
To select the best functional form for the hedonic regression model, we first examined scatter plots between the dependent and explanatory variables. These scatter plots tell us whether the relationships between the variables are best represented by a linear or nonlinear function, such as the natural log. We also checked for multicollinearity among our explanatory variables using the variance inflation factor (VIF) method. Based on these tests, we removed a number of collinear locational characteristics from the model (proximity to airports, landfill sites, and transit hubs). The remaining included variables had VIF values below 5, with the exception of the city indicator variables.
We tested for spatial autocorrelation among observations. When residential property values exhibit spatial autocorrelation, a hedonic model will generate inconsistent estimates. The presence of spatial autocorrelation in the error term produces inefficient parameter estimates (LeSage & Pace, 2009). We used standard spatial econometrics methods, testing for spatial autocorrelation in both the dependent variable and the error term. The test results confirmed that spatial autocorrelation only existed in the error term. Thus, we employed the spatial error model for the final regression analysis, which controls for spatial autocorrelation in the error term.
The functional form for our models is expressed in Equation 1, which indicates our three types of independent variables and the spatial error specification. Many of our included independent variables are also log transformed.
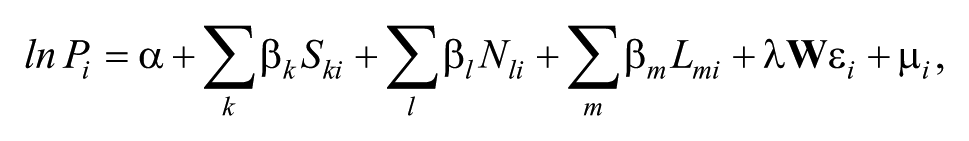
where
Results
Our overarching result is that we do not find a consistent relationship between pavement condition and residential property values in Solano County between 2009 and 2015. Here, we provide details of our econometric model results, first for a model estimated using data from the entire County, and then for models based on subsets of that data. The specific data subsets we present here are the subset of properties for which the adjacent road had a surveyed (vs. estimated) PCI value, and subsets for each incorporated city in the County. Estimations based on data from the entire County produced statistically insignificant results for the PCI-home price relationship. City-level models produced mixed results.
In addition to the models detailed in this article, we investigated a wide range of alternative statistical model structures. Estimating the model using data levels rather than natural logarithms did not change the results. Estimates for high- and low-price subsamples of homes provide similar results. Representing PCI using binary indicators for low versus high PCI levels did not change the results. Separate estimates for the home sale period from 2009 to 2011 and 2012 to 2015 provide mixed results—a small positive relationship between PCI and sales prices for the earlier period and a small negative relationship for the later period.
Finally, we note that PCI of the adjacent road is correlated with the age of the home. The correlation coefficient is −0.5; despite VIF values indicating that there is not a multicollinearity problem in the model, this correlation is large enough to warrant further investigation. Removing home age is not an option because home age is clearly and strongly associated with home price. Instead, we tested adding interactions between home age (converted into categories) and PCI to the model. Average marginal effects estimated for four home age categories indicated that PCI had a negative relationship with home price for homes older than 50 years, a positive relationship with home price for homes between 11 and 24 years of age, and no effect for the newest homes or the homes built 25 to 50 years ago. Similar to our mixed results by city, these mixed results suggest that something else is going on; pavement condition does not have a consistent positive effect on home values as hypothesized.
All Properties
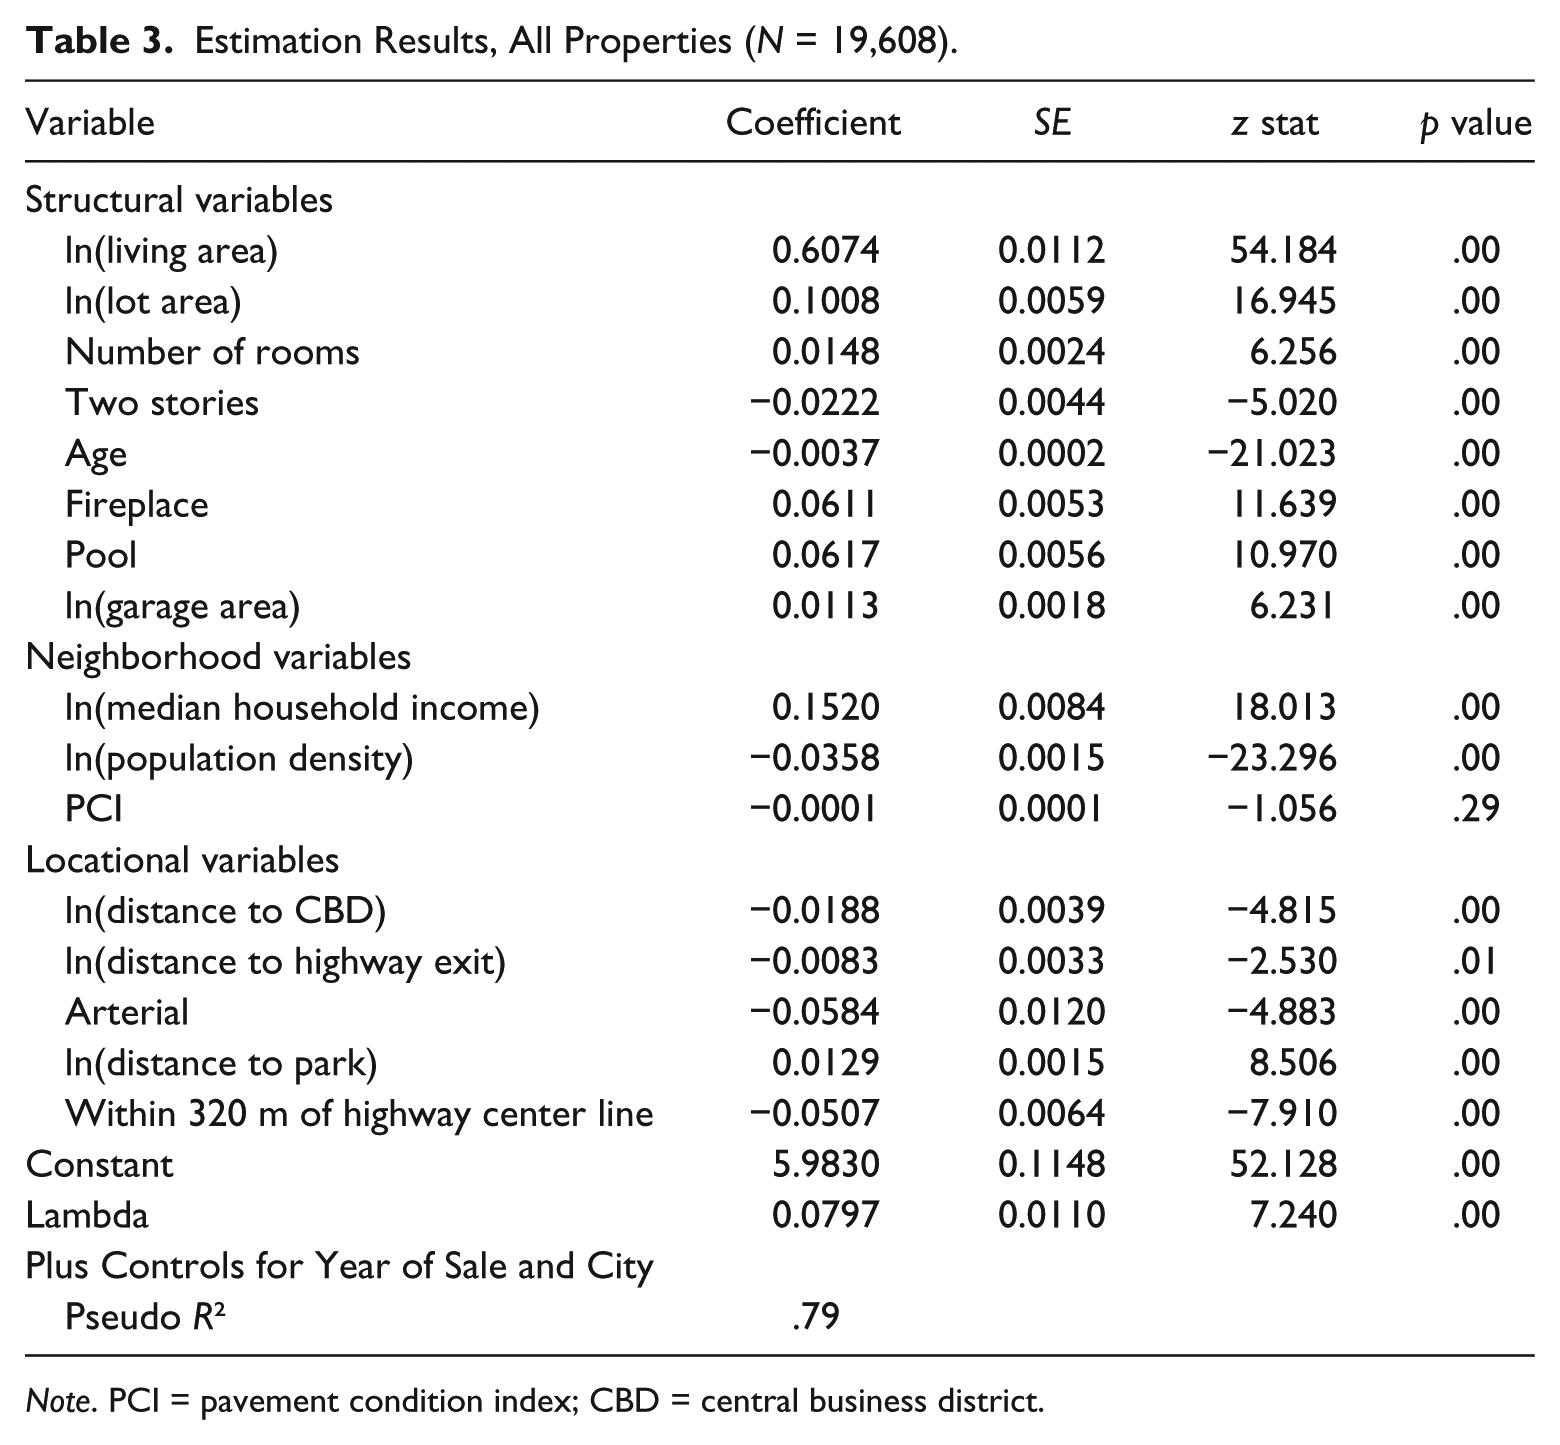
Initial regression analysis was performed using StataSE 12 to determine the best model, and GeoDaSpace was used for the final regressions, correcting for spatial dependence. Lagrange Multiplier tests for spatial dependence in the dependent variable and in the error term confirmed spatial dependence only in the error term. In addition, a Koenker–Bassett test confirmed spatial heterogeneity in the data. Thus, we applied a spatial error model with heterogeneity option. Table 3 shows the coefficients, standard errors, z statistics, and significance for this model. The resulting model fit is strong with a pseudo R2 of .79.
Estimation Results, All Properties (N = 19,608).
Note. PCI = pavement condition index; CBD = central business district.
The structural explanatory variables are all statistically significant and their coefficient signs are as expected. For instance, number of stories and age of house are negatively related to the price, whereas other structural variables such as home square footage, lot size, number of rooms, presence of a fireplace, presence of a pool, and square footage of garage are all positively related to price.
For neighborhood variables, median household income is positively associated with property value, whereas population density is negatively associated with property value. The signs of both estimated coefficients are as expected.
The locational variables are also statistically significant, and most coefficients have the expected signs. Locations farther from the CBD or from highway exits, which represents the accessibility of jobs and transportation, are negatively associated with the property values. Being adjacent to an arterial road is negatively associated with property values. Unexpectedly, locations farther from parks are positively associated with property values.
The estimated coefficient of PCI, the variable of the greatest interest, is both statistically insignificant and extremely small. This means that using the full data set from Solano County, we cannot detect a relationship between residential property values and the pavement condition adjacent to the home. This initial null result led us to explore alternative ways to look at the data.
Properties With Surveyed PCI
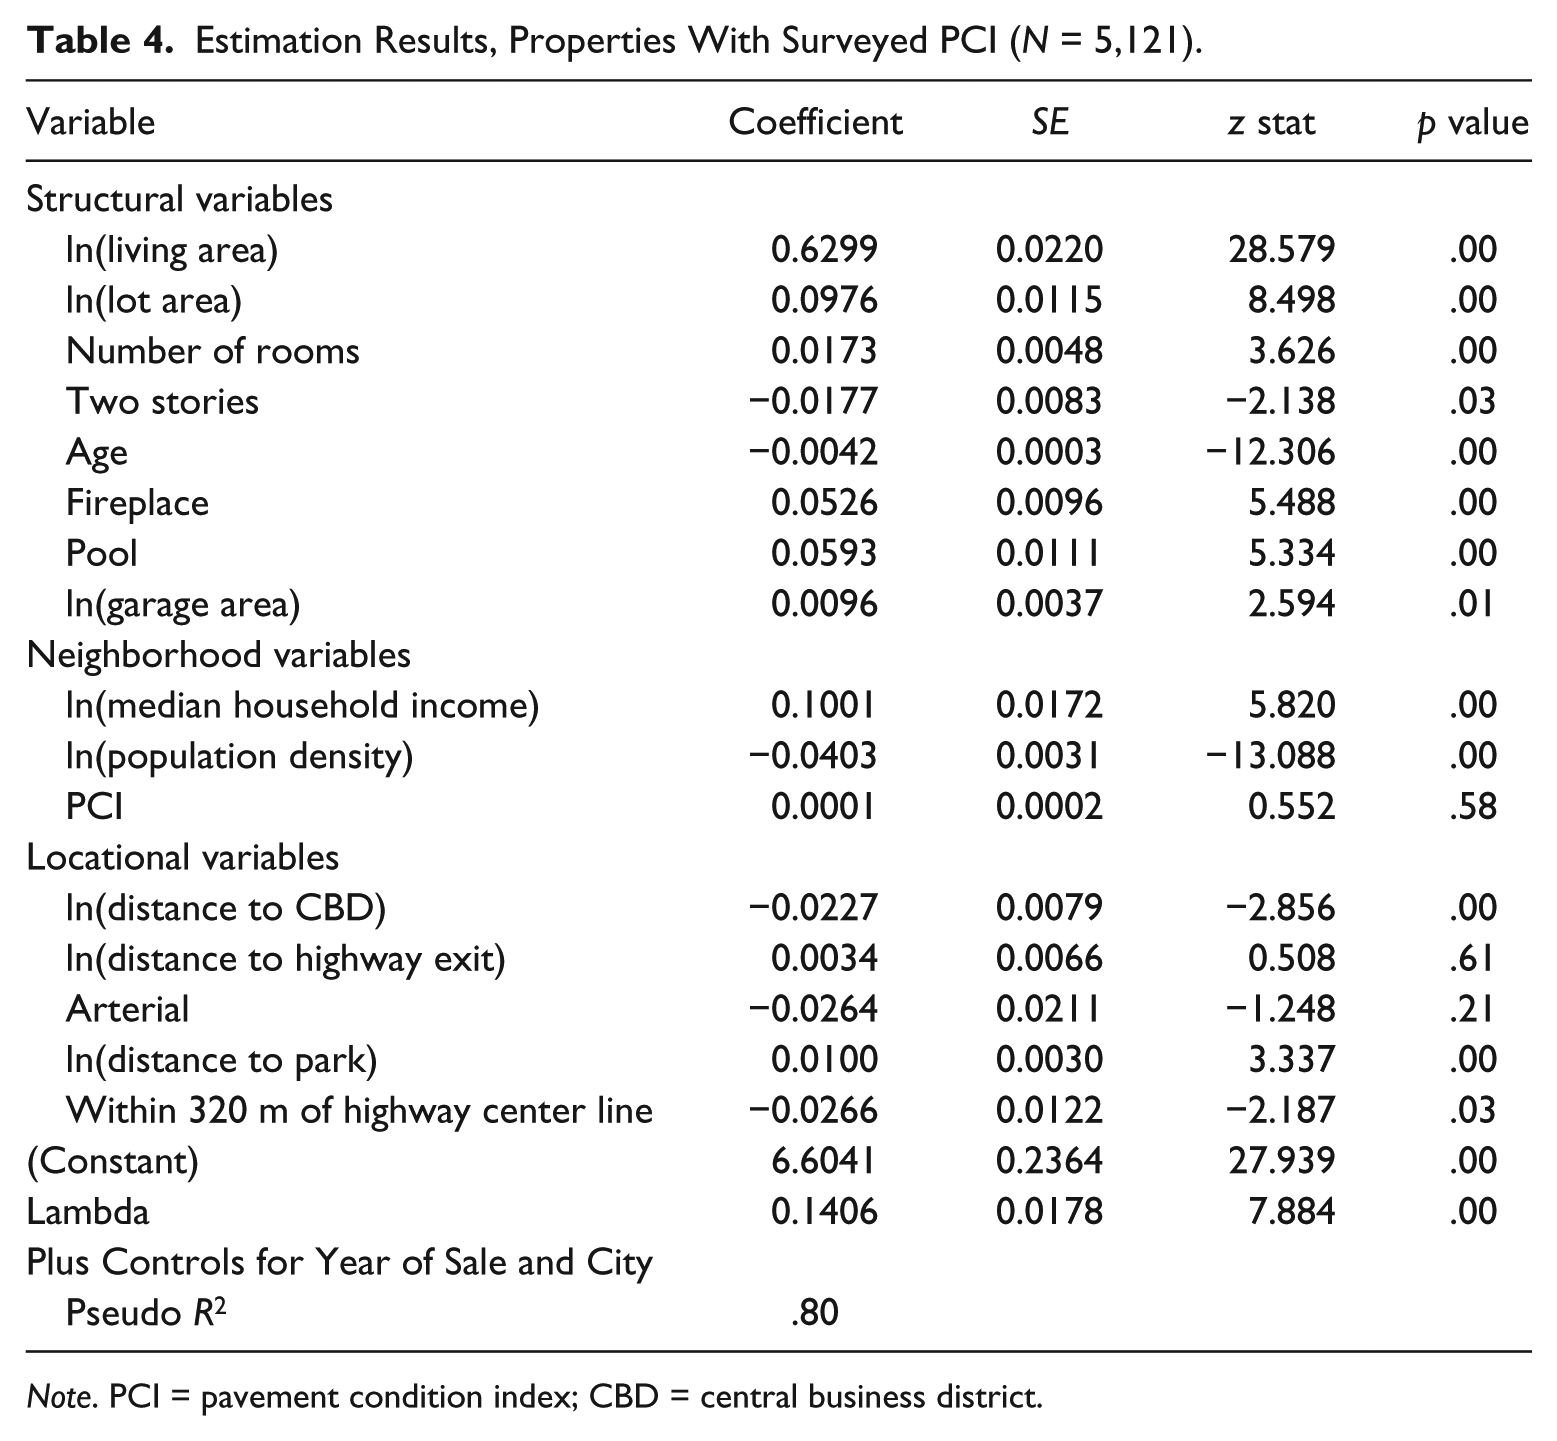
Because the estimated PCI may include errors due to the road deterioration prediction model over- or underestimating the true pavement condition, we estimated our model using the subset of home sales that occurred in a year when PCI was surveyed on the road adjacent to the home. This subsample includes both home sales that occurred in the year when the PCI was most recently surveyed—as listed in the data set—as well as home sales that occurred in a year for which we presume that the PCI must have been surveyed—based on the year-to-year patterns of estimated PCI values. Like the full sample, spatial autocorrelation for the error term was detected in this subsample, confirmed by the Lagrange Multiplier test. A Koenker–Bassett test again confirmed the presence of heterogeneity in this subsample. Thus, we again estimated a spatial error model with the heterogeneity option using GeoDaSpace. Table 4 displays the results. The resulting model fit was strong with a pseudo R2 of .8.
Estimation Results, Properties With Surveyed PCI (N = 5,121).
Note. PCI = pavement condition index; CBD = central business district.
Overall, the results were not different from the all property model. Structural variables were all statistically significant and all coefficients’ signs were as expected. For the neighborhood variables, median household income was positively associated with property value and highly significant, whereas population density was negatively associated with property value and highly significant. Signs of both coefficients were as expected. For the locational variables, some variables lost statistical significance compared with the all property model. However, all signs were consistent with the all property model. The coefficient of PCI was again not statistically significant, from which we concluded that there was no detectable relationship between residential property values and pavement condition.
Properties in Each City
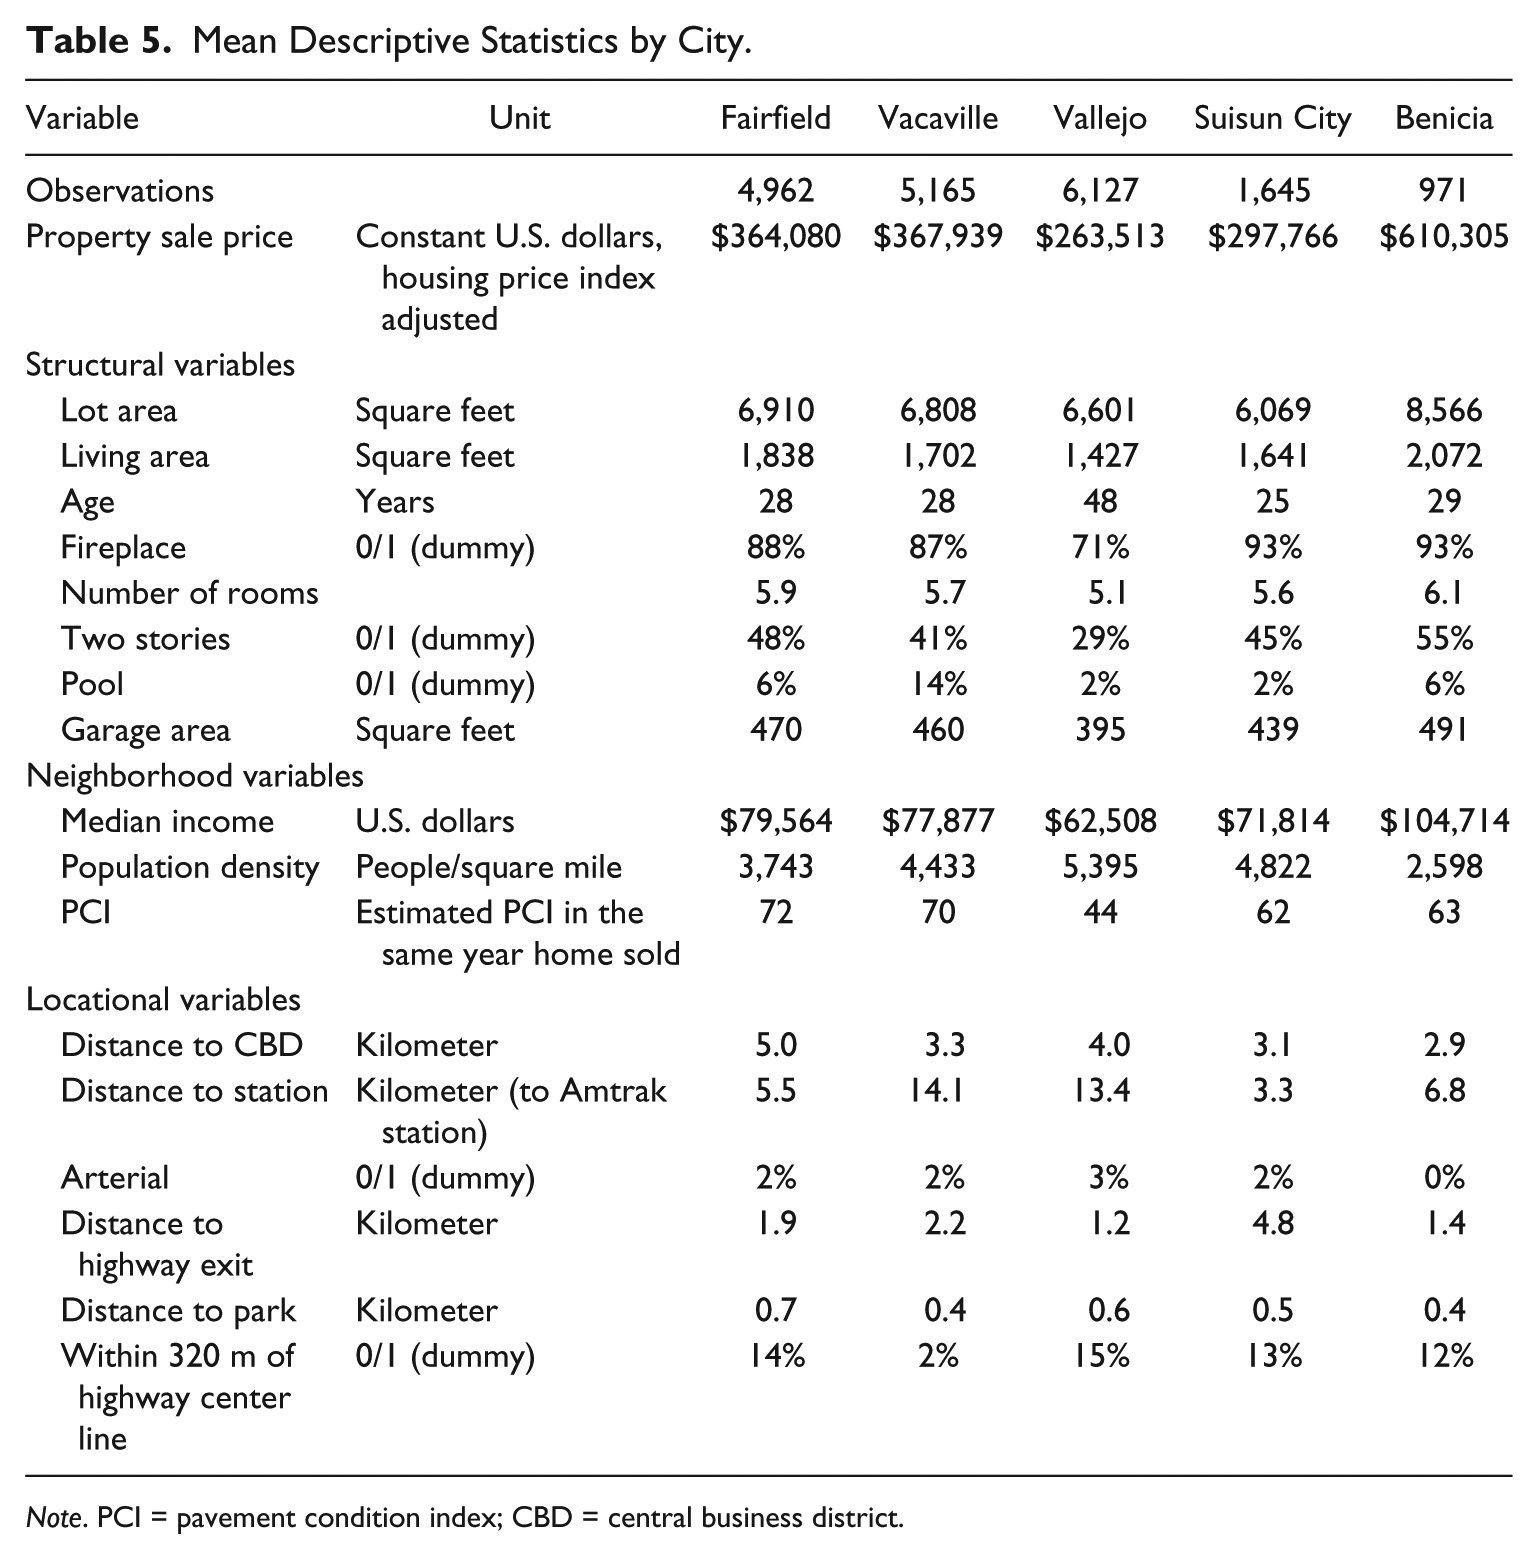
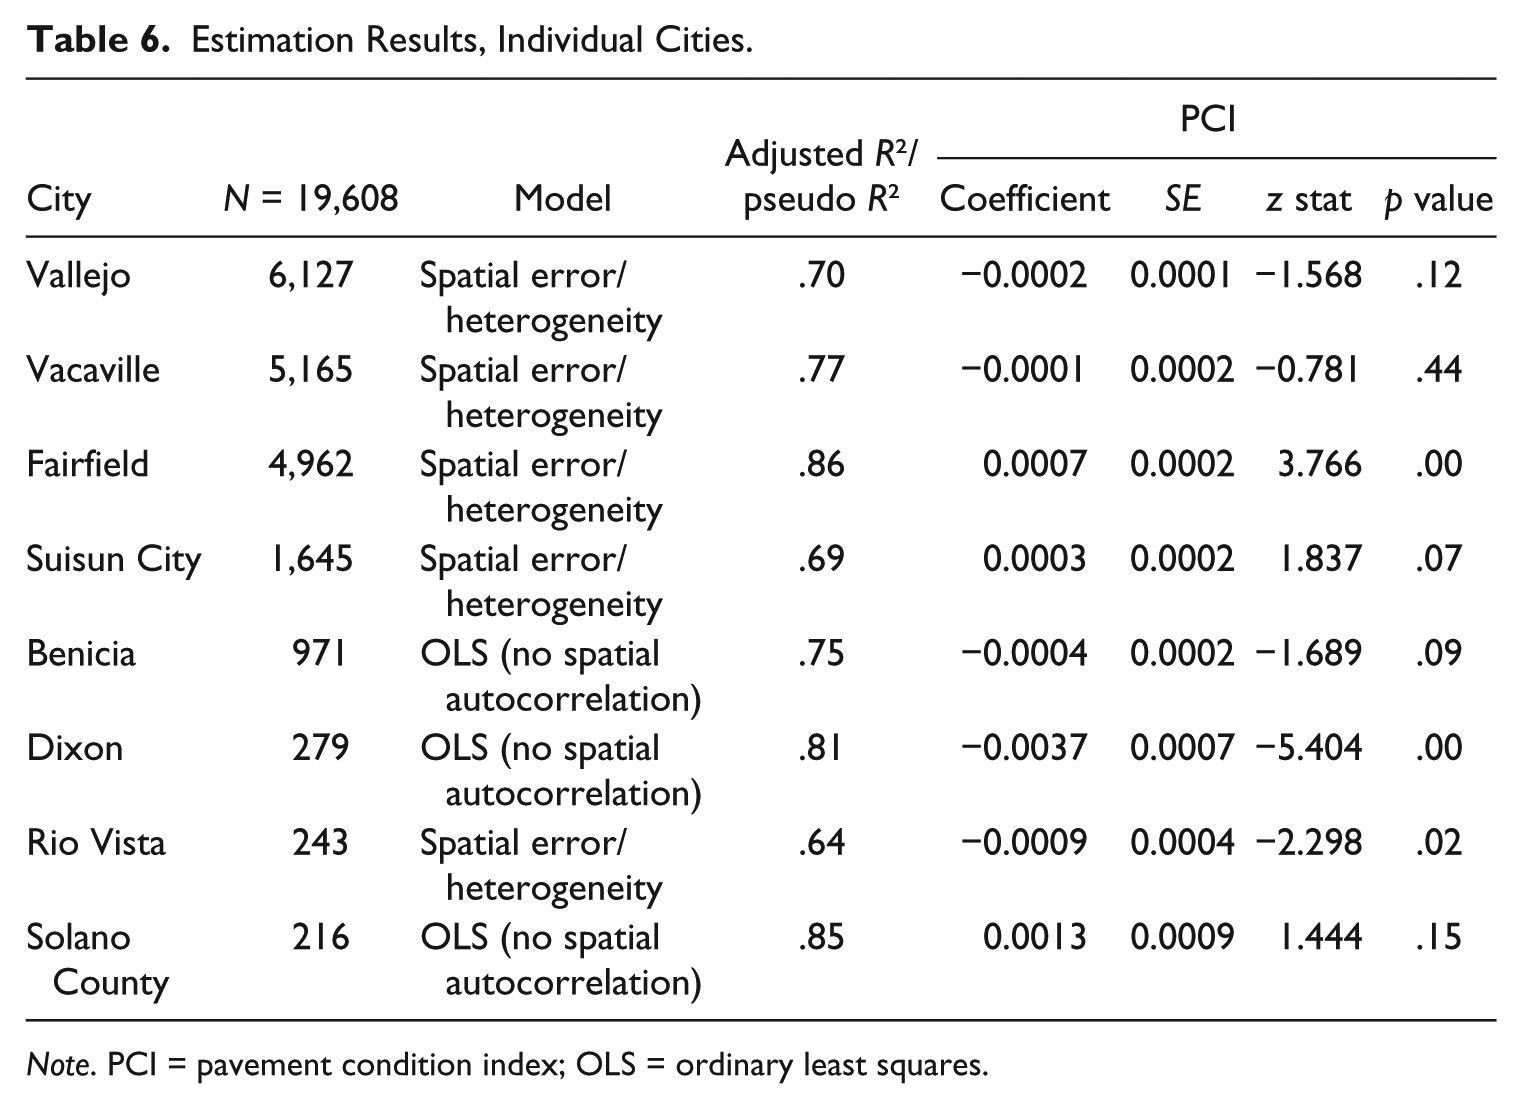
Tables 5 and 6 report descriptive statistics for the five largest cities and a summary of the results for all city-specific hedonic price models. Some cities such as Vallejo, Vacaville, Fairfield, Suisun City, and Rio Vista required the spatial error model with heterogeneity option, whereas other cities did not. The resulting model fits were generally strong, with goodness-of-fit statistics ranging from 0.64 to 0.86. The estimated relationship between PCI and property value differed by city. Consistent with the County-level models presented earlier, some city-level results from Vallejo, Vacaville, and Solano County were statistically insignificant. The relationships between PCI and price for Dixon and Rio Vista were negative and significant at the .01 and .05 level, respectively, while Fairfield’s was positive and highly significant at the .001 level. In Suisun City, the relationship between PCI and home values was positive and somewhat significant at the .1 level, whereas in Benicia the relationship between PCI and home values was negative and somewhat significant at the .1 level.
Mean Descriptive Statistics by City.
Note. PCI = pavement condition index; CBD = central business district.
Estimation Results, Individual Cities.
Note. PCI = pavement condition index; OLS = ordinary least squares.
Examination of the descriptive statistics indicates that there are substantial differences between the cities in the County. Benicia home prices are much higher than those in the rest of the County, for instance, and Vallejo has somewhat poorer residents, older homes, and particularly low pavement quality. Unfortunately, these differences do not provide much insight into why the association between PCI and home values might vary by city. The only city where this association is positive and statistically significant—as hypothesized—is Fairfield, and Fairfield is a rather average city in Solano County.
Discussion and Conclusion
Pavement condition can deteriorate over time, leading to cracks, pits, and bumps. Repaving is the primary municipal strategy to keep residential streets and arterials in adequate condition. One possible justification for increased public spending on road improvements is the increased residential and/or commercial property value resulting in treated areas. Theoretically, there are two ways that pavement condition might affect property values: directly as an indicator of neighborhood blight and indirectly through its effect on traffic conditions and noise, which in turn affect property values. Both effects are expected to be in the same direction; as pavement condition declines, property values are expected to decline as well.
We estimated the relationship between pavement condition and residential property value in Solano County, California. To our knowledge, this is the first peer-reviewed study to estimate this relationship. Because substantial public resources are spent on maintaining pavement quality, understanding the relationship between pavement quality and property values could be important.
Our results are based on 19,608 single family home sales between 2009 and 2015. Because the period from 2009 to 2015 was one of substantial movement in the real estate market, the sale prices were adjusted using a home price index developed for the San Francisco Bay Area. Detailed characteristics of these properties and their neighborhoods were assembled from the parcel-level County Assessor data and multiple GIS layers that provided information on location and neighborhood characteristics. The spatial data for road PCI at each address was provided by the Solano Transportation Authority. For some years, the roads were surveyed for pavement condition, and the PCI is a measured value. For other years, the PCI was estimated using a pavement condition deterioration model.
Based on several variations in the use of these data in models, we could detect no clear and robust relationship between pavement condition and residential property values. Using all of the residential property values available for the County, our best estimate for the relationship between pavement condition and sale prices was zero; the PCI coefficient was statistically insignificant. Estimates for subsamples for which PCI was surveyed directly versus estimated produced equivalent results. Models testing whether PCI might be differently related to prices depending on age of home or year of sale produced mixed results. Separate estimates for the largest cities in the County were also mixed.
Because the results are mixed, we cannot conclusively estimate the contribution of road pavement condition to the value of a home. The one conclusion we can draw is that to the extent that road pavement condition does contribute to home values, that contribution is probably small in dollar value. This suggests that although there are other reasons to improve pavement condition (e.g., reduced noise), property value may not be one of them.
Footnotes
Acknowledgements
Thanks go to Richard Little for his perseverance in obtaining peer reviewers for this article, and to two anonymous reviewers who provided useful comments on our original submission draft.
Authors’ Note
All errors are the responsibility of the authors alone.
Declaration of Conflicting Interests
The author(s) declared no potential conflicts of interest with respect to the research, authorship, and/or publication of this article.
Funding
The author(s) disclosed receipt of the following financial support for the research, authorship, and/or publication of this article: We thank the Solano Transportation Authority for their interest in this topic and financial support of this project.