
Abstract
This comment discusses the article by Honey-Roses and Pareja (2019). It attempts to provide additional insights into their analysis by placing it in a price index framework. A simple example is provided, which demonstrates this alternative view along with other suggestions for the use of their analysis.
Honey-Rosés and Pareja (2019) have provided an interesting approach to assessing the impacts of changes in rate schedules. This note aims at providing a way to view their method that hopefully also provides insight into their analysis.
One issue that needs addressing and which is not explicit in their discussion is that any rate change assessment must account for any changes in the overall level of prices. Once a rate change takes effect, it is likely that it will remain in place for some time. So long as inflation is positive, the effective real prices utility customers face will decline over time so long as the rate change is in effect. Even with rate riders or clauses that permit the pass-through of increases in costs in a relatively automatic fashion, for example, fuel adjustment clauses (FACs), for most utilities, some portion of the bill will remain fixed and inflation will lower that portion of the bill in “real” terms. Since presumably consumers base their use decisions on the relative real prices they face, a utility-provided good whose rate does not increase in the same proportion as inflation represents a relative “bargain.” Arguably, the often discussed Jevons’s or rebound effect that occurs with energy or water efficiency improvements is an example of the effect of a reduction in real costs in an environment of unchanging utility costs.
As the authors note, a utility rate has many components and there are many ways to summarize the impacts of changes in rates on utility customers. In some ways, this is no different than the problem faced by economists attempting to assess changes in price levels over time. A consumer’s market basket may consist of a wide variety of goods any and all of which may have changing prices over time. The approach that has come to be generally accepted is the creation of a price index. The simplest approach in the rate comparison setting is likely a Laspeyres’s Index which fixes the quantity and assesses the price changes against the base quantity.
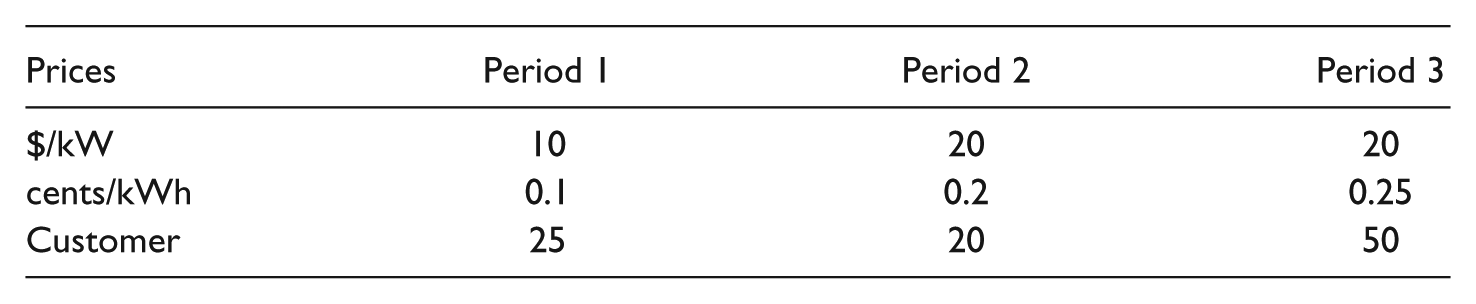
For utility rates, the way to operationalize this is to use, for some base period, what a utility customer uses, or incurs costs for, at various levels of consumption for each of the rate class’s billing units. Consider the following electric rate example. Suppose the rate consist of three parts, a monthly customer or connection charge in $/month, an energy charge in cents/kWh, and a maximum demand charge in $/kW with the energy and demand charge also measured on a monthly basis. The following is a table of the charges over time (which for simplicity we treat as constant dollar prices):
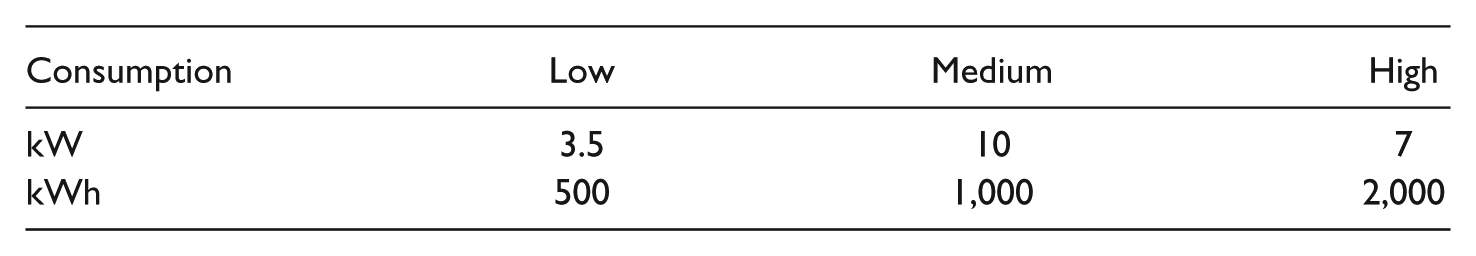
Let us assume that we use three levels of customer consumption for comparison purposes and the components are given by:
The indices for these customers as the various bill components change over time would look like:
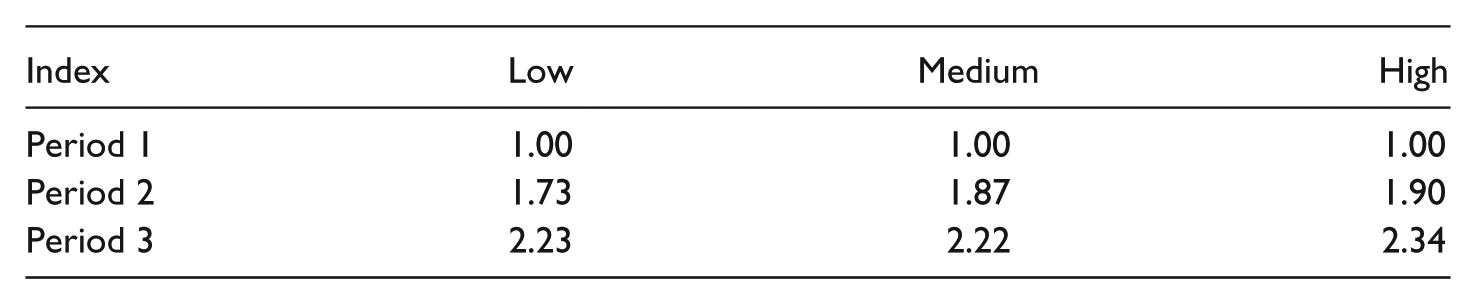
As can be seen from the indices, the differences in the billing determinant changes have differential effects across the customers. One could scale this index so that it had the same initial value as the local price index. That would permit an immediate comparison of the relative changes between the overall price level and that of the utility’s prices over time. This approach also lends itself to long term comparisons of rates over time, much as the Consumer Price Index (CPI) provides a sense of longer term inflation.
We would recommend that such calculations take place at specific levels of consumption for the relevant rate classes and/or the utility as a whole. Based on their use in statistics, the fifth, 25th, 50th (median), 75th, and 95th seem the best candidates, along with the average value for the rate class. As a statistic, the average value is not necessarily very representative, the underlying consumption distributions are generally skewed and leptokurtic, but under average cost pricing is nonetheless useful because total consumption times the average price is the revenue requirement.
Although one could weight these by total consumption at a particular percentile that distorts the index in unpredictable ways. In addition, fixing the quantity at a base level of consumption avoids the problem of simultaneity bias if these indices were used in models attempting to assess the impact of such price changes on demand.
Finally, viewing the pattern of rates over time from an index viewpoint also suggests that alternative index approaches might have use in such analyses. Diewert, Greenlees, and Hulten (2010) has several relevant discussions. One issue that may have increasing relevance is that of including quality changes in the index. This is likely not a significant issue for water since water quality standards are mandated by law at some jurisdictional level, but may be for electricity. As the proportion of generation resources becomes increasingly renewable, some have argued it may be necessary to accept slightly lower reliability in exchange for the environmental benefits.
Footnotes
Declaration of Conflicting Interests
The author(s) declared no potential conflicts of interest with respect to the research, authorship, and/or publication of this article.
Funding
The author(s) received no financial support for the research, authorship, and/or publication of this article.