
Abstract
Electric rates in Plattsburgh, New York are among the least expensive in the United States. Plattsburgh’s rates are set by a preference power program that was enacted in 1957 to promote rural economic development. A survey distributed to customers of Plattsburgh’s municipally-owned electric utility inquired about familiarity with local electric rates and energy systems, conservation behaviors, and attitudes towards policy interventions intended to encourage conservation. Results indicate that energy consumers in Plattsburgh hold a moderate degree of familiarity with the community’s energy system and implement strong conservation actions. Support for policy interventions are mixed. Survey results reveal income inequality, as differences in conservation attitudes and behaviors are apparent among respondents that report varying degrees of financial vulnerability. Today, Plattsburgh is in need of a resilient energy system, yet inexpensive rates discourage investment in infrastructure. This research reveals the complex social, economic and policy forces interacting to determine Plattsburgh’s energy future.
Keywords
Introduction
Thanks to a policy put into place in 1957, Plattsburgh, New York has among the least expensive municipal electricity rates in the United States. This case study explores energy conservation behaviors and attitudes within Plattsburgh’s low-rate environment. One common approach to encouraging conservation among energy consumers is through price signals (Riesz et al., 2013). That is, adjusting the cost of power through surcharges, taxes or direct rates to discourage excessive consumption and inefficient use. Data from Plattsburgh reveal that energy conservation efforts among consumers are strong, even though prices are low. Thus, Plattsburgh may inform our understanding of the ways that price signals influence conservation behaviors and assist policy makers to craft conservation policies in energy-restricted contexts. Additionally, as the transition to renewable energy accelerates in the United States, energy prices are falling (EIA, 2020; Marcacci, 2020). Rate structures that once encouraged energy conservation may not be as powerful as they once were. Yet, the need to conserve energy remains important. Understanding how and why consumers in low-cost communities conserve power may help promote conservation elsewhere as the renewable energy transition progresses. Finally, in Plattsburgh, local energy professionals often use the low-cost of power to justify disinvestment in energy infrastructure. Yet, climate change, extreme weather events, and advancements in technology reinforce the need for an adaptive and resilient energy system. Understanding how to encourage investment in Plattsburgh’s low-cost environment will help the community meet the challenges and transitions of the future.
Case Examination
Demographic and Seasonal Temperature Summary of Plattsburgh, New York.

a2017 American Community Survey, US Census. Economic and Demographic Characteristics. Accessed at: https://www.census.gov/acs/www/data/data-tables-and-tools/data-profiles/2017/ Accessed on: 1/13/2022.
b2017 Local Climate Data and Plots. Monthly Normals/Records. National Weather Service. Accessed at: https://www.weather.gov/btv/climate Accessed on: 1/13/2022.
Average Electric Rates for Residential and Commercial Sectors of the United States, State of New York and City of Plattsburgh.
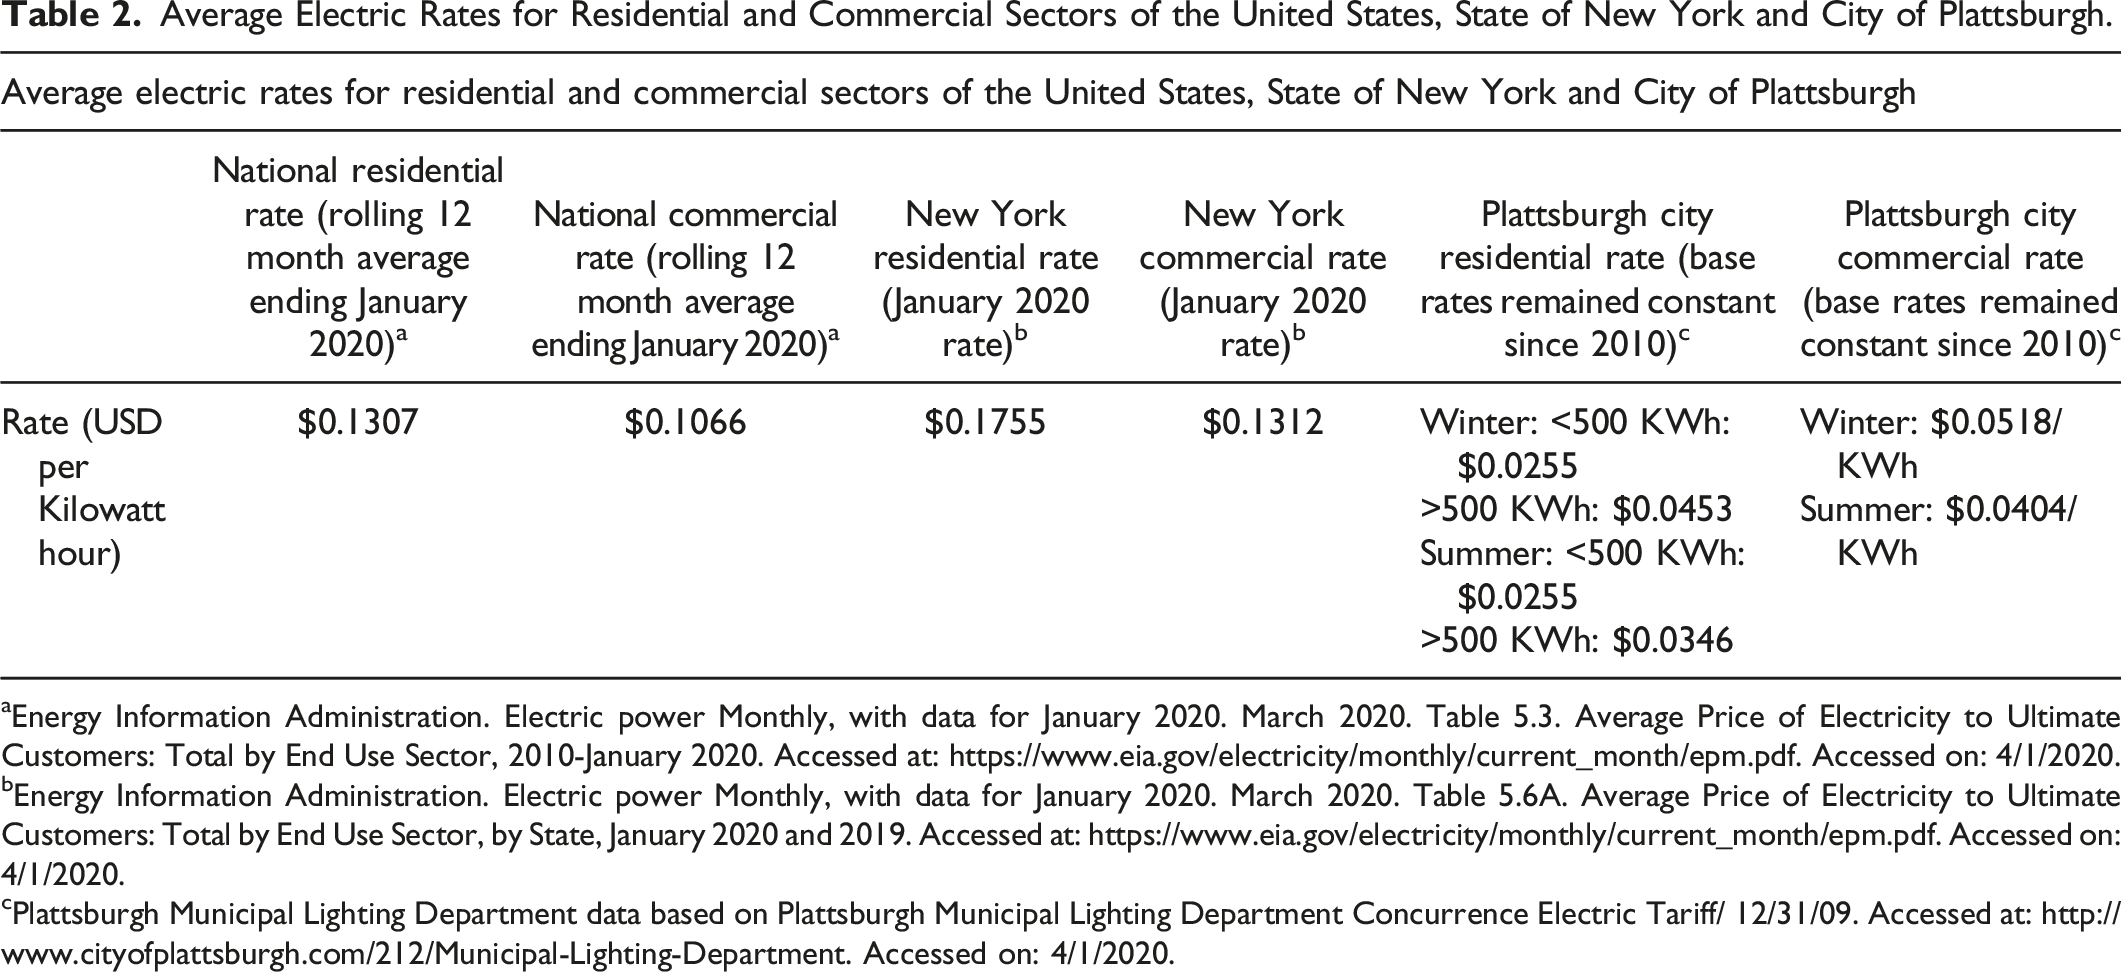
aEnergy Information Administration. Electric power Monthly, with data for January 2020. March 2020. Table 5.3. Average Price of Electricity to Ultimate Customers: Total by End Use Sector, 2010-January 2020. Accessed at: https://www.eia.gov/electricity/monthly/current_month/epm.pdf. Accessed on: 4/1/2020.
bEnergy Information Administration. Electric power Monthly, with data for January 2020. March 2020. Table 5.6A. Average Price of Electricity to Ultimate Customers: Total by End Use Sector, by State, January 2020 and 2019. Accessed at: https://www.eia.gov/electricity/monthly/current_month/epm.pdf. Accessed on: 4/1/2020.
cPlattsburgh Municipal Lighting Department data based on Plattsburgh Municipal Lighting Department Concurrence Electric Tariff/ 12/31/09. Accessed at: http://www.cityofplattsburgh.com/212/Municipal-Lighting-Department. Accessed on: 4/1/2020.
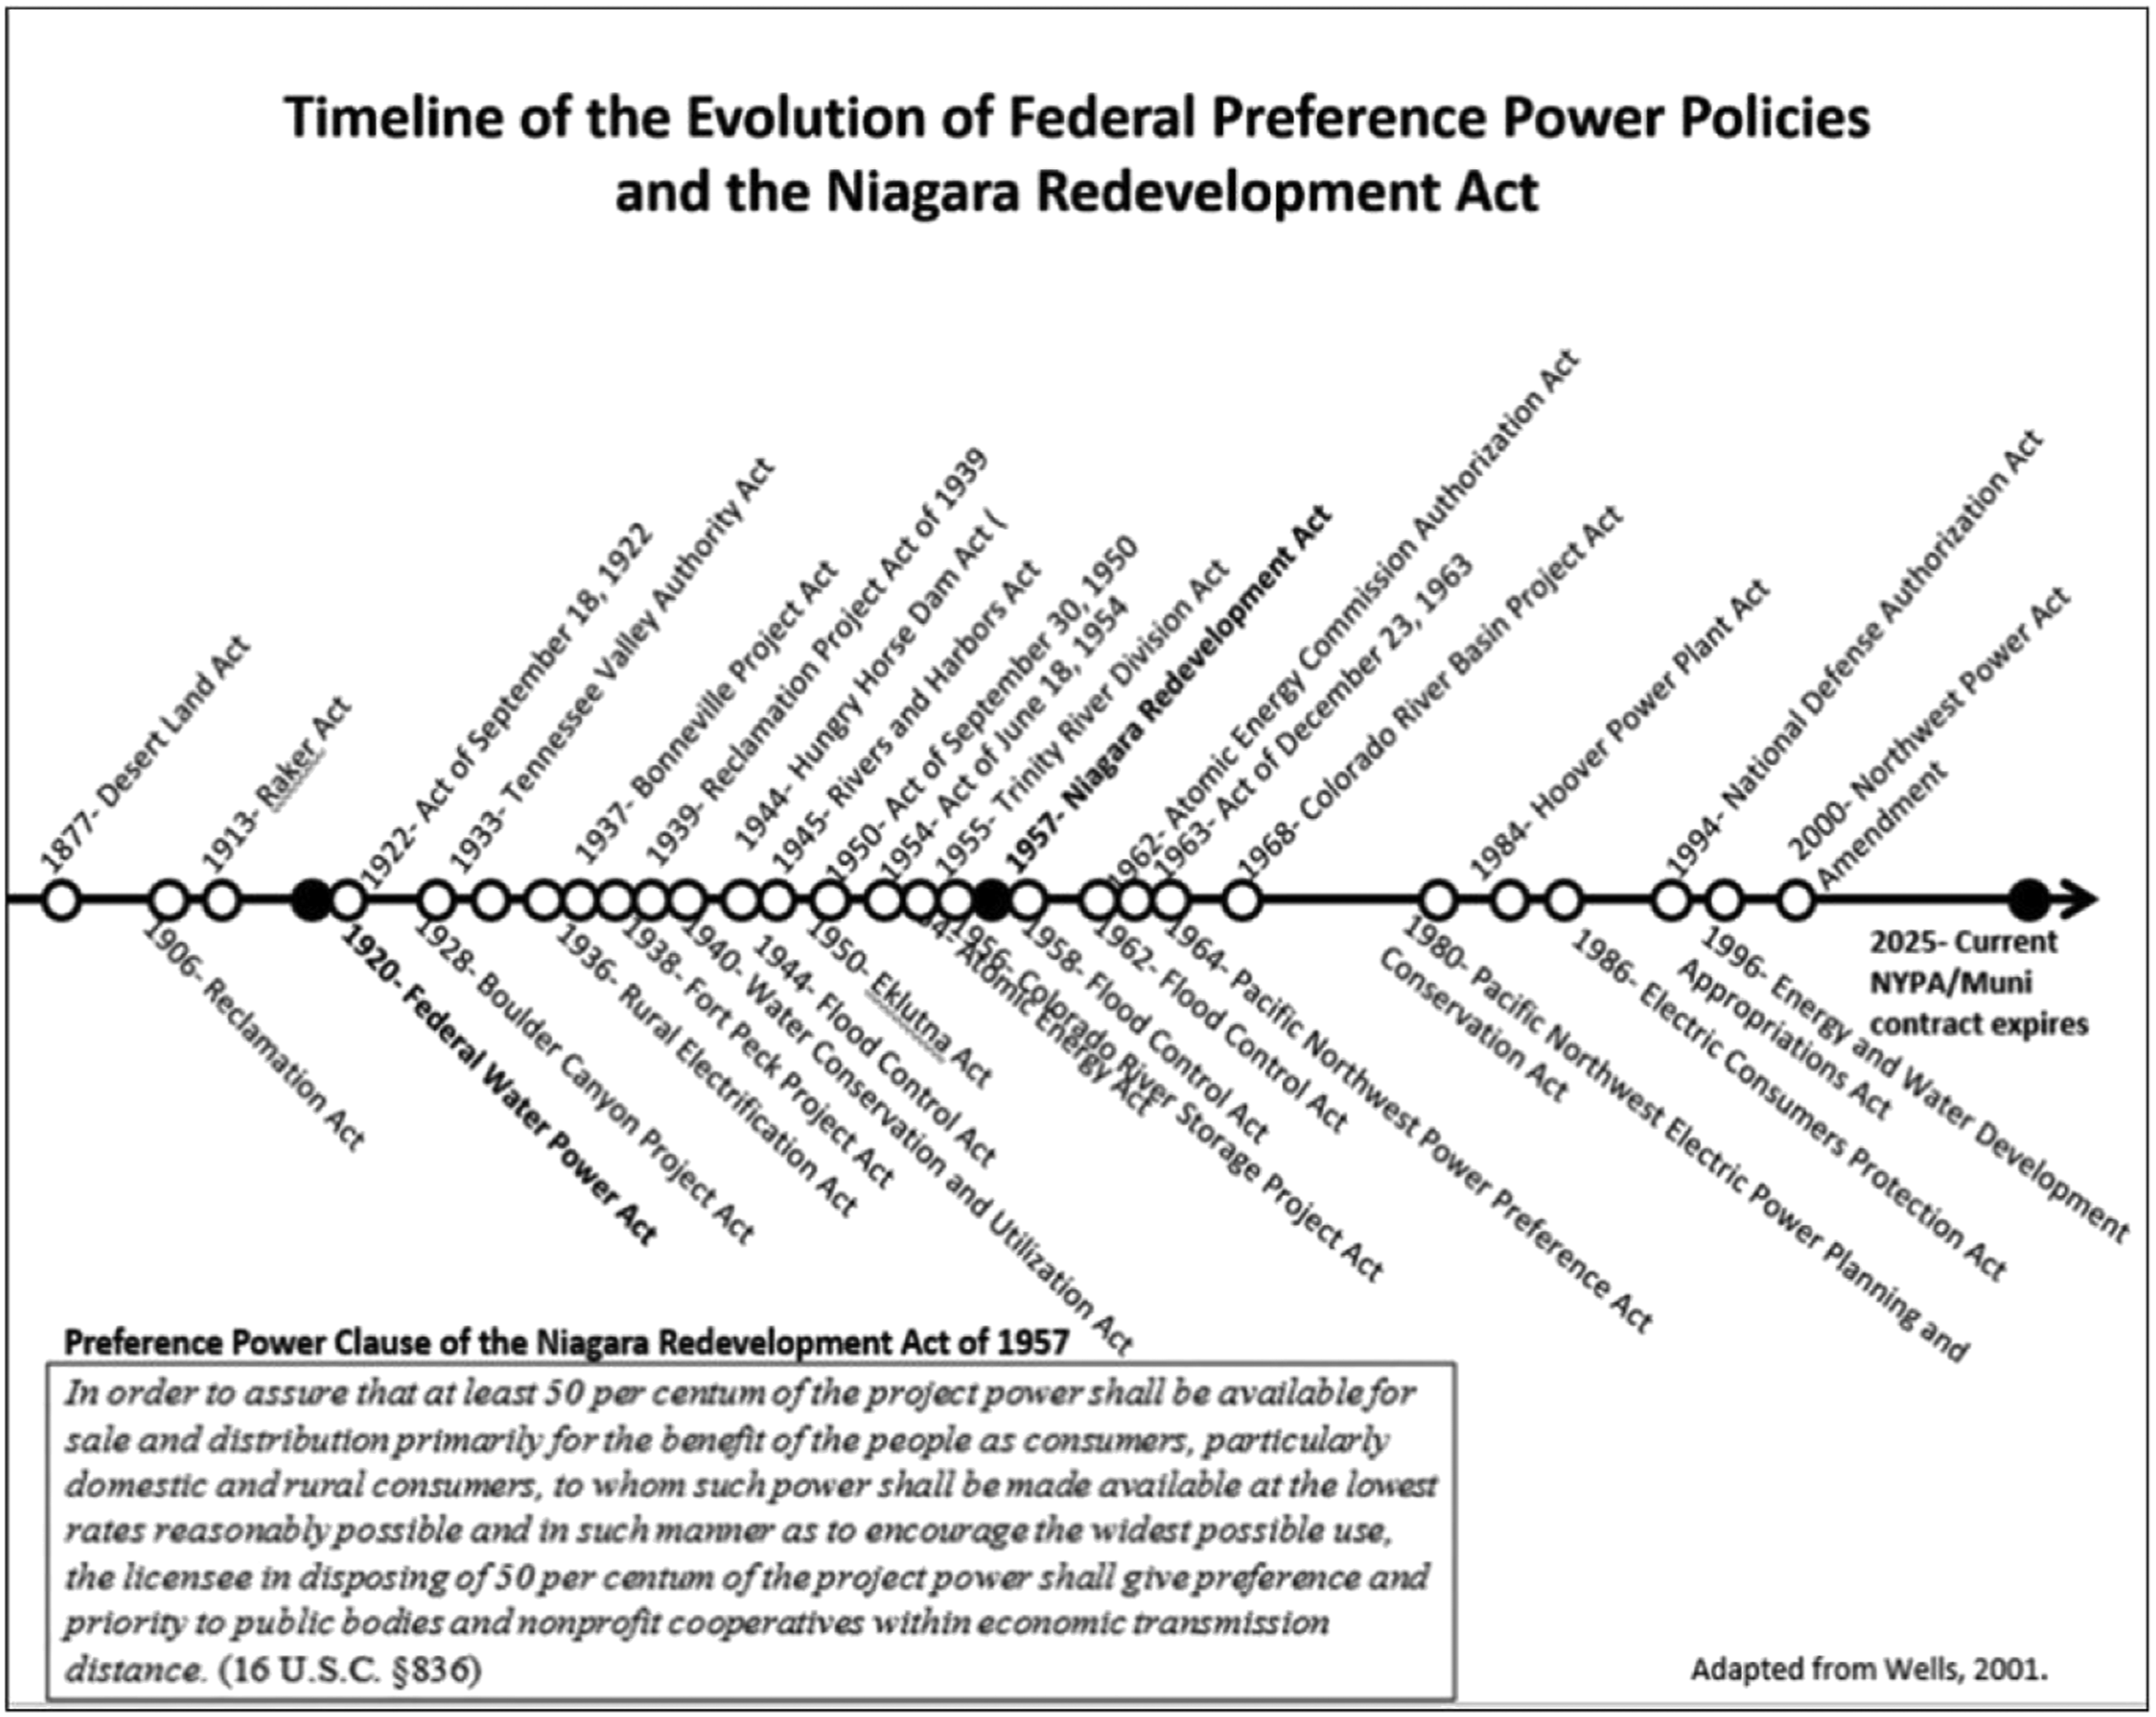
Timeline of preference power programs in the United States and New York state.
Plattsburgh’s electricity is generated at the Robert Moses Hydroelectric Dam, which is operated by the New York Power Authority and located near Buffalo, New York. It is important to note that the dam that produces energy for Plattsburgh and the remaining PPP communities is a pump-storage facility that sits parallel to the Niagara River, rather than in the river itself. Water is pumped from the Niagara River to an artificial lake above the dam, where it builds pressure through an elevation differential. Water then flows from the lake through the generating turbines to be returned to the Niagara River a short distance from where it was pumped out. Pump-storage facilities such as this pose fewer impacts to aquatic life and less significant alterations to hydrological flows under normal operating conditions and climate regimes (Anderson et al., 2015). Furthermore, while construction of dams is carbon intensive, the US Geological Survey and US Department of Energy consider hydropower to be a renewable power source (US Department of Energy, 2022; US Geological Survey 2018).
The Robert Moses facility produces about 2,441 MW of power, of which 40% is allocated to the 51 communities enrolled in New York’s PPP (including Plattsburgh). Plattsburgh has the largest population of the communities in the program, and it receives 104 MW of preference power. According to William Treacy, director of PMLD, typical power consumption in Plattsburgh fluctuates seasonally between 80 and 90 MW (Treacy, 2013).
Plattsburgh’s inexpensive electric rates, and those of all recipients of the PPP, are limited and based on the aggregate usage of all consumers. If the city’s consumption of energy surpasses 104 MW, PMLD must purchase additional power on the open market at market rates, which can be 300% higher than Plattsburgh’s base rates. In Plattsburgh, even if individual users take significant steps to reduce energy use, but a few large consumers push the community’s consumption over 104 MW, all users are forced to pay higher rates. Plattsburgh’s energy system and rate structure impose the complex dynamics of common pool resources on consumers. Energy conservation, as a consequence, is implicitly and structurally discouraged even though it may provide significant public benefits.
Because the PPP provides energy consumers in Plattsburgh with low-cost electricity, most residents and businesses use electric heat. During winter cold snaps it is not uncommon for the municipality to exceed the 104 MW cap. The additional charges for power purchased in excess of the 104 MW cap are added to consumers’ bills through a Purchase Power Adjustment Charge (PPAC). The PPAC can lead to large fluctuations in consumers’ electric bills. For residents with low and fixed incomes the bill adjustments can make financial planning difficult. The dynamics of Plattsburgh’s fluctuating electric rates and associated cap on inexpensive power hit financially vulnerable residents the hardest and reaches its breaking point in the coldest weeks of the year.
In order to secure the preference power rates over the long-term, PMLD contractually prohibits residential, commercial and industrial account holders from distributing locally generated power on PMLD’s grid. Consequently, residents and businesses cannot buffer themselves from energy disruptions or price shocks through local renewable distribution networks. A property owner may install on-site solar panels “behind the meter” so that the power generated is not observable by PMLD, but that power cannot be distributed to others on PMLD’s distribution system. Property owners are further discouraged from installing “behind the meter” renewable energy systems because the return on investment is prolonged by the PPP’s inexpensive rates.
Plattsburgh’s local hospital, public high school, state college campus, and two assisted living facilities, in 2016, partnered to conduct a feasibility study for a microgrid (City of Plattsburgh Final Report, 2016). The microgrid these partners envisioned would connect critical infrastructure at the facilities so they could remain operational during a power outage. However, it became clear in the early stages of the project that PMLD’s preference power contracts and the low-cost of electricity combined to preclude further investment. While the PPP offers the benefit of low-cost power, it may also prohibit the City of Plattsburgh from taking necessary steps to advance its resilience to market fluctuations and energy disruptions.
Theoretical Context
Jason Seawright (2016) argues in support of selecting extreme case studies––those that represent highly atypical dynamics among independent and dependent variables––for discovery. Typical cases, Seawright acknowledges, provide deep and rich insights into the ways that systems commonly function, but are limited in their ability to break new ground. Extreme cases, on the other hand, push the limits of expected behaviors and outcomes and therefore hold a higher potential for generating new knowledge. When it comes to energy planning and conservation, Plattsburgh, New York holds this potential.
Infrastructure Ecology
This case study draws on the lens of infrastructure ecology (Pandit et al., 2015) to investigate energy conservation in Plattsburgh, New York from a systems orientation. Pandit et al. writes: “Urban infrastructure systems are analogous to ecological systems because they are interconnected, complex and adaptive components that exchange material, information and energy among themselves and to and from the environment…. Analyzing them together as a whole, as one would do for an ecological system, provides a better understanding about their dynamics and interactions, and enables system-level optimization.” Pandit et al. (2015) Journal of Cleaner Production p.1.
Pandit et al. describe 12 key principles of infrastructure ecology in demonstrative and normative terms. These principles are: • Interconnection of infrastructure systems rather than segregation; • Integration of material, energy and water flows; • Management of complexity; • Consideration of system dynamics; • Decentralization of governance and decision making, to increase response diversity and modularity; • Maximization of sustainable and resilience financial and resource investments; • Synergy among engineered and ecological systems; • Stakeholder and user-focused design; • Creation and maximization of comfort and wealth; • Evidence-based and socioeconomically-focused decision making; • Adaptive management as a management strategy; • Reliance on “renewable flows” rather than “depleting stocks.”
The lens of infrastructure ecology suits this case study because in Plattsburgh basic utilities such as waste management, provision of drinking water, treatment of wastewater, and distribution of electricity are all managed by the municipality and integrated into one customer bill. The City of Plattsburgh owns and operates PMLD alongside a Department of Public Works (DPW). PMLD administers the municipality’s electric system and DPW administers water, waste and transportation services. PMLD manages billing and collections for all utilities. Plattsburgh’s Common Council—a six member elected board plus the mayor—oversee this bureaucracy. As a result, the governance and finances of Plattsburgh’s utilities are tightly intertwined. Furthermore, Plattsburgh’s unique electric rate structure treats energy like a common pool resource. In this context, Pandit’s principles of infrastructure ecology are brought to life through interdependencies among individual users, the municipality, and the utility resources themselves. These factors, and the holistic nature of infrastructure ecology more generally, lend themselves to inquiry about the roles of individuals and institutions in influencing consumers’ habits of energy use.
Energy Economics and Behavior
Building on structuration theory (Giddens, 1979; Jackson, 2005; Parker, 2000) this study explores how the energy choices and conservation behaviors of consumers are guided by the structures put in place by Plattsburgh’s municipal electric utility. Jackson (2005), and Wilson and Dowlatabadi (2007), provide overviews of the diverse social-ecological theories that provide explanatory power to people’s decisions, behaviors and attitudes relative to energy consumption and conservation. Studies that specifically explore relationships among consumption patterns and energy rates often draw upon rational choice theory (Elster, 1986; Homans, 1961). Rational choice theory posits that individuals weigh the costs and benefits of potential actions and engage in those that maximize utility (Wilson & Dowlatabadi, 2007).
For this reason, research that employs rational choice theory to explore energy finance, planning and conservation typically occurs in locations where electric rates are significantly higher than average. These studies seek to uncover ways that ratepayers reduce energy use in order to adapt to high-costs. Studies like these often show electric rates are a key driver in promoting conservation behaviors (Huebner et al., 2013). Leighty and Meier (2011), for example, explore conservation behaviors among residents of Juneau, Alaska after an avalanche destroyed the city’s main transmission line from a nearby hydroelectric plant. Following the event, energy costs in Juneau increased by 500% for 45 days while the city temporarily converted to diesel power. During this period residents reduced their use of electricity by 25%. When electricity rates rose quickly and unexpectedly in California in 2000, consumers reduced consumption by 13% over 60 days (Riess & White, 2008). In another case, Adesanya (2021) documents community perceptions and obstacles to the adoption of renewable energy in Michigan’s Western Upper Peninsula, where residents historically and consistently pay among the highest electric rates in the country. Adesanya finds that 87–95% of energy consumers in the Western Upper Peninsula are more likely to support renewable energy development when it reduces residential electric rates. 78–92% are more likely to support projects that reduce electric rates for schools and other community services. Plattsburgh sits at the opposite end of the price-spectrum from these cases. Therefore, the community offers a novel, yet extreme, perspective on consumer attitudes towards conservation relative to expenses and price signals.
Diekmann & Preisendorfer (2003) extend rational choice theory to low-cost environments. Their low-cost hypothesis theorizes that concern for the environment is most frequently translated into action when costs and inconveniences are low, but the probability of action diminishes as these factors increase. Zintl (1989) posits that rational choice theory has a higher degree of explanatory power in high-cost situations, but less efficacy to explain behavior in low-cost environments. According to Zintl, in high-cost environments price is a dominant factor in determining behavior, but in low-cost cases a variety of other variables may confound clear explanations for an individual’s actions.
Linking Energy Literacy, Energy Insecurity and Financial Vulnerability
Additional and important concepts undergirding this research are energy literacy, energy security and financial vulnerability. Several recent scholarly works draw upon the concept of energy literacy. Martins et al. (2020) conduct a review of literature dating to 1981, though the term energy literacy does not appear until 2007 (DeWaters et al., 2007). DeWaters, Powers and Graham construct a description of energy literacy that is based on the architectures of cultural (Hirsh, 1983), environmental (UNESCO, 1977) and technical literacy (National Research Council, 1996). Drawing from commonalities among these concepts, DeWaters, Powers and Graham theorize that energy literacy holds three domains: the knowledge, attitudinal and behavioral domains. DeWaters, Powers and Graham stop short of defining energy literacy, instead describing the characteristics that an energy literate person demonstrates. These characteristics are: • An understanding of the role of energy in daily life (knowledge domain); • An understanding of the environmental and societal impacts of energy production and consumption (knowledge domain); • An awareness of the need for renewable and alternative energy sources (attitudinal domain); • The ability to cognitively connect personal energy choices to global impacts (attitudinal domain); • An aspiration to behave in ways that reduce environmental and societal impacts from energy use (behavioral domain).
Additional dimensions of energy literacy have been investigated by other scholars. The links between financial literacy and energy choices is one common thread (Brounen et al., 2013; Blasch et al., 2018; Trotta et al., 2017). This stream of research is primarily concerned with whether consumers can accurately evaluate energy and financial-related information and apply it to choices about whether to invest in household energy efficiency devices. van den Broek and Karlijn (2019) provides more detailed insight to this question by enumerating the concepts of device, action and multifaceted energy literacy. Device energy literacy pertains to consumers’ awareness of the energy consumed by household appliances. Action energy literacy illuminates consumers’ awareness of the personal behaviors one can employ in their home to reduce energy consumption. Multifaceted energy literacy describes an individual’s ability to integrate all other domains of energy literacy into a coherent and consistent orientation towards energy-related decisions, behaviors and policy choices.
Looking across the field of research on energy literacy, three conclusions stand out. First, while individual scholars draw conclusions about the level of energy literacy among research participants in specific contexts, a general scale of energy literacy does not exist. Second, a high degree of variation in energy literacy exists among sociodemographic groups within specific studies (Brounen et al., 2013; DeWaters & Powers, 2011), and between studies. This is especially visible at the international scale, as residents of different countries show wide ranges of energy literacy (Martins et al., 2020). It is unclear whether the sociodemographic differences and international variations observed in the literature describe true differences or represent artifacts of the survey methods used. Published studies do not use consistent methodologies. Finally, general trends illustrate stronger links among the knowledge and attitudinal domains than between the knowledge and behavioral domains of energy literacy. Put simply, knowledge of the physics of energy and the roles of energy in society link to stronger awareness of the need for smart decisions around energy consumption, but this is not readily translated into action by end-users.
While a consistent definition of energy literacy is not found in the literature, evolving consensus highlights that energy literacy includes knowledge of how energy works, the need for concern and informed decision making around energy, and translating knowledge into action. For this reason, this case study of Plattsburgh elects to use the definition and description of energy literacy provided by the United States Department of Energy (USDOE). Energy literacy is defined by USDOE (2014) as: …an understanding of the nature and role of energy in the universe and in our lives. Energy literacy is also the ability to apply this understanding to answer questions and solve problems. …Without a basic understanding of energy, energy sources, generation, use and conservation strategies individuals and communities cannot make informed decisions on topics ranging from smart energy use at home and consumer choices to national and international energy policy.
According to USDOE, energy literacy implies fundamental knowledge about the physics of energy in addition to an awareness of the roles that energy plays in the human experience. Furthermore, the statement outlines attitudinal and behavioral orientations to decision making at personal scales as well as within governance. USDOE’s definition is both declarative and normative. When armed with basic energy knowledge, the USDOE definition suggests, consumers should make “informed decisions” about energy consumption, purchases and larger scale policy alternatives.
This case study of Plattsburgh, New York constructs an index of energy literacy that is based on consumers’ knowledge of local energy resources. It also inquires about knowledge of local utility rates and whether consumers experience confusion when reading utility bills. This incorporates the financial components of energy literacy. The case seeks to connect these elements of the knowledge domain to the attitudinal and behavioral domains by revealing whether consumers with higher levels of energy knowledge have more positive attitudes towards energy conservation and policy proposals. This follows in the footsteps of DeWaters and Powers (2011), when they state: An energy literate individual is one who has a sound conceptual knowledge base as well as a thorough understanding of how energy is used in everyday life, understands the impact that energy production and consumption have on all spheres of our environment and society, is sympathetic to the need for energy conservation and the need to develop alternatives to fossil fuel-based energy resources, is cognizant of the impact that personal energy-related decisions and actions have on the global community, and – most importantly – strives to make choices and exhibit behaviors that reflect these attitudes with respect to energy resource development and energy consumption.
Lee and Sabri (2017) define financial vulnerability as “a status of financial instability or a situation to the exposure of financial risk and shock.” Hoffman and McNair (2019) outline four components of financial vulnerability. These are: knowledge of basic finance principles and dynamics; debt; income; and life circumstances. Individuals with lower levels of financial knowledge are at risk of making spending and investment choices that can result in less cash on hand and more financial instability. Debt, interest rates and credit ratings compound to impact an individuals’ ability to borrow money. Individuals with higher debt often pay higher interest rates and may have lower credit scores. Consequently, when an emergency or financial shock arises, individuals with higher levels of debt are often less able to borrow the money they need. When they do, the terms are less favorable to the borrower and exacerbate financial distress. Debt distress can last many years and many consumers never overcome this weight. Income stability is critical for reducing vulnerability, because it offers predictability and consistency. Individuals with more stable incomes are better able to plan for expenses, reducing financial surprises. Finally, life circumstances can expose an individual to financial risks. These may include personal or family health conditions that place an individual at risk of large medical expenses; living conditions that may require costly repairs or expose an individual to natural hazards; or behavioral choices. Some life circumstances are within an individual’s sphere of control, while others are not. O’Conner et al. (2019) note that society often associates financial vulnerability with poverty, but wealthier individuals may also be in vulnerable positions. Additional scholarship demonstrates that financial vulnerability is linked to higher levels of psychological stress (Brown et al., 2005; Gathergood, 2012). Specifically, concerns over money can lead to negative impacts on emotional well-being including anxiety, depression and relationship stress (Green, 2007; Magadi & Middleton, 2007). The symptoms and consequences of these stressors can be severe. The ability to pay energy/electric bills, especially related to household heating, is a common source of stress and other health problems among residents living in poverty (Hernandez et al., 2016).
Hernandez (2016) defines energy insecurity as “Financial hardship associated with the cost of energy relative to income and other expenses (p. 3),” and “an inability to adequately meet household energy needs (p. 2).” Energy insecurity becomes acute when energy costs exceed 10% of monthly expenses (Moore, 2012; Power, 2008). Hernandez et al. (2014) and Hernandez et al. (2016) show that most poverty-line households in the US experience energy insecurity. A 2015 study by The US Energy Information Administration documents that more than 30% of US households are challenged by energy expenses (EIA 2015). More than 20% of households in the EIA study reported having to forego basic necessities in order to pay energy bills. Approximately 11% of respondents to the EIA’s study reported keeping their homes at unsafe/unhealthy temperatures in order to make ends meet. Put simply, these residents are faced with an impossible choice: heat or eat? (Bhattacharya et al., 2002).
Energy expenses, however, only represent one facet of energy stress. Housing conditions, consumer choices and behaviors are also important factors (Hernandez, 2016). Housing conditions include factors such as insulation, weatherization, maintenance, type of heat source and electric wiring, among other factors. Residents living in poverty are more likely to reside in substandard housing, where heating a home to a comfortable temperature is more difficult and expensive. Consumer choices relate to residents’ desire, need and ability to purchase energy saving appliances and heating supplements (e.g., space heaters, electric blankets). Consumers experiencing poverty are often driven to purchase heating supplements because over the short term they are typically less expensive than upgrading housing conditions and centralized heating systems such as heat pumps, baseboard heaters and furnaces. In the long run, however, supplementary heat sources may be more expensive and less effective at creating comfortable conditions. Furthermore, even though energy saving appliances reduce energy expenses in the long run, consumers with limited funds are less likely to purchase them because the upfront costs are insurmountable. Finally, the behavioral element of energy insecurity includes decisions to forego heat or other necessities, delaying (or not paying) energy bills, layering clothing, spending time away from home in heated locations (e.g., at work, libraries, shopping centers, schools), and enrolling in financial assistance programs, among others.
Energy insecurity brings its own set of mental and physical health impacts (Hernandez, 2016; Hernandez et al., 2016). These range from chronic stress and anxiety to respiratory ailments including frequent cough and cold symptoms, and asthma, among others (Hernandez & Siegel, 2019). McEwen (2000) outlines the linkages that connect stress and disease. Stress mediating chemicals are produced in the nervous system when an individual undergoes stress. In conditions of chronic stress these chemicals are produced in large quantities and over long periods. Among the negative side effects of an overabundance of these chemicals are disruptions to the functions of insulin and the ways that the body processes fat. Stress also elevates one’s blood pressure. Long term high blood pressure promotes plaque buildup in arteries, among other circulatory problem, increasing an individual’s chance of experiencing a heart attack and other circulatory disorders.
The interactions between mental and physical health under conditions of stress, including energy insecurity, create a feedback loop in which psychological impacts lead to physical impacts, and physical impacts raise an individual’s stress levels, further exacerbating psychological effects. Living with energy insecurity over long periods perpetuates this cycle. Furthermore, living with low thermal comfort brings its own set of challenges. For example, chronic cold can exacerbate arthritis, bring about perpetual cough and cold symptoms, and lead to dermatological problems. If left untreated these conditions can lead to pneumonia, flu and other more serious health issues. Children are especially vulnerable to energy insecurity, as coping mechanisms often lead to food insecurity, poor health ratings, and developmental concerns (Cook et al., 2008).
The relationships between energy security, financial vulnerability and health create what Hernandez et al. (2016) term the “trifecta of insecurity.” The trifecta of insecurity describes the ways that the physical characteristics of an individual’s home, economic status, and personal health interact to raise stress levels that in turn reduce one’s capacity to manage any one of these issues, not to mention all three simultaneously.
Physical deficiencies within the built environment and poor housing conditions were directly associated with stress and also led to uncomfortable living conditions and coping mechanisms that increased concerns about the health and safety of household members. These concerns on health and safety in turn were also associated with increased stress. Similarly, poor building conditions led to the use of secondary heating equipment that significantly increased utility expenses, contributing to the economic issue of significant financial burden.
This case employs energy literacy and financial vulnerability as dependent and independent variables. First, as dependent variables, the study examines the variation of energy literacy and financial vulnerability present within PMLD’s membership. Once PMLD’s membership is understood through the lenses of these concepts, the study explores how literacy and vulnerability influence the conservation actions of PMLD members as well as their attitudes towards policy interventions.
Research Questions and Theoretical Propositions
This case study addresses three questions about PMLD customers’ awareness, behaviors, information needs and attitudes toward energy consumption and conservation. These questions are accompanied by theoretical propositions. These are:
Methods
Data were collected through a survey distributed in 2017 to all 8000+ PMLD account holders (Appendix 1). The survey was packaged with account holders’ monthly bills, and sent through the mail. Responses were accepted in bill payments through the mail and paid at PMLD’s office. An online survey was not offered. Ultimately, 687 surveys were returned. The sample size is comparable to similar research (Sutterlin et al., 2013 (n = 1,209); Adesanya, 2021 (n = 347)). A concept map illustrating the research questions, independent and dependent variables, and connections to survey questions is illustrated in Figure 2. Concept map of research questions and variables.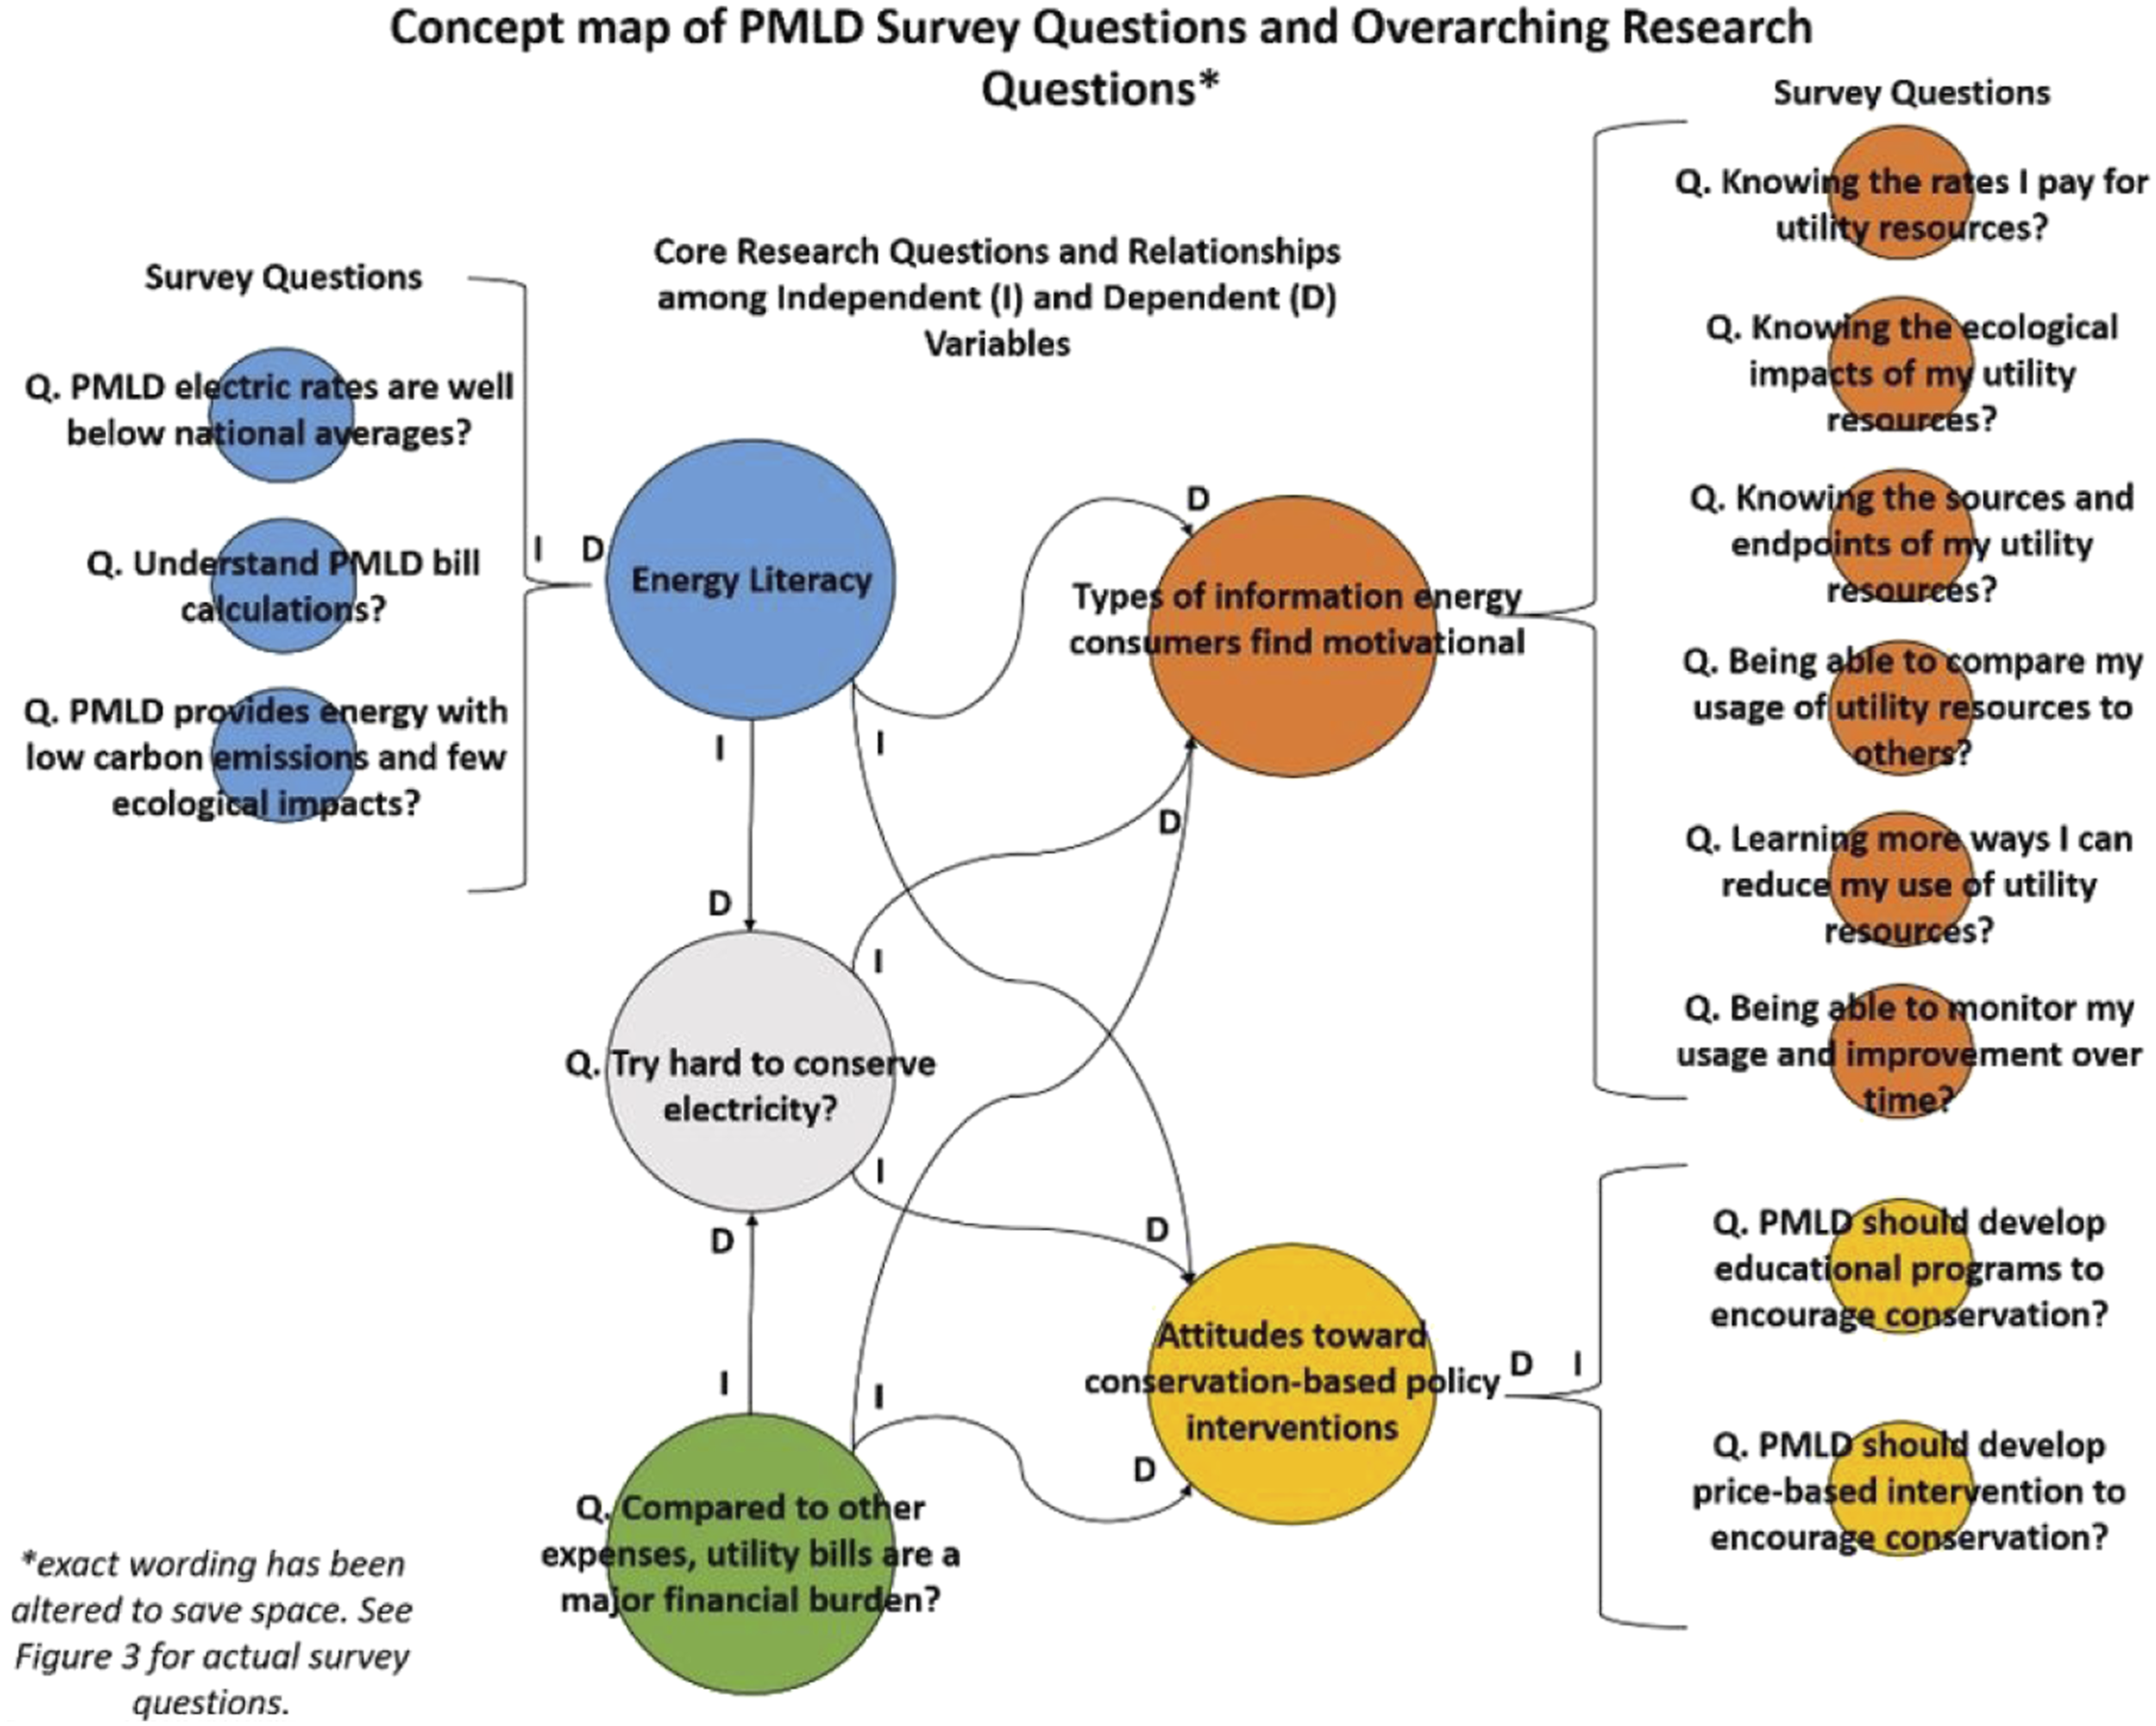
This analysis relies on three variables as indicators of energy literacy. These are: (1) respondents’ awareness that PMLD’s electric rates are well below the national average (survey question 3.1); (2) respondents’ awareness that PMLD provides low carbon electricity with few ecological impacts (survey question 4.2), and (3) respondents’ awareness of the ways that PMLD’s utility bills are calculated (survey question 4.1). These indicators reveal a respondent’s knowledge of three basic components of Plattsburgh’s energy system. First, that the PPP provides extremely low-cost power. Second, that Plattsburgh’s energy is generated by hydropower, which is generally considered a renewable resource with fewer ecological impacts than nonrenewable sources. Third, that PMLD’s electric rates fluctuate seasonally and changes are observable on bills in the PPAC, as well as other potentially confusing elements of utility bills. These data are integrated into an energy literacy index represented by the mean of each respondents’ responses to the survey questions on these topics. The formula used to calculate energy literacy is:
Categories of Energy Literacy.

Respondents are grouped into four categories of energy literacy, based upon responses to three indicator questions.
Financial vulnerability was assessed by respondents’ agreement with the statement “compared to other expenses such as groceries, school and health needs, my PMLD utility bill presents a major financial burden.” Data regarding conservation habits were gathered through respondents’ agreement with the question “I try hard to conserve energy when I can.” Respondents’ attitudes towards two conservation-focused policy interventions were gathered by assessing agreement with the statements “I would like the city to develop new educational programs and incentives to encourage conservation, even if it means a slight increase in my bill” and “City utilities should be priced to encourage conservation, even if it means a slight increase in my bill.” Except when noted, all questions were based on a 1-5 Likert scale with choices ranging from strongly agree to strongly disagree (choice 3 represented a neutral option), respectively.
Methodological Limitations
The survey and analytical methods used in this study hold several weaknesses. Factors related to PMLD’s billing system complicate calculating a response rate. For example, some customers hold multiple accounts (e.g., account holders with multiple properties) but respondents were instructed to complete only one survey. The total number of accounts also fluctuates as residents move in/out of the city, new businesses open and others close. It is likely that the decision to only accept surveys by delivery or mail reduced the response rate because returning the survey was inconvenient for PMLD customers that pay online. The length of the survey and questions included were restricted by PMLD, and therefore the survey did not collect socio-economic demographic data. Additional questions would have added pages to the survey and increased the cost of mailing. Some of the variables interrogated (e.g., financial vulnerability) are measured through just one survey question. Triangulating these concepts through multiple questions and a variety of question formats would increase the precision with which these topics are understood. Additionally, respondents’ conservation habits are self-reported. It is likely that some respondents over-stated their energy saving behaviors. Because the survey was mailed through the PMLD billing system respondents may have felt compelled to show positive responses on this question, because they believed their results would be reported to PMLD (the survey did undergo IRB approval and a statement at the beginning of the survey informed respondents that results are reported anonymously and not reported to PMLD). Finally, the Likert scales on the questions used to calculate the index of energy literacy may not be parallel. The questions about environmental impacts of PMLD’s energy system (question 4.2) and customers’ awareness of bill calculations (question 4.1) offer responses in terms of levels of agreement. The question about PMLD’s rates relative to elsewhere in the US (questions 3.1) offers responses about whether PMLD’s rates are above or below the national average. The energy literacy index calculation treats these scales as equal, yet their compatibility is untested. Future efforts to develop an understanding of energy literacy should consider questions that allow for more accurate integration of data into a single index.
Results
Descriptive Statistics of PMLD’s Account Holders
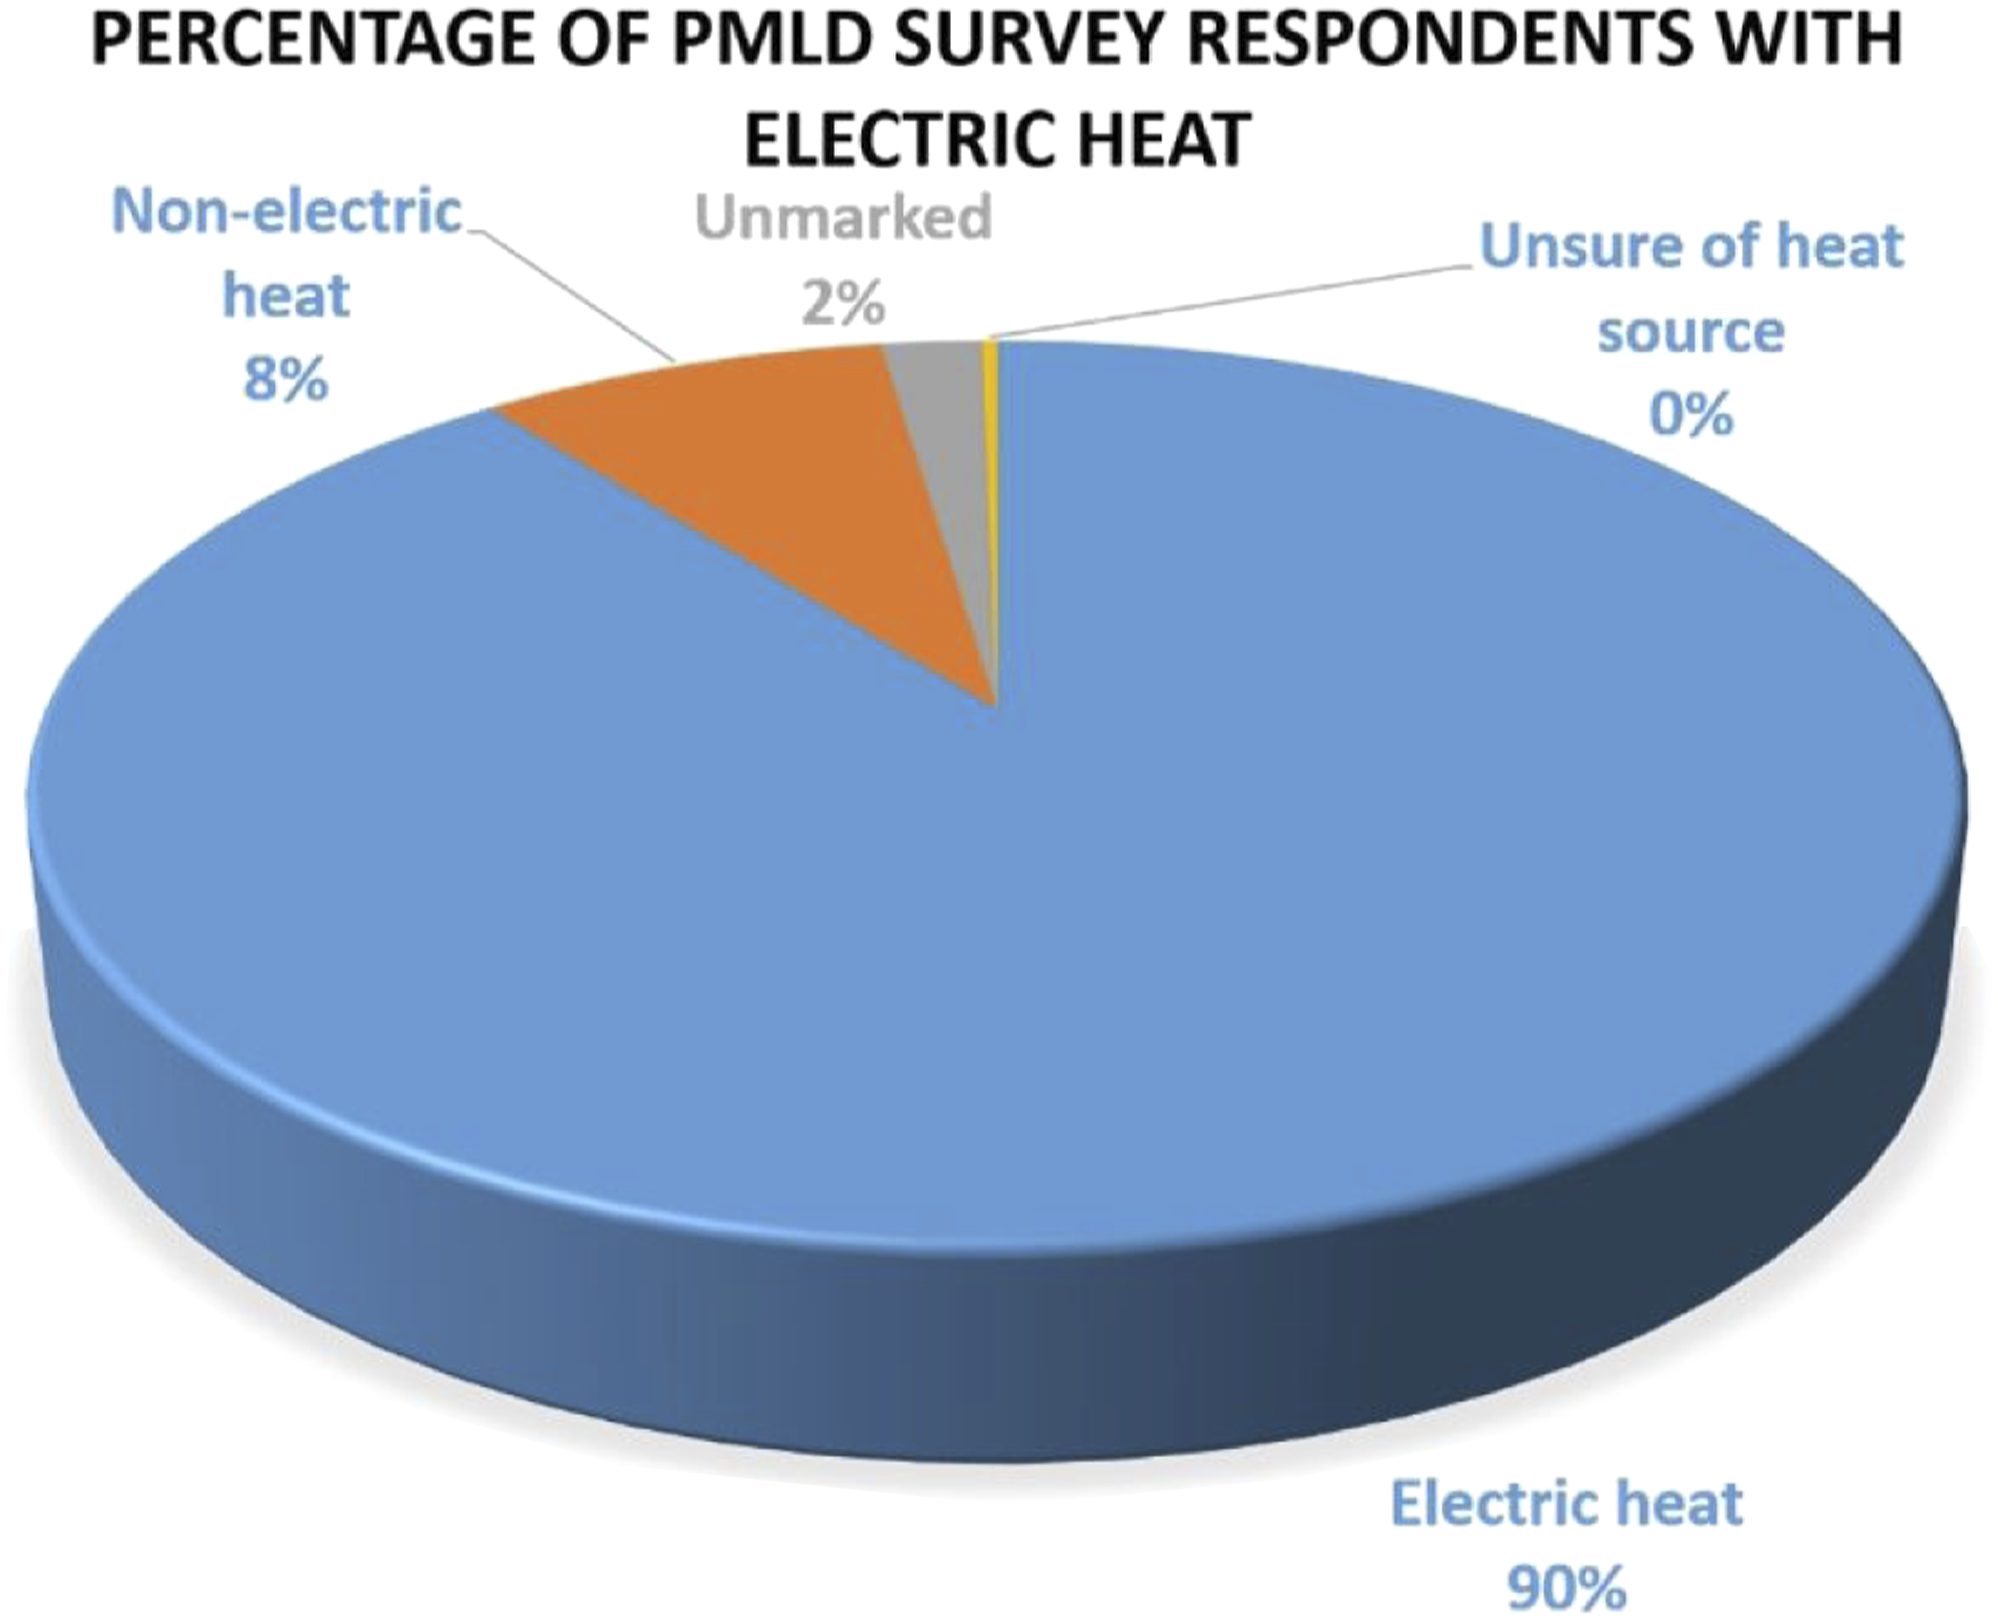
Figure 3 illustrates the percentage of PMLD account holders in the residential, commercial and industrial sectors. Figure 4 shows the reliance on electric heat by the Plattsburgh community. Since the implementation of the PPP in 1957, many property owners in Plattsburgh converted to electric heating systems to take advantage of the inexpensive rate. 90.00% of respondents report using electric heat, while 8.00% use an alternative source. Municipal regulations and agreements among PPP member communities discourage solar and wind energy generation. Consequently, alternative sources most likely include oil, natural gas or biofuel. 2.00% of respondents are unsure of their heating source. PMLD account types within the sample. Percentage of survey respondents with electric heat.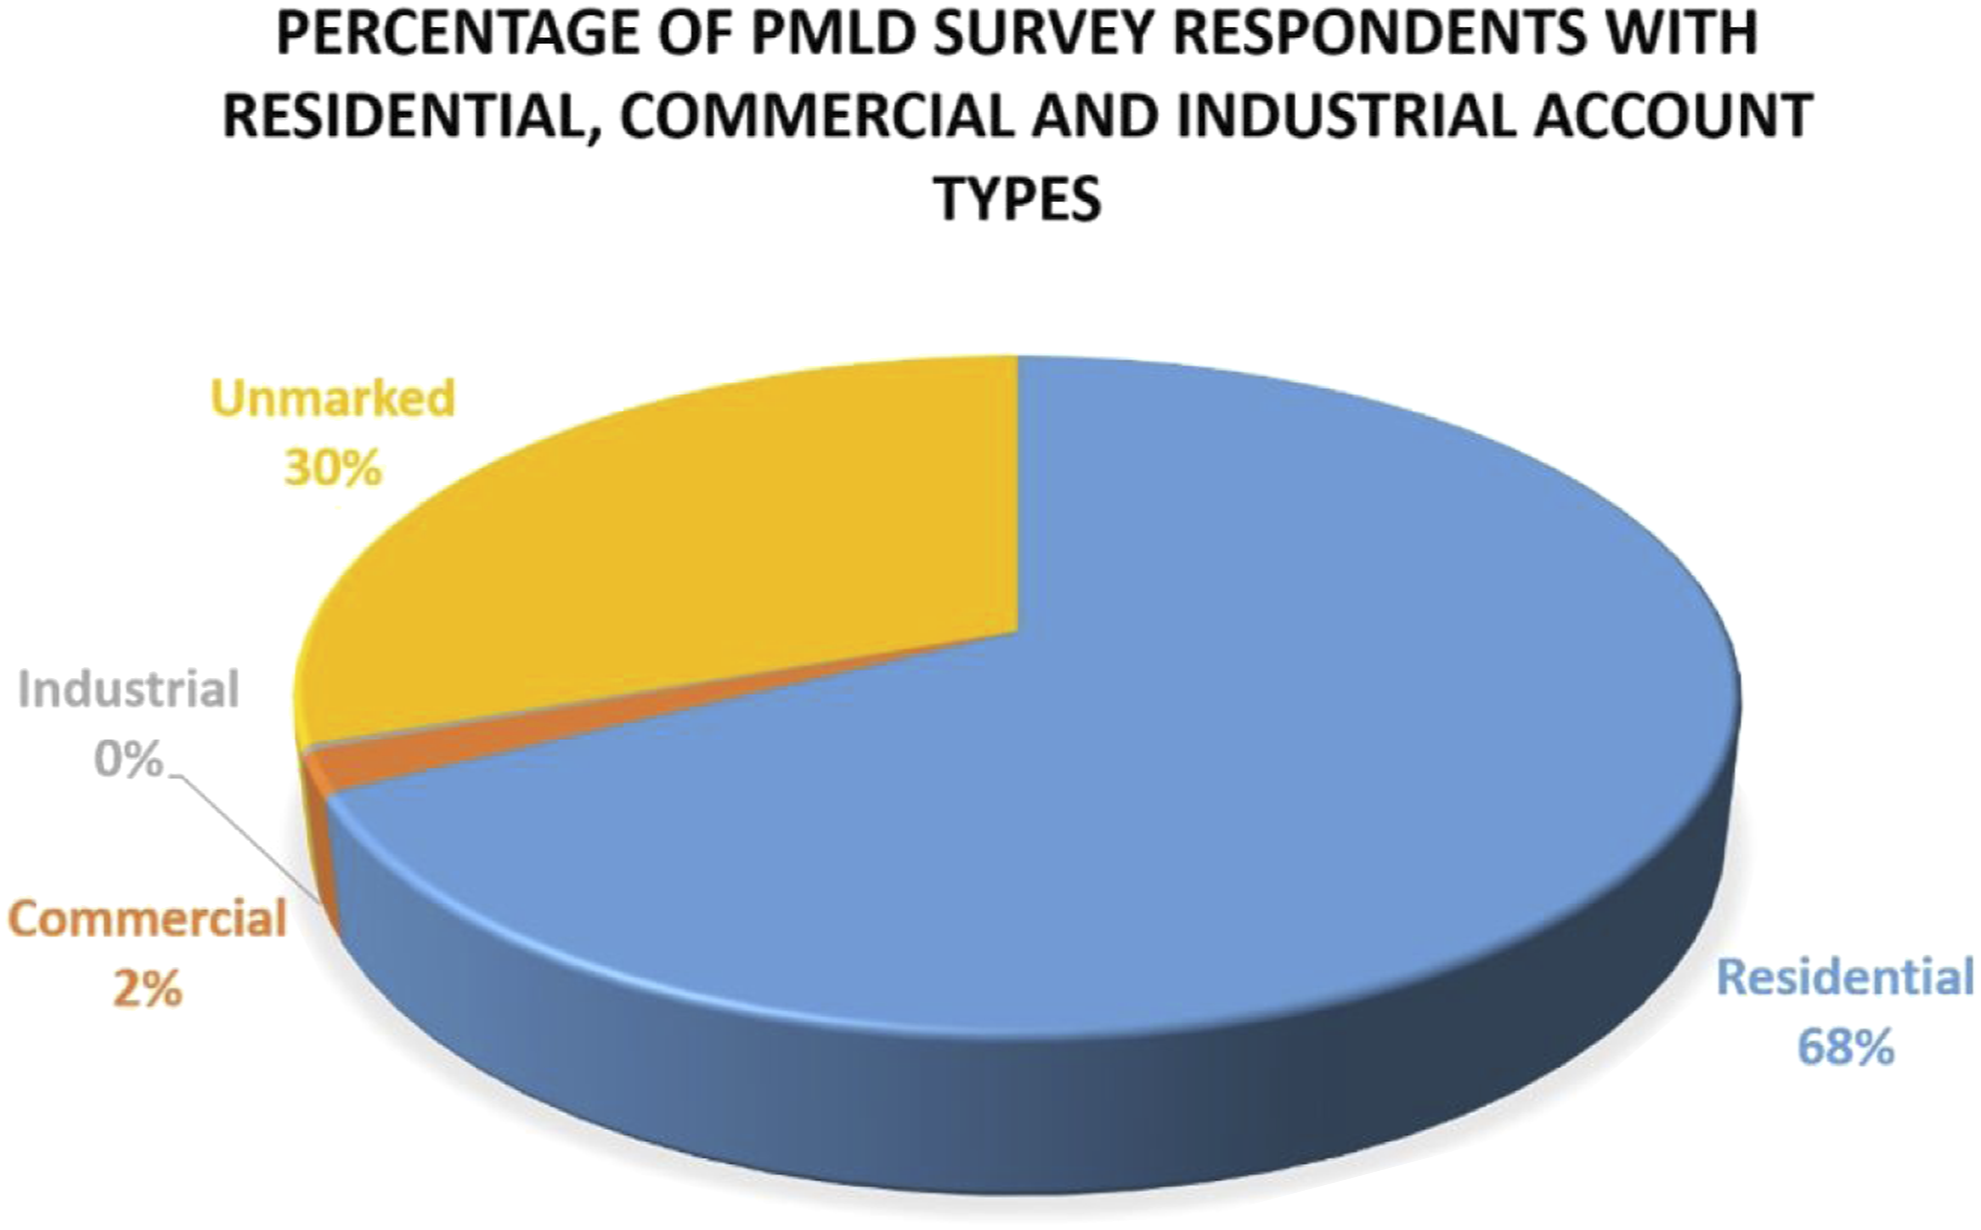
Index of Energy Literacy.
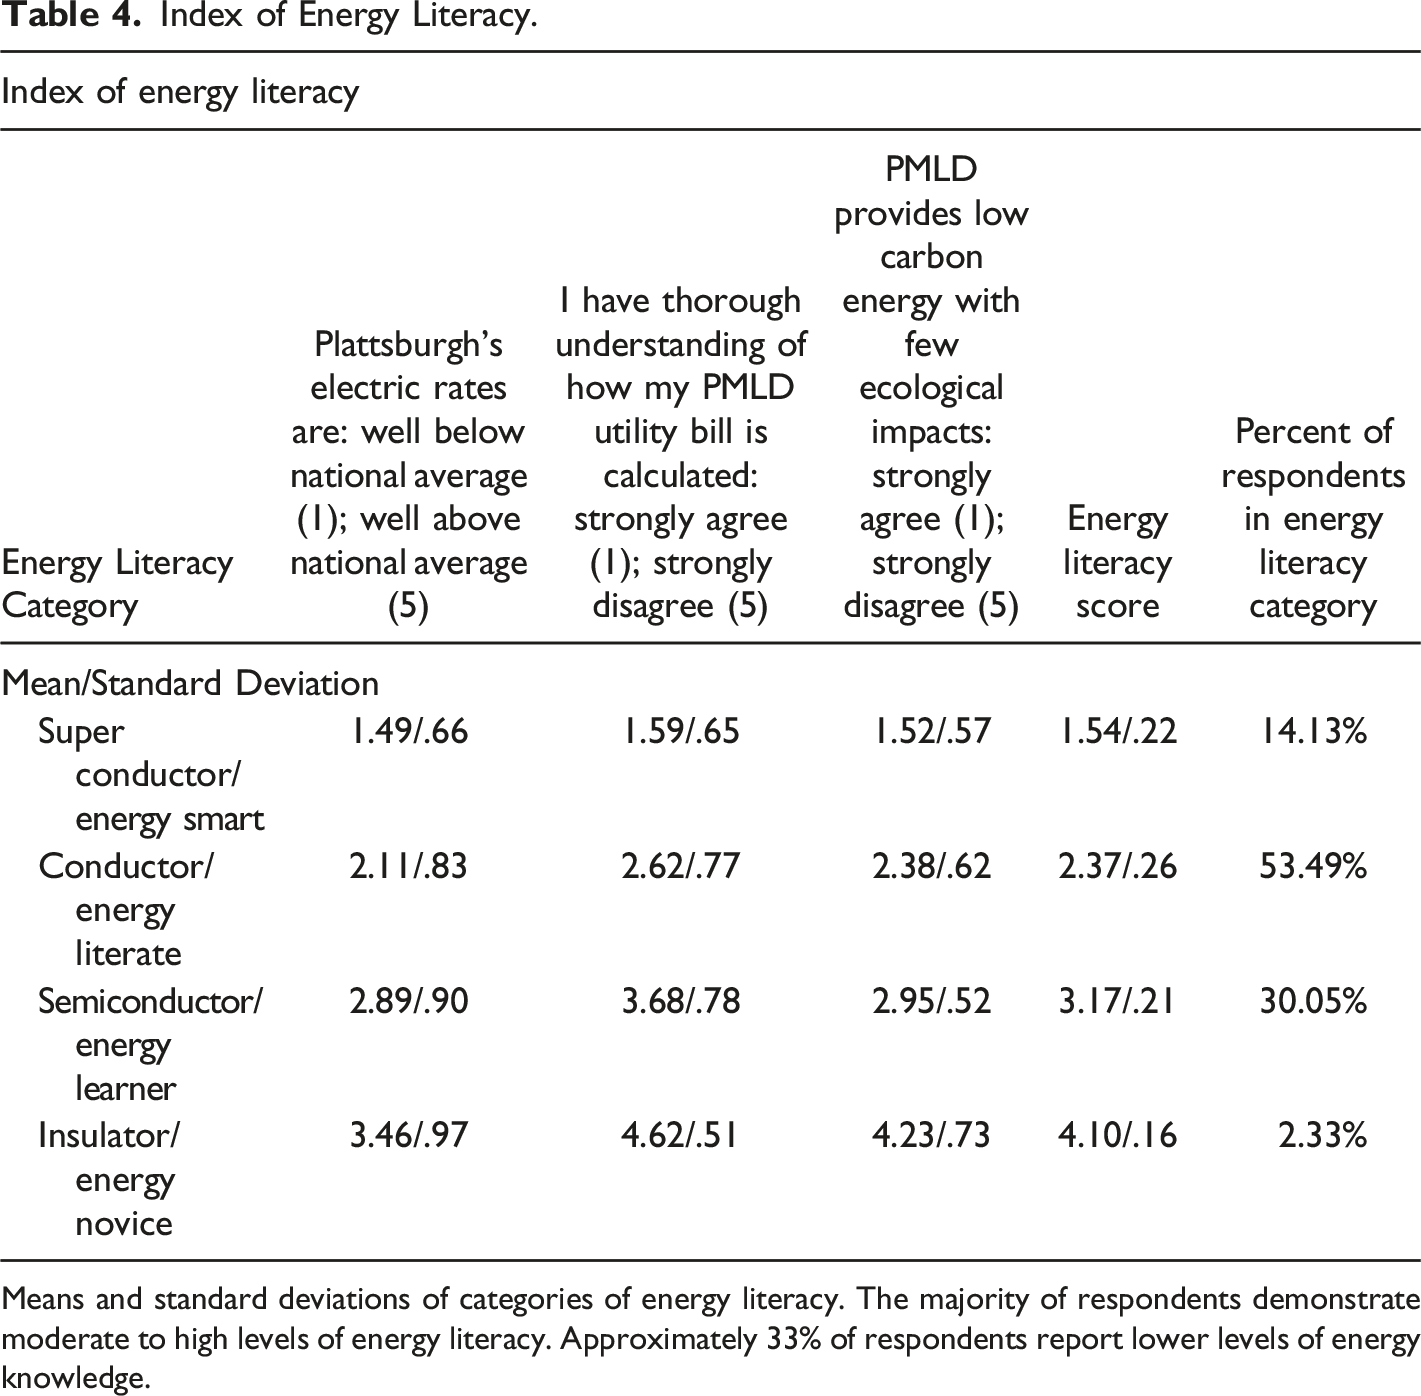
Means and standard deviations of categories of energy literacy. The majority of respondents demonstrate moderate to high levels of energy literacy. Approximately 33% of respondents report lower levels of energy knowledge.
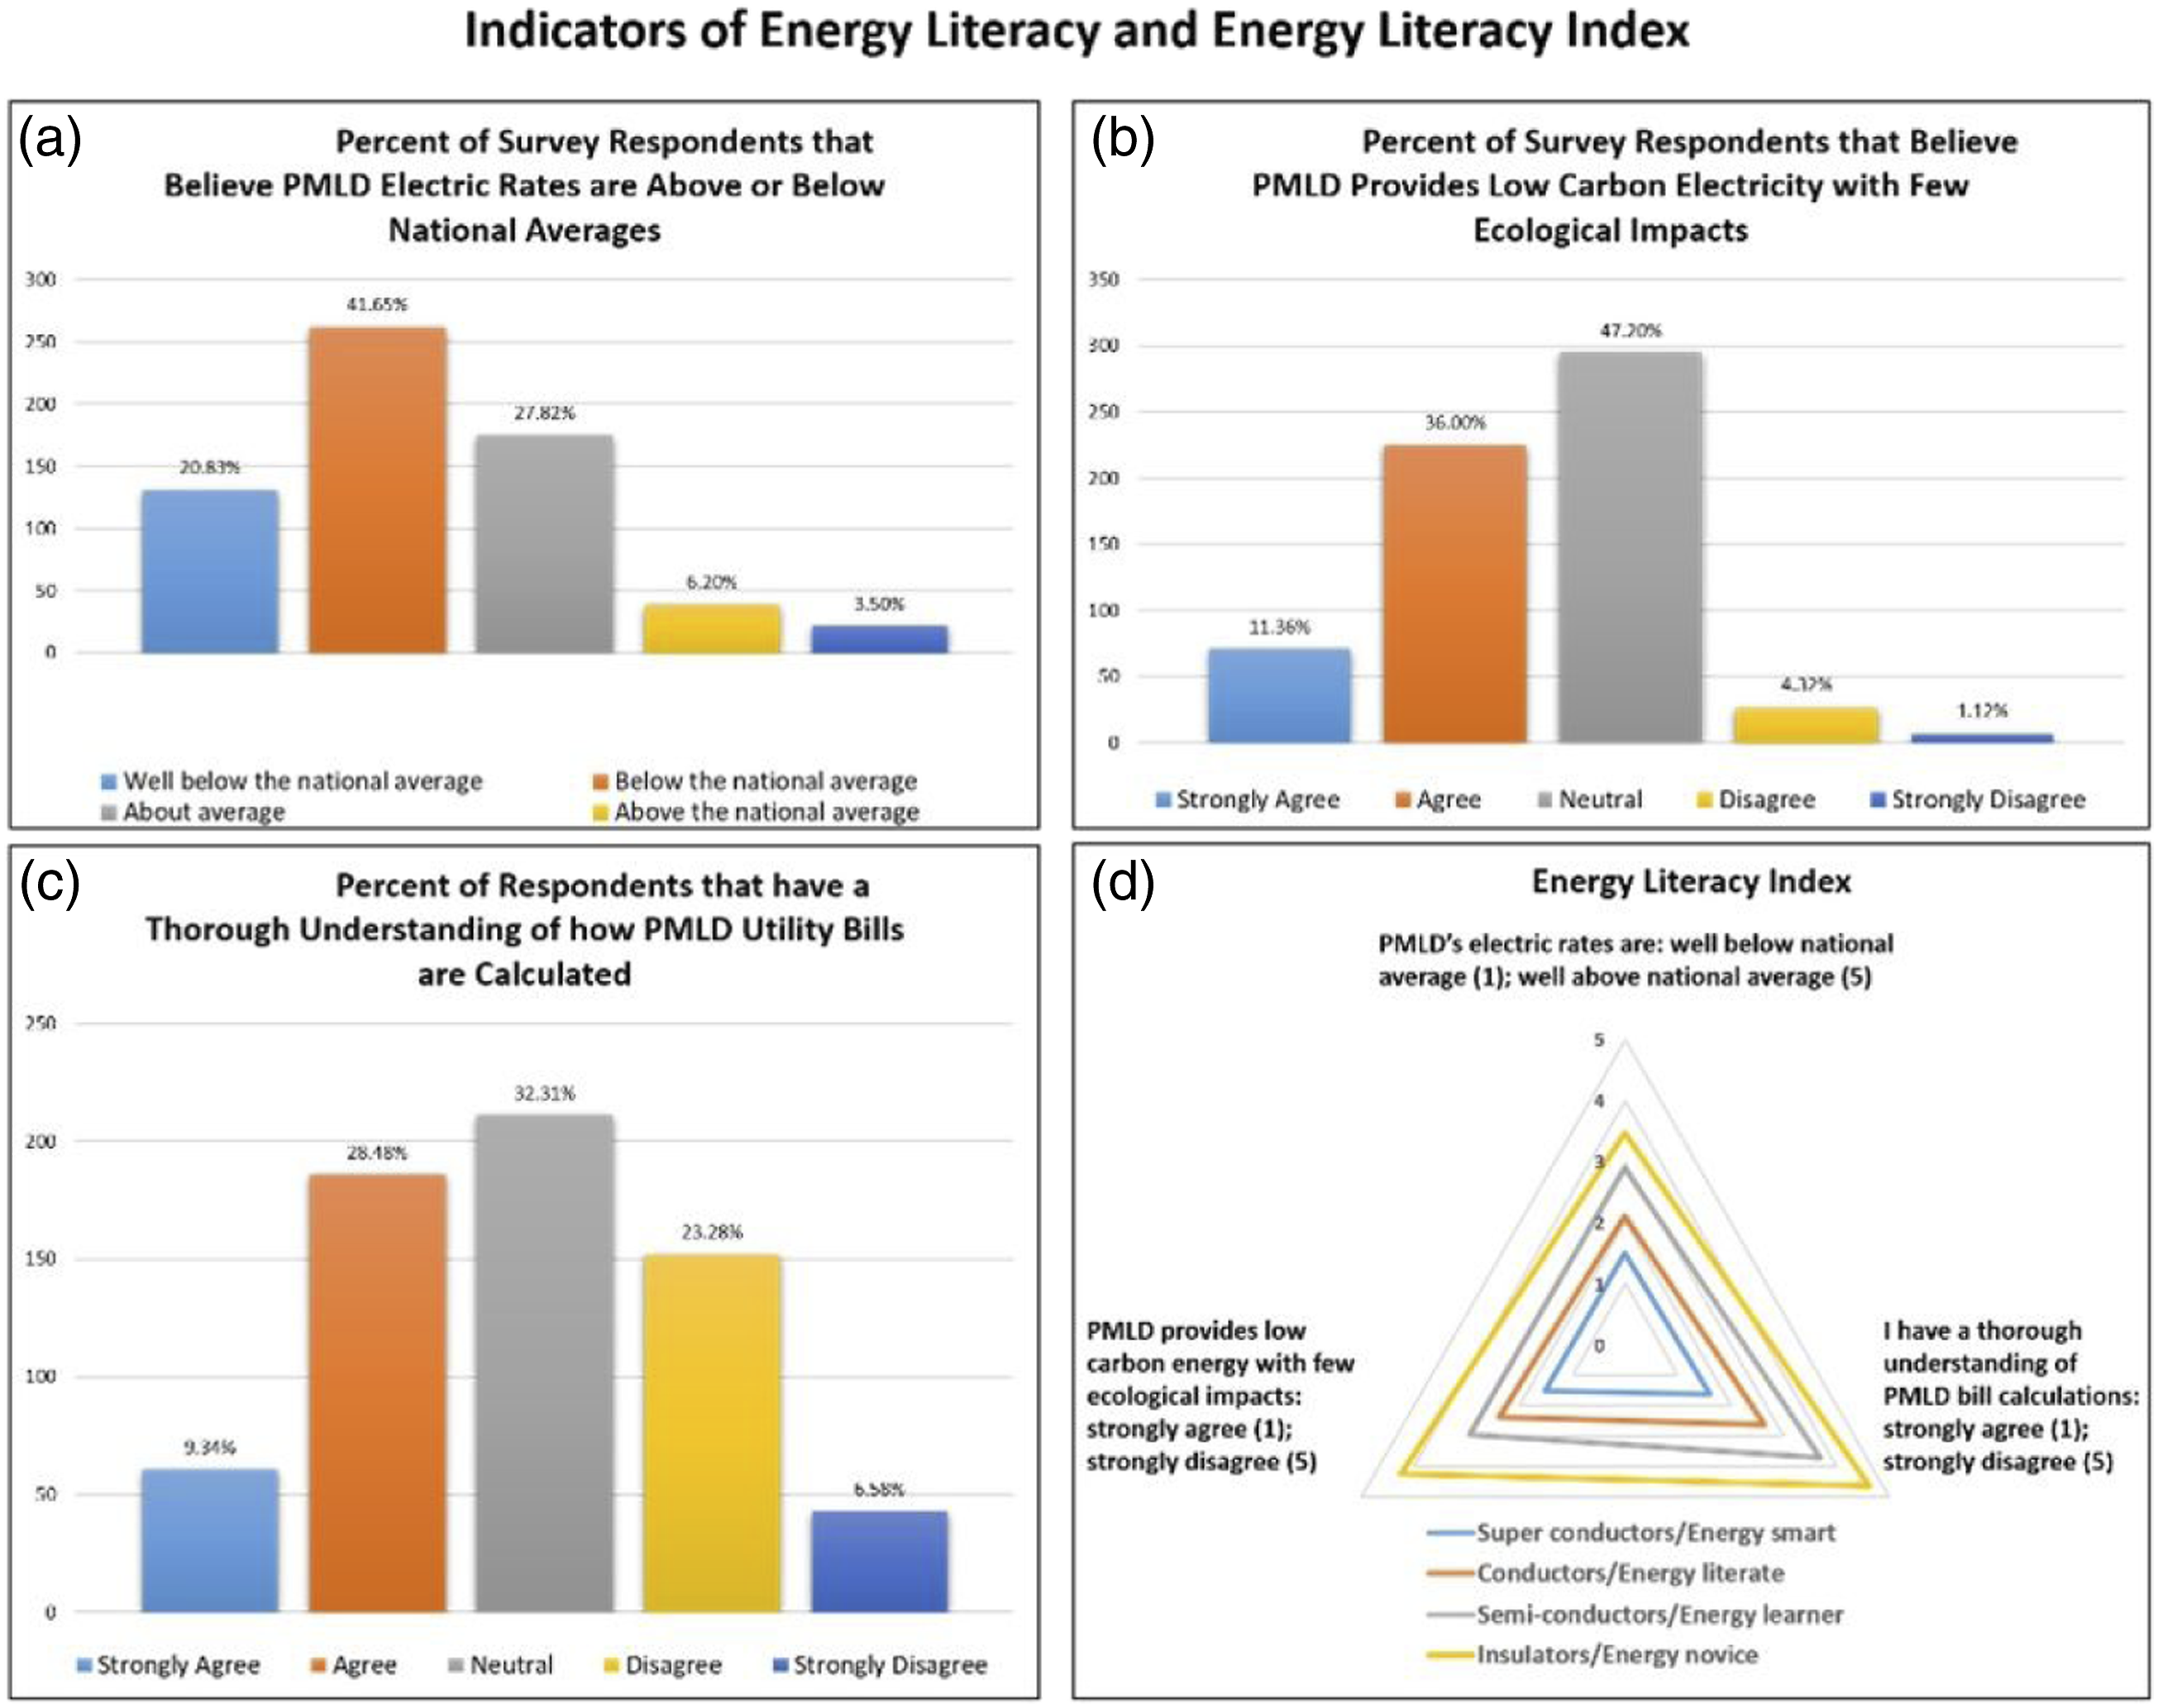
Indicators of energy literacy in plattsburgh and energy literacy index.
Figure 6 shows PMLD’s monthly customer bill. Understanding the charges, rate calculations, abbreviations, units and acronyms on the customer bill is an important component of energy literacy. PMLD’s bills include charges for electricity and water (and trash/recycling disposal for customers that opt into the city’s program), as well as administrative charges. The bill includes several undefined acronyms and codes, including the PPAC for electricity purchases above and beyond the City’s 104 MW limit on preference power. An additional undefined charge listed on bills is for the Independent Energy Efficiency Program (IEEP). This program collects a monthly fee from PMLD customers and invests the money in energy efficiency and conservation programming. Units of measurement such as KWh are also not defined on the bill. The author’s monthly PMLD bill.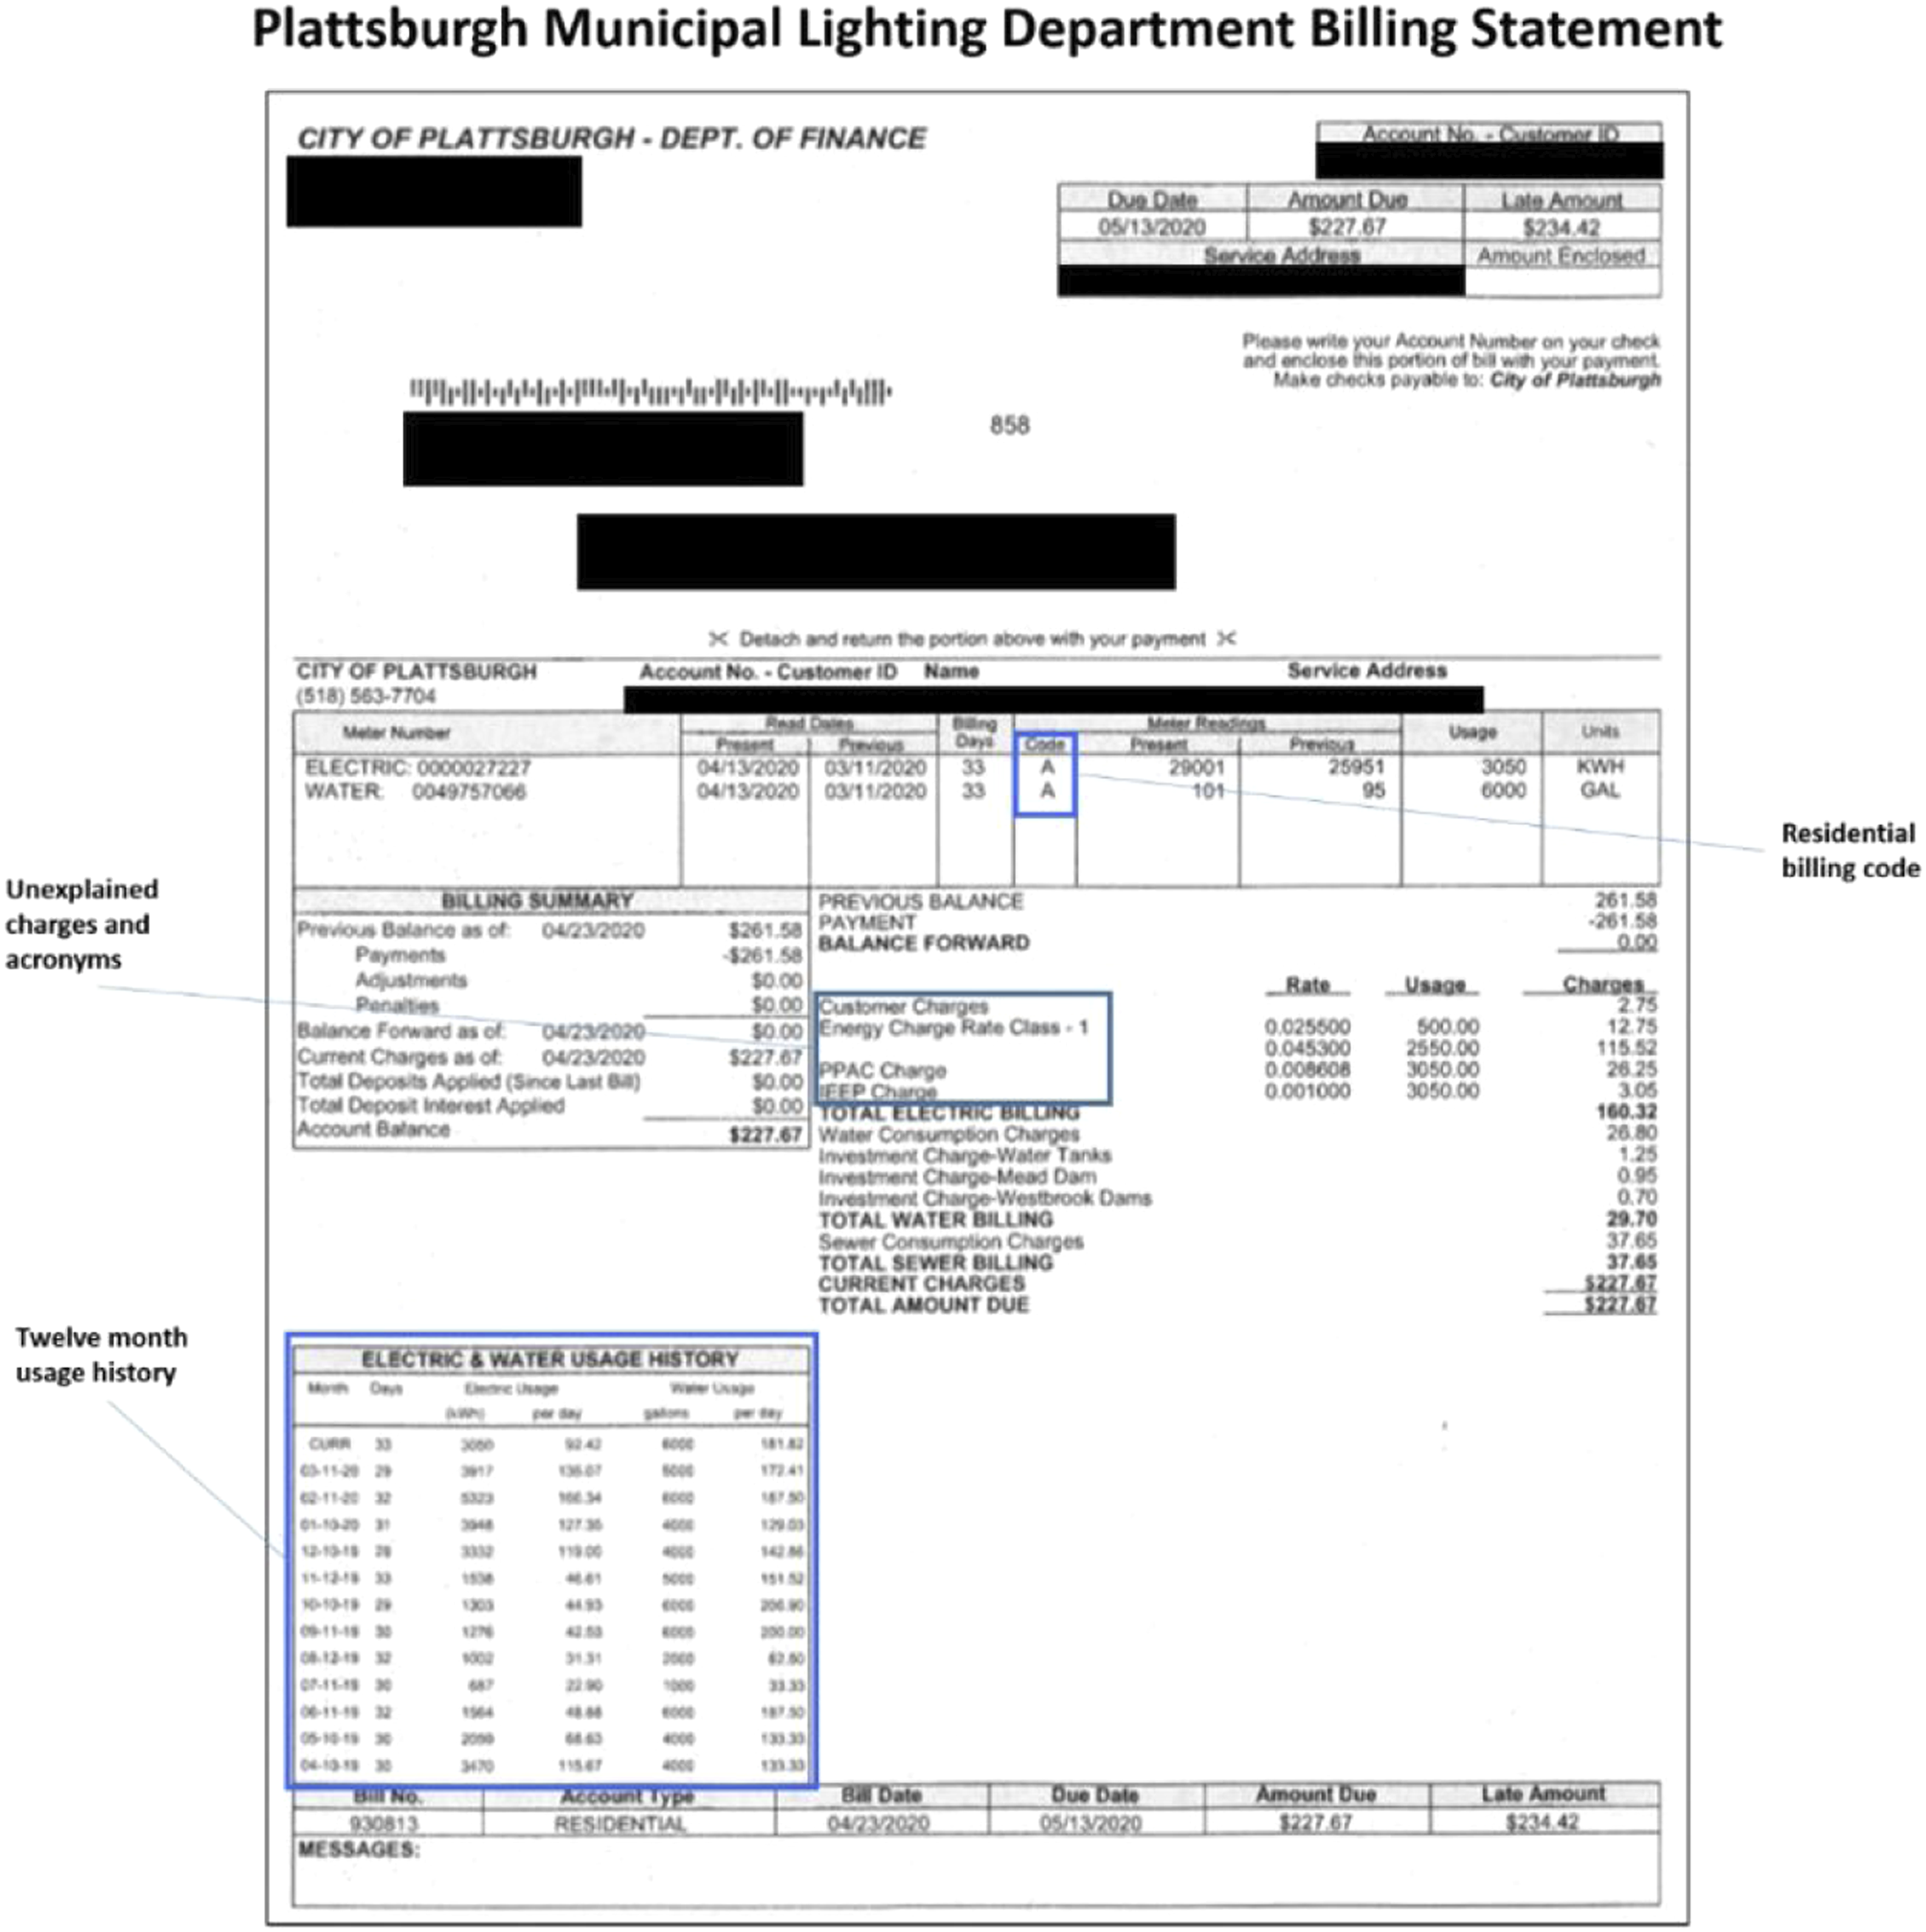
Figure 7 illustrates financial vulnerability within the PMLD membership. PMLD utility bills present a major financial burden for 8.26% of respondents, as these customers strongly agree with the statement “compared to expenses such as groceries, school and health needs, my PMLD utility bill is a major financial burden.” 24.62% agree with this statement. In total, 32.88% indicate that their PMLD utility bill presents a financial burden. 32.28% and 7.06% disagree and strongly disagree with this statement, respectively. In aggregate, 39.34% indicate their utility bill does not present a major financial burden. 27.78% report neutrally to this statement. Respondents’ indication of the financial burden from utility payments.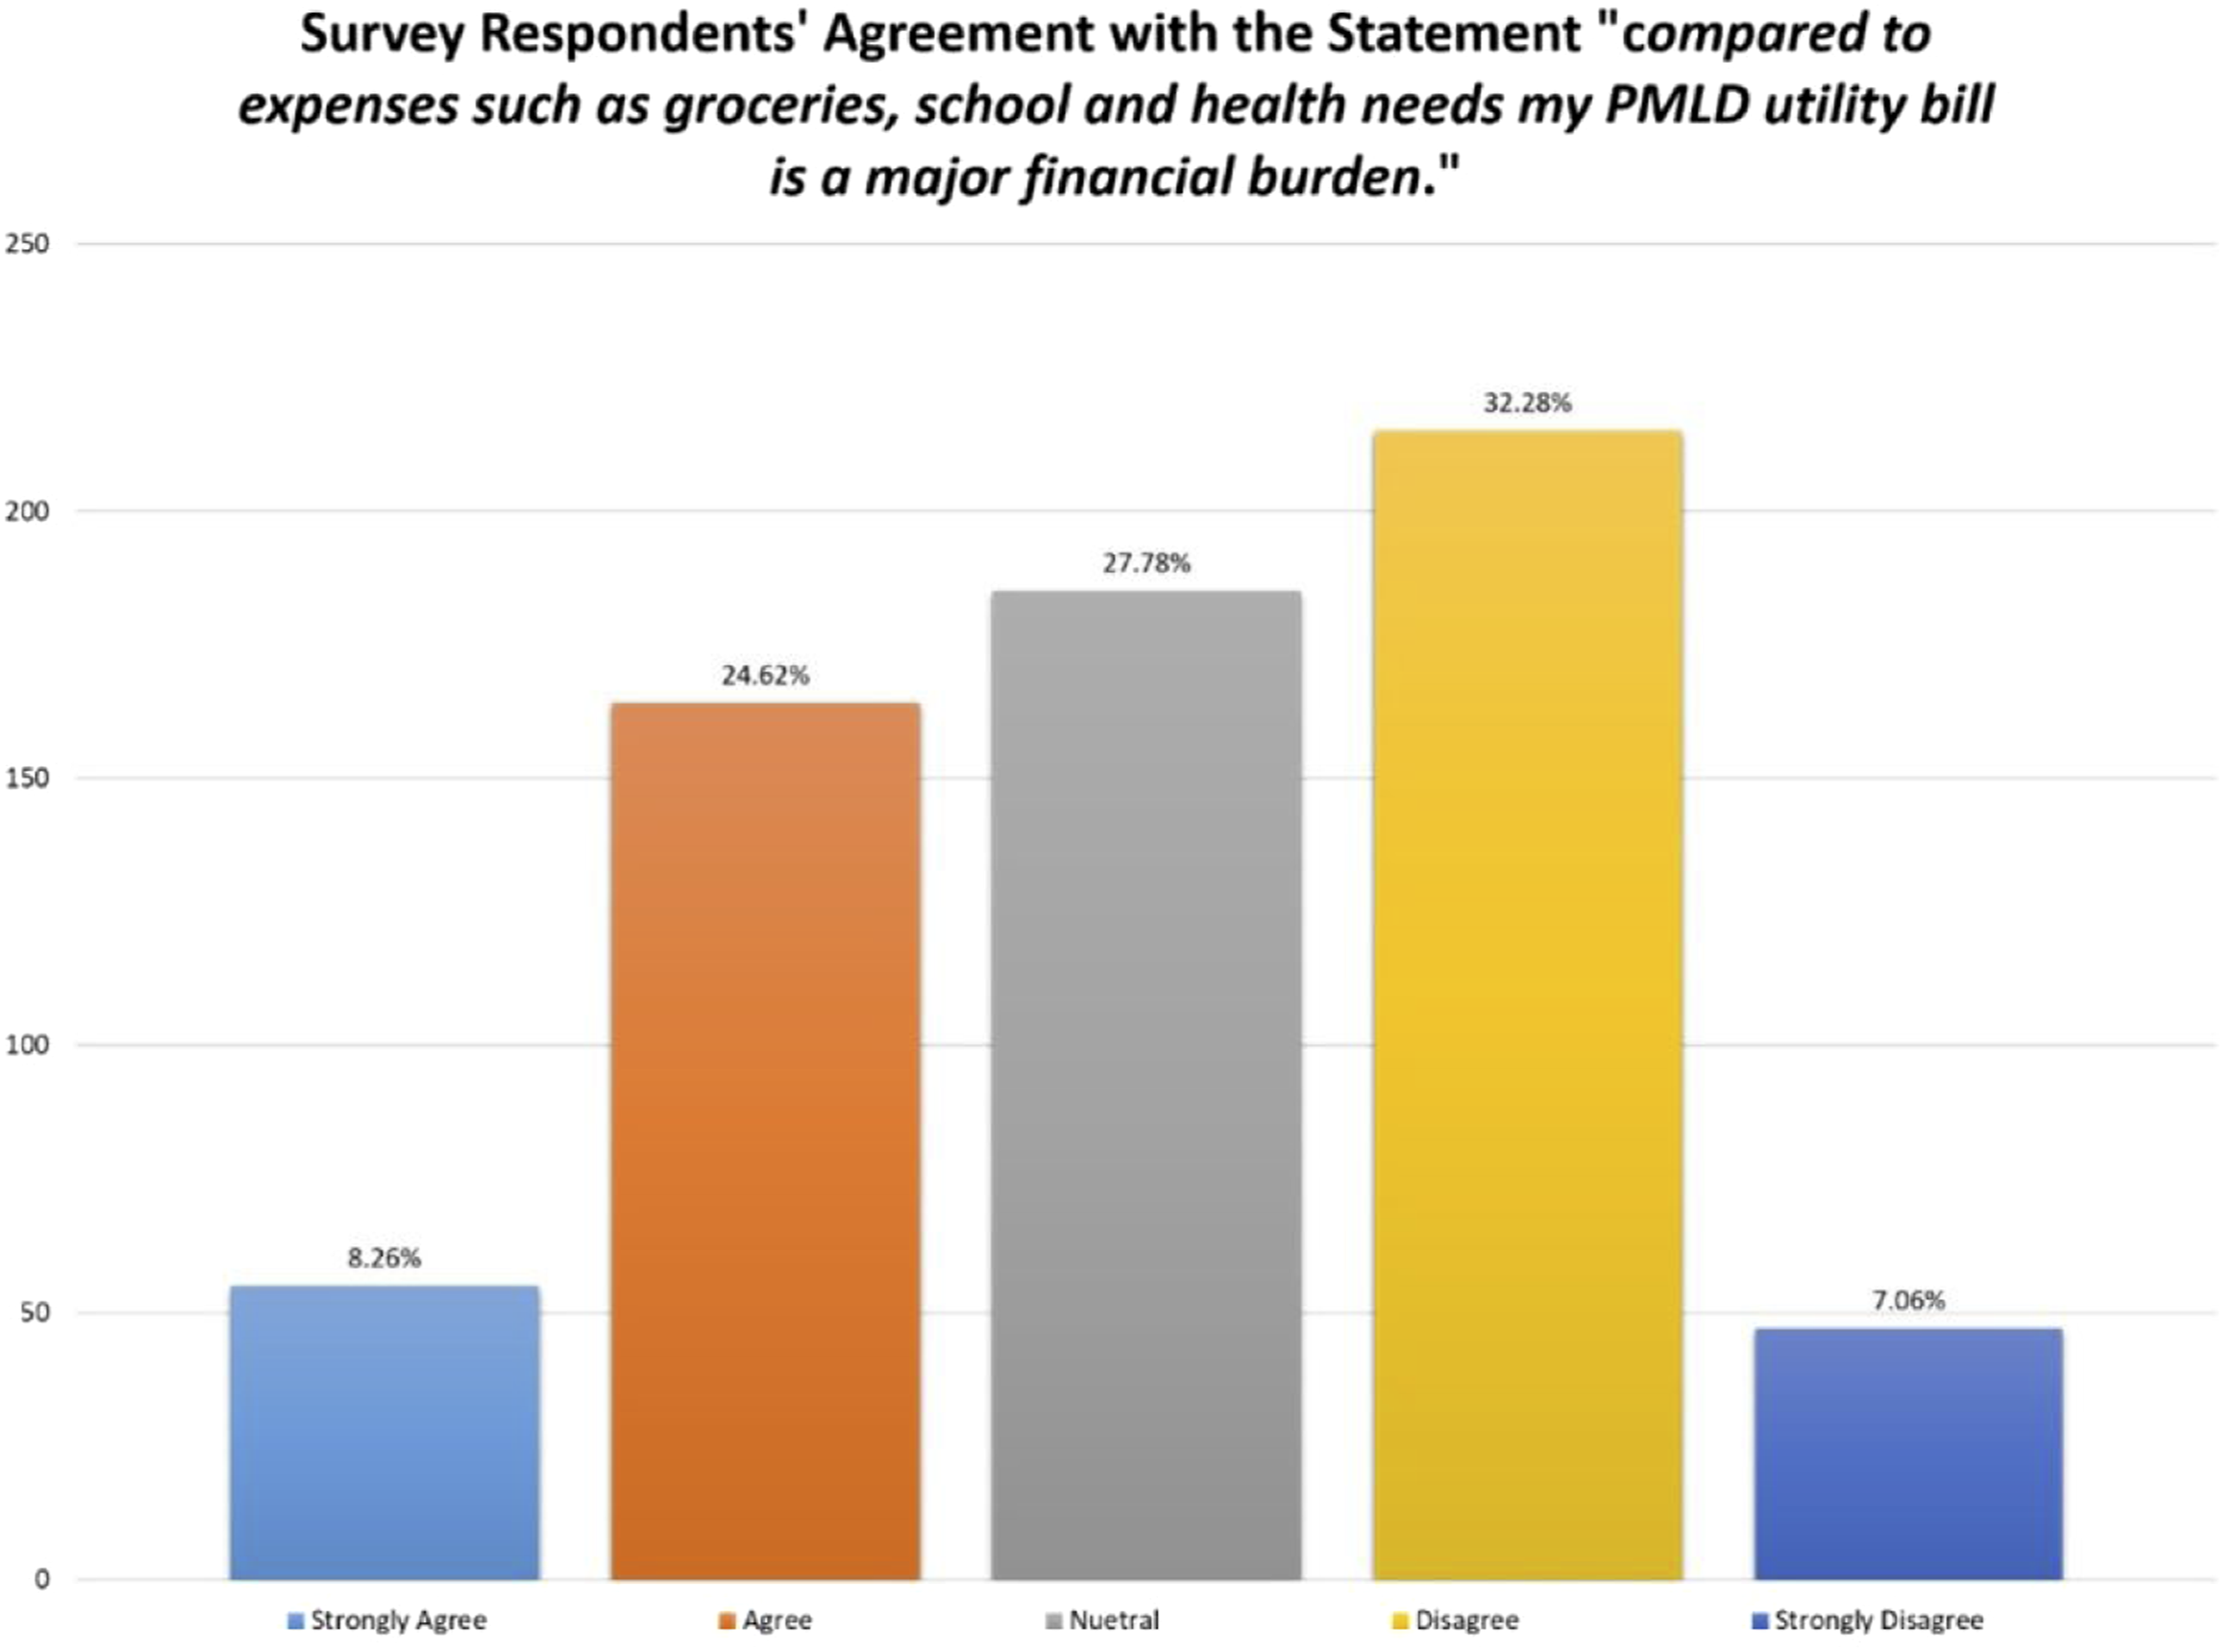
Research Question 1. How Do Energy Literacy and Financial Vulnerability Influence the Current Conservation Efforts of PMLD Account Holders?
Figure 8 shows that the vast majority of survey respondents report positive efforts toward energy conservation. 48.73% of respondents strongly agree with the statement “I try hard to conserve electricity when I can.” 47.83% agree with this statement. In total, the vast majority of survey respondents, 96.56%, report positive efforts toward energy conservation. 0.30% disagree with this statement and 3.15% report neutral responses. No respondents strongly disagreed with this statement. Survey respondents’ effort at energy conservation.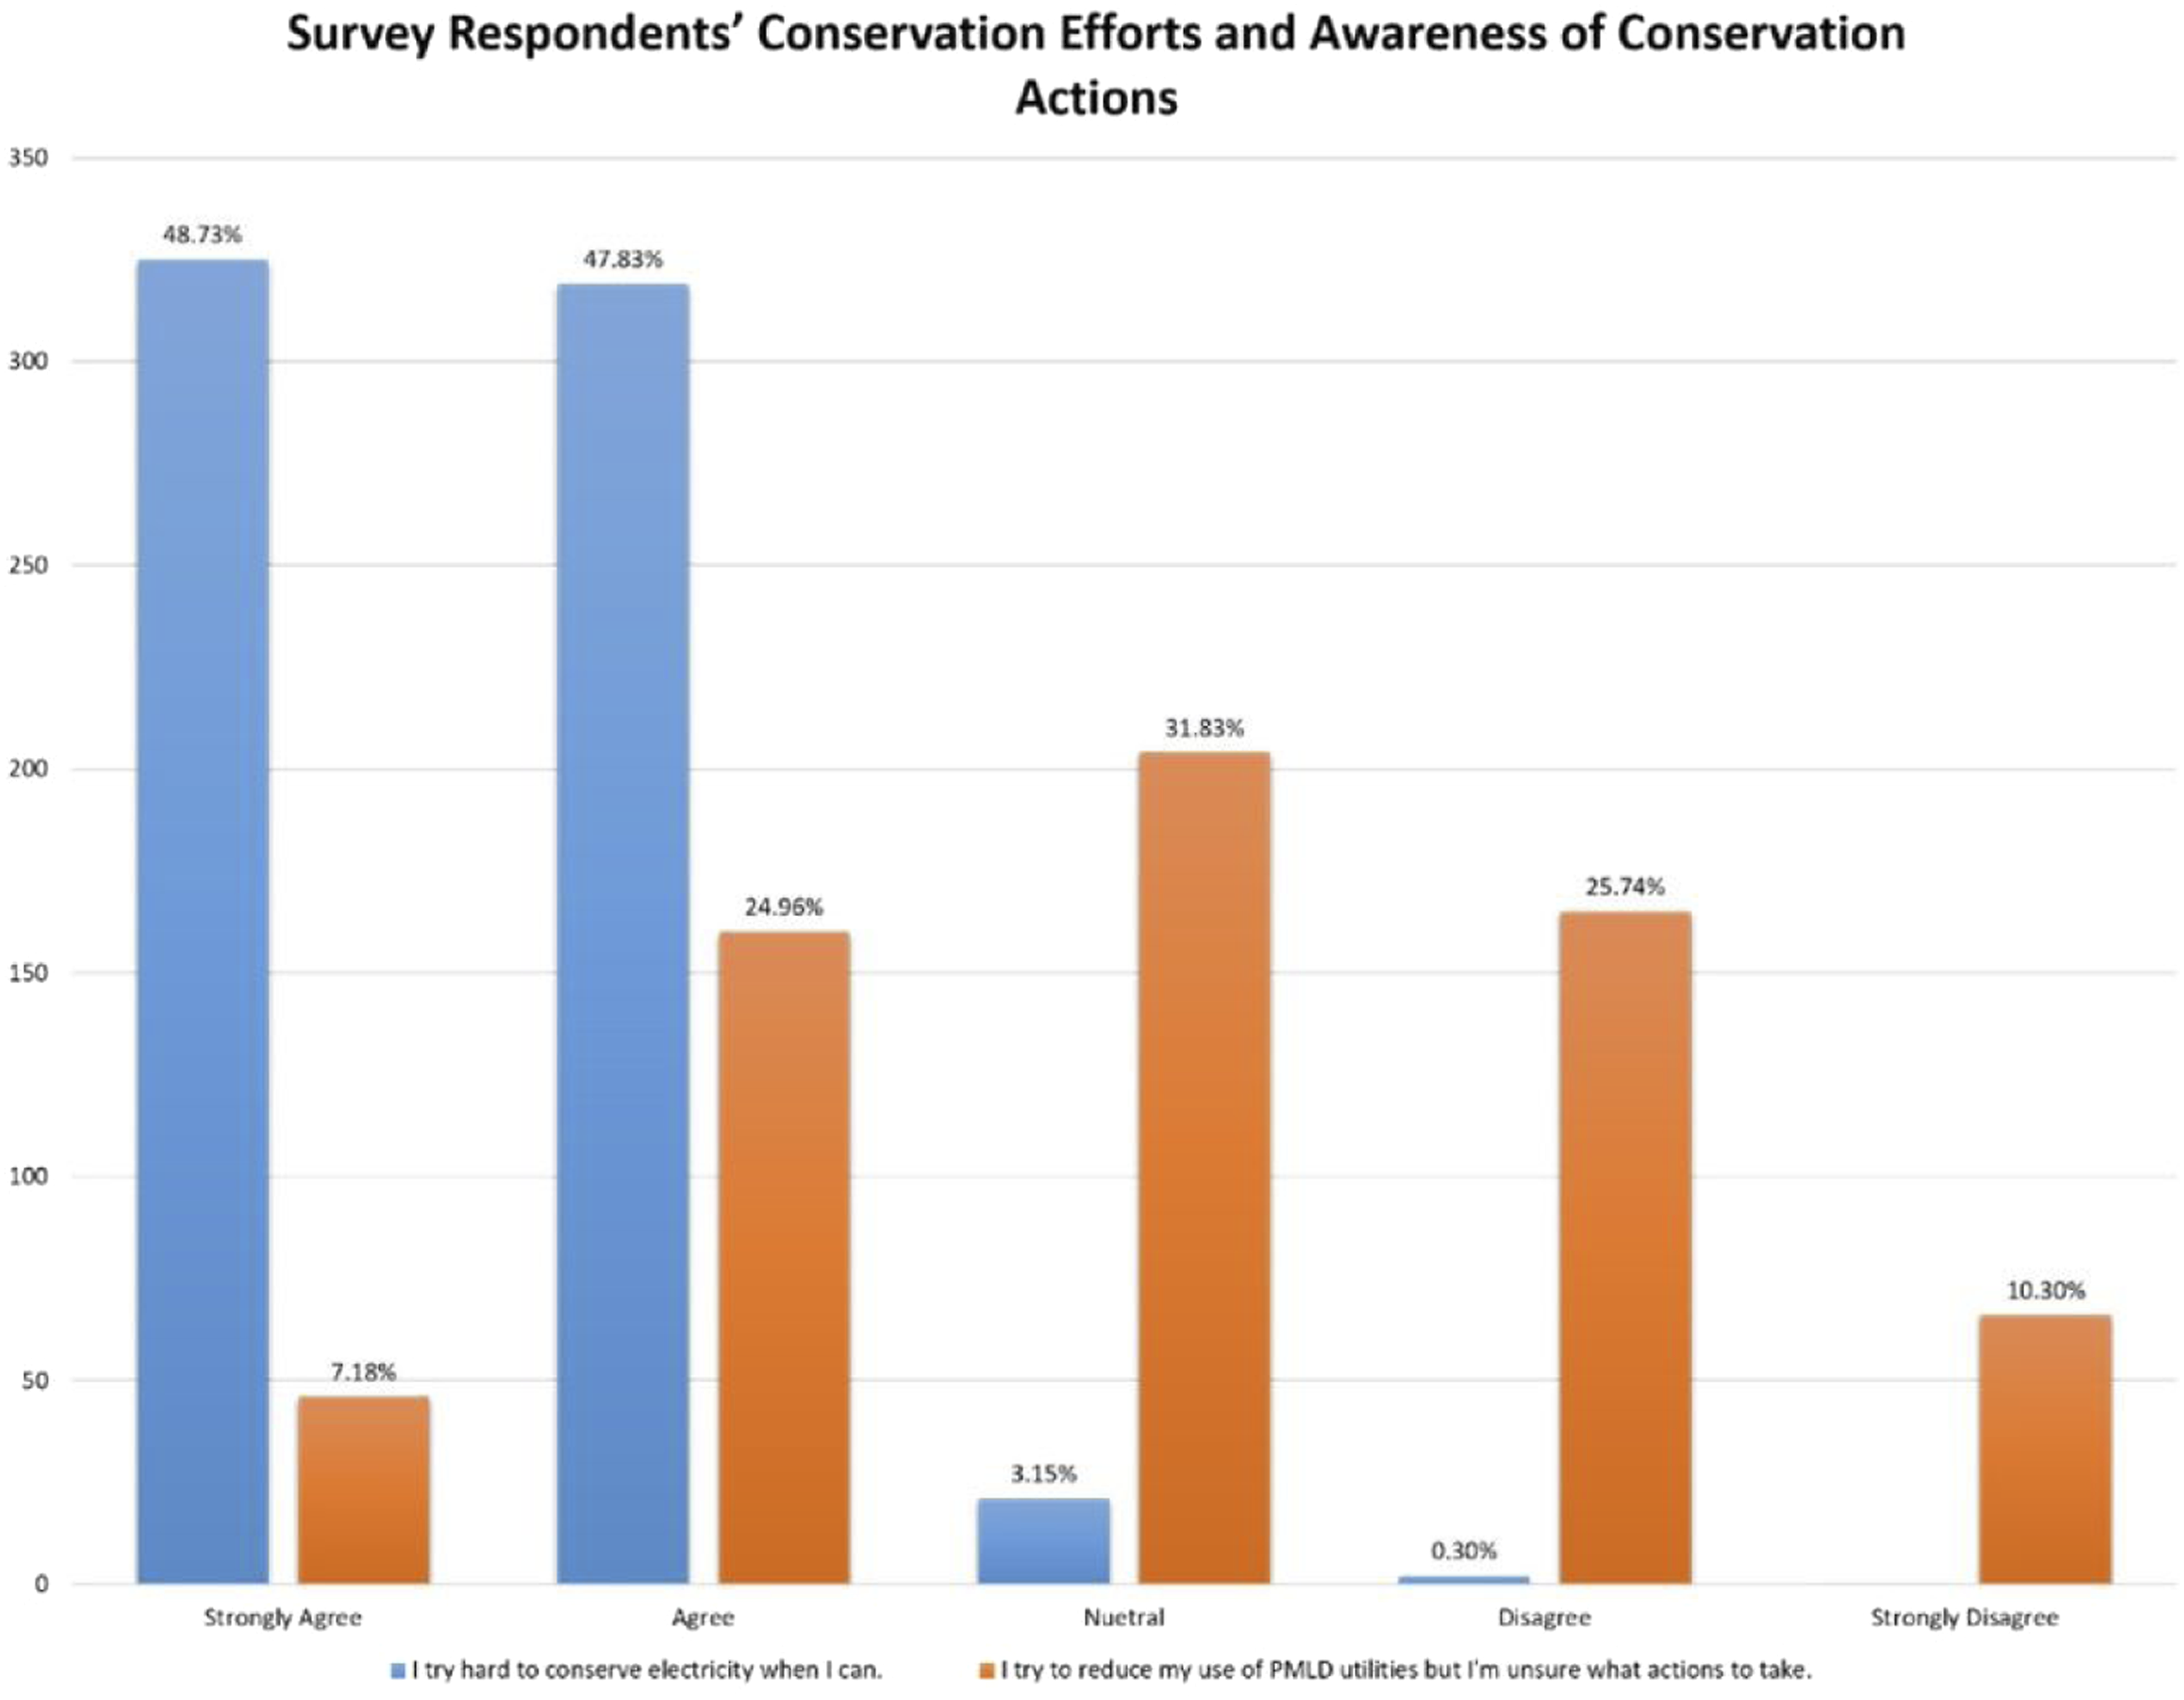
Cross Tabulation Showing Influence of Energy Literacy and Financial Vulnerability on Current Conservation Effort.
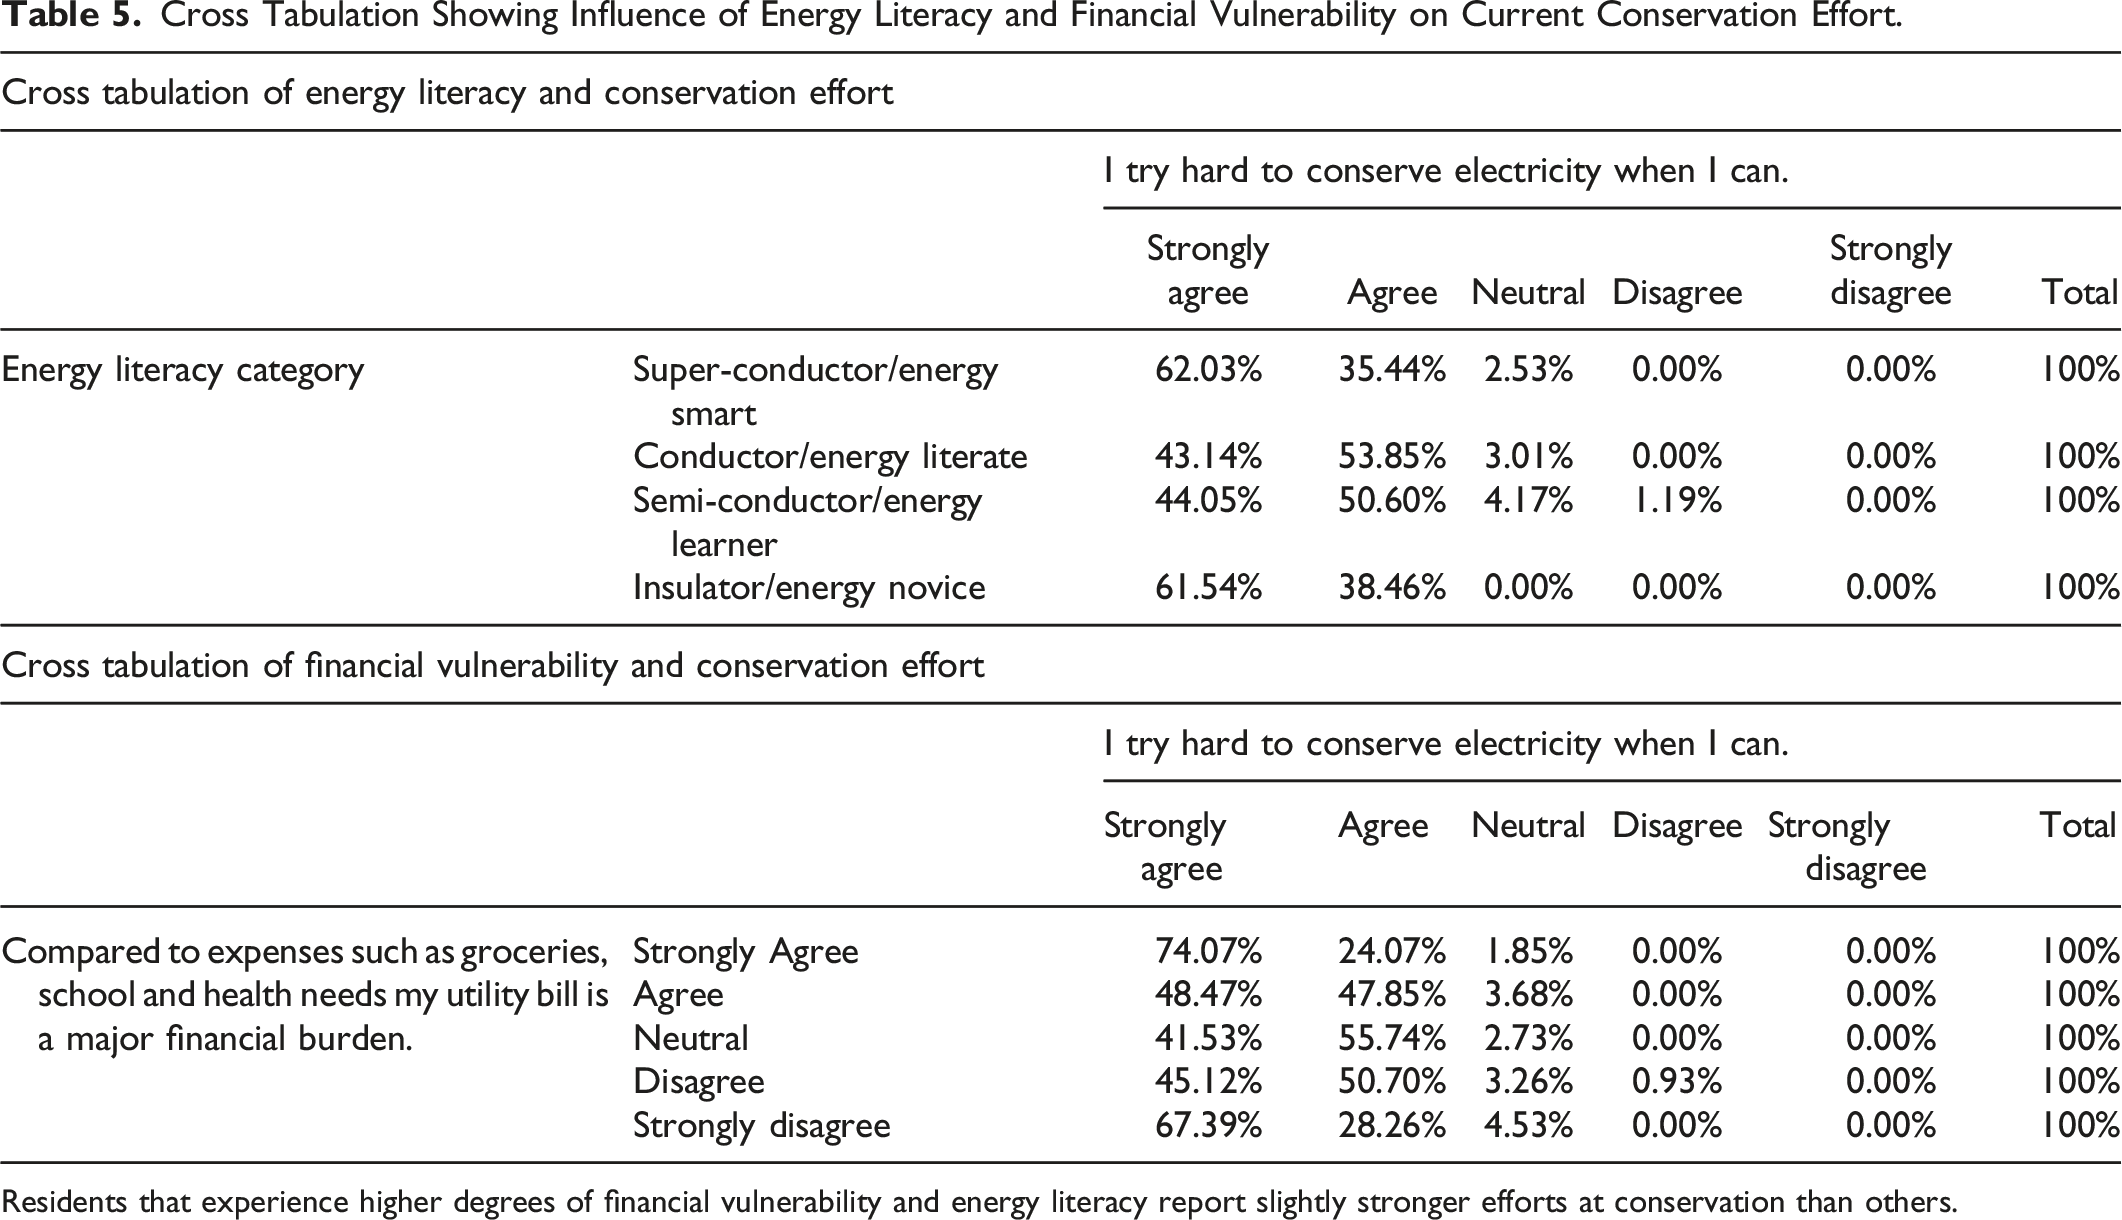
Residents that experience higher degrees of financial vulnerability and energy literacy report slightly stronger efforts at conservation than others.
Table 5 illustrates a higher degree of similarity in conservation efforts across categories of energy literacy. Among Superconductors, those respondents that indicate the highest levels of energy literacy, 62.03% strongly agree with the statement “I try hard to conserve electricity when I can.” Among Insulators, those with the lowest level of energy literacy, 61.54% strongly agree with this statement. Financial vulnerability appears to play more of a role in promoting conservation among PMLD customers than energy literacy.
Research Question 2. Will Improving the Energy Literacy of PMLD Account Holders Enhance Conservation Efforts? What Kinds of Information Will PMLD Account Holders Find Helpful in Advancing Their Conservation Efforts?
Figure 8 illustrates that many PMLD customers would like to conserve energy but are unsure what actions to take. Among the respondents that participated in the study, 7.18% strongly agree with the statement, “I try to reduce my use of PMLD utilities but I am unsure what actions to take,” while 24.96% indicate agreement. In aggregate, 32.14% affirm this statement. Respectively, 25.74% and 10.30% disagree and strongly disagree, for an aggregate response of 36.04%. 31.83% report a neutral response.
The survey inquired about the kinds of information PMLD account holders might find helpful in reducing their consumption of energy. Figure 9 illustrates the six categories of information included in the survey, and respondents’ perceptions of whether these types of information would assist in motivating behavioral changes. The survey did not ask respondents to rank or compare these choices against one another. The survey asked respondents to rate all of the sources of information presented on a scale of 1–5 (very important-very unimportant, with choice three representing a neutral option). Types of information respondents’ find useful for improving conservation actions.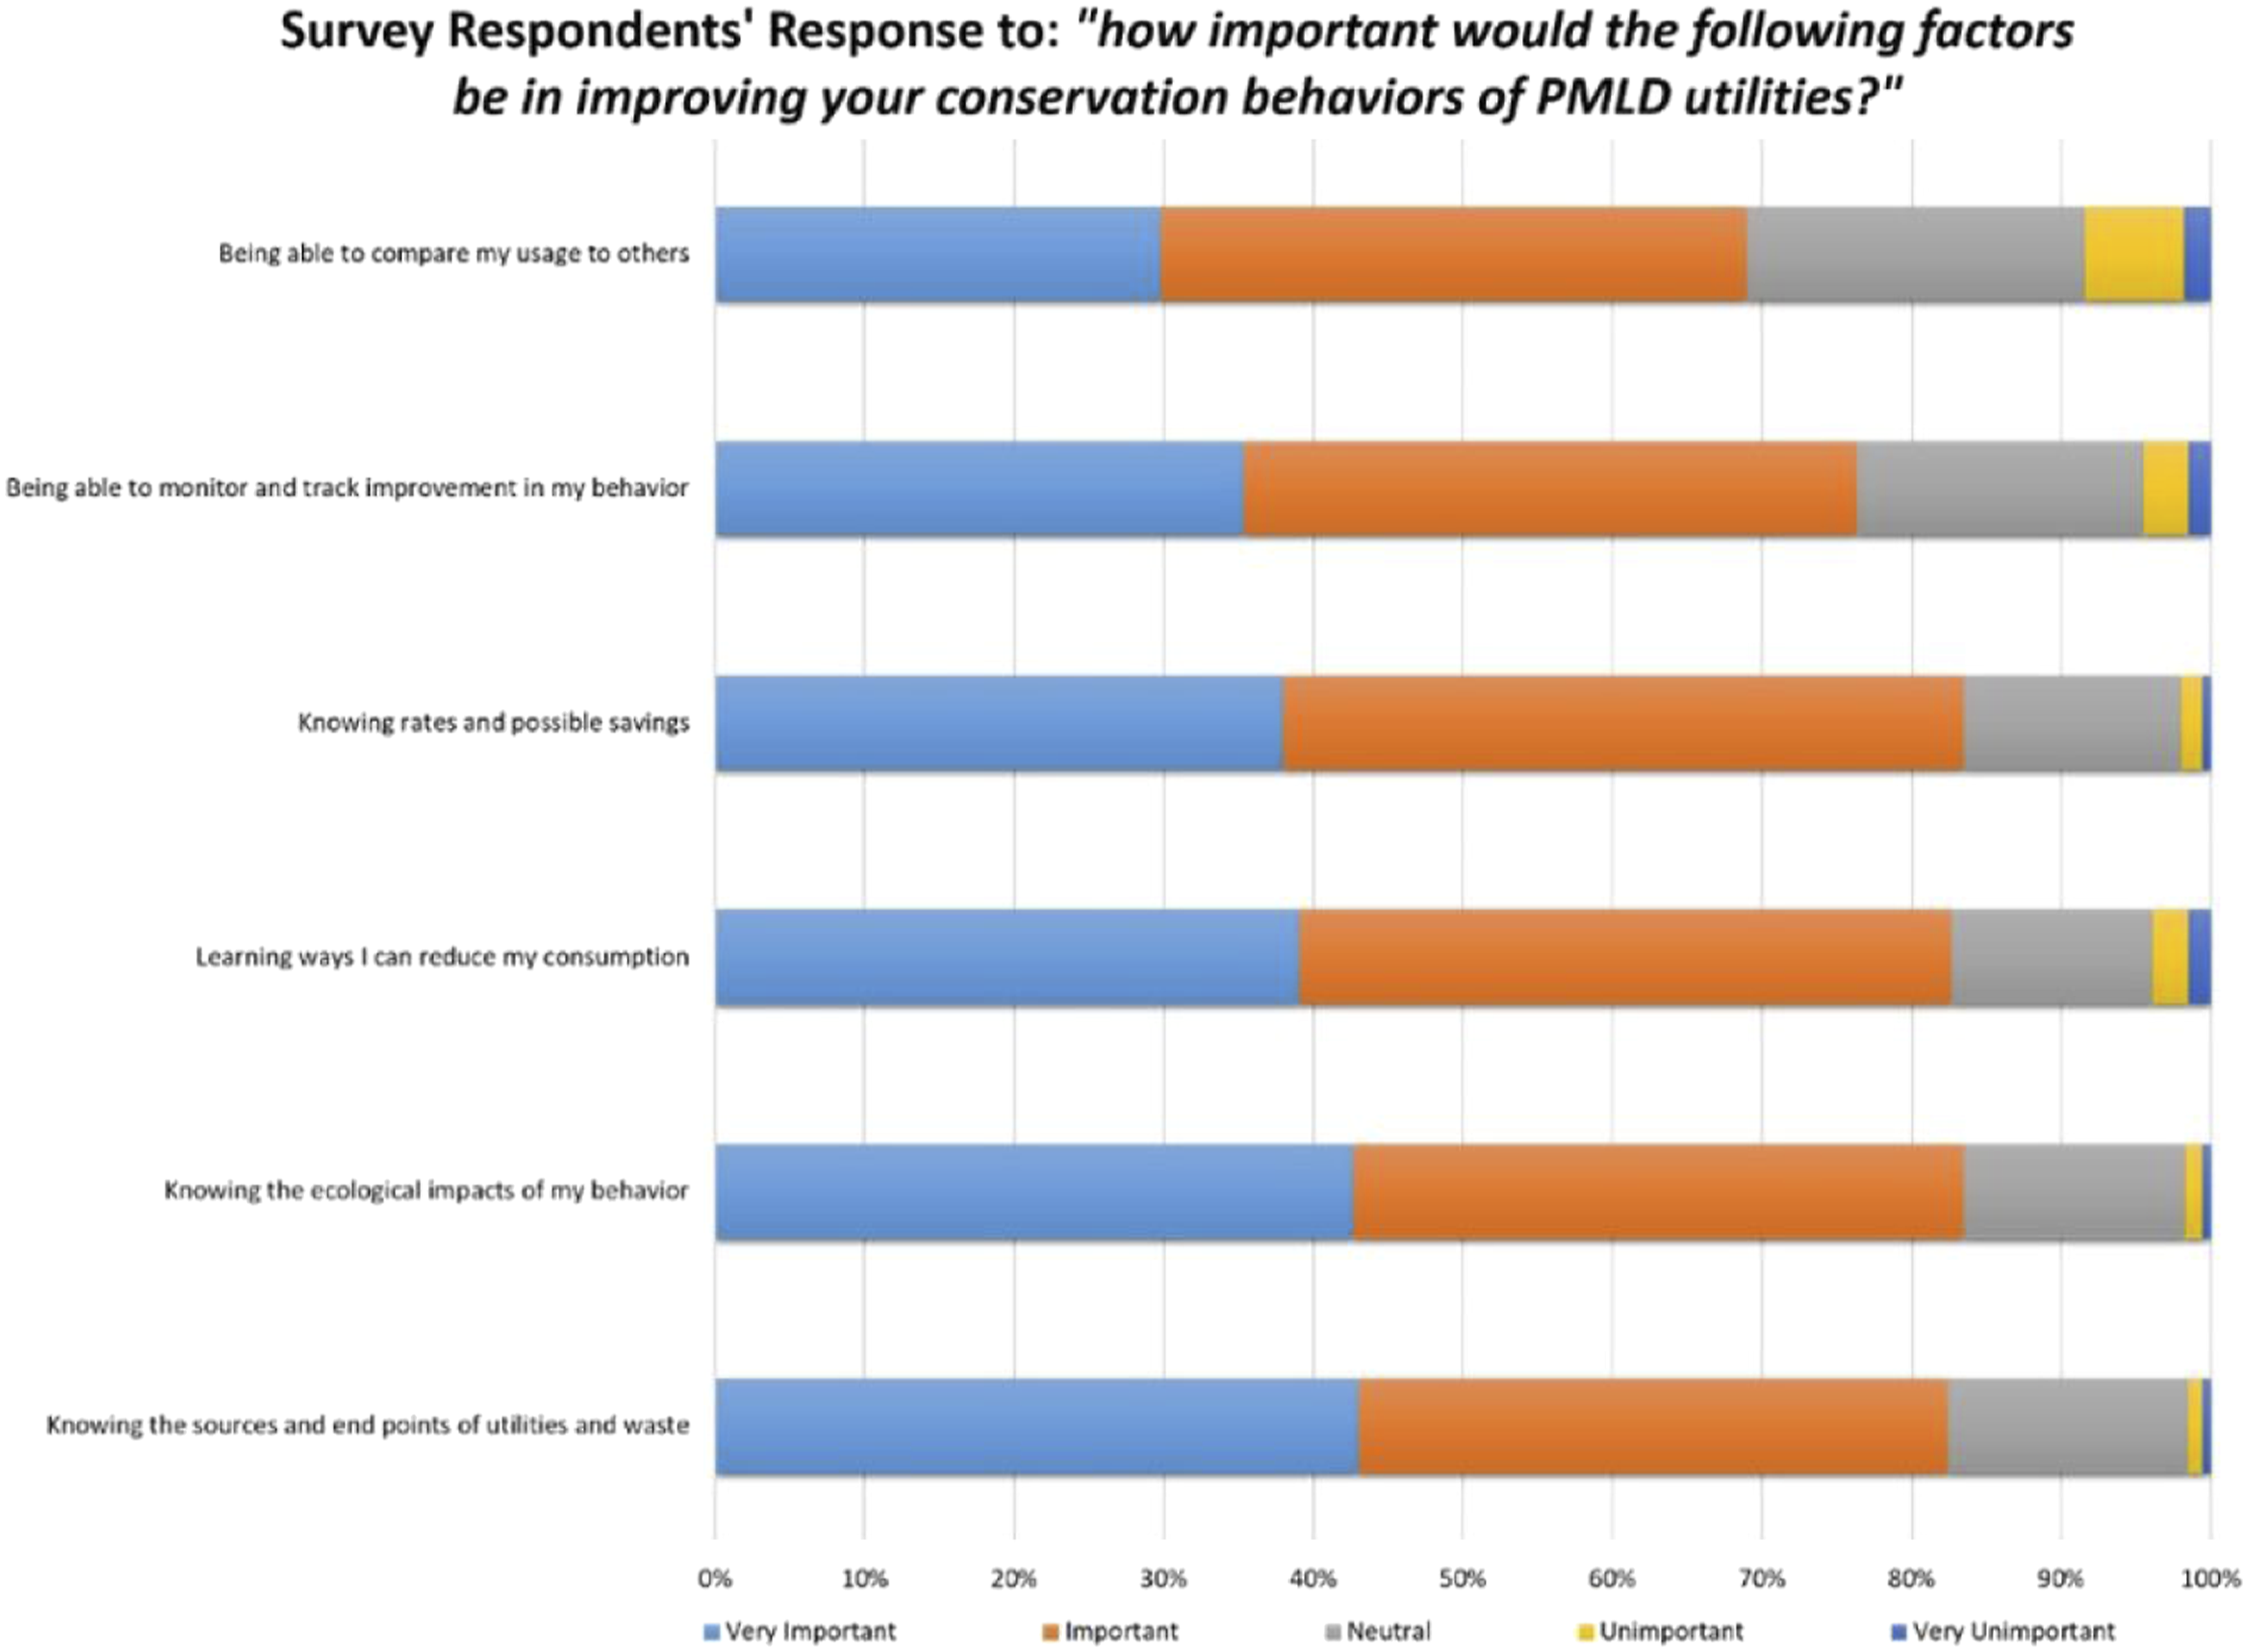
Types of Information Identified as Very Important for Motivating Conservation Behaviors by Select Respondents.
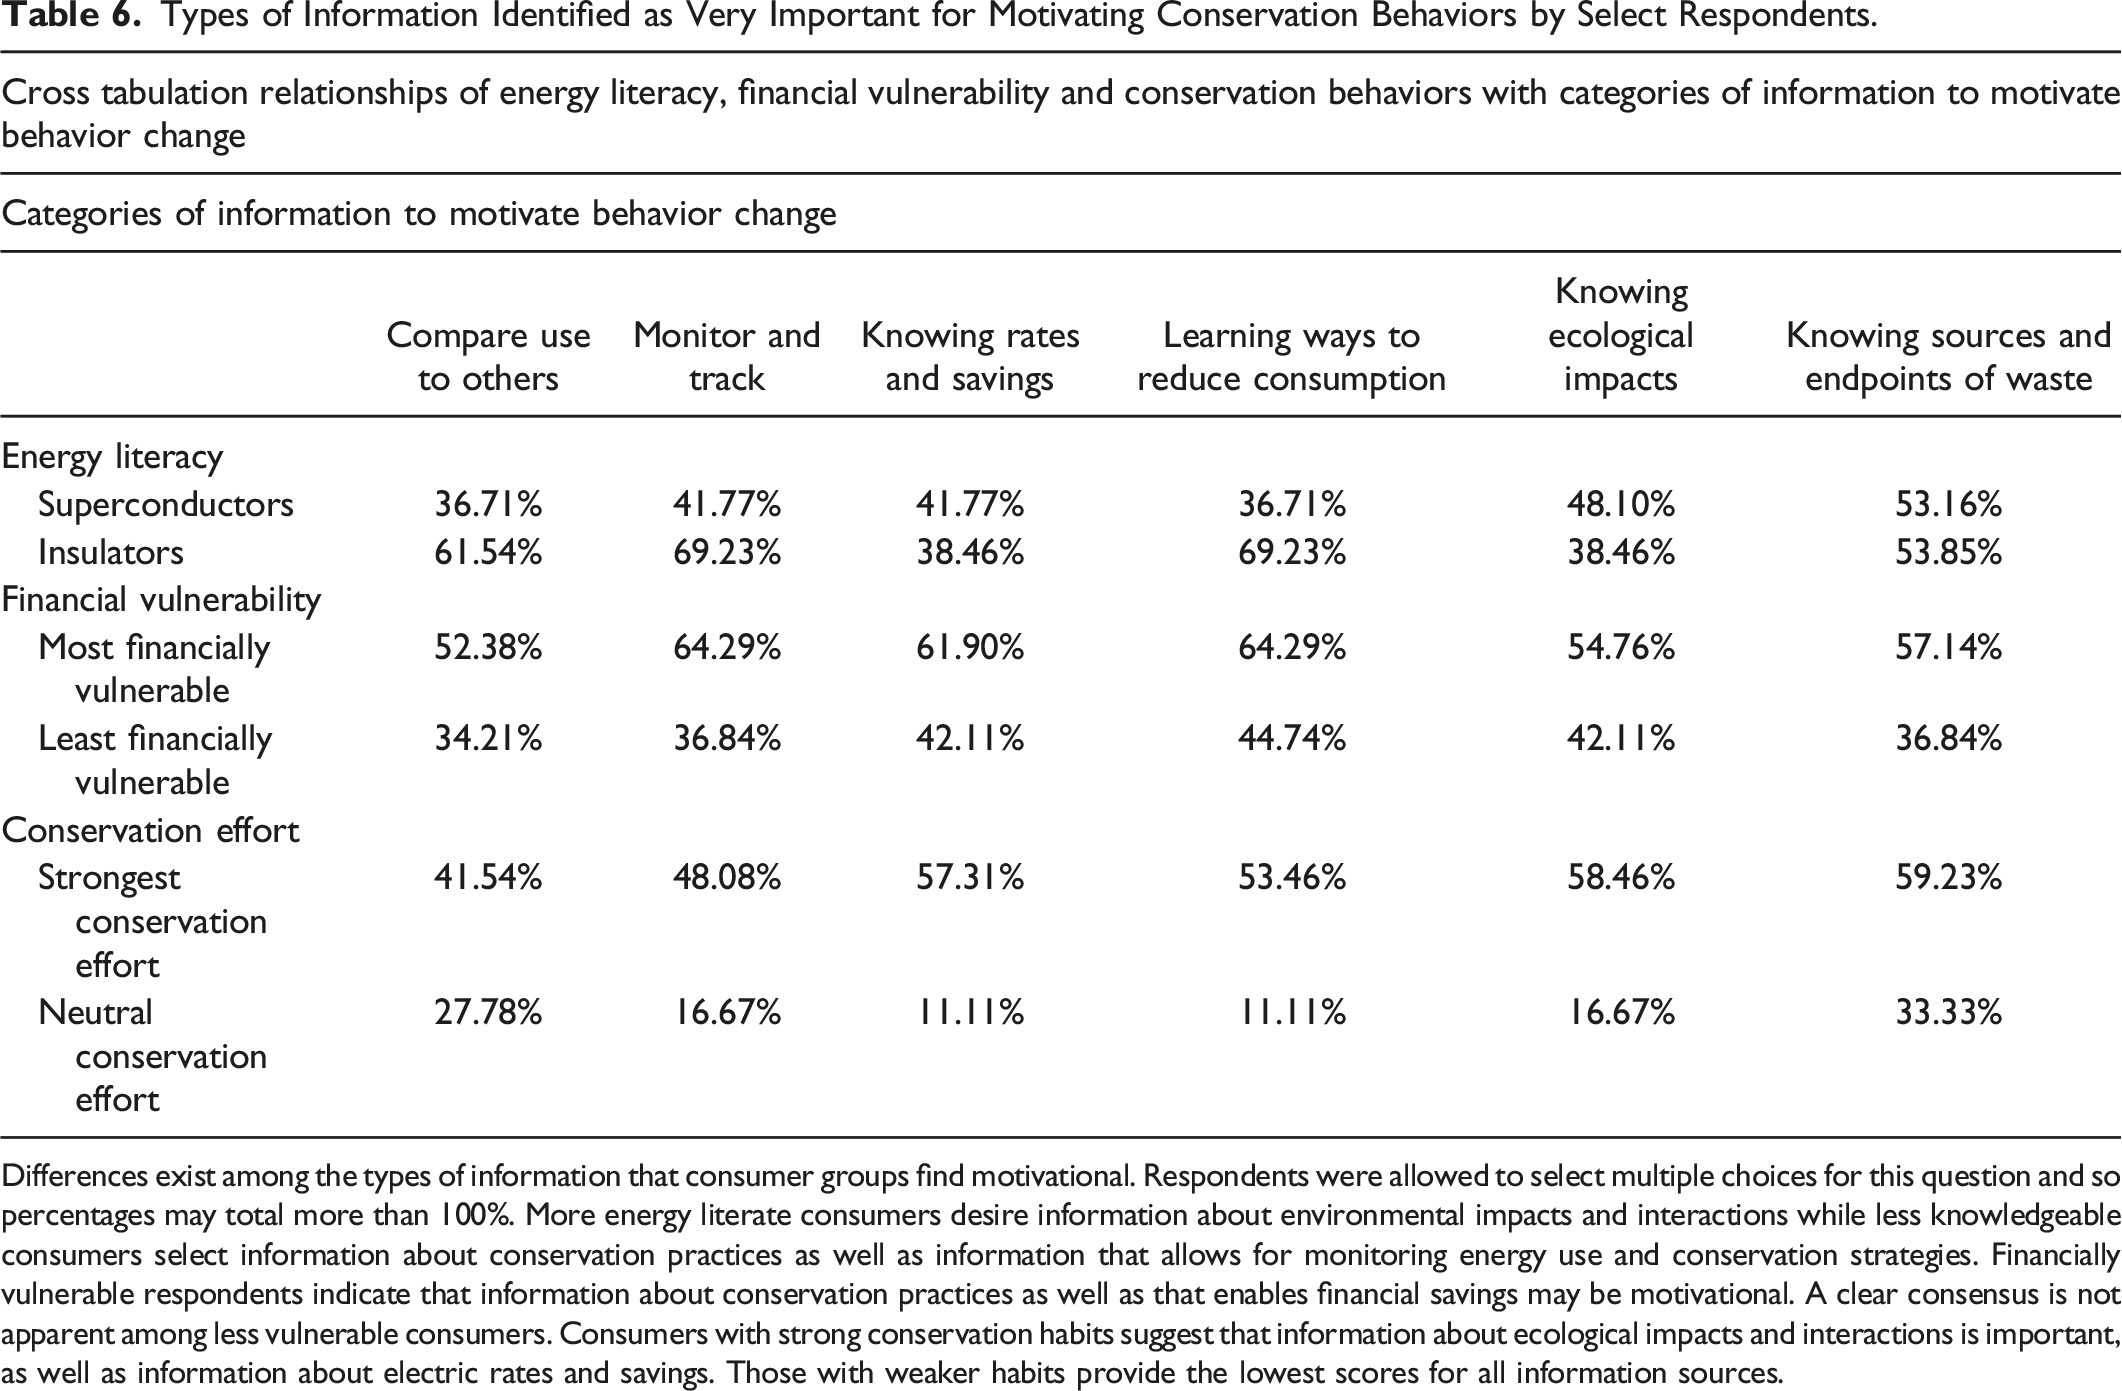
Differences exist among the types of information that consumer groups find motivational. Respondents were allowed to select multiple choices for this question and so percentages may total more than 100%. More energy literate consumers desire information about environmental impacts and interactions while less knowledgeable consumers select information about conservation practices as well as information that allows for monitoring energy use and conservation strategies. Financially vulnerable respondents indicate that information about conservation practices as well as that enables financial savings may be motivational. A clear consensus is not apparent among less vulnerable consumers. Consumers with strong conservation habits suggest that information about ecological impacts and interactions is important, as well as information about electric rates and savings. Those with weaker habits provide the lowest scores for all information sources.
Among Superconductors, those with the highest levels of energy literacy, the category of information most frequently identified as very important for motivating behavior change is knowing the sources and endpoints of utility resources. This category of information is identified as very important by 53.16% of Superconductors. Among Insulators, those respondents with the lowest energy literacy scores, learning ways to reduce consumption as well as being able to monitor and track consumption habits are most frequently selected as very important. These categories of information are selected as very important by 69.23% of Insulators.
The most financially vulnerable respondents identify learning ways to reduce consumption, monitor and track improvement over time, and information about rates and savings as especially important. 64.29% of the most financially vulnerable respondents indicate learning ways to reduce consumption and tracking improvement as very important. 61.90% of the most financially vulnerable respondents identify information about utility rates and savings as very important. The most financially secure respondents identified all categories of information as less important than their financially vulnerable counterparts. Among financially secure consumers, learning ways to reduce consumption, ecological impacts, and information about rates and savings were selected as very important at rates of 44.74%, 42.11% and 42.11%, respectively.
Among respondents that report the strongest efforts at conservation, knowing the sources and endpoints of utility resources, ecological impacts, and rates and savings were most frequently identified as very important by 59.23%, 58.46% and 57.31% of respondents, respectively. Among respondents reporting neutral conservation behaviors (in this case, the weakest level consistently reported), knowing the sources and endpoints of utility resources and being able to compare consumption patterns to other consumers were indicated as very important by 33.33% and 27.78% of respondents, respectively.
Broadly speaking, these data demonstrate that consumers find a variety of information important to forming conservation habits. Furthermore, there appear to be differences in the types of information valued by various user groups. Those with higher levels of energy literacy find ecological information compelling, while those with lower levels of energy literacy find information about Plattsburgh’s energy system and conservation strategies helpful. Financially vulnerable consumers find conservation strategies compelling, as well as monitoring data and information about rates and savings. This contrasts with more financially secure consumers who, generally speaking, place less importance on the motivating power of information. Consumers that report strong conservation habits find ecological information motivational, while those with weaker conservation habits suggest that information holds little importance in promoting behavior change.
Research Question 3. How Do Energy Literacy, Financial Vulnerability and Conservation Habits Influence PMLD Account Holders’ Preferences for Conservation-Based Policy Interventions?
The survey inquired about PMLD customers’ attitudes toward two policy proposals designed to encourage conservation of utility resources. The survey explored attitudes towards educational programs and pricing mechanisms. Generally speaking, educational programs use the power of knowledge to compel behavior change by providing stakeholders with information designed to convince them of the importance of conservation as well as strategies for implementing conservation actions. Price-based policies rely on market principles, including price signals, to encourage action. Both proposals encourage demand-side (as opposed to supply-side) conservation through voluntary action.
Figure 10 shows that survey respondents report more support for educational programming than price-based initiatives, though opposition to the proposals runs high. 8.95% of respondents indicate strong agreement with the statement “PMLD should develop education and incentive-based programs to encourage conservation, even if it means a slight increase to my bill.” 26.86% of respondents agree with this statement. In aggregate, 35.81% support the education-based proposal. 23.37% of respondents disagree with the educational approach and 12.75% strongly disagree. In sum, 36.12% do not support educational programming as a route to enhance conservation. 28.07% record a neutral response to this policy intervention. Respondents’ support for two conservation-based policy interventions.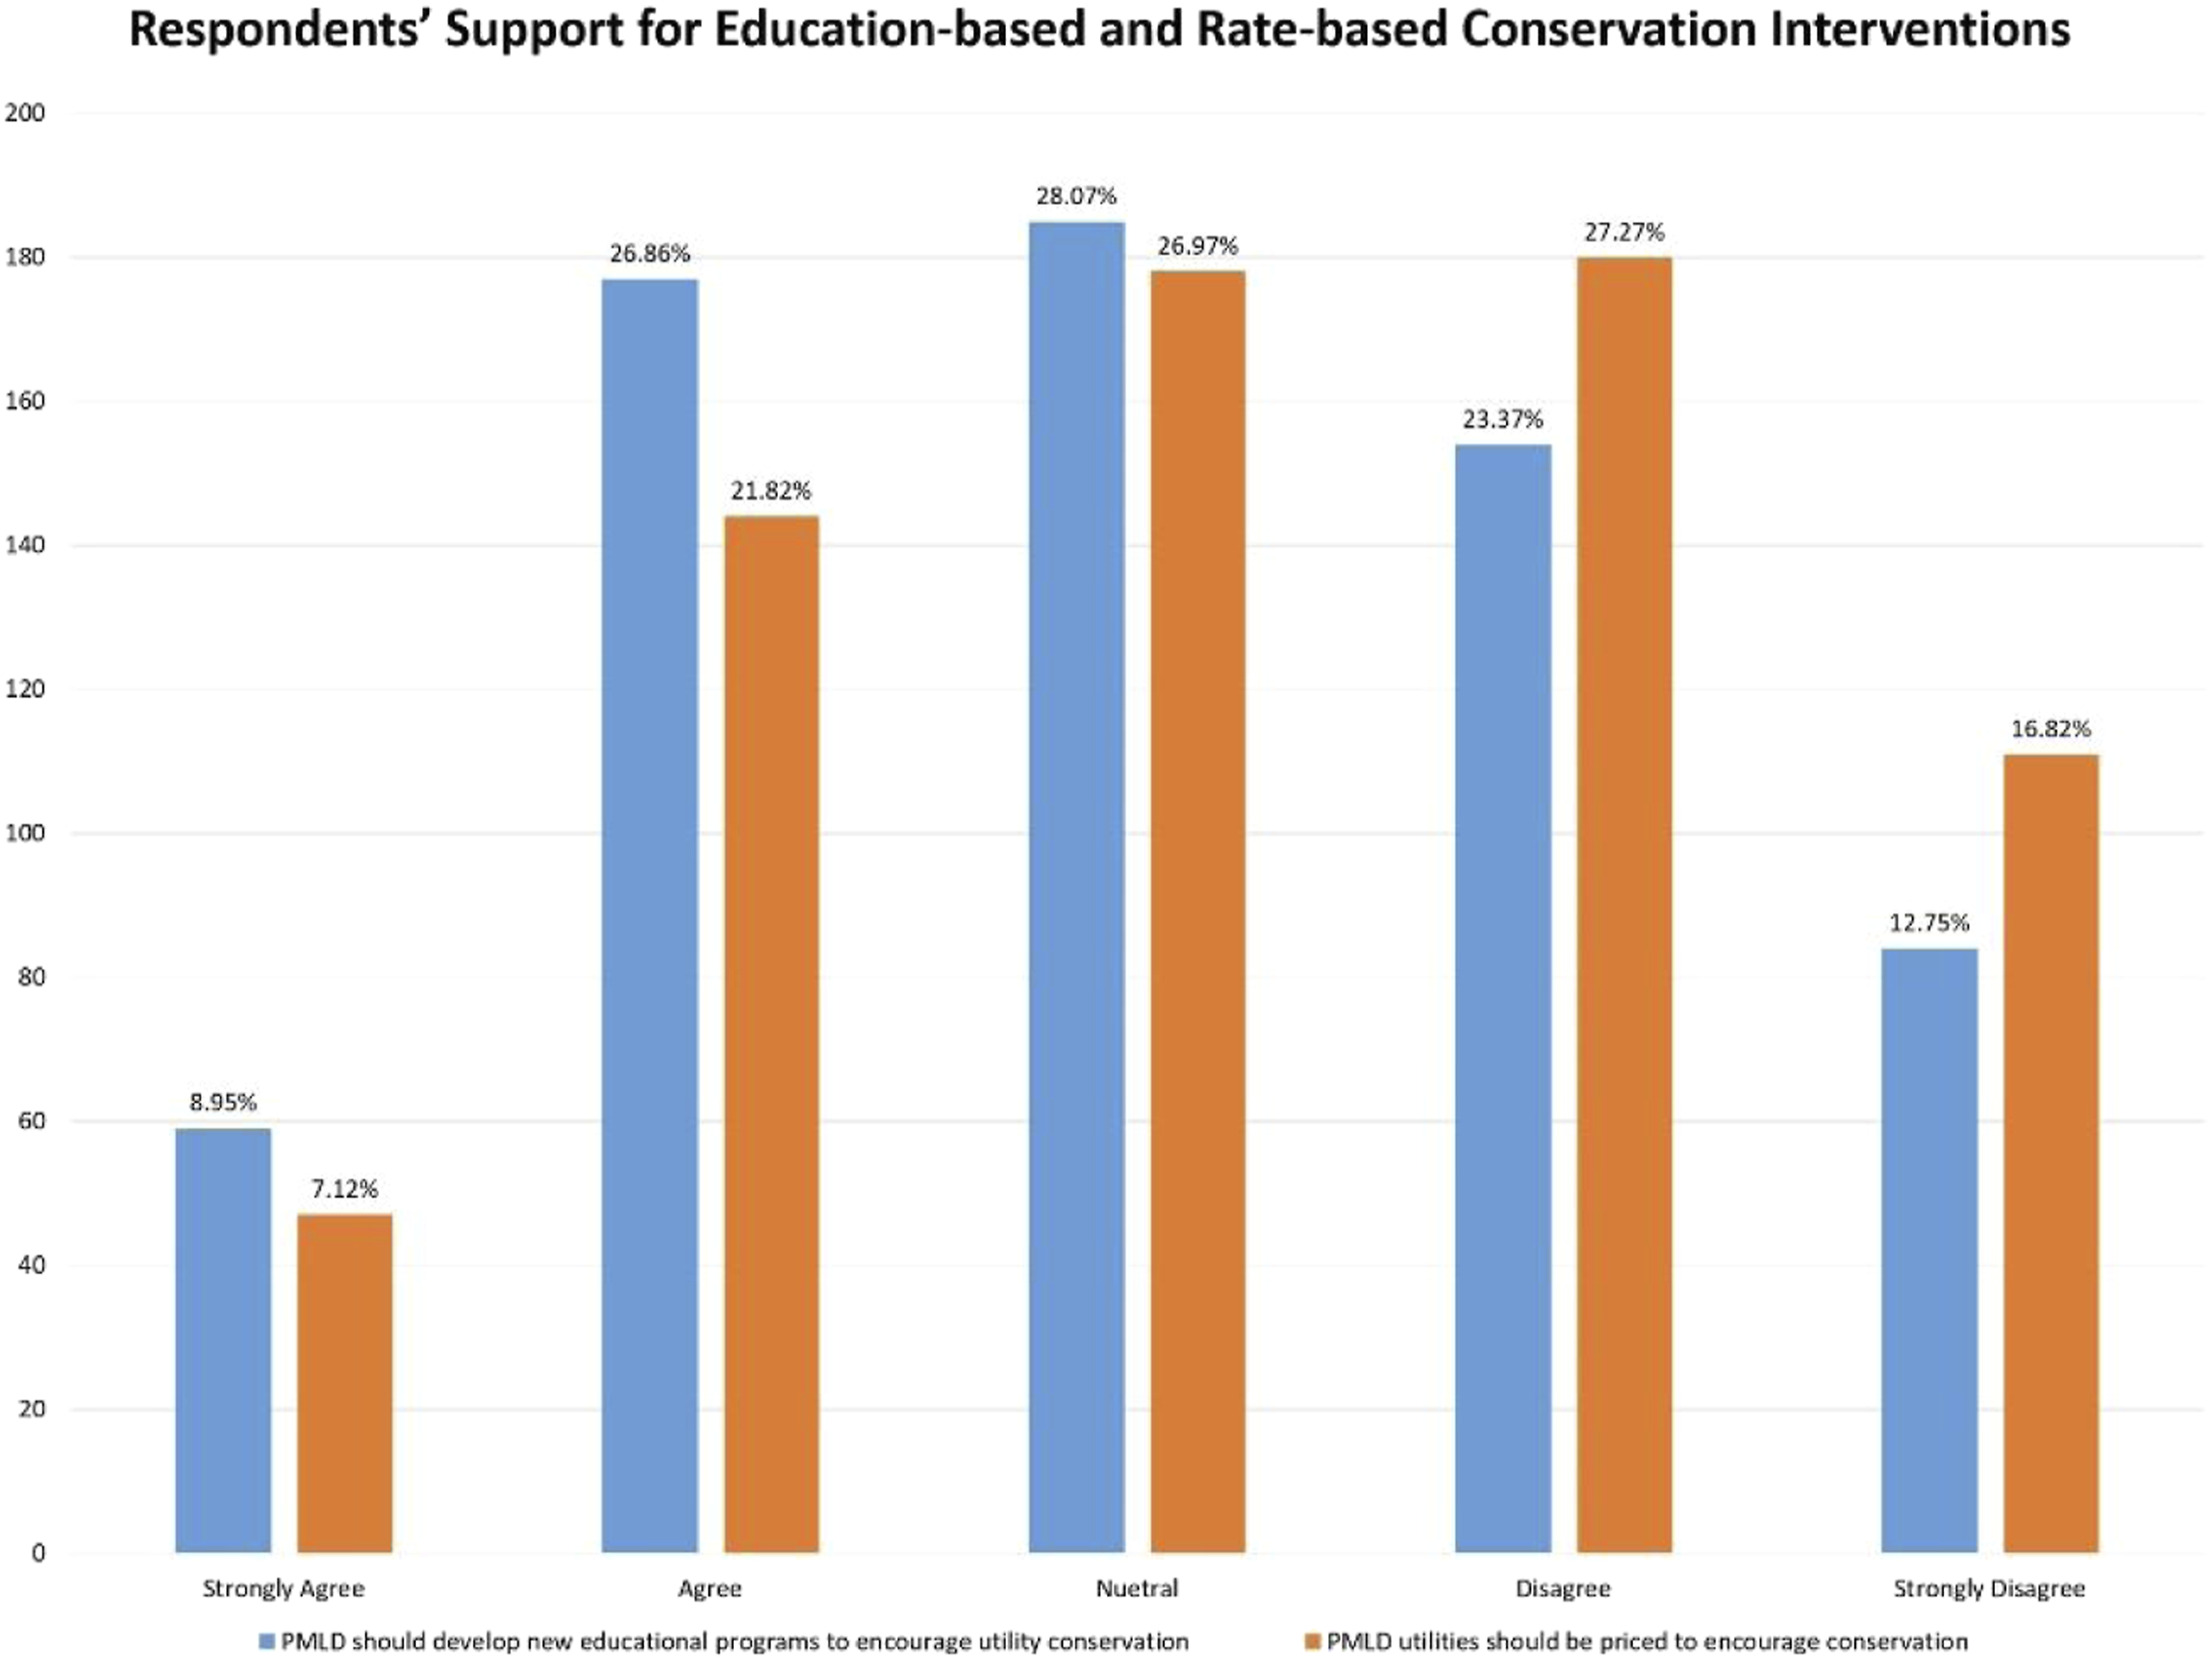
Support is lower for the price-based policy. 7.12% strongly agree, and 21.82% agree, with the statement “PMLD utility rates should be priced to encourage conservation, even if it means a slight increase to my bill.” In total, 28.94% of respondents indicate support for the proposal. On the other hand, 16.82% of respondents strongly disagree with the statement while 27.27% disagree. In aggregate, 44.09% of respondents record disagreement with this approach. 26.97% report neutral attitudes to price-based conservation policies.
Cross Tabulation of Energy Literacy on Support for Education and Price-based Policy Intervention.
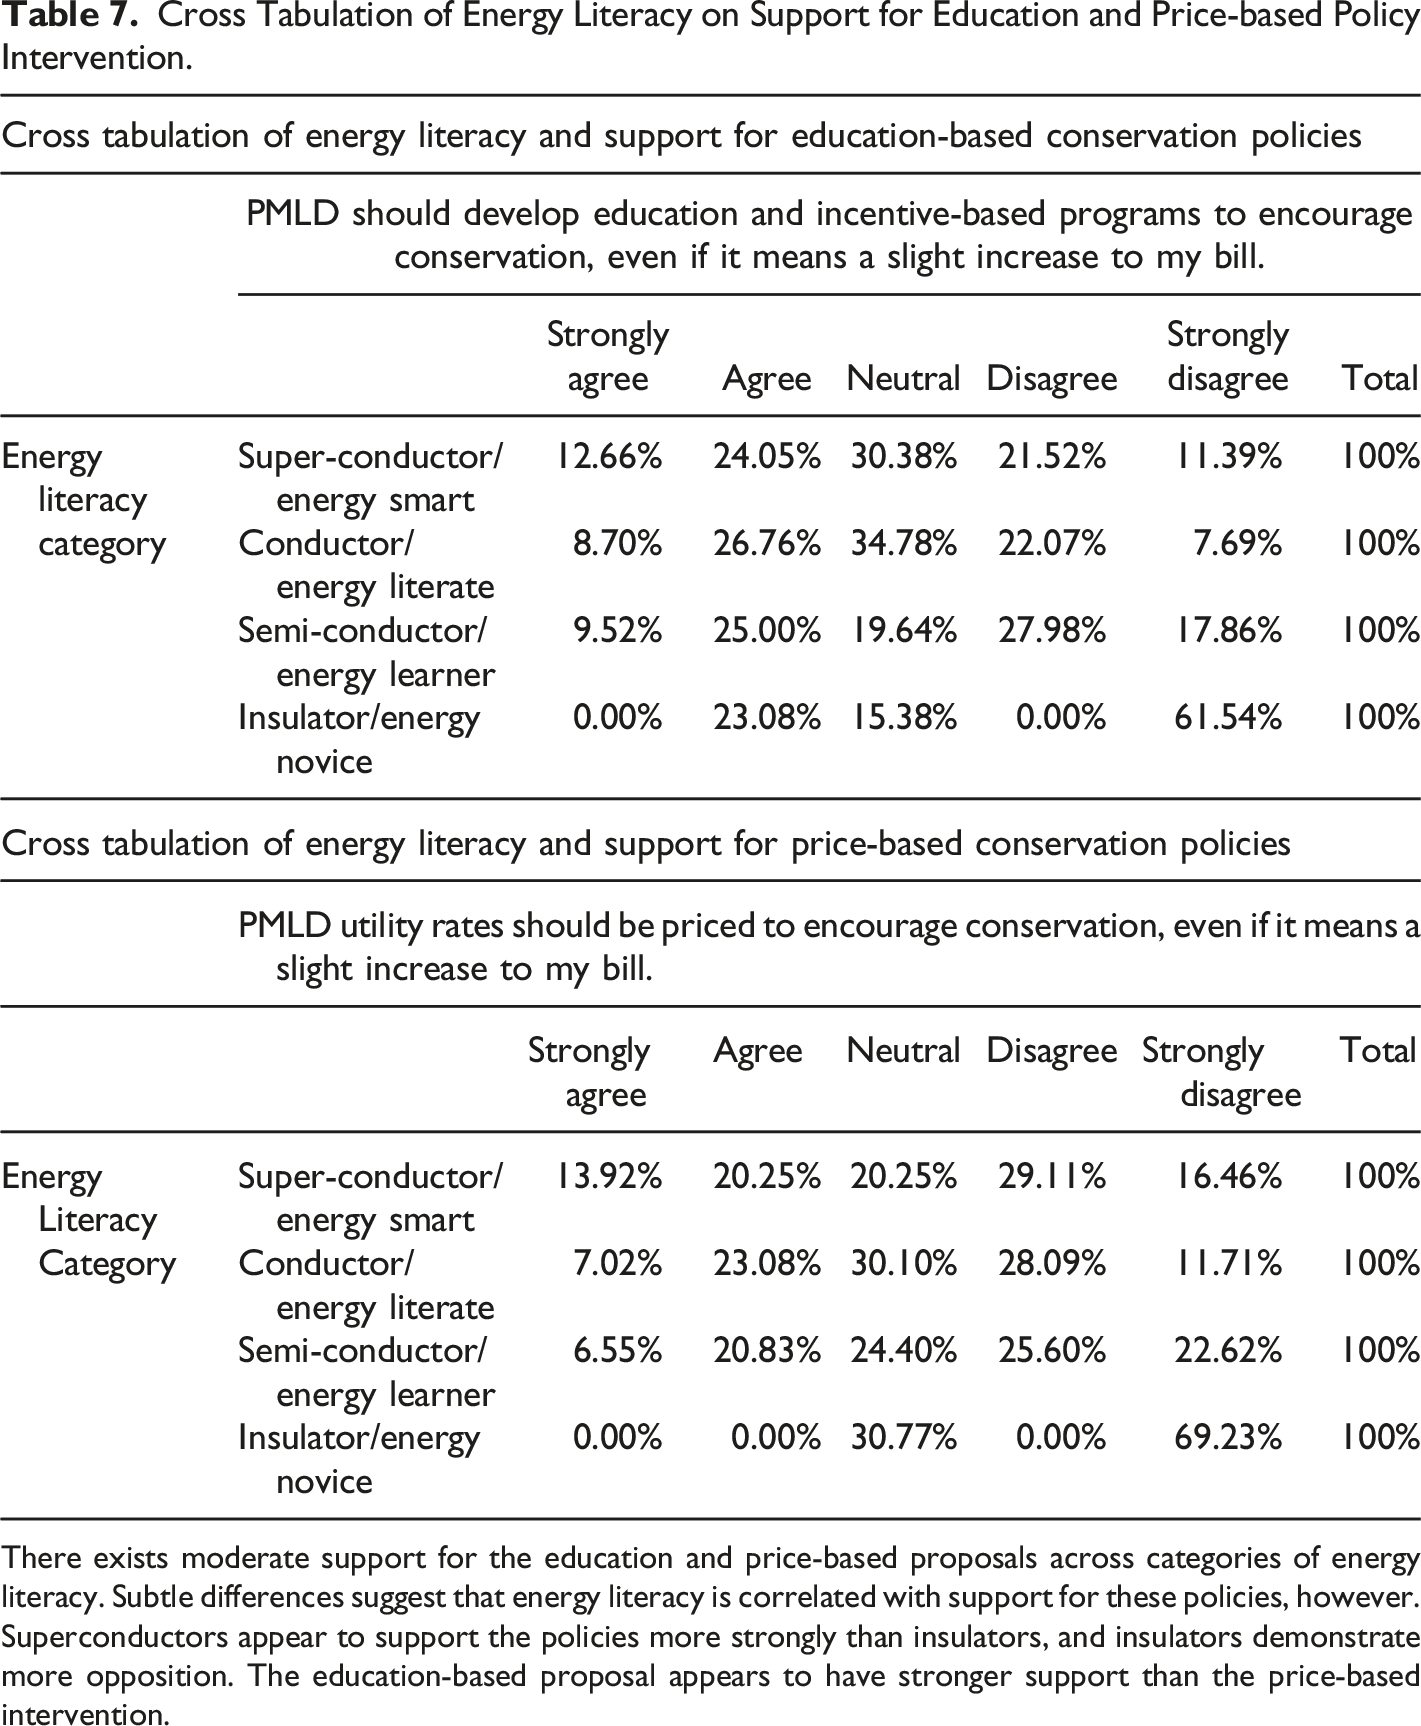
There exists moderate support for the education and price-based proposals across categories of energy literacy. Subtle differences suggest that energy literacy is correlated with support for these policies, however. Superconductors appear to support the policies more strongly than insulators, and insulators demonstrate more opposition. The education-based proposal appears to have stronger support than the price-based intervention.
Generally, support for education-based programming appears to have moderate support among the most energy literate respondents and lesser support among those with lower levels of energy literacy. Opposition to education-based programming is moderate among those with higher levels of energy literacy, and very high among those with less awareness.
There exists even less support for the price-based initiative among Superconductors and Insulators. 13.92% of Superconductors indicate strong agreement with the price-based proposal while 20.25% agree. In sum, 34.17% of Superconductors support the price-based initiative. 29.11% of Superconductors disagree with the market-based approach to conservation, and 16.46% strongly disagree with this policy. In sum, 45.57% of Superconductors do not support the price-based intervention. This trend continues among Insulators. There is no support (0.00% strongly agree or agree) for the price-based proposal among Insulators while 69.23% of Insulators strongly disagree with this approach (0.00% disagree). In conclusion, there exists moderate support for the price-based intervention among the most energy literate respondents. However, there exists a higher level of opposition among Superconductors and a very high level of opposition among the least energy literate respondents.
Cross Tabulation of Conservation Effort on Support for Education and Price-based Policy Intervention.
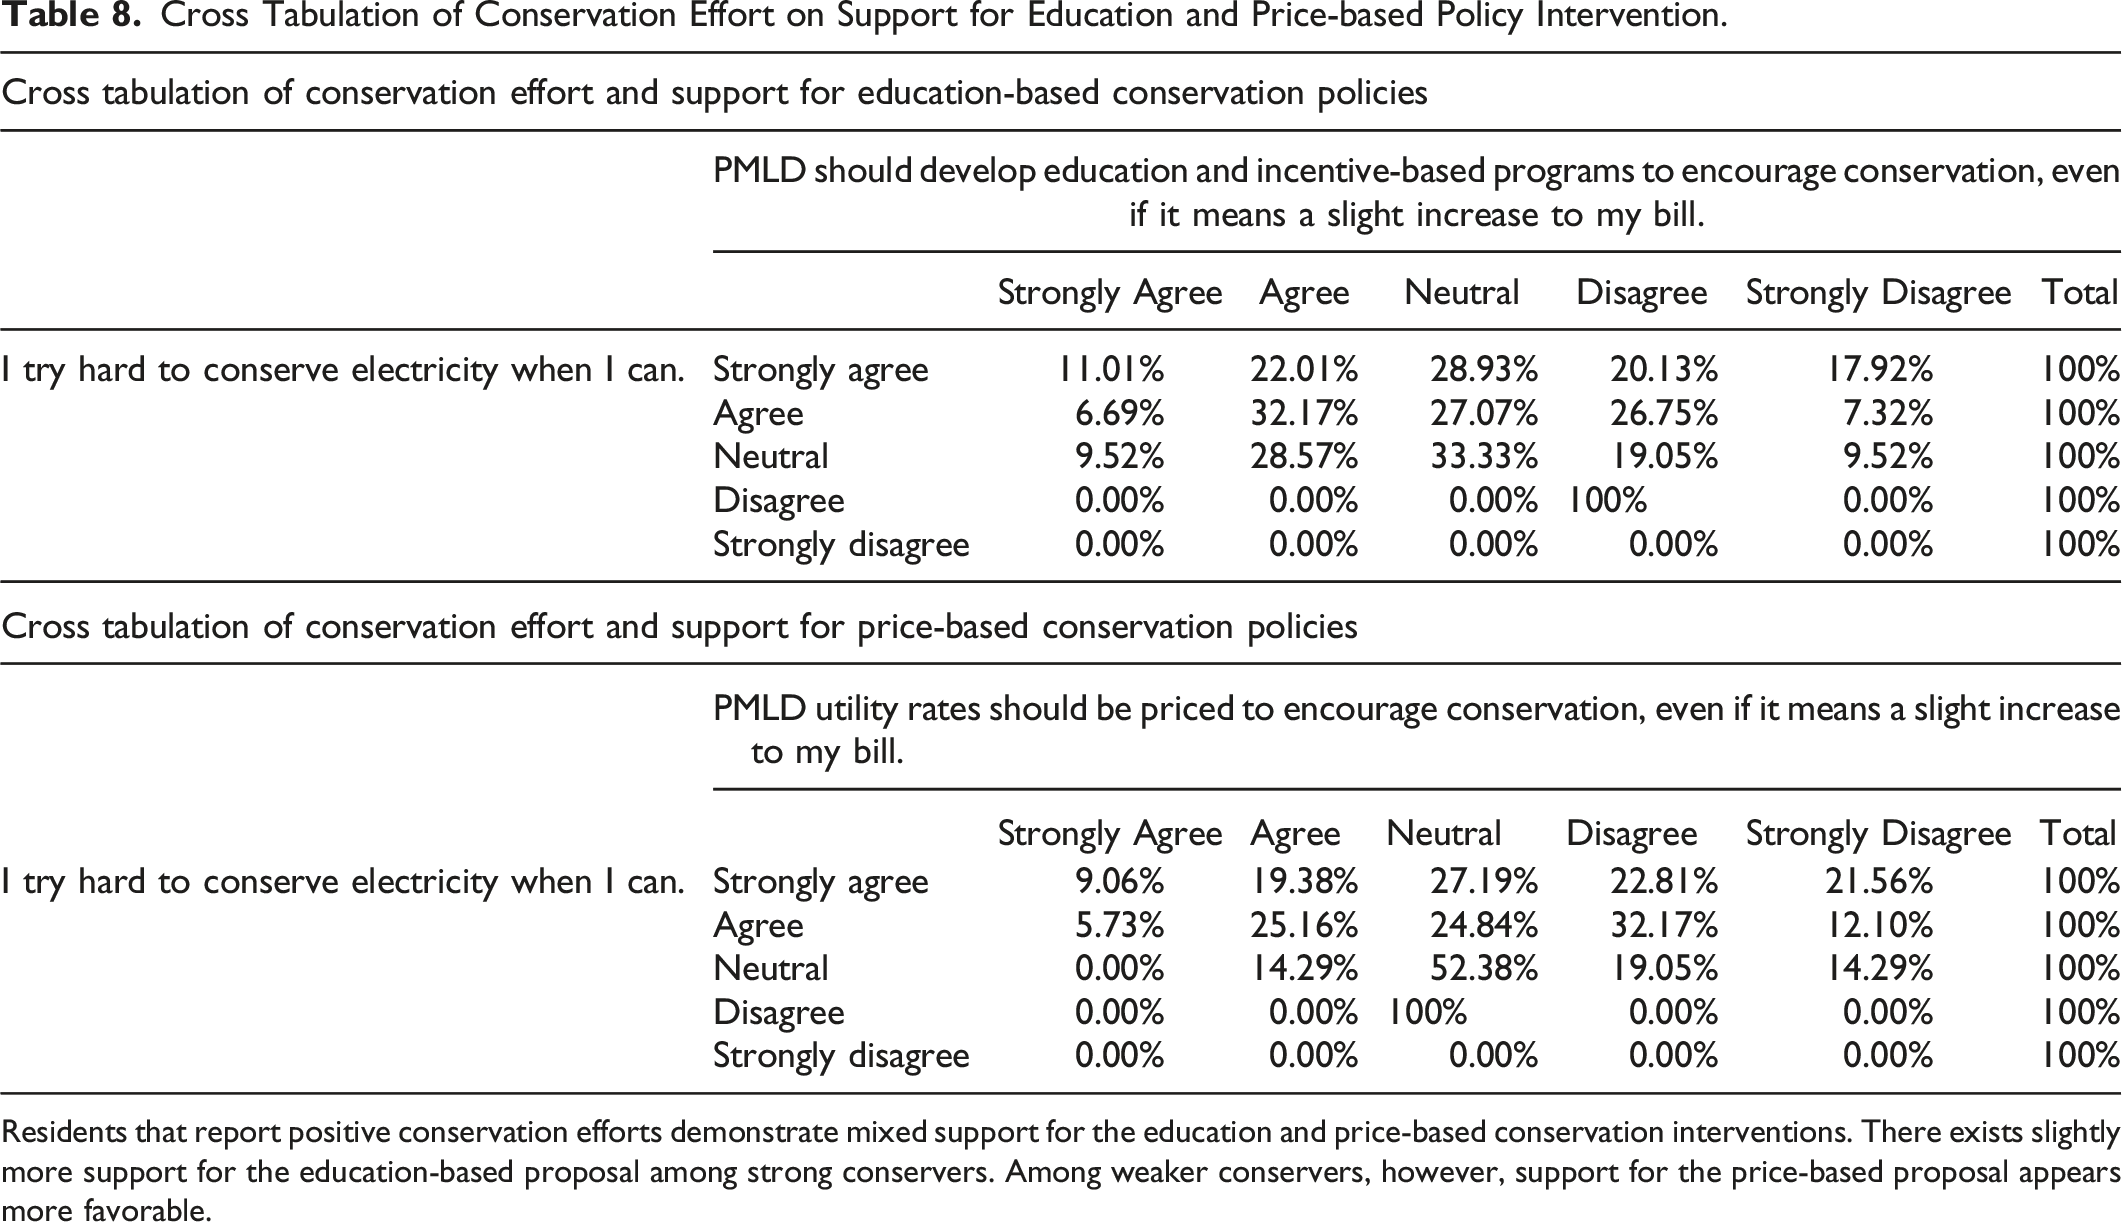
Residents that report positive conservation efforts demonstrate mixed support for the education and price-based conservation interventions. There exists slightly more support for the education-based proposal among strong conservers. Among weaker conservers, however, support for the price-based proposal appears more favorable.
Strong energy conservers show less support for the price-based policy intervention (Table 8). Of those that report the strongest conservation efforts, 9.05% show strong support for a market-based approach to conservation. 19.38% of those with strong conservation habits offer moderate support for the price-based proposal. In aggregate, 28.43% of strong energy conservers show support for market-based programs as a way to encourage conservation. This contrasts with 22.81% of strong conservers that show moderate opposition to price-based policies for conservation, and 21.56% that show strong opposition. In sum, 44.37% of strong energy conservers oppose the price-based program. 100% of respondents that report weak conservation habits report a neutral attitude to the price-based approach. Opposition to the price-based intervention is moderate among strong energy conservers and high among weak conservers. Support for the price-based intervention is less than moderate among strong conservers.
Cross Tabulation of Financial Vulnerability on Support for Price-based Policy Intervention.

Data evidence an inverse relationship among financial vulnerability and support for the education and price-based energy conservation proposals. As financial vulnerability becomes more sever, respondents demonstrate less support for the conservation interventions. Financially vulnerable respondents show the least support, and strongest opposition, to the price-based intervention. Financially secure respondents, on the other hand, demonstrate stronger support for conservation policies.
When it comes to the price-based approach, 11.11% of the most financially vulnerable respondents strongly agree with the proposal while 9.26% agree. In total, 20.37% of the most financially vulnerable respondents support the price-based program. Of this same group of financially vulnerable respondents, 22.81% and 21.56% disagree and strongly disagree with the price-based policy, respectively. In total, 44.37% of financially vulnerable respondents disagree with the price-based proposal. Of the most financially secure respondents, 17.78% strongly agree with the price-based program while 20.00% agree. In aggregate 37.78% of financially secure respondents support the price-based proposal. 13.33% of the most secure respondents disagree with the price-based initiative while 22.22% strongly disagree. In total, 35.55% of financially secure respondents oppose the market-based approach to conservation.
Support and Opposition for Conservation Interventions Among Select Stakeholders.
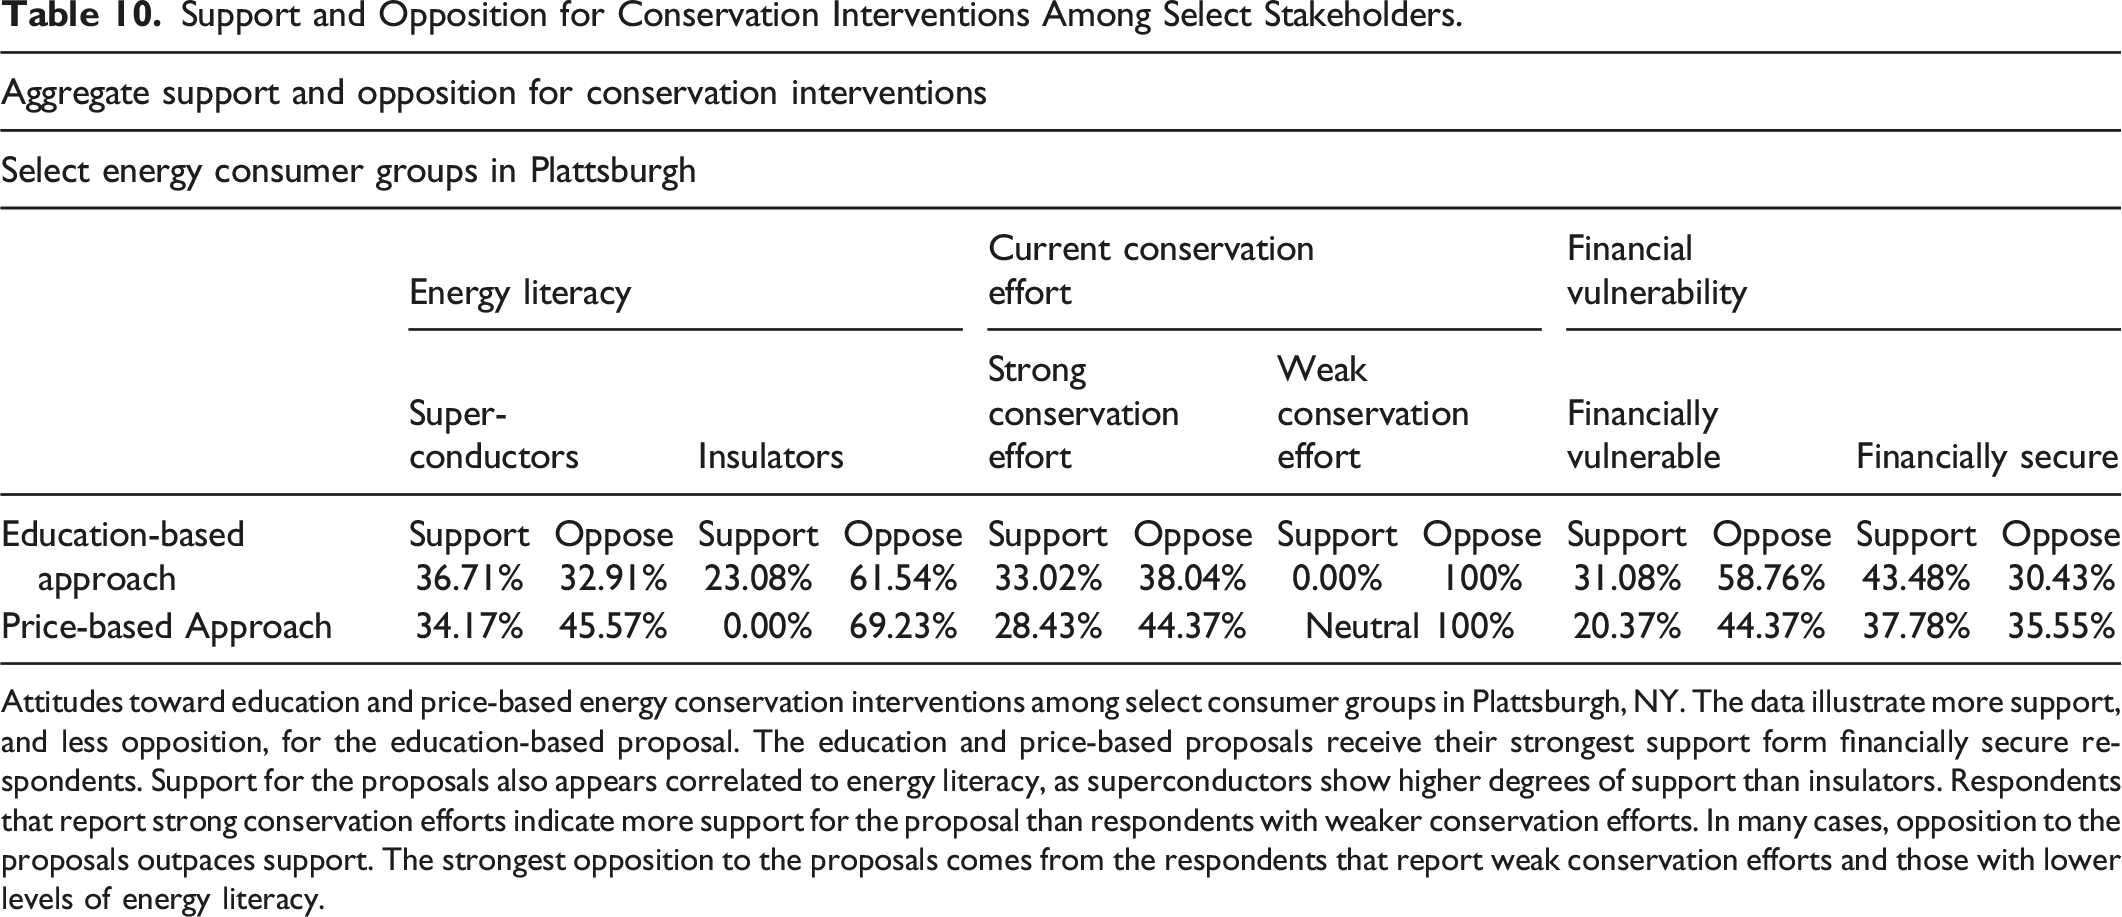
Attitudes toward education and price-based energy conservation interventions among select consumer groups in Plattsburgh, NY. The data illustrate more support, and less opposition, for the education-based proposal. The education and price-based proposals receive their strongest support form financially secure respondents. Support for the proposals also appears correlated to energy literacy, as superconductors show higher degrees of support than insulators. Respondents that report strong conservation efforts indicate more support for the proposal than respondents with weaker conservation efforts. In many cases, opposition to the proposals outpaces support. The strongest opposition to the proposals comes from the respondents that report weak conservation efforts and those with lower levels of energy literacy.
Table 10 shows that support for the education and price-based interventions are mixed, though generally respondents show more support for the education proposal. Opposition to the interventions varies among the consumer groups and in most cases outweighs support. Telltale signs of income inequality are visible in the data. Only the education-based initiative receives support above 40.00%, and only among the most financially secure respondents. Furthermore, financially secure respondents oppose the price-based intervention at the lowest rate of any proposal.
Interestingly, financially vulnerable respondents show some support for both policy initiatives. The survey questions indicate that each proposal may bring small increases to utility bills, placing vulnerable residents under more financial pressure. The fact that some of these electricity consumers are willing to accept this added expense is noteworthy. Also deserving of attention in Table 10 is the fact that the price-based proposal receives less opposition than the education-based proposal among financially vulnerable respondents. Additionally, while opposition to the price-based proposal runs high among vulnerable respondents, it is not the most strongly opposed proposal among the consumer groups presented.
When looking at data concerning conservation efforts, the strongest opposition to either policy proposal is found among weak energy conservers who oppose the education-based initiative at a rate of 100%. Among strong energy conservers, more respondents oppose the initiatives than support them.
Differences in support for the interventions are visible among respondents with varying levels of energy literacy. Superconductors show moderate support for both proposals. Insulators, on the other hand, show weak support. Furthermore, opposition to both proposals runs high among respondents in the Insulator category of energy literacy. Superconductors, on the other hand, show weak opposition to the education initiative and moderate opposition to the price-based proposal.
Discussion
The first theoretical proposition of this study suggests that consumers with higher levels of energy literacy and/or experiencing financial vulnerability will report stronger conservation behaviors. Yet, results reveal that the majority of respondents report strong conservation efforts, with little variation relative to energy literacy. These findings challenge the proposition. On the point of financial vulnerability, the results show that conservation efforts are stronger among less financially secure respondents, though the difference between these respondents and those in more secure positions is slight. On this point, the theoretical proposition is challenged because conservation appears strong among both secure and vulnerable groups. These finding are supported by rational choice theory (Elster, 1986; Homans, 1961; Wilson & Dowlatabadi, 2007), as it is applied to high rate environments (Huebner et al., 2013; Leighty & Meier, 2011; Riess & White, 2008). Energy consumers in Plattsburgh, particularly those that report financial insecurity and for whom utility costs represent a financial burden, report more strict conservation habits. For these consumers, Plattsburgh’s low rates are still a significant stressor. Simultaneously, electric customers that indicate more security also indicate strong conservation habits. These findings are also supported by Diekmann and Preisendorfer (2003) and Zintl (1989), who apply rational choice theory in low rate contexts. For financially secure consumers, it appears that other factors in addition to the desire to maximize utility may contribute to a conservation mindset. This study did not reveal these additional factors.
The second proposition put forth in the study posits that improving energy literacy will enhance conservation efforts, and that respondents are likely to find information about energy rates and savings, and specific conservation actions, more compelling than information about energy systems and environmental impacts or interactions. The results of the survey indicate a variety of information that could be helpful in improving conservation efforts, and differences occur along lines of energy literacy and financial vulnerability. These results do not provide clarity on the second theoretical proposition. The data suggests that information designed to motivate conservation among consumers should be tailored to target audiences. For example, PMLD customers’ monthly bill includes a table that allows consumers to see their energy usage from the past 12 months and observe trends in consumption (Figure 6). The ability to monitor and track consumption was identified as important information for motivating conservation by some respondents, but not others. The monitoring details currently provided on PMLD’s bills could be supplemented with additional information to reach and compel conservation among a wider set of consumers. Providing clear explanations of billing rates, charges and abbreviations on PMLD’s utility bills may raise energy literacy, which evidence from this study suggests has a large impact on conservation. Still other customers identify information about the sources and endpoints of utility waste as important.
The final theoretical proposition states that respondents will demonstrate little support for top-down policies intended to enhance energy conservation. Additionally, this proposition proposes that support for policy proposals will vary according to energy literacy, financial vulnerability, and respondents’ current efforts at conservation. The survey results support this proposition. Support for the education and price-based proposals is not strong and variation exists among select consumer groups. Support increases directly with energy literacy, current conservation efforts and financial security. From a rational choice perspective, it is not surprising that support for the two policy interventions was limited. The survey indicated that the policies could result in rate increases, automatically diminishing utility to consumers. Rate-neutral conservation policies may exist and their acceptability should be studied. Furthermore, in Plattsburgh’s low rate environment many consumers may participate in conservation for non-financial purposes.
Cumulatively, these results show that demand-side conservation may be near its peak in Plattsburgh. Consumers report strong conservation efforts currently, and there exists little support (and stronger opposition) to conservation policies. This may leave little room for improving conservation among consumers. Supply-side efforts, alternatively, may offer more meaningful results. Plattsburgh’s current energy system is nearly reliant on a single source of hydropower. When alternative sources of energy are required, it comes at a price premium. Diversifying Plattsburgh’s energy mix may enhance local resilience and reduce consumer rates when hydropower is insufficient.
Emergent Challenges to Energy Planning in Plattsburgh
Plattsburgh faces four emergent challenges relative to energy. First, Plattsburgh’s energy landscape has changed a great deal since the PPP was established in 1957. Plattsburgh, at that time, housed a United States Air Force Base. The base’s closure in 1995 dramatically altered the socio-economics of the community and the city still struggles with these changes. Presently, Plattsburgh’s economic development strategy seeks to bring exogenous industrial, commercial and residential development to the city. Low-cost power could play a role in this effort. The gap between current energy consumption and Plattsburgh’s limit on preference power creates a window of opportunity to draw high energy consuming, large employers to the community. Aggressive conservation measures or localized energy generation may widen this opening. Moving in this direction would also link Plattsburgh’s economic development strategy with its utility resources, as infrastructure ecology (Pandit et al., 2015) suggests. Yet, Plattsburgh is struggling to operationalize this strategy to of economic growth.
Second, while Plattsburgh’s average daily energy consumption is below its PPP cap and the city only surpasses its allotment during seasonal cold snaps, other communities with membership in the PPP exceed their limits on a daily basis. In these communities the PPP subsidizes a portion of consumers’ electric bills, but it does not cover the full volume of energy consumed as it does in Plattsburgh. These communities must buy daily doses of power at higher market rates on a year-round basis. The PPP’s power allocations are renegotiated periodically, and it is likely that other communities in the program will take a hard look at reducing Plattsburgh’s allotment in the future to spread the program’s benefits more equitably across participating jurisdictions. Strong conservation actions by PMLD will show responsible stewardship of the PPP asset and increase Plattsburgh’s negotiating power. These same conservation actions will also lessen the impact of a reduction to the cap if it occurs.
Third, cryptocurrency mining operations established a presence in Plattsburgh in 2017–2018, and in combination with an extremely cold winter drove the community into the higher rate bracket for an extended period. Cryptocurrency firms gamble on trends in digital currency (Farell, 2015) and require large amounts of electricity to operate computer servers (Gallersdorfer et al., 2020). Yet, these enterprises offer few of the benefits that accompany traditional commercial or industrial development. Server farms provide few employment opportunities and export nearly all of their earnings outside of the community. Citizens in Plattsburgh were angry about PMLD’s lack of foresight on this issue (Delisle, 2019). The City responded by placing a moratorium on future cryptocurrency operations, and eventually developed a mechanism for classifying server-farms into an industrial electric rate classification, which raised their rates. It is likely that similar high energy consuming firms will target Plattsburgh in the future, and PMLD should be proactive in determining its response. PMLD could, for example, establish an employment-based rate structure for high-energy firms, which would offer gradations of energy rates based on the numbers of employees on payroll.
Fourth, at the present time, PMLD does not allow consumers to participate in net-metering or distribute locally generated power on its grid. As a result, distributed community renewable energy networks and microgrids are all but prohibited. Yet, these innovations are important steps in increasing community resilience and restricting them may leave the community unprepared for energy system disruptions such as severe weather events. Supply-side energy planning, including energy generation, offers an opening to build resilience. While the inexpensive electric rates of the PPP delay consumers’ returns on investments in renewable energy technologies today, the rate of return is likely to accelerate as the costs of these technologies decrease (Heche, 2017). PMLD consumers may want to participate in this currently restricted market.
Plattsburgh must evaluate the PPP in light of emergent challenges. While the PPP has been a positive force in Plattsburgh’s historical development, steps should be taken to reduce dependency on the program to enhance community resilience. The application of Pandit’s principles of infrastructure ecology may help in this regard. When examined through the lens of common pool resources, the fact that consumers are already engaging in strong conservation efforts coupled with the lack of support for top-down conservation policies, hints that demand-side conservation may be maximizing its potential in Plattsburgh. Close consideration of system dynamics may reveal that supply-side measures, including net-metering, distributed renewable networks and microgrids offer new pathways for achieving energy security. However, community energy generation is restricted by PMLD. At some point, Plattsburgh will need to determine whether the PPP is worth the cost of membership. The results of this study also reveal that stakeholder and user-focused programming may enhance conservation and allow Plattsburgh to take an energy-focused orientation to economic development. Plattsburgh has shown reluctance to invest in its energy system, and the lens of infrastructure ecology may provide a way around some obstacles.
Conclusions
This case study draws on Plattsburgh’s energy system as an extreme case in order to reveal novel insights about the dynamics of energy consumers’ conservation habits and attitudes within the context of low utility billing rates. Scholarship on these topics more commonly explores consumer behaviors and preferences in high-rate environments. When it comes to energy rates, however, Plattsburgh presents an extremely low-rate case. Data from this case study reinforces Seawright’s claim that extreme cases hold a unique ability to break new ground and challenge conventional knowledge. It is likely that as renewable energy generation spreads, electricity rates will drop because they will no longer be driven by the supply and demand dynamics of nonrenewable resources. Consequently, the price signals that once motivated conservation are changing, yet the need for conservation still exists. The dynamics observed in low-rate communities like Plattsburgh may have something to teach others as the shift to renewable energy continues. Some of these lessons are: • Price signals are not the only, or necessarily most effective, ways of encouraging energy conservation; • Energy users value conservation for a variety of reasons, and appealing to non-economic values may provide another route for encouraging conservation; • For low-income energy consumers, even low rates may be burdensome; • Raising energy literacy is an essential component of energy conservation programming; • Supply-side conservation and efficiency practices may offer windows of opportunity for reducing energy consumption.
Plattsburgh’s energy system and infrastructure hold several rare and interesting facets. For example, the municipality’s energy system represents a common pool resource. All consumers draw from the same limited pool of energy provided and capped by the PPP. Consequently, the conservation actions of individuals may be easily undone by a few large consumers. In the case of Plattsburgh, exceeding PMLD’s allotment of low-cost power pushes all consumers into a higher rate bracket. Infrastructure ecology provides a lens for exploring the environmental, social and economic relationships embedded in municipal infrastructure. From the systems perspective, this study reveals that demand-side conservation efforts by PMLD account holders runs high, and that further research into supply-side energy generation may reveal stronger avenues to reducing the unintended consequences of common pool dynamics and increasing resilience in the community. Additionally, further exploration of Plattsburgh’s infrastructure ecosystem should more strongly incorporate the community’s water and waste systems. Viewing utility systems as interconnected may reveal novel pathways for achieving resilience and sustainability goals.
Supplemental Material
Supplemental Material - The Impact of Extremely Low Electric Rates on Energy Conservation, Planning and Resilience: A Case Study of Plattsburgh, New York
Supplemental Material for The Impact of Extremely Low Electric Rates on Energy Conservation, Planning and Resilience: A Case Study of Plattsburgh, New York by Curt D. Gervich in Public Works Management & Policy
Footnotes
Declaration of Conflicting Interests
The author(s) declared no potential conflicts of interest with respect to the research, authorship, and/or publication of this article.
Funding
The author(s) received no financial support for the research, authorship, and/or publication of this article.
Supplemental Material
Supplemental material for this article is available online.
Author Biography
References
Supplementary Material
Please find the following supplemental material available below.
For Open Access articles published under a Creative Commons License, all supplemental material carries the same license as the article it is associated with.
For non-Open Access articles published, all supplemental material carries a non-exclusive license, and permission requests for re-use of supplemental material or any part of supplemental material shall be sent directly to the copyright owner as specified in the copyright notice associated with the article.